Embed Size (px)
Citation preview

Once you join the webinar, please...
© OMICRON
Page 1
a) Check if your PC speaker is on.
Check the volume;
b) Try to configure your Audio with
Computer Audio Settings…
© OMICRON Academy Page 1

How can you ask questions...?
To ask a Question... > in written format
© OMICRON
Page 2
All attendees will have their
voice inputs muted during the
session!!
© OMICRON Academy Page 2

Feedback and Questions
© OMICRON
Page 3
Please ask your questions in Q&A in the menu at the top of the screen. I will answer them after
my presentation or later by email.
During the sessions I will ask you questions. Please use the “Yes”
or “No” buttons.
© OMICRON Academy Page 3

PD Webinar series
Introduction to PD measurement and monitoring
October 7, 2021
PD measurement and localization of power transformers
October 21, 2021
PD measurement and localization of power cables
November 4, 2021
PD measurement and monitoring on rotating machines
November 7, 2021
© OMICRON
Page 4
© OMICRON Academy Page 4

Page 5
The content of this Fundamentals of PD course includes the necessary PD fundamentals, theory, practical
exercises and result assessment divided in single sections.
It is based on a collection of measurement experiences from the last few years, which have been gathered
through hundreds of PD measurements at various locations around the world.
At OMICRON, we believe that this comprehensive collection of knowledge will cover the basics of PD
diagnostics that today's test engineers require before addressing application-related PD measurements.
Please note the copyright clauses mentioned at the end of this presentation.
Introduction to PD measurement and monitoringFlorian Predl
© OMICRON
5
© OMICRON Academy
01-Introduction-Fundamentals-of-PD

Agenda
Overview and motivation
PD theory (basics)
PD types and associated PRPD
PD sensor types
IEC 60270 requirements
Charge calibration and measurement
Noise mitigation techniques
Periodic PD measurement and permanent monitoring
© OMICRON
Page 6
© OMICRON Academy Page 6

Various assets have to suffer a lot of periodic or continuous forces, such as thermal stress, electrical stress,
aging and mechanical stress (shortened by the abbreviation TEAM).
Thermal stress: The temperature rises in the case of overload. Many temperature shifts lead to
premature aging of the insulation such as delamination or cracking of the
insulation
Electrical stress: Besides nominal voltage the isolation is also stressed by over-voltage due to
electrical faults
Ambient stress: Includes moisture, aggressive and reactive chemicals (gas, acids) and foreign
particles (metal parts, ash, carbon, lubricants)
Mechanical stress: Vibration, mechanical forces and different thermal expansion
Page 7
Ageing of insulation
Overstress of insulation
Damage to the insulation of various assets due to a combination of stresses
Page 7
Thermal stress
• Highest and lowest temperature
• Increase of current through overloadT
Electrical stress
• Rated Voltage
• Over VoltageE
Ambient stress
• Moisture
• Aggressive and reactive chemicals
• Abrasive particles
A
Mechanical stress
• Vibration
• Mechanical forces
• Different thermal expansion
M
© OMICRON
© OMICRON Academy
01-Introduction-Fundamentals-of-PD

According to the IEC 60270 standard, partial discharges are “localized electrical discharges that only partially
bridge the insulation between conductors and which can or cannot occur adjacent to a conductor. Partial
discharges are in general a consequence of local electrical stress concentrations in the insulation or on the
surface of the insulation." PD can occur in gaseous, liquid and solid insulating mediums used in assets that are
subjected to high electrical fields. It can be initiated by voids, cracks, or inclusions within a solid dielectric, at
interfaces within solid or liquid dielectrics, in bubbles within liquid dielectrics, or along the boundary of different
insulation materials.
PD can cause progressive and irreversible damage to liquid and solid insulation systems. With time, PD activity
becomes more intense and dangerous. The process of deterioration can propagate and develop until the
insulation is unable to withstand the electrical stress, leading to a flashover.
Page 8
What is partial discharge?
Partial discharge (PD) is a localized dielectric breakdown of a small portion of a solid or liquid electrical insulation system under high voltage stress.
Definition from IEC 60270 specificationLocalized electrical discharge that only partially bridges the insulation between conductors and which can or cannot occur adjacent to a conductor.
Page 8
© OMICRON
© OMICRON Academy
01-Introduction-Fundamentals-of-PD

PD theory...
© OMICRON
Page 9
© OMICRON Academy Page 9

PD measurement is a reliable and non-intrusive method that can be used anytime to diagnose the insulation
condition of an electrical asset. Compared with other dielectric diagnostic methods, PD measurement provides
you with very sensitive information to help you effectively detect localized weak points in the insulation system.
In many cases, PD phenomena are the preliminary stage of a complete insulation breakdown, and as a result,
power transformers, generators, instrument transformers, cable systems, and switchgear have been checked
for PD for many years.
Because PD activity is often present well in advance of insulation failure, asset managers can assess it over
time and make informed strategic decisions regarding the timely repair or replacement of the equipment before
an unexpected outage occurs. PD detection is therefore essential to ensure the reliable, long-term operation of
your electrical equipment.
Partial discharge analysis – why?
Why PD analysis is necessary
Detection of critical defects and risk assessment
In many cases PD phenomena are the preliminary stage of a complete insulation breakdown
As a result transformers, generators, instrument transformers, cable systems, and switchgear have been checked for PD for many years
Page 10
Typical consequence of PD
(pressboard barrier of a power transformer)
© OMICRON
© OMICRON Academy Page 10
01-Introduction-Fundamentals-of-PD

The integrity of the insulation in MV and HV equipment should be confirmed with PD measurement and
analysis during the development, manufacturing, commissioning and, depending on the asset type, the service
life of electrical equipment, so that it stays in good condition and is safe to operate.
The high amount of manual work at the manufacturing stage of an asset increases the likelihood of production
errors that can lead to its premature failure. There is a disproportionately high percentage of insulation failures
being observed within the first one to three years of service compared to the rest of an asset’s working life. PD
testing is therefore initially used for routine and factory acceptance testing after production to identify quality
issues.
After the asset leaves the manufacturer, improper handling during transport and installation can lead to internal
mechanical damage. An on-line PD measurement is then often used to commission new equipment on-site as
a final quality control check.
Partial discharge analysis – when?
development tests
following standards
controlled environment
type tests and factory acceptance tests
Common measurement for acceptance testing on MV and HV assets
based on asset and general standards e.g. IEC 62271-200
controlled environment
on-site measurement
often used during site acceptance testing or after failures
following the typical standards
often disturbed environment
Page 11
Close-up of an electrical tree as a result of
continues partial discharges
© OMICRON
© OMICRON Academy Page 11
01-Introduction-Fundamentals-of-PD

In general, partial discharge can be broken down into two categories, one is internal partial discharge and the
other is external partial discharge.
Common examples for Internal PDs are Void (Cavity) discharges or Electrical treeing.
Common examples for External PDs are Corona discharges or Surface discharges.
The next slides explain the single PD sources in detail.
Page 12
Classification
Types of PDPage 12
Corona discharges Surface discharges
External PD
Void discharges
Internal PD in the insulation
Electrical treeing
© OMICRON
© OMICRON Academy
01-Introduction-Fundamentals-of-PD

Surface discharge
Occurs at “triple points” – a point where a conductor, a good insulator (e.g. solid insulator) and a bad insulator
(e.g. air) meet.
Therefore it can be found at boundaries of different insulation materials (e.g. on bushings, end of cables)
Corona discharge
Occurs in gaseous dielectrics in the presence of inhomogeneous fields, usually not inside of objects
Can be typically heard as PD at overhead lines in a substation (transformer / distribution station)
Page 13
Types of partial discharge
External PD
Page 13
Surface dischargeCorona discharge
© OMICRON
© OMICRON Academy
01-Introduction-Fundamentals-of-PD

The following examples shall give an overview of common cases of partial discharge in different locations of
our energy supply and their operating components. Corona is an electrical discharge mainly take place at sharp
edges, corners, points, small radii and as a result of high electric field strength at the transition of conductor
and insulator on overhead lines. Due to the ionization process in air, electrons break away from their original
orbit and recombine with the atoms. This recombination process releases energy in the form of light and glow
and often can observed at transmission lines in low light conditions. The same effect can be observed during
the day with sun-blind UV cameras, known as DayCor® cameras.
Corona discharge can affect the electrical power systems due to generation of corrosive products such as
ozone and nitrogen oxides which can create sulfuric acids under humid conditions. Those corrosive materials
can heavily harm polymeric insulations as well metallic conductors and other over headline components.
In addition, the occurrence of Corona discharge can influence the measurement of possible internal partial
discharges in the actual asset, since they usually predominate strongly with their high amplitude and repetition
rate.
Page 14
Evidence of PD: Overhead lines
Corona discharges at insulator
Page 14
© OMICRON
© OMICRON Academy
01-Introduction-Fundamentals-of-PD

Stator bars: The change of color proves destructive PD activity, followed by a degradation of the surface
material. The black dust and ashes often lead to an increased surface conductivity, causing parasitic currents
and hot spots. These effects will further deteriorate the insulation – eventually leading to more partial
discharges.
Constructional problem such as imperfect distances (phase separator) or contamination of winding heads lead
to partial discharge at the end-winding area. Further consequences are further decomposition of the insulation
material at end-winding area which often lead to discharges.
Page 15
Evidence of PD: Rotating machines
Contamination & imperfect distance at end-winding area
Page 15
Contamination of end-winding areaImperfect distance between winding heads
and contamination
© OMICRON
© OMICRON Academy
01-Introduction-Fundamentals-of-PD

Internal discharges in laminated material
Occurs when laminated materials delaminate, allowing the formation of gas bubbles or entire areas of gas
inside the insulator to form.
Cavity / Void discharges
Occur in voids or cavities within solid or liquid dielectrics (voids and cavities are usually filled with some kind of
gas).
Treeing
Continuous impact of discharges in solid dielectrics forming discharge channels (treeing) in organic materials
(e.g. cable insulation).
PD activity can occur on the surface or/and inside insulations. The cavity discharge and treeing are the most
dangerous processes for assets’ insulation systems being almost impossible to accurately localize them.
Page 16
Types of partial discharge
Internal PD
Page 16
Cavity / Void dischargesInternal discharges
in laminated material
Electrical treeing
© OMICRON
© OMICRON Academy
01-Introduction-Fundamentals-of-PD

This is a video of a needle on the left side and a large electrode on the right. This needle is pushed into a
silicon mass in a glass jar. High voltage is applied and the treeing process can be witnessed.
The channels/tunnels formed by partial discharges, have the strong tendency to “follow“ the electrical field
lines. This takes into account that every channel/tunnel will change the electrical field on its own.
Since the discharges are within a glass housing, the conductivity on the right side is very limited. Therefore,
new channels/tunnels can be created even though others have already reached the right side. Without the
glass bottom of the jar on the right side, the first channel/tunnel reaching the right side would result in a total
breakdown – destroying most of the silicon around it.
Page 17
Source: IPH Berlin
Visualization of electrical breakdown
Video: process of electrical discharge (channel) in solid insulation
Page 17
Source: IPH Berlin
© OMICRON
© OMICRON Academy
01-Introduction-Fundamentals-of-PD

Bushing insulation: Above pictures shows the dismantled bushing with the porcelain insulator removed in a
workshop. Water ingress – through a defective gasket – caused high partial discharge activity along the surface
of the paper insulation. Luckily the bushing could be taken out and replaced with a spare bushing relatively
quickly before a major breakdown happened.
Partial discharges are observed in power transformer windings if the insulation material between different
voltage potentials is aged, contaminated or faulty. It can be initiated by voids, cracks, or inclusions within a
solid dielectric, at interfaces within solid or liquid dielectrics, in bubbles within liquid dielectrics, or along the
boundary of different insulation materials. PD can progressively cause damages insulation materials in power
transformer bushings and windings, leading to their eventual failure and costly outages. Therefore it is
important to recognize the PD source, find it, and eliminate it if necessary
Page 18
Evidence of PD: Power transformers
Evidence of surface discharges on 123kV RBP bushing
Page 18
© OMICRON
© OMICRON Academy
01-Introduction-Fundamentals-of-PD

Here the insulation of a cable was modified to clear it up. Therefore light can pass through and allows us to see
the results of a discharge. This discharge bridged the insulation and destroyed it.
If this would have happened in a real-case scenario, the total power (charge) inside the cable would have
discharged at this very spot. This discharge power (in a real-case scenario) would have destroyed a much
larger area around the discharge point.
Page 19
Evidence of PD: XLPE cablesPage 19
Source: IPH Berlin
Discharge channel in XLPE insulation
© OMICRON
© OMICRON Academy
01-Introduction-Fundamentals-of-PD

There are several well-known approaches of partial discharge (PD) analysis. The most common ones are:
▪ The use of Phase-Resolved Partial Discharge (PRPD), with the PD charge over the phase angle
▪ The PD trend over time
▪ The PD charge dependency of the high voltage (Q(U))
▪ Statistical TDR (sTDR) for localization, where the travelling times in a cable are used to determine the PD
position
The reliable methods 3PARD and 3CFRD introduced by OMICRON for PD analysis are based on either time
synchronous measurements with three MPD measurement channels or multi-band measurements with one
MPD measurement channel for single-phase applications. Both methods help you to discriminate PD sources
from noise and simplify measurement analysis in environments with heavy interference.
Page 20
How to analyze Partial Discharge
Well known approaches:
Phase Resolved Partial Discharge Diagram (PRPD)
PD trend over time (Trend)
PD charge over voltage Q(U)
TDR and sTDR (PD localization)
OMICRON’s approaches:
3-Center Frequency Relation Diagram (3FREQ)
3-Phase Amplitude Relation Diagram (3PARD)
Page 20
The 3PARD diagram with selected PD cluster
PRPD of offline PD measurement at hydro generator
© OMICRON
© OMICRON Academy
07-Assessment-How-to-analyze-PD

PD events are often visualized in diagrams called phase-resolved PD (PRPD) patterns. A PRPD is an
important analysis tool that relies on the repetitive nature of PD. PRPDs can help with determining the cause
and severity of PD activity. They plot PD events over the AC high-voltage signal, where each PD event is
associated with a certain phase position of the AC signal (i.e. the position in the cycle of the AC signal where
the PD event occurs). That phase position is used as the horizontal position in the plot, while the charge of the
PD event is used as the vertical position in the plot. The color of the point given by the phase position and
charge of the PD events signifies the number of PD events with the same phase position and charge that have
occurred so far. PRPDs give rise to characteristic patterns that may be specific to certain types of PD in certain
types of assets.
PD events that are triggered by the AC voltage as it progresses through its cycle will always appear at the
same phase position. On the other hand, spurious noise and other transient signals that may look like PD but
that are not synchronous to the AC signal will “smear” across the PRPD.
Page 21
How to visualize Partial Discharge?
Phase Resolved Partial Discharge diagram (PRPD)
Page 21
...2 3 4 5 50
Time (ms)
Time (ms)
u(t)
Am
pli
tud
e
360°180°90° 270°
Trigger
1
Am
pli
tud
e
Trigger Trigger Trigger Trigger Trigger
© OMICRON
© OMICRON Academy
03a-Methods-Measuring-PD

The PD scope view shows the signal applied to the PD input of the primary-selected channel group, plotted as
voltage over time. The PD scope view works much like a regular oscilloscope.
The FFT view shows the frequency spectrum of trigger shots. As such, it is tied to the PD scope view, and will
only contain any data when the PD scope view has triggered. The horizontal axis represents the frequency of
the spectrum, while the vertical axis represents the spectral energy of the signal, given in dBm (relative to a
voltage of 1 mV).
Since a PRPD is a statistical diagram that aggregates the PD activity over many AC cycles, relevant
correlations will become visible over time. PD events that always occur at the same AC phase position will be
strongly located, forming colored points or clusters in the PRPD, whereas signals that have no relation to the
AC signal’s phase will be spread across the PRPD with no clear location. PRPDs thus make it relatively easy to
differentiate between AC-synchronous PD and disturbance pulses that are not synchronous to the AC.
Page 22
How to measure Partial Discharge?
Forms of analysis: Scope → FFT → PRPD
Page 22
3
PRPD
AC voltage
PD pattern
Frequency → FFT
2
Time → Scope
1
© OMICRON
© OMICRON Academy
03a-Methods-Measuring-PD

A practical demo...
© OMICRON
Page 23
© OMICRON Academy Page 23

Due to the polarity effect, a tip on high-voltage potential always causes PD to occur at 270° first (negative half
cycle). As the voltage is increased, the pattern becomes wider.
In contrast, a tip on ground potential causes PD to occur at 90° (positive half cycle).
Page 24
Corona discharge – PD patternPage 24
t
V
PD inception voltage negative tip
PD inception voltage positive tip
t
V
PD inception voltage negative tip
PD inception voltage positive tip
HV
tip on high-voltage potential
tip on ground potential
HV
Corona
© OMICRON
© OMICRON Academy
14-Assessment-Interpretation-PRPD

Page 25
Corona discharge – polarity effectPage 25
• electrons move to positive tip
• lower field in front of tip
• higher field in space
• late discharge, early breakdown
• starting electron at tip
• pos. ions remain at tip
• higher field at tip
• early discharge, late breakdown
with space charge (lower local field)
+
d
E
Einc.
without space charge
+
+
+
with space charge
d
E
Einc.
+
without space charge
+
++
© OMICRON
Corona
© OMICRON Academy
14-Assessment-Interpretation-PRPD

[1] A few discharges of similar amplitude appear in the negative (270°) only.
[2] Raising the test voltage, the number of discharges is increasing, and the pattern becomes wider, while the
amplitude is more or less still the same.
[3] Again the test voltage is risen. The pattern widens further, and some single PD impulses become visible on
the positive half-cycle (90°) as well.
Page 26
Examples: Corona discharge
PD Simulator – sharp tip on HV potential
Page 26
1 2
3
© OMICRON
Corona
© OMICRON Academy
14-Assessment-Interpretation-PRPD

[1][2] Examples of Corona discharge on ground potential
[3] Corona discharge measured on a HV cable. The PD impulses are reflected in the cable and appear as PD
impulses with lower amplitude below the original pattern.
Page 27
Examples: Corona discharge
PD Simulator – sharp tip on ground potential
Page 27
original corona
Example: measurement on a HV cable results with multiple reflections
of PD impulse
1 2
3
1st reflection
2nd reflection
© OMICRON
Corona
© OMICRON Academy
14-Assessment-Interpretation-PRPD

PD generated on the surface of the insulation material and are located naturally at transition areas between HV
potential and insulation material.
Some type of surface discharge arise at the transition between potential e.g. HV electrode and insulation, if the
field control system is not adequate or effective, because of poorly designed contact points, contamination,
porosity, thermal effects. Other types of surface discharge result often from conductive contamination (carbon,
oily dust, abrasion etc.) or from damaged field grading materials.
Page 28
Surface discharges
Examples: Surface discharge
PD at high voltage potential
Page 28
HV electrode
Insulation material
Ground potential
Surface discharge channel
© OMICRON
© OMICRON Academy
14-Assessment-Interpretation-PRPD

Following example of surface discharge was observed during an offline PD measurement at 20kV switchgear
with all accessories connected. As a HV source the 70KV RTS resonant system was used.
Problems with the black insulation caps to the MV voltage VT were suspected. After exchanging the caps, the
surface discharge was gone.
Often dirty surface (dust or other particles,...) during the mounting of insulators can caused surface discharge
which can lead to degradation of the insulation material and further to total breakdown in near future.
Page 29
Examples: Surface dischargePage 29
Surface discharge 20kV switchgear accessories
© OMICRON
Surface discharges
© OMICRON Academy
14-Assessment-Interpretation-PRPD

The PD measurement was performed on a 36 kV MV switchgear. The test was done with a separated voltage
source. The PD sensor was coupling capacitor.
The partial discharge test was done in accordance with IEC 62271-200 and IEC 60270 standards. System
calibration was performed on each phase according to IEC60270. The voltage source was connected to each
phase successively, the other two phases and all the parts were grounded. The voltage was raised to 1.3Ur
(47kV) and then it was decreased to 1.1Ur (40kV).
The PRPD is recorded at 1.3Ur (47kV).
Page 30
Examples: Surface discharge
36 kV MV switchgear, PRPD @ 47kVrms
Page 30
© OMICRON
Surface discharges
© OMICRON Academy
14-Assessment-Interpretation-PRPD

End terminations are used to manage the electrical field at the end of MV or HV cables, similar as bushings are
used at transformers. Different solutions exist due to the variety of insulation materials. The most common
techniques are geometric (HV/MV cable) and refractive/resistive field control (MV cable).
Semi conductive layers adjacent to the core conductor and the sheath are used to smoothen the field
distribution and to prevent areas with elevated electric fields.
A defect in the inner or outer semi conductive layers, like a tip, leads to an inhomogeneous electrical field. The
elevated field strength, once exceeding the dielectric strength of the insulation, will cause partial discharge and
the evolution of an electrical tree along the semiconductor surface.
Page 31
Surface discharges
Examples: Surface discharge
PD due to inhomogeneous electric field distribution
Page 31
Figure: Cable end without field control –
Tangential concentration of the electric field at the surface of the insulation material.
© OMICRON
© OMICRON Academy
14-Assessment-Interpretation-PRPD

Surface discharges on the surface of a 10kV XLPE cable without termination. The negative half cycle has
higher discharges with a lower density (amount of PD per second).
The positive half cycle has lower discharges with higher density (amount of PD per second). Asymmetry is
caused by polarity effect (PD source on ground potential).
The test was performed in the lab, the PD sensor was a coupling capacitor.
Page 32
Examples: Surface discharge
XLPE cable without termination
Page 32
© OMICRON
© OMICRON Academy
14-Assessment-Interpretation-PRPD

Let us assume that the dielectric of an ideal capacitor includes a gas void (upper left side figure), the equivalent
circuit diagram of this dielectric would look like shown in the lower left side figure. The capacitors CS and CF
form a capacitive divider. Thus the U1 drop voltage on CF is lower than the applied voltage Ut (right side
picture).
If the electric field strength in the insulation becomes higher than the dielectric strength of the gas inside the
void, a total breakdown will appear inside the void (represented as spark gap “S” in the equivalent circuit
diagram). In this moment, the spark gap “S” flashes over and U1 drops to zero and the discharge extinguishes.
The process is repeated when the electric field strength in the insulation becomes higher again than the
dielectric strength of the gas inside the void. This process appears at the zero crosses of Ut and depends on
the voltage gradient (around the peaks the voltage gradient tends to zero).
Page 33
Ut(t)
U1(t)
U t)UZ
UL
-UL
U1(t)
-UZ
t
t
I1(t)
Internal discharge (Void)Page 33
𝑞 = ∆𝑈1𝐶𝐹 𝑞 = න 𝑖1 𝑡 𝑑𝑡
CP
CF
CS
R1
S
U2
U1
Ut
Test object
CP/2 CP/2
2CS
2CS
CF
ɛr
ɛ0
I1(t)
IS(t)
Void discharges
Discharge mechanism
© OMICRON
© OMICRON Academy
14-Assessment-Interpretation-PRPD

Most probably many cracks in epoxy in cast-resin voltage transformer form a PD pattern of multiple clearly
visible “fingers” around the zero crossing.
Each bow-shaped patterns equals to the single voids in the epoxy insulation.
Page 34
Examples: Void dischargePage 34
Distribution voltage transformer
© OMICRON
© OMICRON Academy
14-Assessment-Interpretation-PRPD

The void discharges (bow shaped patterns) measured on this dry-type transformer indicate a defect in the cast
resin insulation on phase U which can develop into a breakdown and failure of the winding. A statement on the
remaining service life cannot be made because the progress of the defect is not known and a failure depends
on the operating parameters, loads and possible errors in the network.
The dry-type transformer was excited from the low-voltage winding with using the CPC 100 (control unit) +
MTR2 (exciter transformer). The PD measurement was performed phase-to-ground for each individual phase.
Page 35
Examples: Void discharge
Dry-type transformer: crack in epoxy insulation
Page 35
© OMICRON
© OMICRON Academy
14-Assessment-Interpretation-PRPD

The PD measurement was performed on a 1600 kVA, 20 kV/400V, oil type transformer (in the factory). The test
was done with a separated three-phase voltage source. The PD sensors were coupling capacitors. The PRPD
diagram is measured at 22 kV at phase V.
The pattern (symmetric) could be assigned to internal discharges (inside the transformer tank) due to metallic
particles on the surface of the insulation (based on the CIGRE Brochure 676, PD in transformers).
Page 36
Examples: Void discharge
1600 kVA, 20 kV, oil-type transformer
Page 36
© OMICRON
Void discharges
© OMICRON Academy
14-Assessment-Interpretation-PRPD

Following example of floating potential was observed during an offline PD measurement at 20kV switchgear
with all accessories connected. As a HV source the 70KV RTS resonant system was used.
Like contact PD connector or accessories which are not directly connected to HV potential or ground potential -
and are within with the surrounding electric field can cause floating potential PD. The discharge typically are
located close to the zero crossing of the applied AC voltage. Additionally, the patterns show strong symmetry in
positive and negative voltage half-waves.
Different to Contact PD the discharges of floating potential PD do not disappear with time but remain at a
certain amplitude.
Page 37
Examples: Floating potential
Floating potential at 20kV switchgear
Page 37
© OMICRON
© OMICRON Academy
14-Assessment-Interpretation-PRPD

Page 38
Overview PD coupling methods
Coupling capacitors
Measurement on bushings
High frequency current transformers
UHF sensors
Page 38
© OMICRON
© OMICRON Academy
06-Accessories-PD-coupling-sensors

A coupling capacitor (Ck) is a very common coupling method when performing a PD measurement as
described in the IEC 60270 standard. When a partial discharge event occurs, the coupling capacitor provides
the devices under test (DUT) with a displacement current, which is measurable at the coupling devices (CPL).
Such an approach provides additional information about the test voltage, which is needed for a phase-related
partial discharge (PRPD) measurement.
The PD measurement setup according to IEC 60270:2015 includes:
Blocking impedance – an impedance or a filter can be introduced at high voltage to reduce background noise
from the power supply.
Coupling capacitor (here MCC 117 or MCC 210) for decoupling high-frequent PD signals and AC voltage.
Coupling device (here CPL1/2) is usually a four-terminal network (quadripole), converting input currents to
output voltage signals.
PD measuring unit (here MPD 800) for processing all measurement data.
In the most commonly used method, the coupling capacitor Ck and the coupling device CD are connected in
series. The main advantage of this scheme is that the measuring device is not affected in case of a total
Page 39
Standard PD measurement setup
Setup accordance with IEC 60270:2015
DUT... device under test
Ck ... coupling capacitor
CD... coupling device
Z ... blocking impedance
Page 39
DUT
Cstray
not
measured
Z
CD
Ck
Fiber-optic
cable
USB
MPD 800
MCU2
CPL1/2
(optional)
𝑈𝑡𝑡
iPD ... high frequent current
© OMICRON
© OMICRON Academy
03a-Methods-Measuring-PD

breakdown of the test object Ca. In this case the stray-capacitances given by the surrounding
of the setup are not considering for the re-charging process and not part of the measured
charge.
© OMICRON Academy Page 39

What are we measuring?
© OMICRON
Page 40
B
A
CP/2 CP/2e0
2CS
CF
2CS er
© OMICRON Academy Page 40

The above example shows a 3-channel offline PD measurement on a dry-type transformer that has been
excited on all 3-phases from the secondary side.
The high diameter tube from the HV side of transformers to the coupling capacitors must be noticed. The goal
of using a high-diameter tube is to reduce the field strength on the cable surface between the test object and
coupling capacitors. Thus, a PD free test setup is obtained and high-accuracy measurements may be
performed.
If the diameter of the connection wires between the test object and the coupling capacitors is too small, Corona
discharges have to be expected.
Here, special connection wires have been used. Apart from the increased diameter, the connection wires show
toroid's (anti-corona-rings) on both sides.
The base of the coupling capacitors is isolated against the ground. The connection to ground is done by using
the coupling devices / quadripole / CPL . Therefore, all high-frequency signals pass through the coupling device
and can be measured by the MPD 600.
Page 41
Application: Dry type transformer (manufacturer)Page 41
3x coupling capacitors @ terminals
© OMICRON
Conventional measurement
Capacitive coupling
possible to state the actual measured charge
3x coupling capacitors @ terminals
© OMICRON Academy
06-Accessories-PD-coupling-sensors

Left picture shows an offline PD measurement on a MV switchgear panel with an external voltage source and
coupling capacitor (MCC 210) being used.
Right picture shows an offline PD measurement on a MV voltage cable with VLF (0.1Hz) source of B2
electronics. The HV cable of the VLF source is connected to an external HV filter, an external TD (tan delta)
measurement device and then to the coupling capacitor (MCC 210).
Page 42
Application: MV GIS and MV cables Page 42
PD measurement with 50Hz source PD measurement with VLF source (0.1Hz)
Offline PD measurement with coupling capacitors
© OMICRON
© OMICRON Academy
06-Accessories-PD-coupling-sensors

Page 43
Overview PD coupling methods
Coupling capacitors
Measurement on bushings
High frequency current transformers
UHF sensors
Page 43
© OMICRON
© OMICRON Academy
06-Accessories-PD-coupling-sensors
Bushing adapters connected to the measurement tap allow partial discharge measurements to be performed
using the capacitive graded bushings of a power transformer instead of using large coupling capacitors.
Bushings with rated voltage above 110kV are equipped with a bushing measurement tap where a metallic
conductor is connected at the last capacitive layer. Through this capacitive voltage divider high voltages can be
measured, and which is used for measurement and diagnostics purposes. The usual purpose of the bushing
measurement tap is measure capacitance C1 and power/dissipation factor (tan δ). The measurement tap can
also be used for permanent voltage measurements or in this case partial discharge measurements.
For preforming PD measurements on power transformers there are several advantages when tapped bushings
are available:
▪ NO external coupling capacitor is required
▪ Less background noise in the measuring system
▪ The coupling device is directly connected to the measuring tap
▪ On-line measurements are possible in case of permanent installed measuring units
▪ Nevertheless, the installation of the measuring set up must be done when the transformer is disconnected.
Page 44
Transformer: HV bushing taps
Measurement setups
Advantages using bushing measuring tap NO external coupling capacitor is requested Less background noise in the measuring system The coupling device (quadripole) is directly connected to the measuring tap On-line measurements are possible in case of permanent installed measuring units
Page 44
Bushing without measuring tap Bushing with measuring tap
© OMICRON
© OMICRON Academy
06-Accessories-PD-coupling-sensors

Offline PD measurement on power transformers in substation environment are often performed by means of a
(external diesel) generator and step-up transformer connected to low voltage winding.
The actual PD measurement is performed on the HV bushings via the measurement taps. In this case bushing
tap adapters are used for the connection to the MPD 800 units.
Using long fiber-optic cables the workplace with the MCU2 and Notebook is set-up in the work area with safe
distance to the power transformer.
Page 45
Decoupling over bushing measuring tapSecondary voltage injection with step-up-transformer
Work area in safe distance
Application: Power transformers (substation)Page 45
Installing the bushing tap adapter
© OMICRON
© OMICRON Academy
06-Accessories-PD-coupling-sensors

Page 46
Overview PD coupling methods
Coupling capacitors
Measurement on bushings
High frequency current transformers
UHF sensors
Page 46
© OMICRON
© OMICRON Academy
06-Accessories-PD-coupling-sensors

Partial discharges in solid insulations also induce high-frequent PD signals into the earth system. The high-
frequent PD impulses travel along the earth conductor, through the installed high frequency current transformer
where the induced voltage signal is measured and processed by the PD measurement system. High frequency
current transformers (HFCT) consist of ferromagnetic split-core and induction coil designed for the
measurement of transient signal (PD and noise).
HFCTs are a common alternative to coupling capacitors and are originally used for online PD measurement via
the ground conductor in an earthing network. The main benefit of using HFCTs is the possibility to measure PD
pulses not at high voltage potential but at grounding connections without opening them.
Page 47
High frequency current transformers (HFCT)
Principle of HFCT sensors
HFCTs consist of ferromagnetic split-core and induction coil
Measurement of transient signals (PD and noise)
Originally used for online PD measurement via the earthing system
Page 47
PD
Noise
Ground conductor
HFCT
u(t)
MPD 800© OMICRON
© OMICRON Academy
06-Accessories-PD-coupling-sensors

Typically the HFCTs and PD measurement units are installed at the near-end or far-end termination and at if
accessible at joints locations, via the cross-bonding boxes. Only two MPD 800, using three of the four available
PD inputs, are required to perform a three-phase simultaneous at the near-end terminal.
In case of short cable tracks a manually laid parallel fiber optic cable allows additional simultaneous
measurement in joints locations and far-end terminal.
In case of long cable tracks pre-installed parallel fiber optic cables are required to cover the longer distances
between terminations and joints.
Page 48
Cable PD measurements with HFCT
Example setup with MPD 800
Page 48
Termination
Joint
Fiber optic cable
MCU2
NotebookUSB
MPD 800
RBP1
Coaxial cable
MCT 120
© OMICRON
© OMICRON Academy
06-Accessories-PD-coupling-sensors

For on-line PD measurements on cables, an HFCT is normally installed around the cable sheath of the joints
and on the grounding point on the end terminations.
Page 49
High frequency current transformers (HFCT)
GIS termination: 220kV XLPE cable, 3x single-core
Page 49
© OMICRON
© OMICRON Academy
06-Accessories-PD-coupling-sensors

Page 50
Overview PD coupling methods
Coupling capacitors
Measurement on bushings
High frequency current transformers
UHF sensors
Page 50
© OMICRON
© OMICRON Academy
06-Accessories-PD-coupling-sensors

A brief description of the two methods (IEC and UHF) is provided here.
Until now there is no standard procedure to calibrate UHF measurements.
Page 51
UHF PD measurement
E / H
IEC compliant PD measurement
I / Qiec
PD measurement using IEC and UHF setupPage 51
IEC measurement UHF measurement
Dispersion Compensation current Electromagnetic field
Coupling Discrete capacitor Antenna
Frequency kHz – some MHz 100-2000 MHz
Calibration Small setups, low
frequencies
Magnitude and damping
depends on position of defect
© OMICRON
© OMICRON Academy
06-Accessories-PD-coupling-sensors

Page 52
UHF measurement equipment
Measurement setup @ oil-drain valve of power transformer
Page 52
© OMICRON
© OMICRON Academy
06-Accessories-PD-coupling-sensors

Example of connecting a MPD600, the UHF converter (UHF 608 or UHF620) and a battery to a preinstalled
UHF sensor at a GIS.
Page 53
UHF measurement equipmentPage 53
© OMICRON
© OMICRON Academy
06-Accessories-PD-coupling-sensors

Since charge (q) is calculated by integral current over time 𝑖 𝑡 , the partial discharge (PD) data acquisition unit
detects the voltage drop across the known effective resistor of the coupling devices (CD) in the test circuit. This
resistor will be R, 𝑡1 and 𝑡2 , which are defined by the user of the measurement system.
Seen from a geometrical point of view, both mathematical expressions on the top of the slide are describing an
area below a current curve.
Since current cannot be measured easily, the voltage drop over a known resistor (shunt) will be used.
Charge measurement by frequency domain integration will be covered later in detail.
Page 54
How to measure Partial Discharge?Page 54
q = 𝑡1𝑡2𝑖 𝑡 𝑑𝑡 =
1
𝑅𝑡1𝑡2𝑢 𝑡 𝑑𝑡
q
© OMICRON
© OMICRON Academy
03a-Methods-Measuring-PD

The PD Measurement according IEC 60270 is the basis for many applications, different assets and different
voltage levels. This is reflected in a variety of IEC, CIGRE and IEEE guides and standards which refer to the
IEC 60270 standard. Therefore, the IEC 60270 standard is very important for acceptance measurements in the
test fields of manufacturers as part of their type and routine tests on high-voltage equipment.
The IEC 60270 recommends two different filter settings. These include wide band measurement and narrow
band measurement. For a wide band measurement, the recommendation is:
o Lower frequency limit and above or equal to 30 kHz and below or equal to 100 kHz
o Higher frequency limit below or equal to 1 MHz
o Bandwidth of 100 kHz to 900 kHz
o Polarity detection can be possible
The on-site partial discharge measurement is often conducted with a filter setting out of the recommended
range by IEC 60270 to avoid a high noise condition. The MPD data acquisition unit allows users to adjust the
filter setting to find out the optimized SNR (Signal-to-Noise-Ratio) to ensure high sensitivity for the PD
measurement and a high robustness against noise for further analysis.
Page 55
Frequency limits per IEC 60270:2015
For wide band measurement the recommendation is:
Left frequency limit below 100kHz and above 30kHz
Right frequency limit below 1MHz
Bandwidth of 100kHz to 900kHz
Polarity detection can be possible
Page 55
Fre
qu
ency r
espon
se
Frequency
measurement filter
Frequency10kHz 100kHz 1MHz 10MHz
30kHz 500kHz
© OMICRON
© OMICRON Academy
03a-Methods-Measuring-PD

PD signals in general are very broad-band signals. The unavoidable low-pass characteristic of the test object
(here cable) influences the signal. Higher frequencies will get damped while the signal propagates from the
fault to the sensor. The amount of damping as well as the frequencies that are damped depend mainly on the
distance between fault and sensor.
"Visibility" of PD
The low-pass characteristic of the cable damps higher signal frequencies. Higher measurement frequency
reduces the "visibility". It is not possible to measure PD far away from the measuring point at high frequencies.
Therefore, the center frequency should be selected as low as possible to see far inside the cable. On the other
hand, using a high center frequency allows for a very sensitive measurement that focuses on the point of
measurement, which is often the termination.
Disturbances Noise
Disturbances and noise are not equally distributed over the frequency range. There might be certain
frequencies which are noisier than others. Very often, noise is dominant in the low frequency range. It might be
possible to avoid disturbances and to get a better signal-to-noise ratio by carefully choosing the measuring
Page 56
High frequency signal propagation
PD is a HF signal – insulation is a low pass, filtering HF signals
Page 56
fA good filter settings
t
i
Area = q
= 10pC
Area = q
= 10pC
Area = q
= 10pC
Area = q
= 10pC
wrong filter
settings
(too high)
Measurement
should be done
with low
frequencies! This
isn’t possible with
Cc<<
© OMICRON
© OMICRON Academy
03a-Methods-Measuring-PD

frequency and bandwidth.
© OMICRON Academy Page 56

Using a higher frequency range often allows a less disturbed measurement, while it limits the range from a
sensor in which faults are detectable. Vice versa, lower frequencies are often more disturbed but allow for a
'deeper' look inside the cable. In this example the damping effect of a calibrator impulse along an HV cable is
shown in dependence of the measuring frequency.
Page 57
High frequency signal propagation
Damping effect vs. distance vs. measurement frequency
Page 57
Damping of a calibration impulse along a HV cable in
dependence of the measuring frequency - each joint
represents 500m
Synchronous multichannel PD measurement –
damping along a HV XLPE cable
© OMICRON
© OMICRON Academy
03a-Methods-Measuring-PD

The partial discharge (PD) activity is quantified by the secondary measuring unit called electric charge. The
real electric charge involved by the PD activity inside the insulation’s voids is higher (even much higher, in
some cases) than the apparent electric charge, which can be measured at the accessible points of the test
objects. The ratio between the real and apparent charge depends on the void dimensions, shape and the
insulation thickness, as well.
Page 58
Why charge calibration?Page 58
Winding
Core
Winding Core
qm
q’ < qmq’ < qm
q << qm q << qm
real charge qm >> apparent charge q
Insulation
© OMICRON
© OMICRON Academy
03b-Methods-Charge-Calibration

The calibration process is carried out before the actual PD measurement and is done by injecting short duration
current pulses of known charge magnitude, across the terminals of the test object. A calibration factor (also
called k factor) is therefore calculated by the software of the PD instrument. This calibration factor is simply the
ratio of the known injected charge magnitude over the measured charge magnitude. It is only valid for a specific
test object for a specific frequency range, a specific test setup and PD instrument. If any of those parameters
are modified, the calibration process must be repeated.
Note: don’t connect the calibrator directly at the coupling capacitor which will results in wrong readings (lower
PD levels).
Page 59
How to perform charge calibration
The set up has to be complete, ready for measurement
No voltage shall be applied
Connect the calibrator as close as possible to the test object
Perform the charge calibration
Page 59
Fiber-optic
cable
USB
MPD 800
MCU2
ut(
t)
CD -> PD & V
Ck
CaCstray
not
measured
Z
CPL1/2
(optional)
© OMICRON
© OMICRON Academy
03b-Methods-Charge-Calibration

Page 60
Important to know
Changes in measurement environment
Change in measurement setup Change of HV connection cable
Change of grounding cable
Change of any PD measurement
components
Change from one phase to next phase*
Change of PD measurement
settings
Change of center frequency 𝑓𝑚Change of bandwidth Δ𝑓
Page 60
Calibration has to be repeated if:
Calibration at generator terminal side
© OMICRON
© OMICRON Academy
03b-Methods-Charge-Calibration

Noise in PD measurements
© OMICRON
Page 61
© OMICRON Academy Page 61

1. Sources of noise coupled into PD measurement circuit
2. Background noise coupled through mains supply voltage of HV source:
3. Background noise coupled through grounding system of mains supply of HV source
4. Background noise and internal PD coupled through HV source → use appropriate blocking impedance
(manufacturer specific)
5. External PD due to inappropriate grounding system (other “noisy” devices on the same ground potential
e.g. machines with excitation, construction site, factory environment,...)
6. Outer noise (interference) due to neighbored and live HV systems (assets, over headlines,) or external
sources of interference (radio frequency communication,...)
7. Background noise coupled through inappropriate grounding of coupling capacitor
Page 62
Origin of background noise
Sources of noise coupled into PD measurement circuit
Page 62
Source: A.Küchler – Hochspannungstechnik,
Grundlagen-Technologie-Anwendungen
Blocking
impedance Z
HV source
Mains
supply
𝑪𝒂
CD
DUT
PD
M
Outer noise
1
2
3
4
5
6
7
Coupling
capacitor 𝑪𝒌
© OMICRON
© OMICRON Academy
10-Noise-suppression-Basic

Quantitative measurements of partial discharge magnitudes are often obscured by interference caused by
disturbances which fall into two categories:
o Disturbances which occur even if the test circuit is not energized
o Switching operations in other circuits
o Commutating machines
o HV tests in the vicinity
o Radio transmissions
Page 63
Types of disturbances acc. IEC 60270
Disturbance when test circuit is NOT energized
Switching operations in neighbored circuits
Commutating machines
HV tests in the neighbored environment
Radio transmissions
Page 63
Non-phase stable interference (example PD simulator) Phase stable interference from (neighbored) excitation circuit
© OMICRON
© OMICRON Academy
11-Noise-suppression-Gating

Disturbance when test circuit is energized (not related to test object)
o Usually increase with increasing voltage.
o Internal PD in HV source
o On the HV connectors (surface discharges, corona discharges)
o Sparking of imperfectly earthed objects or imperfect connections in the area of the HV (contact noise, metal
parts at floating potential)
o In the mains supply due to solid-state switching devices (thyristors)
Page 64
Types of disturbances acc. IEC 60270
Disturbance when test circuit is energized (not related to test object)
Inappropriate HV source (internal PD)
Solid-state switching devices (thyristors) in mains-supply of HV source
Unsuitable HV connectors (causing external PD)
Non-PD free connections in HV area
External PD due to ungrounded HV source, DUT or other components
Page 64
Phase-stable interference (excitation 6-pulse bridge) Internal PD of HV source without blocking impedance
© OMICRON
© OMICRON Academy
11-Noise-suppression-Gating

The measurements are affected by disturbances which should be low enough to permit a sufficiently sensitive and
accurate measurement of the PD quantity to be monitored. As
disturbances may coincide with PD pulses and as they are often superimposed on the measured quantities, the
background noise level should preferably be less than 50 % of a
specified permissible partial discharge magnitude, if not otherwise specified by a relevant technical committee.
For acceptance tests and type tests on high-voltage equipment, the background noise level should be recorded.
Signal gating by time window, polarity discrimination, or similar methods can result in the loss of true partial discharge
signals if those signals occur concurrently with the disturbance or the gated-out (inhibited) part of the cycle. For this
reason, the signal should not be blocked by the gate for more than 2 % of each test voltage period in alternating voltage
systems, nor by more than 2 % of the cumulative test time in direct voltage systems.
If, however, several mains-synchronized interference sources per period are present, the blocking interval limit may be
increased to 10 % of the test voltage period. Hence, this gating
shall be set before the full test voltage is applied and these settings shall not be altered during the test.
Page 65
Phase and amplitude (window) gating
IEC 60270: Chapter 10: DISTURBANCES (G3.3.1)
Page 65
According to IEC 60270:2015o Neglect high readings!!!
o DC: not more than 2% of measuring time
o AC: NOT MORE THAN 2% of period
o Heavy disturbances: ≤ 10% of period
© OMICRON
© OMICRON Academy
11-Noise-suppression-Gating

The above example was recorded before charge calibration before for an offline PD measurement on hydro
generator.
Page 66
Examples: disturbance / noise
Example 1: non-stable noise pattern – Part 1
Page 66
Ground noise level
Non-phase stable noise
© OMICRON
© OMICRON Academy
14-Assessment-Interpretation-PRPD

The above example was recorded before charge calibration before for an offline PD measurement on hydro
generator.
Page 67
Examples: disturbance / noise
Example 1: non-stable noise pattern – Part 2
Page 67
Ground noise level
Non-phase stable noise
© OMICRON
© OMICRON Academy
14-Assessment-Interpretation-PRPD

Page 68
Examples: disturbance / noise
Example 2: non-stable noise pattern
Page 68
Ground noise level
Switching noise
HV source
Non-phase stable noise
from additional safety
equipment
© OMICRON
© OMICRON Academy
14-Assessment-Interpretation-PRPD

The above example was recorded during an online PD measurement on hydro generator.
This six pulses are obviously caused by the generator excitation system due to its stable phase position and
high repetition rate. In this case also multiple reflections, with damped amplitude are visible.
In such cases selection of different measurement frequency / bandwidth, use of unit-gating or 3PARD can be
sufficient tools for noise suppression.
Page 69
Examples: disturbance / noise
Example 3: Online PD measurement – generator excitation noise
Page 69
Micro void PD +
Ground noise level
Non-phase stable noise
from additional safety
equipment
© OMICRON
© OMICRON Academy
14-Assessment-Interpretation-PRPD
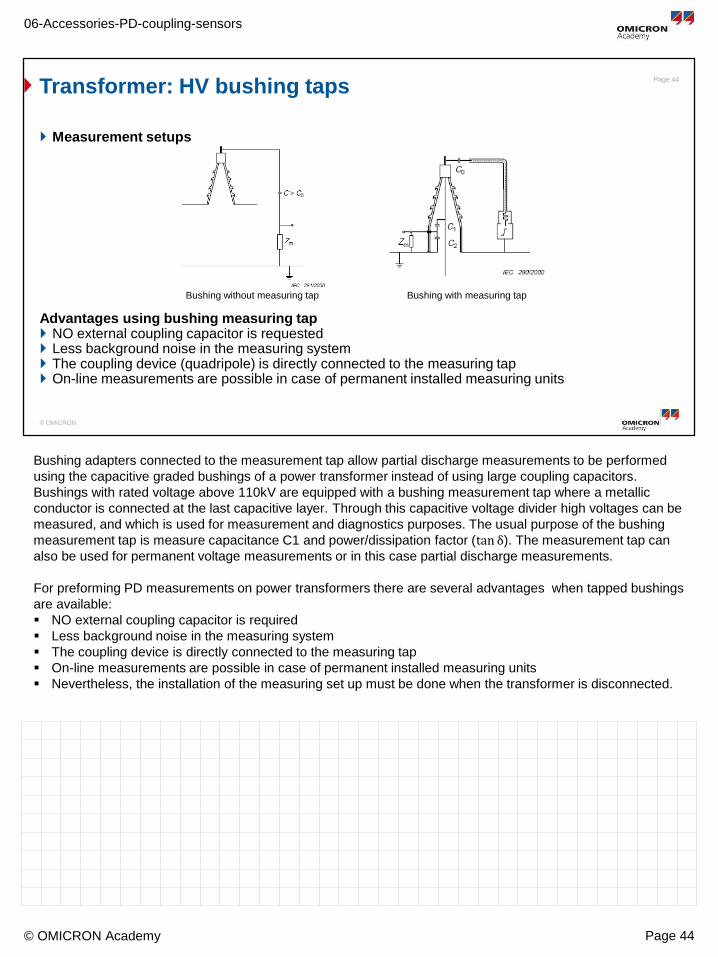
The above example was recorded during an online PD measurement on a 4.7 MW, 6.6 kV hydro generator.
Right picture shows the measurement setup.
Pattern Nr. 1 shows typical slot discharge PD due to mechanical abrasion of the Outer Corona Protection
(OCP) of the stator bars.
Pattern Nr.2 shows external interference from the connected power grid, most probably from sure arrestors
nearby over headlines.
Page 70
Examples: disturbance / noise
Example 4: Online PD measurement at generator
Page 70
Slot
discharge
PD
phase
stable
noise
coupled
from
power grid
1
2
1
2
1
2
© OMICRON
© OMICRON Academy
14-Assessment-Interpretation-PRPD

In these pictures three different PD measurements setups in HV labs are shown. In such cases the blocking
impedance is customized to the HV source or ordered as a standard component of the HV source
manufacturer.
In addition, the use of corona rings is essential to ensure a homogeneous electrical field distribution and to
avoid external partial discharges (corona discharge), which can otherwise occur due to sharp edges at the
connection points.
Page 71
Suppression of internal PD (HV source)Page 71
Blocking impedance solutions in different HV labs
© OMICRON
© OMICRON Academy
10-Noise-suppression-Basic

Here is an example of PD measurement on a medium-voltage switchgear using the 70kV RTS resonance
system. For a PD-free measurement setup, HV connection cables with screwable shield electrodes. are used
here. These standard accessories is very flexible and suitable for various PD applications up to 70kV.
Page 72
HV connection techniques
Connection techniques (field examples)
Avoid external PD at sharp connection points
Connection cables with shield electrodes > approx. 20kVrms
Corona rings to harmonize electric field distribution > approx. 30kVrms
Page 72
© OMICRON
© OMICRON Academy
10-Noise-suppression-Basic

Same procedure shall be applied for onsite measurements. The use of tubes and corona rings prevents the
occurrence of unnecessary partial discharges caused by your own measurement setup. When using tubes,
make sure that the connection to the contact points is improved using conductive adhesive tape (copper
adhesive tape). Otherwise, additional contact PD can occur, which can have a negative effect on the
implementation of the actual PD measurement.
Attention: still use a standard laboratory cable for the HV connection from coupling capacitor to the device
under test. The additional tubes are just put over to increase the diameter of the HV potential!
Page 73
HV connection techniques
Connection techniques (field examples)
Avoid external PD at sharp connection points
Corona rings to harmonize electric field distribution > approx. 30kVrms
Tubes to increase diameter of conductor > approx. 70kV
Page 73
© OMICRON
© OMICRON Academy
10-Noise-suppression-Basic

Another major influence on reducing the basic noise level is to use short and direct ground connections from
the coupling capacitor to the device under test. In simple words: reducing the antenna effect of our HV and
ground connections. Shorter HV and ground loops are significantly reducing the coupling of external
interference into our PD measurement setup.
If all measures for interference suppression are applied, the basic noise level can be reduced significantly
through hardware measures.
Additional noise suppression methods within MPD Suite software and optional Gating Units are explained in
the following slides.
Page 74
Grounding techniques
Ground loop (antenna effect)
Page 74
Short HV and ground connections with the MPD 800 setup
Conventional PD measurement
PD signal obscured
in the noise band
PD signal with reduced
noise level
MPD 800 and RBP1
© OMICRON
© OMICRON Academy
10-Noise-suppression-Basic

The following example describes the problem faced during an online PD measurement on a hydropower
generator. The measurement was carried out by means of coupling capacitors installed on all three phase
terminals.
After the charge calibration had been performed at standstill condition, the generator was synchronized with the
electrical grid afterwards. Measurement with the standard setting: 𝑓𝑚 = 250kHz and Δf = 300KHz, phase-
unstable interference caused by the excitation device of the machine were more dominant than the measured
PD discharge of the winding insulation. Luckily charge calibration was performed with different center
frequencies in advance and the settings were saved as configuration files.
Page 75
Noise suppression (software)
Selection of measurement frequency
Variation measurement filter (𝑓𝑚 and Δf)
Selection of frequency range less exposed to noise interference
Page 75
Fre
qu
ency r
espon
se
Frequency
measurement filter
𝑓𝑚 = 250kHz and Δf = 300KHz 𝑓𝑚 = 1 MHz and Δf = 300KHz
© OMICRON
© OMICRON Academy
10-Noise-suppression-Basic

Window gating of phase and amplitude (PRPD gating)
Phase/amplitude gates allow the MPD 800 to eliminate frequency-stable signals with a certain amplitude and
fixed phase position, for example converter pulses, drives, irrelevant PD. You can easily define the gating
areas by marking them with the mouse. These areas will be excluded during the subsequent PD measurement.
This is very useful to, for example, suppress inverter noise, which will usually happen at fixed phase positions,
but can have very large charge levels.
Page 76
Phase and amplitude (window) gating
When to use?
Eliminates frequency-stable signals with a certain amplitude and fixed phase position
How to use?
Users can easily define gating areas by marking them with a mouse
These areas will be excluded during subsequent PD measurement
Page 76
Measurement example using phase/amplitude
window gating in the PRPD diagram.
© OMICRON
© OMICRON Academy
11-Noise-suppression-Gating

To reduce the effect of disturbances, such as inverter noise on the measurement results, you can use the
second MPD 800 input channel as a gating channel.
PD activity detected on a gating channel suppresses PD events that are simultaneously measured on
measurement (non-gating) channels.
The underlying method uses the (gating) signal of a sensor or other coupling close to the source of the
disturbance, which is dominated by the interfering signals. The signal of the measurement channel is not used
for the measurement result if an impulse of a certain size is measured on the gating channel.
Page 77
Channel (unit) gating
When to use?
Reduce disturbance (inverter noise) which affects the PRPD pattern
Phase stable or non-phase stable noise
Window gating is not sufficient
How to use?
The second MPD measurement channel can be used as a gating channel
Additional sensor (HFCT) as close as possible to source of noise
Page 77
Filtered measurement channel (upper PRPD) and the
gating channel (marked as GC ON) in real-time.
Unfiltered PRPD with 6-pulse disturbances.
© OMICRON
© OMICRON Academy
11-Noise-suppression-Gating

What is the principle of unit gating?
The principle of unit gating is very simple but requires synchronous measurement of a measurement channel
and gating channel.
While in the measurement channel PD pulses, asynchronous background noise and unwanted disturbance
signals are detected the a second gating channel is only used to detect the unwanted disturbance signal which
later shall be gated. For this reason a so called gating window is manually defined which only covers all
unwanted disturbance signals in the PRPD.
Page 78
Time axis
measurement
channel
PD pulses
Channel (unit) gating
Principle
Page 78
Time axis
Disturbance
Gating channel
active
Gate
rectangle
© OMICRON
© OMICRON Academy
11-Noise-suppression-Gating

Once the gating feature is active all pulses appearing inside the manually drawn gating window and triggered
by the gating unit will lead to suppression on all other measurement channels.
The disturbance signals disappear from the PRPD of the measurement channel.
Page 79
PD pulses
Channel (unit) gating
Principle
Page 79
Time axis
Gating channel
active
Disturbance
Time axis
Gate
rectangle
measurement
channel
© OMICRON
© OMICRON Academy
11-Noise-suppression-Gating

A practical demo...
© OMICRON
Page 80
© OMICRON Academy Page 80

Partial discharge (PD) events on one phase can also be detected on the other phases. Making a distinction
between different PD sources and superimposed noise pulses is a challenge due to this coupling. The
OMICRON MPD measurement and analysis system provides users with the following powerful tools for the
separation of different sources of interference and easy data visualization.
3-Phase Amplitude Relation Diagram (3PARD)
The 3-phase amplitude relation diagram (3PARD) simplifies the differentiation of various PD sources and PD
interferences. The three phases are measured synchronously. The combined results of three measurement
channels are displayed in a single 3PARD star diagram, which facilitates result comparison and separation of
impulse sources. To further increase the testing reliability, clusters are selected in the 3PARD and the resulting
PRPD diagrams show the filtered-out pulses in real time while graying out the residual pulses in the
background
Page 81
Separation of event sources
3-Phase-Correlation-Diagram (3PARD)
Eases the separation of multiple PD sources and disturbances
3 phases are measured fully synchronous with three MPD measurement channels
The results are displayed in the 3PARD-diagram and can be used for source separation
Page 81
The 3PARD diagram with selected PD cluster
Resulting PRPDs of the three measurement channels (due to the selected
cluster in 3PARD) and the gray unfiltered PRPD histogram displayed in the
background
© OMICRON
© OMICRON Academy
12-Noise-suppression-3PARD

A schematic diagram of how 3PARD works is shown here. Three synchronous channels - in this case the
phases L1, L2 and L3 - detect the same partial discharge pulse with different amplitudes within a user defined
time window.
If we assume that the original PD source occurs in Phase L1, with the highest amplitude measured of 900pC.
The other two channels also measure the PD pulse by cross-coupling from the neighbored phases.
In phase L2 which is closer to the source the PD is measured with an amplitude of 700pC.
In phase L3 which is further away to the source the PD is measured with an amplitude of 500pC.
Page 82
Multi-channel synchronous PD measurement (3PARD)
Coupling of PD source
Page 82
900 pC
700 pC
500 pC
PD source
© OMICRON
© OMICRON Academy
12-Noise-suppression-3PARD

The amplitude of each phase is now transformed into a vector which, when graphically added, gives a point in
the 3PARD star diagram. If the PD source appears regularly, the various points form a cloud, also called a
"cluster".
Different PD sources form different clusters in the diagram.
Adding the vector obtained form the single phases results in a cluster formed between Phase L1 and Phase L2,
but closer to Phase L1.
Page 83
Multi-channel synchronous PD measurement (3PARD)
Source separation
Page 83
© OMICRON
PD
900 pC
700 pC
500 pCPhase 1
Phase 2
Phase 3
© OMICRON Academy
12-Noise-suppression-3PARD

Typically, outside noise (or background noise) is equally coupled into all three phases through the
measurement setup. For this reason the amplitude of the interference is measured with the same magnitude in
the acquisition units.
Page 84
Multi-channel synchronous PD measurement (3PARD)
Coupling of outside noise (disturbance)
Page 84
© OMICRON
© OMICRON Academy
12-Noise-suppression-3PARD

In case of symmetrical coupling of the disturbances, the addition of the vectors results in a cluster located
around the zero point of the vector diagram.
If the noise isn’t coupled symmetrically into measurement setup, the noise cluster will be shifted around zero
point into the direction of the phase with the highest noise amplitude.
Page 85
Multi-channel synchronous PD measurement (3PARD)
Source separation
Page 85
Phase 1
Phase 2
Phase 3
disturbance
© OMICRON
© OMICRON Academy
12-Noise-suppression-3PARD

An example PD measurement on a cast resin transformer with induced voltage using 200Hz. (YD5
transformator)
In the three PRPDs several faults are visible, the QIEC value gives no indication where these faults are
situated.
The HV winding is connected in triangular.
Page 86
3PARD example: Cast resin transformer
Cast resin transformer Yd5 Induced voltage test up to approx. 43.5kV @ 200Hz Excitation from LV winding 3x Coupling capacitor + MPD units
Page 86
© OMICRON
© OMICRON Academy
12-Noise-suppression-3PARD

With back transformation of cluster “A” into the single PRPDs it becomes obvious that the PD source must be
located between phase L1 (measured charge: ~37pC) and phase L2 (measured charge: ~43pC).
Due to the delta connection of the primary winding, this leads to a PD fault approximately in the middle of the
winding between phase 1 and phase 2.
There are several pattern visible, most of them indicate an internal fault.
Page 87
3PARD example: Cast resin transformer
Transformation of Cluster “A” to PRPD
PD source is most likely between phase L1 and L2 (approx. middle of winding)
Page 87
A
© OMICRON
© OMICRON Academy
12-Noise-suppression-3PARD

With back transformation of the cluster “B” back into PRPDs it becomes obvious that the PD source must be
closer to the phase L1 (charge level: ~31pC).
Page 88
3PARD example: Cast resin transformer
Transformation of Cluster “B” to PRPD
PD source is most likely between phase L1 and L2 (approx. middle of winding)
Page 88
B
© OMICRON
© OMICRON Academy
12-Noise-suppression-3PARD

When transforming the cluster “C” back into PRPDs it becomes obvious that the PD are situated between
phase L1 (charge level: ~14pC) and phase L3 (charge level: ~21pC).
Due to the delta connection of the winding, the location of the PD source must be approximately in the middle
of the winding between phase L1 and phase L3.
There are several pattern visible, most of them indicate an internal discharge (void).
Page 89
3PARD example: Cast resin transformer
Transformation of Cluster “C” to PRPD
PD source is most likely between phase L1 and L3 (approx. middle of winding)
Page 89
C
© OMICRON
© OMICRON Academy
12-Noise-suppression-3PARD

The 3FREQ (3-center frequencies relation diagram) is a one-channel filtering tool using three digital filter
frequencies. It characterizes PD sources by their frequency signature.
Using a 3FREQ diagram, you can separate PD events such as surface discharge, corona and internal void
from disturbances. As with 3PARD, the PRPD diagram shows filtered out pulses while greying out the residual
pulses in the background to improve the testing reliability.
The 3FREQ diagram, also known as 3CFRD (3-center frequencies relation diagram), is a one-channel filtering
tool that uses three digital filter frequencies to characterize PD sources by their frequency signature.
Page 90
Separation of event sources
3-Center Frequency Relation Diagram (3CFRD/3FREQ)
Sources are separated based on their frequency behavior
One measurement channel with three simultaneous measurement frequencies
The results are displayed in the 3FREQ-diagram and can be used for source separation
Page 90
3FREQ diagram with
selected PD cluster
FFT diagram with selected
three measurement
frequencies
Resulting PRPDs of the three measurement frequencies (due to
the selected cluster in 3FREQ) and the gray unfiltered PRPD
histogram displayed in the background
© OMICRON
© OMICRON Academy
13-Noise-suppression-3FREQ

The 3FREQ filter uses three different center frequencies for PD analysis. Due to the one-channel measurement
approach you only need one MPD 800 device.
3FREQ (3-center frequencies relation diagram) is a powerful tool used in order to separate multiple PD sources
which are overlapping in the PRPD (phase resolved partial discharge) diagram. It involves PD measurements
using only one acquisition unit (one-channel measurement) and three digital filters (with three different center
frequencies and the same bandwidth). In other words, this is a multi-spectral technique for multiple PD sources
analysis.
The test set up for one channel measurement consisting of a test object, coupling capacitor and coupling
device (measuring impedance) and measuring instrument (MPD unit) is shown above. To keep the circuit as
simple as possible, the voltage source and the blocking impedance (line filter) are not shown here. Also, the
coupling device (measuring impedance) is shown in simplified format.
Page 91
3-Center Frequencies Relation Diagram (3FREQ)Page 91
Source separation
© OMICRON
Source 2
Seite 91
Source 1
Source 3
MPD 800
MPD 800
CD
Ck
© OMICRON Academy
13-Noise-suppression-3FREQ

Different PD sources are characterized by different frequency responses (e.g. above, FFT pulse 3 includes
more high frequency components than FFT pulse 1, which includes more high frequency components than FFT
pulse 2). Thus, the difference in the time domain is also existing in the frequency domain.
The 3 center frequencies have to be placed on the position where the biggest differences between the spectra
of the pulses are visible.
Using the phasors (red, blue, green) corresponding to each filter and spectrum and plotting them in a 2D star
diagram (120° phase shift) different clusters corresponding to different PD sources are developed.
Nevertheless, if the PD sources are very close to each other inside the DUT, a clear separation using
3CFRD/3FREQ might not be possible.
Do not forget to place a filter according to IEC 60270 recommendation if standard compliant measurements are
required.
Page 92
3-Center Frequencies Relation Diagram (3FREQ)
Source separation
Page 92
© OMICRON
fc3
fc2
fc1
FFT-Impuls 1
FFT-Impuls 2
FFT-Impuls 3
TE-Quelle 1
TE-Quelle 2
TE-Quelle 3
© OMICRON Academy
13-Noise-suppression-3FREQ

All three back transformations in one view. For the different PRPDs now a separate analysis can be done, and
the results are shown above the individual diagrams.
Page 93
3-Center Frequencies Relation Diagram (3FREQ)Page 93
Surface discharge Internal voidCorona discharge
Phase-resolved pattern 3FREQ
© OMICRON
© OMICRON Academy
13-Noise-suppression-3FREQ

The integrity of the insulation in MV and HV equipment should be confirmed with PD measurement and
analysis during the development, manufacturing, and commissioning of electrical equipment.
Once the asset is in service, strategic decisions about maintenance must be made to ensure maximum
availability. Periodic PD measurements and continuous PD monitoring provide asset managers with the
required data to focus on at-risk assets and minimize unnecessary maintenance outages and costs.
Regular PD measurements performed during scheduled maintenance outages enable a trending of the asset’s
insulation condition, which is a powerful way to recognize a developing insulation fault in its early stage and to
plan maintenance accordingly to extend its service life.
Page 94
Extension of expected lifetime...
... through periodic testing and/or monitoring
Page 94
Development
© OMICRON
© OMICRON Academy
01-Introduction-Fundamentals-of-PD

Periodic measurement
Periodic measurements can be offline or online measurements. For offline measurements the asset can be tested with an external
voltage source and the variation of the voltage level is possible. The measurement system can be set up for the best signal to noise ratio
to provide the lowest noise level. For online measurements only pre-installed sensors can be used. Otherwise, limited sensors are
available because the system is online (e.g. no installation of MCC possible). Both measurements provide data over a small period.
Temporary monitoring of PD activity
Temporary PD monitoring enables operators to observe changes in PD activity over short, continuous periods of time. Temporary PD
monitoring systems are designed for use with a variety of PD measurement sensors, including coupling capacitors for rotating machines,
bushing tap sensors and UHF sensors for power transformers, as well as high-frequency current transformers (HFCTs) for power cables.
These PD measurement sensors can be permanently installed and connected via a terminal box, which is also permanently installed at
the asset. This enables safe connections while the asset is on-line to avoid unnecessary downtime during setup. With the monitoring
software, asset managers can reliably assess the current insulation condition and identify which asset is most at risk of failure.
Permanent PD monitoring for high risk assets
A permanent on-line PD monitoring system is typically used on critical assets and assets showing signs of aging to assess insulation
condition for an indefinite period of time under normal operating conditions. This type of PD monitoring system consists of permanently-
installed PD sensors, a data acquisition device as well as monitoring and PD analysis software running on a central computer. Multiple
assets can be synchronously monitored at the same time and the data can be compared using the same software at the central
computer. A warning or alarm is triggered to alert the operator when PD activity exceeds defined limits.
Page 95
Periodic vs. Temporary vs. Continuous monitoring
Periodic measurementsSnapshot of the current parameters
Installation or pre-installation of setup components (e.g. coupling capacitor, HFCT, ...)
Non-permanent installations of measurement setup
Lowest amount of measurement data
Lowest noise level
Variation of voltage level possible
Temporary monitoring
Short time monitoring of parameters for minutes, hours, days or load cycles
Pre-installation of setup components (e.g. coupling capacitor, HFCT, ...)
Non-permanent installations of measurement setup
Reduced amount of measurement data
Continuous monitoring
Permanent monitoring with pre-installation of measurement setup
Permanent analyzation of parameters (dissipation factor, partial discharge,...)
Definition system configuration, setting thresholds levels for alarming
Huge amount of measurement data
Page 95
Online Monitoring: PD trend data
3PARD and PRPD diagrams
© OMICRON
© OMICRON Academy
01-Introduction-Fundamentals-of-PD

One device for all assets and testing applications. You can use the MPD 800 for a wide range of testing
applications, beginning with the traditional power supply sector, at manufacturers or repair shops, in
laboratories or, for example, during diagnostic testing of motors in the industry sector. It supports you during
standards-compliant PD testing for routine and type testing, factory and site acceptance testing, as well as for
troubleshooting to localize or investigate PD sources in:
Power transformers
Power cables
Rotating machines
Gas-insulated switchgear (GIS) and medium-voltage switchgear
Industrial drives
Railway transportation
High-voltage components such as bushings, insulators, capacitors, cable terminations, busbars
Page 96
PD diagnostics: MPD 800
Standard-compliant partial discharge (PD) measurement and analysis for:
Routine and type testing
Factory and site acceptance testing
PD maintenance testing
Troubleshooting and localization of PD sources in the field
Applicable assets:
Power transformers
Power cables
Rotating machines
Gas-insulated switchgear (GIS) and Medium-voltage switchgear
Industrial drives
Railway transportation
High-voltage components, i.e. Bushings, Capacitors, Cable terminations, Busbars
Page 96
Beside its usage in the
traditional power supply sector,
you can also use MPD 800 for
diagnostic PD testing on
industrial drives.
© OMICRON
© OMICRON Academy
05a-Hardware-MPD-800

PD monitoring on power cables: MONCABLO
© OMICRON
Page 97
2
Fiber optic communication3
4
5
Master control unit
Central computer & monitoring software
High frequency current
transformer (HFCT)
1
2 Data acquisition unit & enclosure
Monitoring cable terminations (example)
1 1 1
2
3
4
5
© OMICRON Academy Page 97

PD monitoring of power transformers: MONTRANO
© OMICRON
Page 98
Bushing tap adapter
3
1
2
4
5
1
2
3
UHF Sensor
data acquisition unit
tan reference4
5
6
fiber optic communication
data processing and storage
1
1
6
© OMICRON Academy Page 98
PD monitoring on generators and motors: MONGEMO
© OMICRON
Page 99
Capacitive
sensor
Data acquisition
unit in a
protected
enclosure
Central computer
and software
rotating
machine
11 1
2
3
1
2
3
© OMICRON Academy Page 99

PD monitoring on generators and motors: MONGEMO
© OMICRON
Page 100
Cluster separation and pattern classification
According to the automatically generated report, the pattern of cluster 6 can be classified
as delamination of insulation tape layers (rmS2).
© OMICRON Academy Page 100

Temporary PD monitoring: MONTESTO 200
© OMICRON
Page 101
Dry-type transformers Power transformers
OHL cable terminations MV cable terminations
GIS cable terminations Rotating machinesPower cables & accessories
MONTESTO 200
© OMICRON Academy Page 101

Temporary PD monitoring: MONTESTO 200
Periodic on-line PD measurements at assets equipped with pre-installed sensors:
Settings can be saved for each asset and retrieved whenever required
Results of multiple sessions on the same asset can be visualized and compared
© OMICRON
Page 102
Asset
Sensors
Terminal box
MONTESTO 200
© OMICRON Academy Page 102

Page 104
© OMICRON
Please take note that the contents of this presentation are
OMICRON's sole and exclusive intellectual property.
If you wish to record, copy or otherwise distribute said
contents, please request prior written consent from
OMICRON.
You should not post any webinar videos, accompanying file
content, or links to them on any public platform such as
LinkedIn, YouTube, Facebook, Twitter or any others.
CopyrightPage 104
© OMICRON Academy