Embed Size (px)
Citation preview

"One Billion High Emitters: An Individual Perspective on Emissions and Reductions"
M. Tavoni, PEICMI 9th Annual Meeting, Feb. 9th 2010

2
China/US ratio
Total Emissions Per Capita Emissions
Rio:1992 48% 10%
Kyoto:1997 55% 12%
2008 125% 30%
3
• Benchmarks for guiding the transition to a low carbon society in a continuously evolving world
• Look beyond national averages, focus on the individual– How many people emit how much now and in the future and where ?
• Estimate carbon emission distribution for 150 countries, projections for 16 regions
Proceedings of the National Academy of Sciences, July 21, 2009, vol. 106 no. 29, pp. 11884-11888
“A focus on individuals can guide nations towards a low carbon world”S. Chakravarty, R. Socolow, M. Tavoni, Climate Science and Policy, 2009
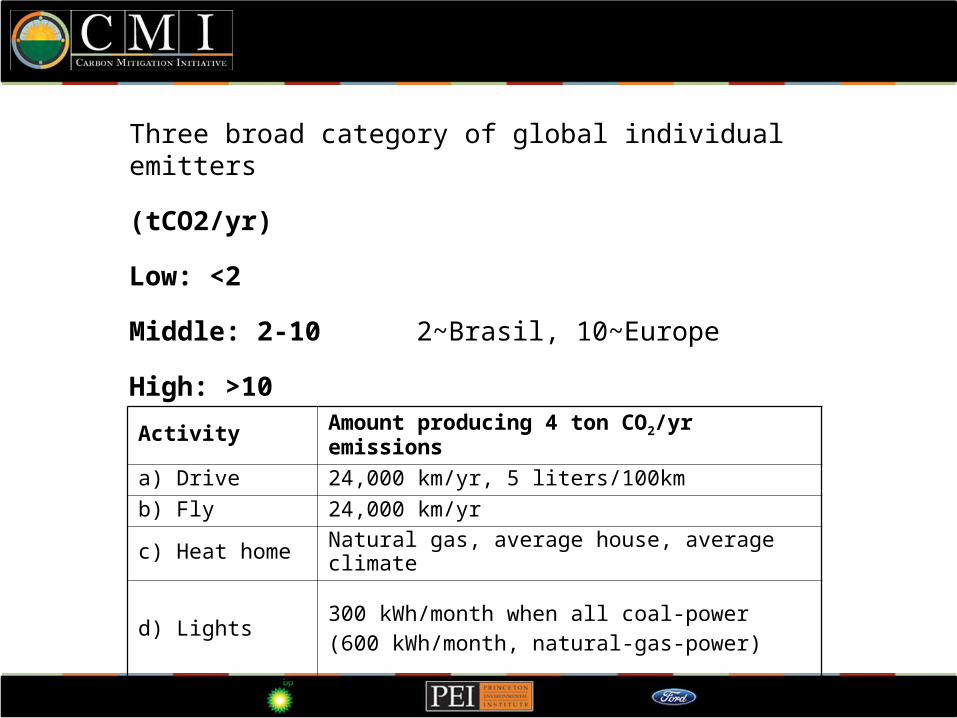
Three broad category of global individual emitters
(tCO2/yr)
Low: <2
Middle: 2-10 2~Brasil, 10~Europe
High: >10
Activity Amount producing 4 ton CO2/yr emissions
a) Drive 24,000 km/yr, 5 liters/100km
b) Fly 24,000 km/yr
c) Heat home Natural gas, average house, average climate
d) Lights300 kWh/month when all coal-power
(600 kWh/month, natural-gas-power)

Global population and emission distribution in 2003…

… and 2030

Reactions …
• press coverage
• “500 million richest people are responsible for 50 percent of emissions, while the poorest 50 percent accounts for only seven percent of emissions” H. Chavez, speech at COP15 in Copenhagen
• where are (and will be) the low, middle and high emitters ?
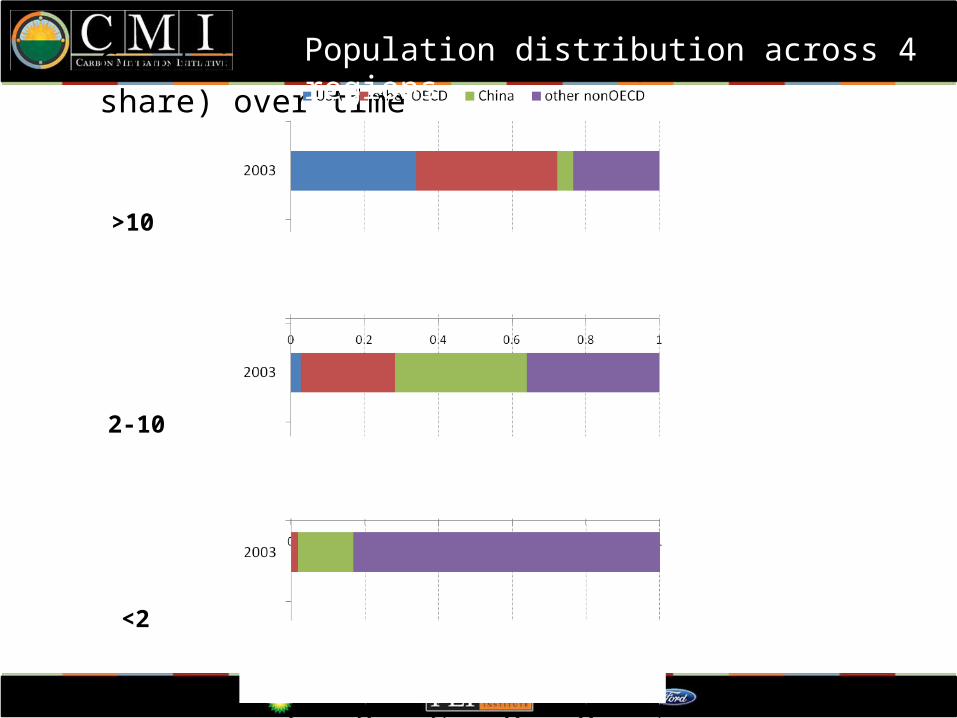
Countries responsibilities (population share) over time
2-10
<2
>10
Population distribution across 4 regions

Countries responsibilities (population share) over time
2-10
<2
>10
Population distribution across 4 regions

A look at China
Population change 2030-2003
Population in 2030
>10 +299 356
2-10 +319 922
<2 -460 175
CHINA

A look at China
Population change 2030-2003
Population in 2030
>10 +34 65
2-10 +55 145
<2 +11 65
MIDDLE EAST

A look at China
Energy Poverty: low and very low emitters in 2030

A look at China
Building a proposal for determining countries’ responsibilities to mitigation
from the individual level
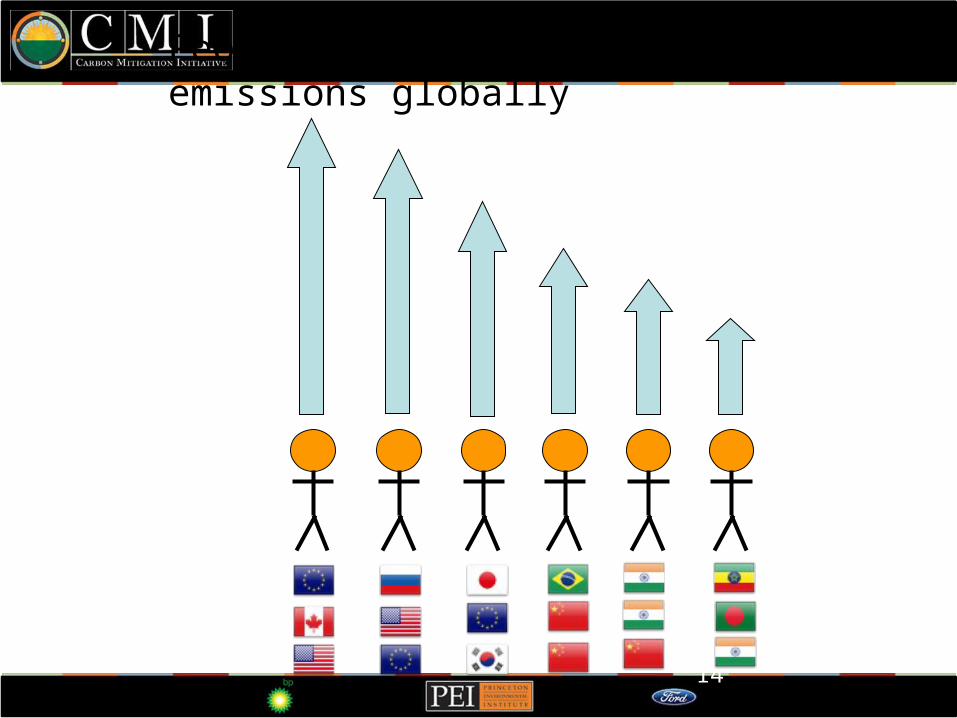
1414
People ranked by individual emissions globally

15
15
Individual Emissions Cap
15

1616
Individual Emissions Cap
Some people exceed the individual cap
16
Emissions Floor

1717
National Emissions
Target
Required Reductions Individual Emissions Cap
+ + + ++
+
=
=
People in a nation determine national cap
For example, the proposal is applied to the U.S. here.

Combine a global-emissions cap and an individual-emissions floor
Individual cap:without floor: 10.8 t CO2
with floor: 9.6 t CO2
1

Might China and the OECD reach a deal?
Dashed lines: EIA Business As UsualSolid lines: Global cap is 30 GtCO2 in 2010, 33 GtCO2 in 2020, 30 GtCO2 in 2030.
China
U.S.
Rest ofworld
Rest of OECD

• Look beyond Copenhagen: benchmark for adjusting countries responsibilities over time towards a low carbon
world
• Individual emissions can provide a useful guideline. The high emitters (>10tCO2) category is the most relevant, and
the one where the biggest regional shifts will occur
• Keep focus on the low emitters. The world’s poor do not need to be denied fossil fuels.

BACK UP slides

What does 1 tCO2/person-yr allow today?
Direct Energy Use
Household rate of use (4.5 people)
Individual emissions (kgCO2/yr)
Cooking 1 LPG canister per month
120
Transport 70 km by bus, car, motorbike per day
220
Electricity 800 kWh per year 160
Total 500
1 tCO2/yr: Double the “direct” emissions to account for “indirect” emissions.

Emissions embedded in trade(production minus consumption)
MtCO2 % of country emissions
US -439 -7.3%
Switzerland -63 -122%
Australia 57.9 16.5%
ANNEX B -822 -5.6%
MtCO2 % of country emissions
China 585 17.8%
India 71 6.9%
Mozambique
-2.8 -172.4%
NON ANNEX B
822 8.1%
Source: Peters and Hertwich, 2007

Regional emissions in 2030
30 Gt global cap, 10.8 individual cap
For a 30 GtCO2 global cap in 2030, four regions have comparable assignments
Non-OECD minus China
30 Gt global cap, 10.8 t individual cap
U.S.
China
OECD minus U.S.


![URANIUM - National Film Board of Canada1].pdf · alpha emitters are the least harmful while gamma emitters are more dangerous than beta emitters. Inside the body, however, alpha emitters](https://img.pdfslide.net/doc/110x75/604a60e06cb0dd2c8f04d503/uranium-national-film-board-of-1pdf-alpha-emitters-are-the-least-harmful-while.jpg)