Embed Size (px)
Citation preview

SPORTSCIENCE sportsci.orgPerspectives / Performance
One Hundred and Fifty Years of Rowing Faster Stephen Seiler Sportscience 10, 12-45 (sportsci.org/2006/ssrowing.htm) Agder University College, Faculty of Health and Sport, Kristiansand 4604, Norway. Email. Reviewer: Allan Hahn, Australian Institute of Sport, Belconnen, ACT 2616, Australia.
Boat velocity has increased linearly by 2-3% per decade since the first Oxford-Cambridge boat race in 1829. Part of this increase is a result of recruitment of athletes from a population that has become taller and stronger. However, the increase in boat speed attributable to increased physical dimensions alone accounts for less than 10% of the total improvement, because the increase in rower mass has increased boat drag. A 10-fold increase in training load over the last 150 years probably accounts for about one-third of the increase in physical capacity and performance. The rest of the improvement is due to reductions in boat drag, increases in oar blade efficiency, and improvements in rowing technique. Boat design was revolutionized in the 19th century, the only substantial change since then being a gradual reduction in boat weight. Oar design and construction have evolved steadily, the most recent development being the introduction of cleaver or “big” blades in 1991. Improvements in rowing technique have increased boat speed by reducing boat yaw, pitch and roll, and by improving the pattern of force application. New tools for real-time measurement and feedback of boat kinematics and force patterns are opening new approaches to training of individual rowers and to selection of rowers for team boats. KEYWORDS: elite athlete, efficiency, history, performance, power, training. Reprint pdf (2.1 MB) · Reprint doc · Slideshow (3.0 MB)
Rowing has been the focus of a great deal of
research, with attention devoted mainly to po-tential limiters and enhancers of performance of well-trained rowers. Inspired by Alejandro Lucia's tutorial lecture on the science of the Tour de France at the 2005 ACSM meeting, I proposed and was accepted to present a tutorial lecture titled 150 years of scientific enquiry into rowing and rowers for the 2006 meeting. In developing the lecture, I soon realized that there were too many isolated research topics and too many possible detours. So, I decided to focus on one central question: what can science tell us about the improvements in rowing performance over time and how they have happened?
I have modified the presentation from the original lecture format, removing a video clip and adding some explanatory notes in green
text on some of the slides. The PDF contains the slides in a printer-friendly format.
Reviewer's Comment
This wonderful presentation provides an ex-cellent summary of factors influencing rowing performance. I certainly found it very instruc-tive, even though I have been quite closely involved with rowing for more than two dec-ades. The attempt to explain why rowing times have improved so dramatically over the past 150 years provides a clear theme that elegantly links the various items of information pre-sented. Wherever possible, published references are cited, but the author has also shown a will-ingness to use current knowledge as a basis for informed surmise, and this adds an attractive dimension to the work. –Alan Hahn
Published September 2006 ©2006

13
150 Years of Rowing 150 Years of Rowing Faster!Faster!
Stephen Seiler PhD FACSMStephen Seiler PhD FACSMFaculty of Health and SportFaculty of Health and Sport
Agder University CollegeAgder University CollegeKristiansand, NorwayKristiansand, Norway
Oxford-Cambridge Boat RaceWinning Times 1845-2005
y = -0,0331x + 83,872R2 = 0,6153
14
16
18
20
22
24
26
28
1845 1865 1885 1905 1925 1945 1965 1985 2005
Year
Time (min)

14
FISA Men’s championship 1x Winning Times 1894-2004
y = -0,0137x + 34,292R2 = 0,5434
6
6,5
7
7,5
8
8,5
9
9,5
1890 1910 1930 1950 1970 1990 2010
Year
Time (min)
25-30% increasein average velocity over 150 years
of competitive rowing
What are the performance variables andhow have they changed?
How will future improvementsbe achieved?

15
DecreasePowerLosses
DecreaseDrag Forces
on Boat
Increase Propulsive Efficiency
of oar/blade
ImproveTechnicalEfficiency
IncreasePropulsive
Power
AerobicCapacity
AnaerobicCapacity
MaximalStrength
IncreasedPhysical
Dimensions
ImprovedTraining
””Evolutionary Constraints”Evolutionary Constraints”
• Race duration ~ 6-8 minutes • Weight supported activity• Oar geometry dictates relatively low cycle
frequency and favors large stroke distance to accelerate boat
• High water resistance decelerates boat rapidly between force impulses

16
TheseThese constraintsconstraints resultresult in:in:
• High selection pressure for height and arm length
• High selection pressure for absolute(weight independent) aerobic capacity
• Significant selection pressure for muscularstrength and anaerobic capacity
Ned Hanlan ca 1880173cm71kg
Biglin Brothers ca 1865180cm? 75-80kg? Ward Brothers ca 1865
185cm?80+kg?
17
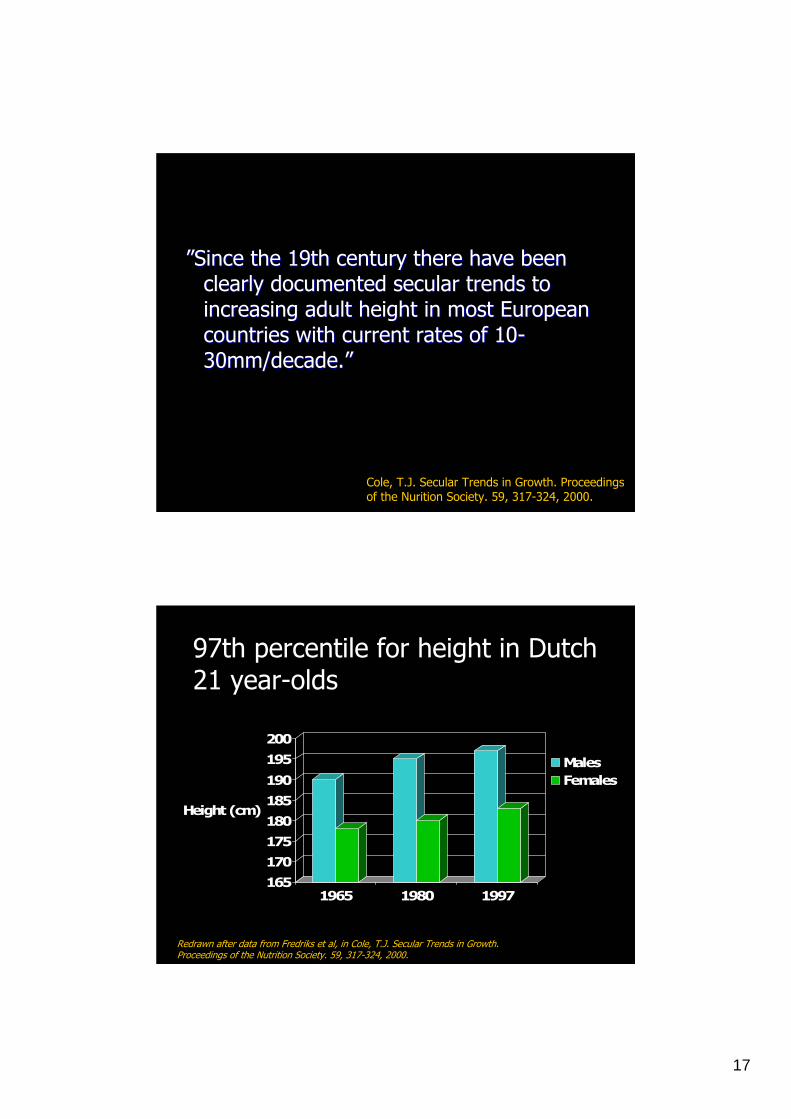
””Since the 19th century there have been Since the 19th century there have been clearly documented secular trends to clearly documented secular trends to increasing adult height in most European increasing adult height in most European countries with current rates of 10countries with current rates of 10--30mm/decade.”30mm/decade.”
Cole, T.J. Secular Trends in Growth. Proceedingsof the Nurition Society. 59, 317-324, 2000.
Redrawn after data from Fredriks et al, in Cole, T.J. Secular Trends in Growth.Proceedings of the Nutrition Society. 59, 317-324, 2000.
165170175180185190
195200
Height (cm)
1965 1980 1997
MalesFemales
97th percentile for height in Dutch21 year-olds

18
Oxford Crew-2005Average Height: 197cmAverage bodyweight98.3 kg
TallerTaller PopulationPopulation= = TallerTaller Elite Elite RowersRowers
ScalingScaling problemsproblems-- GeometryGeometry or or fractalfractal fillingfilling volumesvolumes??
Based on Geometric scaling:Strength and VO2max will increase in proportion to mass 2/3.
BUT, Metabolic rates oforganisms scale withmass3/4.
See: West, G.B et al A general model for theorigin of allometric scaling laws in biology. Science 276 122-126, 1997.

19
VOVO22 body body massmass scalingscalingin elite in elite rowersrowers
Relationship between maximaloxygen uptake and body mass for 117 Danish rowers(national team candidates)
From: Jensen, K., Johansen, L, Secher, N.H.Influence of body mass on maximal oxygenuptake: effect of sample size. Eur. J. Appl. Physiol.84: 201-205, 2001.
r = - 0.39
A key finding of this study was that VO2 scaled with body massraised to the =.73 power, or close to the 0.75 value predictedby metabolic scaling
Measuring Rowing Specific Physical Capacity
Photo courtesy of Mathijs Hofmijster, Faculty of HumanMovement Sciences, Free University Amsterdam, Netherlands

20
photos 1-4 from Miller, B. ”The development of rowingequipment” http://www.rowinghistory.net/equipment.htm
1.
2.
3.
4.
5.
The Maximum of Human The Maximum of Human Power and its FuelPower and its Fuel
From Observations on the Yale From Observations on the Yale University Crew, Winner of the Olympic University Crew, Winner of the Olympic
Championship, Paris, 1924Championship, Paris, 1924
Henderson, Y and Haggard, H.W. American J. Physiology. 72, 264-282, 1925
Height: 185 cmWeight: 82 kg
Crew average:
21
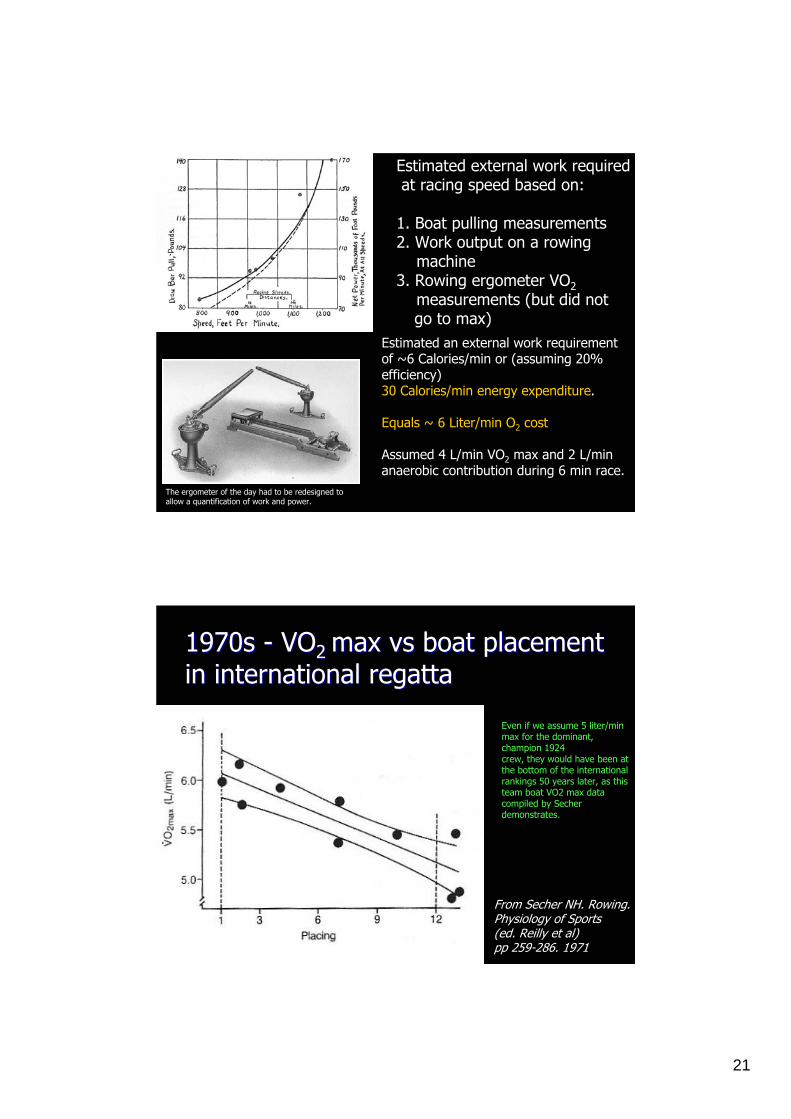
Estimated external work requiredat racing speed based on:
1. Boat pulling measurements2. Work output on a rowing
machine3. Rowing ergometer VO2
measurements (but did not go to max)
Estimated an external work requirement of ~6 Calories/min or (assuming 20% efficiency)30 Calories/min energy expenditure.
Equals ~ 6 Liter/min O2 cost
Assumed 4 L/min VO2 max and 2 L/min anaerobic contribution during 6 min race.
The ergometer of the day had to be redesigned to allow a quantification of work and power.
1970s 1970s -- VOVO2 2 max vs boat placement max vs boat placement in international regattain international regatta
From Secher NH. Rowing.Physiology of Sports (ed. Reilly et al)pp 259-286. 1971
Even if we assume 5 liter/min max for the dominant, champion 1924crew, they would have been at the bottom of the internationalrankings 50 years later, as thisteam boat VO2 max data compiled by Secher demonstrates.

22
193 cm, 92 kg 6.23 L/min VO2 cycling. Subject reached 6.1 to 6.4 L/min during repeated testing in different boats.
Jackson, R.C. and N. H. Secher.The aerobic demands of rowing intwo Olympic rowers. Med. Sci. Sports Exerc. 8(3): 168-170, 1976.
This study was unique because 1) on water measurements were madeof champion rowers and, 2) the authors of the paper WERE theChampion rowers (Niels Secher, Denmark and Roger Jackson, Canada) who went on to very successful sport science careers.
Aerobic Aerobic CapacityCapacity DevelopmentsDevelopments ??
Dr. Fred Hagerman
X
3
3,5
4
4,5
5
5,5
6
6,5
7
1860 1910 1960 2010
Year
VO2 m
ax (L
/min
)
? ?
■
7+ L/min
Ohio University
? There is just not muchdata available prior to thelate 60s, so the questionmarks emphasise thatthis is guessing. But thataerobic capacity hasincreased Is clear. Today,isolated 7 liter values VO2 maxvalues have been recorded inseveral good laboratories forchampion rowers.

23
6.3 L/min, 75 kg,85 ml/kg/min270 ml/kg0.73/min
”Typical World Class”XC skiers
7.5 L/min, 95kg, (do they exist?) 79 ml/kg/min,270 ml/kg0.73/min
Allometrically equivalent rower?
?
How much of performance improvement is How much of performance improvement is attributable to increased physical dimensions?attributable to increased physical dimensions?
2%
4%
0
1
2
3
4
5
6
Lightweight Heavyweight
Velo
city
(m/s
)
MalesFemales
Based on W Cup resultsfrom Lucerne over:
• 3 years• 3 boat types• 1st 3 places
Here I use present day differencesin boat velocity for world classlightweight and heavyweight crewsto demonstrate that the massive scale up in body size has not resulted in a proportionalincrease in boat speed, due to increased power losses associatedwith greater boat drag. Thedifference between these twoweight classes today is about thesame as the increase in body sizeobserved over 150 years

24
Rise at 7 a.m: Run 100-200yards as fast as possible
About 5:30: Start for the river and rowfor the starting post and back
Reckoning a half an hour in rowing to andhalf an hour from the starting point, and aquarter of an hour for the morning run- in all,say, one and a quarter hours.
US National US National Team trainingTeam trainingduring peak during peak loading periodloading period
3 sessions/day30+ hr/wk
From US Women’snational team 1996
180-1903 sets 4 x 4 min ON/1 min OFF in pairs
Row9:00Sun
144-17090 min steady state in fourRow3:00
140-16090 min steady state in eightRow9:00Sat
144-17090 min steady state in eightRow3:30
140-16015 kmErg10:30
120 minWeights8:00Fri
140-1483 x 20 min Erg4:00
140-14875 min (about 17500m)Erg10:30
2 sets 12 x 20 power strokes in eight
Row8:00Thurs
140-148100min steady in eightRow4:00
160-1753 x 10 lapsRun10:00
120 minWeights8:00Wed
100min Steady state in eightRow4:00
HR 15012 kilometersErg10:30
HR 180-1852 x 5x5 min ON/1 min OFF in pairs
Row8:00Tues
HR 140-144100 min Steady state in pairsRow4:00
HR 144-14870 min Steady state in pairsRow10:00
120 minWeights8:00Mon

25
Developments in training over last 3 Developments in training over last 3 decadesdecades
0
5
10
15
20
25
70s 80s 90s
hour
s. wk-1
Winter Summer
924 hrs.yr-1 966 hrs.yr-1 1128 hr.yr-15.8 l.min-1 6.4 l.min-1 6.5 l.min-1
Fiskerstrand A, Seiler KS Training and performancecharacteristics amongNorwegian international rowers1970-2001. Scand J Med SciSports. 2004 (5):303-10.
Developments in training over last 3 Developments in training over last 3 decadesdecades
0
10
20
30
40
50
60
Training hours/ month
70s 80s 90sBasic enduranceHigh intensity
Fiskerstrand A, Seiler KS Training and performance characteristics among Norwegian international rowers 1970-2001. Scand JMed Sci Sports. 2004 (5):303-10.

26
1860s 1860s -- ””AthletesAthletes HeartHeart” ” debatedebatebeginsbegins
•• 18671867-- London surgeon F.C. London surgeon F.C. SheyShey likened The Boat Race to cruelty to animals, warning that maximal effort for 20 , warning that maximal effort for 20 minutes could lead to permanent injury.minutes could lead to permanent injury.
•• 18731873-- John Morgan (physician and former Oxford crew John Morgan (physician and former Oxford crew captain) compared 251 former oarsmen with noncaptain) compared 251 former oarsmen with non--rowers rowers --concluded that the rowers had lived 2 years longer!concluded that the rowers had lived 2 years longer!
•• Myocardial hypertrophy was key topic of debate, but Myocardial hypertrophy was key topic of debate, but tools for measurement (besides at autopsy) were not yet tools for measurement (besides at autopsy) were not yet available.available.
See: Park, R.J. High Protein Diets, ”Damaged Hearts and Rowing Men: antecendents ofModern Sports Medicine and Exercise Science, 1867-1928. Exercise and Sport ScienceReviews, 25, 137-170, 1997. See also: Thompson P.D. Historical aspects of the Athletes Heart. MSSE 35(2), 364-370 2003.
BigBig--heartedhearted ItalianItalian RowersRowers -- 1980s1980s
• Of 947 elite Italian athletes tested, 16 had ventricular wall thicknesses exceeding normal criteria for cardiomyopathy. 15 of these 16 were rowers or canoeists (all international medalists).
• Suggested that combination of pressure and volume loading on heart in rowing was unique,but adaptation was physiological and not pathological.
from: Pelliccia A. et al. The upper limit of physiologic cardiac hypertrophyin highly trained elite athletes. New England J. Med. 324, 295-301, 1991.

27
From: Pelliccia et al. Global left ventricular shape is not alteredas a consequence of physiologic remodelling in highly trained athletes. Am. J. Cardiol. 86(6), 700-702, 2000
elite rower
untrained control
These ultrasound images show thehypertrophied but geometrically similarheart of an elite Italian rower compared to the smaller heart of an untrained subject.
Pelliccia et al. Remodeling of Left VentricularHypertrophy in Elite Athletes After Long-TermDeconditioning Circulation. 105:944, 2002
Myocardial adaptation toheavy endurance training wasshown to be reversed withdetraining.
The functional andmorphological changes described as the ”Athlete’s Heart” areadaptive, not pathological.

28
ForceForce productionproduction andandstrengthstrength in in rowingrowing
•• IshikoIshiko used used strainstrain gauge gauge dynamometers dynamometers mountedmounted ononthethe oarsoars ofof thethe silversilver medalmedalwinningwinning 8+ from Tokyo 1964 8+ from Tokyo 1964 to to measuremeasure peakpeak dynamicdynamicforcesforces..
•• ValuesValues werewere ofof thethemagnitude 700magnitude 700--900 N 900 N basedbasedonon thethe figuresfigures shownshown
Ishiko, T. Application of telemetry to sport activities. Biomechanics.1:138-146, 1967.
Photo from WEBA sport GMBH
1971 - Secher calculated powerto row at winning speed in 1972 championships = 450 watts (2749 kpm/min)
”In accordance with the force-velocity relationship a minimal (isometric) rowing strength of 53 ÷ 0.4 = 133 kp (1300N) will be essential.”
From: Secher, N.H. Isometric rowing strength ofexperienced and inexperienced oarsmen.Med. Sci. Sports Exerc.7(4) 280-283, 1975.
How Strong do Rowersneed to be?

29
Force production and rowing Force production and rowing strengthstrength
From: Secher, N.H. Isometric rowing strength ofexperienced and inexperienced oarsmen.Med. Sci. Sports Exerc.7(4) 280-283, 1975.
Measured isometric force in7 Olympic/world medalists,plus other rowers andnon-rowers
Average peak isometric force(mid-drive): 2000 Nin medalists
NO CORRELATIONbetween ”rowing strength”and leg extension, back extension, elbow flexion, etc.
DecreasePowerLosses
DecreaseDrag Forces
on Boat
Increase Propulsive Efficiency
of oar/blade
ImproveTechnicalEfficiency
IncreaseTotal Propulsive
Power
AerobicCapacity
AnaerobicCapacity
MaximalStrength
PhysicalDimensions
?
ImprovedTraining
?

30
DecreasePowerLosses
DecreaseDrag Forces
on Boat
Increase Propulsive Efficiency
of oar/blade
ImproveTechnicalEfficiency
3456789
101112131415
3 3.5 4 4.5 5 5.5 6 6.5 7
1x Boat Velocity (m/sec)
Oxy
gen
Dem
and
(l/m
in)
Boat Velocity – Oxygen Demand Relationship
Boat velocityrange for Men’sand women’s 1x
This figure shows that achieving a 10% increase in average boat velocitywould require an impossibly large increase in aerobic capacity. Thismeans that any revolutionary boat velocity increases in the future must beachieved by decreasing power losses (boat drag for example).

31
Drag Forces on the Boat and RowerDrag Forces on the Boat and Rower
•• Boat Surface DragBoat Surface Drag -- 80% of 80% of hydrodynamic drag (depends on hydrodynamic drag (depends on boat boat shapeshape and and total wetted surface areatotal wetted surface area))
•• Wave drag contribution smallWave drag contribution small -- <10%<10%of hydrodynamic dragof hydrodynamic drag
•• Air resistanceAir resistance –– normally <10% of normally <10% of total drag, depends on crosstotal drag, depends on cross--sectional area of rowers plus shellsectional area of rowers plus shell
In-rigged wherrytypical of thoseused in racingprior to 1830
figures from Miller, B. ”The development of rowing equipment”http://www.rowinghistory.net/equipment.htm

32
All All radicalradical boatboat form form improvementsimprovementscompletedcompleted by 1856.by 1856.
• 1828-1841. Outrigger tried byBrown and Emmet, and perfectedby Harry Clasper
• Keel-less hull developed by William Pocock and Harry Clasper1840-1845
• Thin-skin applied to keel-less frameby Matt Taylor- 1855-56
photo and timeline from Miller, B. ”The development of rowingequipment” http://www.rowinghistory.net/equipment.htm
• Transition to epoxy and carbon fiberboats came in 1972. Boat weight of8+ reduced by 40kg
EffectEffect ofof reductionreduction in in BoatBoat WeightWeightonon boatboat velocityvelocity
∆V/V = -(1/6) ∆ M/Mtotal
Example: Reducing boat+oar weight from32 to 16kg = 2.4% speed increase for 80 kg19th century rower.
From: Dudhia, A Physics of Rowing.http://www-atm.physics.ox.ac.uk/rowing/physics/
V= boat velocityM = Mass∆V= Change in Velocity∆M= Change in Mass

33
To achieve a radical reduction in drag forceson current boats, they would have
to be lifted out of the water!
To run this video, download it to the same directory from http://sportsci.org/2006/flyak.wmv (7.4 MB)
Video of a hydrofoil kayak with two submerged wings. See http://www.foilkayak.com/

34
DecreasePowerLosses
DecreaseDrag Forces
on Boat
Increase Propulsive Efficiency
of oar/blade
ImproveTechnicalEfficiency
Oar movement translates rower Oar movement translates rower power to boat velocitypower to boat velocity
Figure from:
Baudouin, A. & Hawkins D.A biomechanicalreview of factorsaffecting rowingperformance. British J. Sports Med. 36: 396-402
BoatTravel

35
The slide properly used is a decidedadvantage and gain of speed, and onlyobjection to its use is its complication and almost impracticable requirement of skill and unison in the crew, rather than anypositive defect in its mechanical theory.
J.C. Babcock 1870
1876 Centennial Regatta, Philadelphia, Pennsylvania. London Crew winning heat

36
Photo from www.concept2.com
Boat direction
From: Nolte, V. Die Effektivitat des ruderschlages. 1984in: Nolte, V ed. Rowing Faster. Human Kinetics, 2005
A common conception of the oar blade-water connection is that it is solid, but it is not. Water is moved by the blade. Energy is wasted inmoving water instead of moving the boat as the blade “slips”through the water. Much or oar development is related to improving blade efficiency and decreasing this power loss. However,the improvement has been gradual, in part due to technological limitations in oar construction.
Oar hydrodynamic efficiency- propelling propelling the boat but not the waterthe boat but not the water
E hydro = Power applied rower – Power loss moving water
Power applied rower
Oar power loss = blade drag force * blade velocity (slip)
Power applied = Force Moment at the oar * oar angular velocity
Affeld, K., Schichl, Ziemann, A. Assessmentof rowing efficiency Int. J. Sports Med. 14 (suppl 1): S39-S41, 1993.

37
OarOar EvolutionEvolution
Macon blade-woodenshaft 1960-1977
Macon Blade-carbon fiber shaft1977-1991
Cleaver blade –ultra light carbon fiber shaft1991-
”Square” and”Coffin” blades1906
Square loomedscull 1847
Affeld, K., Schichl, Ziemann, A. Assessment of rowing efficiencyInt. J. Sports Med. 14 (suppl 1): S39-S41, 1993.
Big blades foundto be 3% morehydrodynamicallyefficient comparedto Macon blade
?

38
RowerRower//tinkerertinkerer//scientists?scientists?--TheThe DreissigackerDreissigacker BrothersBrothers
All pictures from www.concept2.com in exchange for unsolicited and indirectendorsement!
EffectEffect ofof ImprovedImproved OarsOars onon boatboatspeed?speed?
• Kleshnev (2002) used instrumented boatsand measurement of 21 crews to estimate an 18% energy loss to moving water by blade
• Data suggests 2-3% gain in boat velocity possiblewith further optimization of oar efficiency (30-50% of the present ~ 6 % velocity loss to oar bladeenergy waste)

39
RowingRowing TechniqueTechnique::”Ergs ”Ergs don’tdon’t float”float”
DecreasePowerLosses
DecreaseDrag Forces
on Boat
Increase Propulsive Efficiency
of oar/blade
ImproveTechnicalEfficiency

40
ImproveTechnicalEfficiency
Decreasevelocity
fluctuations
Optimize/SynchronizeForce
Curves
MinimizeBoat
Yaw, Pitch and Roll
Larger fluctuations require greater propulsive power for same average velocity
Decreasing Velocity Fluctuations
Figure from Affeld et al. Int. J. Sports Med. 14: S39-S41, 1993
Sources
• Pulsatile Force application
• Reactions to body massacceleration in boat
41
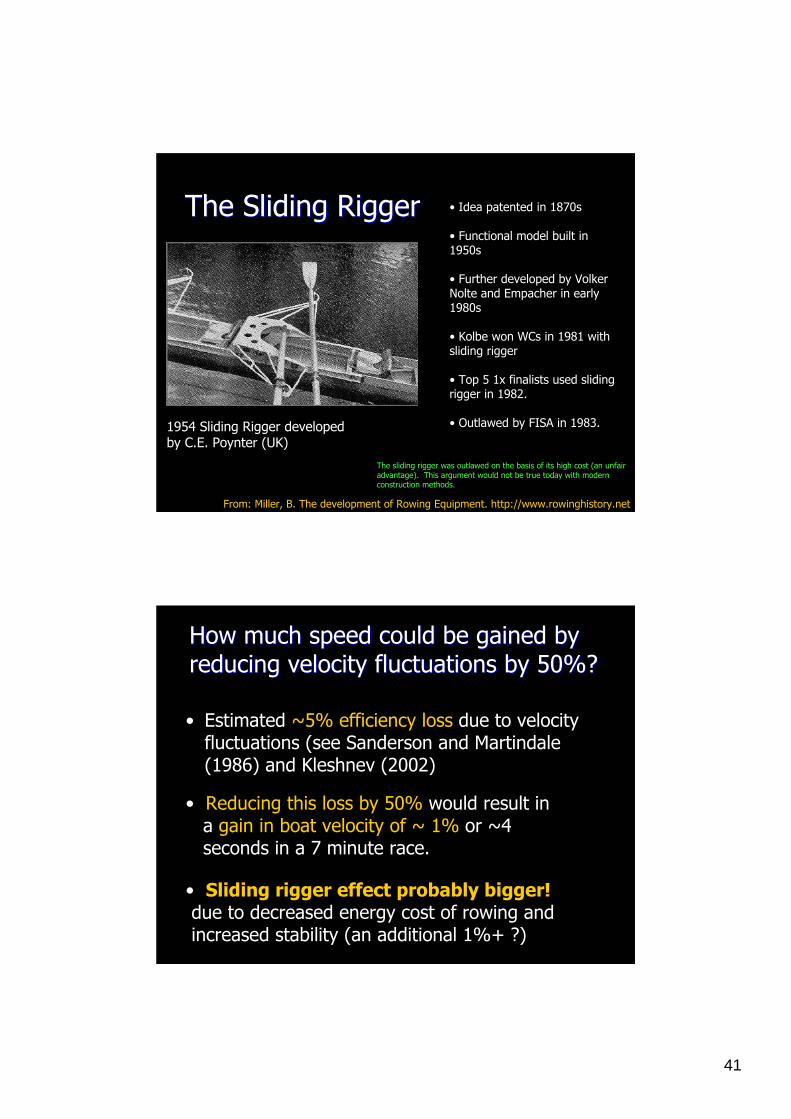
TheThe SlidingSliding RiggerRigger
1954 Sliding Rigger developedby C.E. Poynter (UK)
From: Miller, B. The development of Rowing Equipment. http://www.rowinghistory.net
• Idea patented in 1870s
• Functional model built in 1950s
• Further developed by Volker Nolte and Empacher in early 1980s
• Kolbe won WCs in 1981 with sliding rigger
• Top 5 1x finalists used sliding rigger in 1982.
• Outlawed by FISA in 1983.
The sliding rigger was outlawed on the basis of its high cost (an unfairadvantage). This argument would not be true today with modern construction methods.
How much speed could be gained byHow much speed could be gained byreducing velocity fluctuations by 50%?reducing velocity fluctuations by 50%?
• Estimated ~5% efficiency loss due to velocity fluctuations (see Sanderson and Martindale (1986) and Kleshnev (2002)
• Reducing this loss by 50% would result ina gain in boat velocity of ~ 1% or ~4seconds in a 7 minute race.
• Sliding rigger effect probably bigger!due to decreased energy cost of rowing andincreased stability (an additional 1%+ ?)

42
Better Boat Balance?Better Boat Balance?
0.3 to 0.5 degrees50% of variability attributableto differences in rower mass
0.1 to 0.6 degrees. 0.5 degrees = 2.5 cm bow movement
0.3 to 2.0 degrees. Highest variabilitybetween rowers here
Smith, R. Boat orientation and skill level in sculling boats. CoachesInformation Service http://coachesinfo.com/
TheThe RowingRowing Stroke Stroke ForceForce CurveCurve--A A uniqueunique signaturesignature
From: Ishiko, T. Biomechanics of Rowing. Medicine and Sportvolume 6: Biomechanics II, 249-252, Karger, Basel 1971
”Oarsmen of a crew try to row in the same manner and they believe that they are doing so. But from the data it may be concluded that this is actually not true.”

43
From Schneider, E., Angst, F. Brandt, J.D. Biomechanicsof rowing. In: Asmussen and Jørgensen eds.Biomechanics VI-B Univ. Park Press, Baltimore, 1978.pp 115-119.
A ”Good Crew”
”A new crew with visible success”
2 juniors with ”only 1 year experiencein the same boat”
Rowers 1 and 2 have very similar force curves, showing that thetiming of blade forces in the two rowers is well matched. Rowers 3 and 4 are quite different from 1 and 2, reaching peakforce earlier in their stroke. They are similar to each otherthough, perhaps explaining their ”visible success”. Rowers 7 and 8 show markedly different stroke force profiles, with rower 7 reaching peak force late in the stroke.
From: Wing, A.M. and Woodburn, C. Thecoordination and consistency of rowers in a racing eight. Journal of Sport Sciences. 13, 187-197, 1995
Rowing Together: Synchronizing force Rowing Together: Synchronizing force curvescurves
Fatigue changes the amplitudeof the curve, but not its shape.
Changing rowers in the boat did not change the force curves of the other rowers, at least not in the short term.

44
Is there an optimal force curve?Is there an optimal force curve?
• For a 1x sculler: perhaps yes, one that perhaps yes, one that balances hydrodynamic and physiological balances hydrodynamic and physiological constraints to create a personal optimum.constraints to create a personal optimum.
• For a team boat: probably no single probably no single optimum exists due to interplay between optimum exists due to interplay between biomechanical and physiological biomechanical and physiological constraints at individual level.constraints at individual level.
see also: Roth, W et al. Force-time characteristics of the rowing stroke and correspondingphysiological muscle adaptations. Int. J. Sports Med. 14 (suppl 1): S32-S34, 1993
Contribution of rowing variables toincreased velocity over 150 years
Increased PhysicalDimensions - 10%
ImprovedTraining – 33%
Improved Boat Design/reduced dead weight – 12%
Improved hydrodynamicefficiency of oar – 25%
Sliding Seat/Evolved RowingTechnique – 20%
This is my best estimate of the relative contribution of the different performance variablesaddressed to the development of boat velocity over 150 years. Future improvements are probably bestachieved by further developments in oar efficiency, and perhaps the return of the sliding rigger!

45
Thank You!
This is Oxford. They won.
This is Cambridge. They…didn’t.