Embed Size (px)
Citation preview
1
One Man's Advice on the Determination of Dissolved Oxygen in Seawater
Lou Codispoti
April 1988 Introduction
With the exception of salinity determinations, dissolved oxygen is probably the most commonly measured chemical oceanographic variable. Usually, dissolved oxygen is determined by some modification of the classic Winkler (1888) method. Range of Oceanic Dissolved Oxygen Concentrations
Dissolved oxygen concentrations are generally expressed in millimolar, µMoles/kg, mg-atoms/liter or ml/liter (mg-atoms of O2/liter = 0.08931 x ml/liter). Values from 0 to >13 ml/liter are encountered in the ocean. The equilibrium solubility values for dissolved oxygen increase with decreasing temperature, and salinity, and they range from about 4 to 9 ml/liter throughout most of the ocean. Generally, biological processes are responsible for the wide range of values which are encountered. Phytoplankton growth, for example, can cause oxygen supersaturations while respiratory processes can remove all of the oxygen originally present in some water masses. Chemistry of the Winkler Method
Manganous sulfate (or chloride) solution is added to a known quantity of seawater and is immediately followed by the addition of an alkaline sodium hydroxide-sodium iodide solution. Manganous hydroxide precipitates and reacts with the dissolved oxygen in the water with the formation of a hydrated tetravalent oxide of manganese. Mn++ + 2OH– Mn(OH)2 (S) 2MN(OH)2 + O2 2MnO(OH)2 (S) Upon acidification, the manganese hydroxides dissolve. In the acid solution, the tetravalent manganese in MnO(OH)2 acts as an oxidizing agent and liberates free iodine from the iodide ions. Mn(OH)2 + 2H+ Mn++ + 2H2O MnO(OH)2 + 4H+ + 2I– Mn++ + I2 + 3H2O
2
The liberated iodine, equivalent to the dissolved oxygen present in the water, is then titrated with a standardized sodium thiosulfate solution and the dissolved oxygen present in the sample is calculated. The reaction involved is as follows: I2 + 2S2O3
= 2I– + S4O6=
(thiosulfate) (tetrathionate) Accuracy of the Winkler Method
Under ideal conditions, the Winkler method is quite accurate. Carpenter (1965a), for example, has described one modification which has an accuracy of 0.1%, and using the Winkler method he (Carpenter, 1966) has produced a set of oxygen solubility tables which appears to be accurate within ~0.01 ml/liter (Murray and Riley, 1969). The field adaptation of Carpenter's technique (1965b) probably should have an accuracy of better than 0.05 ml/liter when carefully performed. (This estimate includes standardization, and "pickling" errors. Precision should be significantly better than 0.05 ml/l.)
Unfortunately, much of the historical oxygen data has been obtained using unsuitable variations of the Winkler method and/or by unskilled analysts. A study conducted several years ago indicated that errors approaching 0.5 ml/liter may be common in the historical data (Carritt and Carpenter, 1966). Such errors sometimes make it impossible for oceanographers to use existing oxygen data. Wust (1964), for example, could not compare oxygen data from different cruises in his study of the Caribbean Sea. The Carpenter Modification of the Winkler Method
Carpenter's (1965b) modification of the Winkler method was designed to reduce the following errors:
1. Iodine Volatilization. Loss of the iodine produced after the sample has been acidified has been shown to be one of the most significant errors in some previous techniques. One way in which Carpenter's method reduces this error is by eliminating sample transfers which could contribute to iodine losses. This is done by using the apparatus shown in Fig. 1. Because the entire sample is titrated in the original collection flask, no transfers are necessary. Another advantage of this approach is that the collection flasks can be calibrated for volume with much greater accuracy than can usually be obtained when taking aliquots from the sample flask.
In Carpenter's method, loss of iodine during exposure to the atmosphere is also minimized by encouraging the formation of the less volatile triiodide complex (I3
–). This is done by using a high concentration of sodium iodide solution encouraging the formation of the triiodide complex according to the following formula:
I2 + I– I3
–
3
2. Air Oxidation of Iodide. Iodide reacts with oxygen in acidic solution: 4I– + 4H+ + O2 2I2 + 2H2O To minimize this source of error, the optimum pH to permit the proper reaction between
thiosulfate and iodine and prevent the above reaction was determined. The optimum pH range was found to be 2.0-2.5 and the reagent concentrations were adjusted to attain a final pH in the appropriate range.
3. Improper Blank Determinations. In most previous methods, allowance was made only for positive blanks, but negative blanks caused by reducing impurities are also possible. Consequently, a method for determining positive and negative blanks was devised. This procedure will be described below.
4. Improper Standards. It was found that potassium dichromate, which had been used in some methods, was not a suitable standard. The best standard is potassium iodate, but potassium biiodate can also be used if it is dried by vacuum dessication. Potassium iodate can be dried in an oven at ~110°C. Comparison experiments indicate that the error introduced by not using the glassware necessary to eliminate transfers is less than 0.05 ml/liter if aliquots are drawn with care and the Carpenter reagents are employed. Preparation of Reagents Reagent Bottles. The reagent bottles used for the manganous sulfate (or chloride), potassium hydroxide-iodide, and sulfuric acid should be such that automatic filling of the pipets is possible. In order to prevent photochemical reactions, the alkaline iodide reagent bottles should be of brown glass or else the exterior painted black. Manganous Chloride. Dissolve 600 g of reagent grade MnCl2•4H2O in distilled water. Adjust final volume to 1 liter. Manganous sulfate may be substituted for the chloride, but the chloride is suggested because of its solubility and its freedom from higher valence manganese compounds. When substituting manganous sulfate on a form of MnCl with more or fewer waters of hydration than in MnCl2•4H2O, adjust for differences in formula weight. Alkaline Sodium Iodide. Dissolve 320 g of reagent grade NaOH and 600 g of reagent grade NaI in distilled water. Dilute to 1 liter. Sulfuric Acid. Make up 280 ml of concentrated reagent grade H2SO4 to 1 liter with distilled water. Use caution, as a great deal of heat is liberated! Starch Solution. Dissolve 1-2 g of starch indicator in 100 ml of distilled water, or boil a similar amount of potato starch in distilled water for about 5 minutes. The indicator should be made up fresh every day if possible since bacterial action degrades it. One sign of a degraded indicator is a reddish tinge to the normally blue color. It is permissible to "play around" with the starch concentration a bit to produce an indicator color intensity that meets your personal preferences!
4
Sodium Thiosulfate Solution. Dissolve 1.6 g for the Aliquot method (see below) or 35 g (for the Carpenter method) of reagent grade Na2S2O3•5H2O in 1 liter of distilled water. Add 1 pellet of NaOH and 2 drops of chloroform. Let stand (preferably for a few days) before using. NOTES: a. The sodium hydroxide is added to negate the influence of any dissolved CO2 as the presence of carbonic acid causes the following reaction: S2O3
= + 2H+ S + SO2 + H2O b. Sodium thiosulfate is degraded by the action of bacteria. Chloroform is added to prevent bacterial growth. Primary Standard. Dissolve 0.3567 g of oven dried (~105-110°C) KIO3 or 0.3250 g of KH(IO3) dried in a vacuum dessicator in distilled water. Make up to exactly 1 liter. This solution is 0.01000 N. NOTE: KIO3 is preferred because of its stability during drying. KH(IO3)2 (BI-IODATE) decomposes at temperatures above ~100°C. Standardization of the Thiosulfate The thiosulfate solution should be standardized under the same conditions as the actual procedure for the determination of dissolved oxygen. By so doing, possible errors are compensated. The best practice is to run standards and blanks before and after every sample run until you are sure that the interval between standard runs can be extended. To about 40 ml of distilled water add 1 ml of the H2SO4 reagent. Mix thoroughly. Add 1 ml of the NaOH•NaI solution. Mix and wash down the sides of the flask thoroughly. The solution should be distinctly acid, clear and colorless. If any basic microenvironments exist at this point due to insufficient washing of the reagents into the bottle and insufficient stirring, you will obtain poor results. Make good use of your wash bottle and stirring motion before going on! Add 1 ml MnCl2 reagent and, after mixing, pipet into the flask 10 ml of the standard (BI) iodate solution. Stir for ~5 sec. Then titrate with thiosulfate in the same manner described below for samples. IO3
– + 5I– + 6H+ 3I2 + 3H2O
10 ml KIO3 x 0.0100 N
[ml Na2S2O3 – B] = Normality of Na2S2O3
where 0.01000 is the normality of the iodate solution, and B = Blank. Often, it is preferable to weigh out standards that are not exactly 0.01000 N because striving for an exact weight takes extra time and tends to make the weighing process less exact. It is, of course, a simple matter to substitute a different normality when performing your calculations. Blank Determination. This procedure is the same as the standardization procedure except
5
that exactly 1 ml of the standard KIO3 is added instead of 10 ml, and, after the first titration, another 1 ml of standard is added and the solution is titrated again. The blank is equal to the ml of thiosulfate needed for the first titration minus the ml of thiosulfate needed for the second titration. The blank may be either positive or negative. Sample Collection and Treatment Samples for the determination of dissolved oxygen should be taken from the water sampling bottle immediately upon its arrival on deck. The sample should be collected in a calibrated, ground glass-stoppered container. Two types may be used—bottles approximating 250 ml and bottles approximating 125 ml. In the case of the latter, the entire contents of the flask is eventually used for titration while with the former, an aliquot is taken. We generally use 125 ml (approx.) clear glass bottles that are calibrated to contain with an accuracy of ±0.04 ml and titrate the entire bottle as suggested by Carpenter (1965). To fill the oxygen bottle from the oceanographic sampling bottle (e.g., a Niskin bottle), you will need a length of amber surgical tubing (or similar material) with an inside diameter of approximately 1/4". The length of this tubing should be approximately 12", but keep the length as short as you can without sacrificing ease of movement while filling the oxygen bottle. To one end of this tubing attach a length of stiff plastic tubing or glass tubing that is a bit longer than the oxygen bottle. You are now ready to begin the challenging task of drawing a high quality oxygen sample without contamination while bathed in an atmosphere that is about 21% oxygen!! Believe it or not, it can be done, and with a bit of practice you can do it! A method that I have used will be described next, but remember the principle, which is to minimize contact of the seawater sample with the atmosphere. With this basic principle in mind, you can modify my technique to fit your particular blend of motor skills. When I draw an oxygen sample, I proceed as follows: 1) Attach the soft tubing to the spigot of the Niskin (or other type of bottle), and open the air vent on the Niskin bottle. 2) Open the spigot valve and flush the sampling tubing so that all air bubbles are removed. I find that the easiest way to do this is to hold the tubing in a straight line (more or less) and point the tubing downward while letting water flow through the tubing at maximum velocity for a brief period. At this point, you control the velocity of flow by pinching the soft tubing with your fingers. If the tubing is not completely free of bubbles after the first brief period of maximum velocity, repeat the process one or more times by turning the flow on and off by pinching and unpinching the rubber tubing. Some investigators prefer to try to remove the bubbles from the tubing by holding it in a U-shape with the open end up and letting the water flow gently through the tubing. Any method or combination of methods that removes all of the bubbles from the tubing is OK.
6
3) The next step is to rinse your oxygen bottle while minimizing contact with the atmosphere. I do it by allowing the water to flow at a moderate pace out of the bubble-free tubing, inserting the tubing so that the stiff portion touches the bottom of the bottle, and then inverting the bottle. While in the inverted position, I move the stiff part of the tubing around so that a moderate "sheet flow" rinses the entire bottle with minimal turbulence. 4) Next, I momentarily stop the flow by pinching the tubing and invert the bottle quickly. Then I start a moderate flow again and let the bottle fill as quickly as possible without forming a lot of turbulence while keeping the stiff part of the tubing near the bottom of the bottle. As the bottle begins to overflow, I let the overflow water rinse the ground glass stopper. After about half a bottle volume has overflowed, I begin to withdraw the tubing from the bottle by steadily raising while allowing another bottle volume (approx.) to overflow and continue to rinse the stopper. 5) Now I immediately add 1 ml of the manganous reagent by placing the tip of the delivery pipet just below the surface of the sample in the oxygen bottle. This step is immediately followed by the addition (in like manner) of the alkaline-iodide reagent. Both reagents are very much denser than seawater, and they sink to the bottom and displace the upper 2 ml of seawater in the bottle, which is helpful since the upper water has been in contact with the atmosphere. It is best not to immerse more than about 1/8" of the tips of the delivery pipets since this should help to cut down on contamination. Not immersing the tips at all increases the possibility of contamination from the atmosphere. 6) Now place the stopper in the bottle without trapping bubbles. I have found that the easiest way is also the way that works the best. Just drop the stopper into the bottle from a height of about one inch! If you place the stopper in the bottle slowly and carefully, you are more likely to trap a bubble. The stopper displaces the upper few ml of liquid in the neck of the bottle, thereby removing most of the atmospheric contamination that may have accumulated. 7) Now push down on the stopper to make sure that it is tight, and closely inspect the bottle to make sure that it is free of bubbles. A bubble the size of a pencil eraser will completely invalidate any sample, and much smaller bubbles can also totally ruin a sample depending on ambient concentrations and the accuracy that you desire. The best rule of thumb is to start over again if you can see a bubble in your sample even though there exist exceptional situations in which heating or the addition of the first two reagents can cause bubbles to form within the sample. 8) Now invert the bottle several times to mix the first two reagents with the sample. A precipitate will form. Allow the precipitate to settle, and repeat the mixing process one time. Generally, you should wait at least 15 minutes before repeating this mixing process. If you are using the Carpenter method (which we prefer), your sampling bottle will be a calibrated (for volume) bottle made out of clear glass. Because of the possibility of undesirable photochemical reactions, it is important that you keep the bottle in the dark as much as possible. We accomplish this by placing the bottles in a carrying case (which is painted black on the inside) in between manipulations. Also try to keep the samples cool (i.e., in the shade). 9) The next step is to add the acidic reagent. Some prefer to do this immediately after the precipitate in the oxygen bottle has settled for the second time, and others prefer to do it just before beginning the oxygen titration. I have uncovered no convincing evidence that favors one technique over the other, but I prefer to add the acid fairly soon after the second settling and have had good success with this approach. In the Carpenter version of the Winkler method, the reagents are adjusted so that the final pH is between 2 and 2.5.
7
This range of pH minimizes unwanted side reactions but is just barely acid enough to dissolve the precipitate. If the precipitate is not completely dissolved when you are about to start your titration, just add another drop of acid. NOTES: a. Occasionally after the addition of sulfuric acid, a gas bubble will appear. This bubble is composed largely of carbon dioxide and a little nitrogen which may have been liberated from the solution. The former results from the chemical reaction of the acid and carbonates. The presence of the nitrogen is accounted for by the reduced solubility of this gas upon the addition in electrolytes of the reagents and the possible increased temperature of the sample. b. In running determinations of dissolved oxygen on fresh or slightly brackish waters, considerable difficulty may be experienced in obtaining complete solution of precipitate. However, solution may readily be affected by the addition of a few crystals of sodium chloride to the acid solution. c. In limnological studies, the use of hydrochloric acid may be substituted for the sulfuric acid. (Concentrated HCL is 12N and concentrated H2SO4 is 36N.) Titration of Samples If an aliquot of sample is drawn from a ~250 ml brown glass bottle, the buret used for measuring the quantity of standard sodium thiosulfate solution should deliver 25 ml and be graduated to 0.05 ml. Readings of the buret should be made to 0.01 ml. If a large number of samples are to be titrated, it is a marked convenience to have an arrangement so that the buret may be filled by gravity with an automatic adjustment to the zero point. If an aliquot of the sample is taken for titration, a measured volume of 100 ml is titrated in an Erlenmeyer flask with a standardized thiosulfate solution introduced from the buret. About 1 ml of the starch indicator solution is added and the solution titrated until the blue starch-iodine color disappears. When the blue color just disappears, read the buret. The starch is generally not introduced until the solution is a fairly pale yellow which means about 1/2 to 2/3 of the way through the titration for most samples. When samples are taken from low oxygen zones they will, however, be a pale yellow color at the beginning of the titration. We have seen no compelling evidence to suggest any differences due to the point at which the starch is introduced as long as it is before the end point! It is difficult to describe how to detect the end-point on the printed page, and my advice is to try to have an experienced analyst demonstrate this for you. In case you cannot find an experienced and competent analyst, here is a method that should work. 1) As the blue color begins to disappear, start to add the thiosulfate in small increments and begin to record the buret readings. 2) If your eyes are like mine, you will not see too much color change near the end-point. Instead, the solution will become progressively clearer and/or brighter. 3) Keep on adding thiosulfate until you no longer see changes in clarity and/or brightness upon the addition of more thiosulfate. 4) The reading that corresponds to the last thiosulfate addition that caused a visible change is the end-point! 5) Do not allow your desire to obtain the best end-point cause the titration to take too much time! See note (b) below. With the Aliquot method, the dissolved oxygen concentration is calculated from the following equation:
8
DO = [R – Rblk ] VIO3
• NIO3 • E
[Rstd – Rblk ] Vs – Vreg • VsVb
– DO reg •125 ml
Vb
where DO = dissolved oxygen (ml/liter) R = sample titration buret reading Rblk = difference between blank titration buret readings (i.e., the blank value) Rstd = standardization buret reading VIO3 = volume of primary standard (ml) Vb = volume of sample bottle (ml) Vs = volume of titration aliquot (ml) Vreg = volume of sample displaced by reagents (2 ml for this method) NIO3 = normality of primary standard E = 5,598 ml O2/equivalent DOreg = 0.018 ml/liter, the amount of oxygen added with the reagents if you were using the 125 ml flasks recommended by Carpenter (1965b). NOTES: a. Since the precipitate containing the dissolved oxygen has settled before the addition of the H2SO4, only 2 ml of sample are displaced by reagent additions.
9
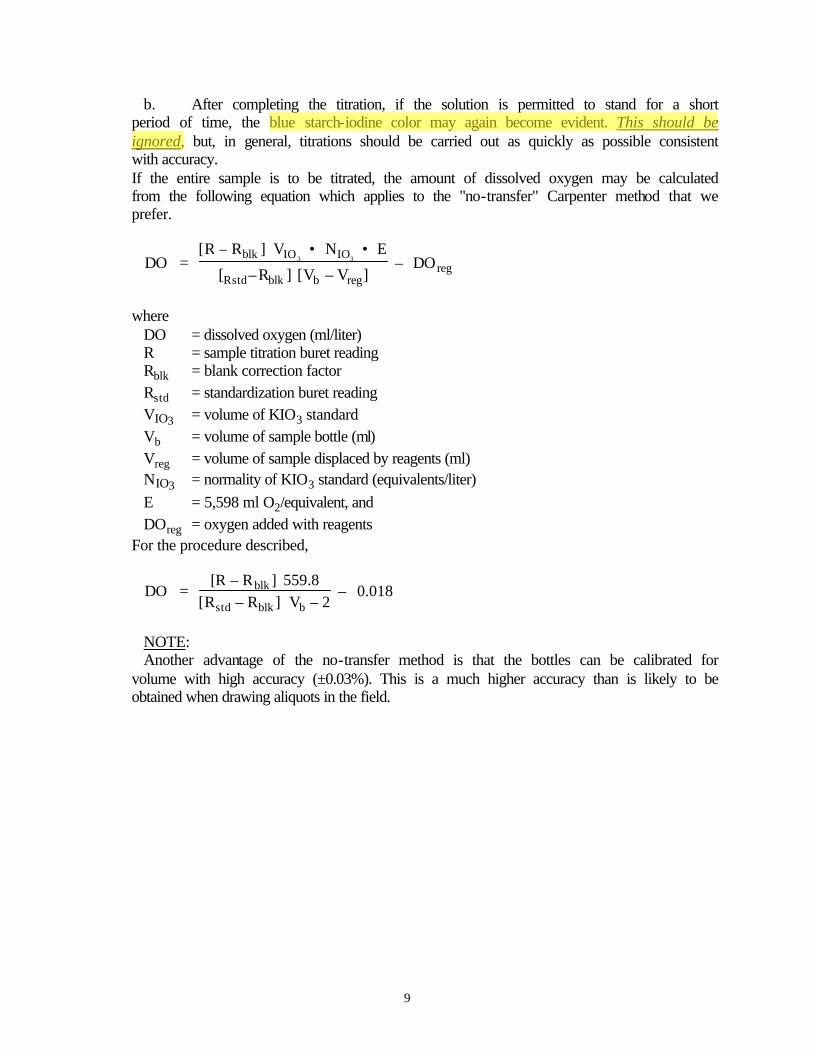
b. After completing the titration, if the solution is permitted to stand for a short period of time, the blue starch-iodine color may again become evident. This should be ignored, but, in general, titrations should be carried out as quickly as possible consistent with accuracy. If the entire sample is to be titrated, the amount of dissolved oxygen may be calculated from the following equation which applies to the "no-transfer" Carpenter method that we prefer.
DO = [R – Rblk ] VIO 3
• NIO3 • E
[Rstd–Rblk ] [Vb – Vreg] – DO reg
where DO = dissolved oxygen (ml/liter) R = sample titration buret reading Rblk = blank correction factor Rstd = standardization buret reading VIO3 = volume of KIO3 standard Vb = volume of sample bottle (ml) Vreg = volume of sample displaced by reagents (ml) NIO3 = normality of KIO3 standard (equivalents/liter) E = 5,598 ml O2/equivalent, and DOreg = oxygen added with reagents For the procedure described,
DO = [R – Rblk ] 559.8
[Rstd – Rblk ] Vb – 2 – 0.018
NOTE: Another advantage of the no-transfer method is that the bottles can be calibrated for volume with high accuracy (±0.03%). This is a much higher accuracy than is likely to be obtained when drawing aliquots in the field.
10
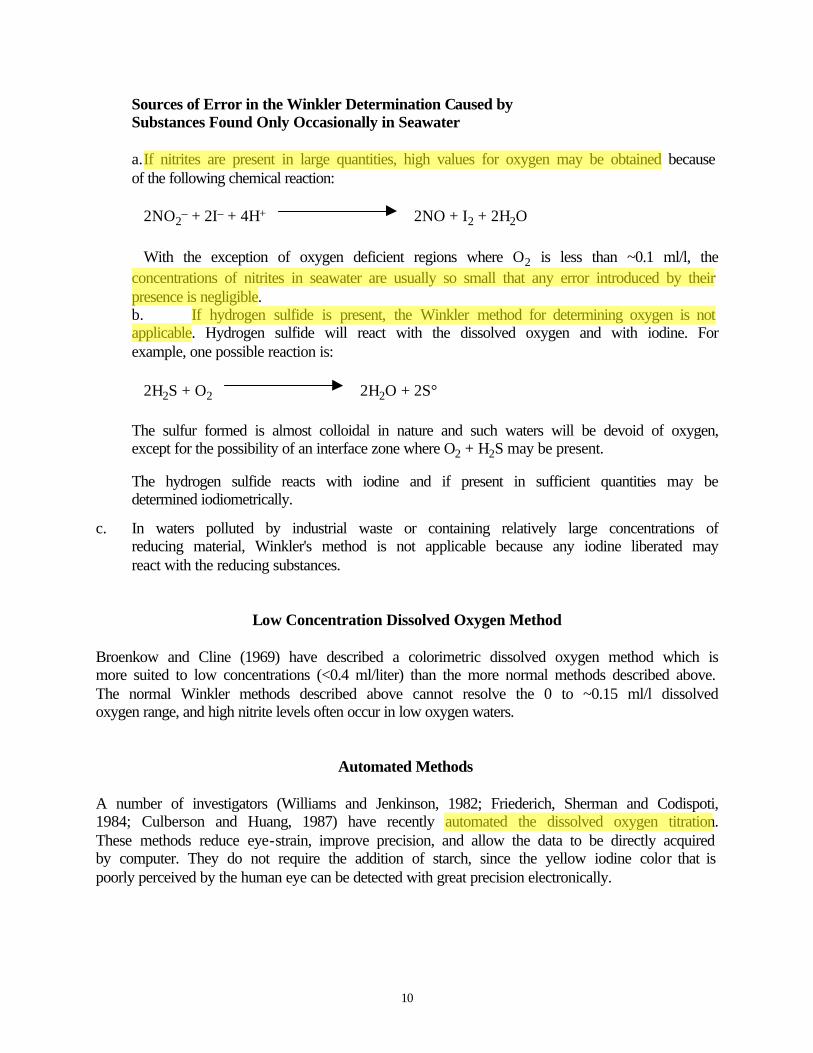
Sources of Error in the Winkler Determination Caused by Substances Found Only Occasionally in Seawater a. If nitrites are present in large quantities, high values for oxygen may be obtained because of the following chemical reaction: 2NO2
– + 2I– + 4H+ 2NO + I2 + 2H2O With the exception of oxygen deficient regions where O2 is less than ~0.1 ml/l, the concentrations of nitrites in seawater are usually so small that any error introduced by their presence is negligible. b. If hydrogen sulfide is present, the Winkler method for determining oxygen is not applicable. Hydrogen sulfide will react with the dissolved oxygen and with iodine. For example, one possible reaction is: 2H2S + O2 2H2O + 2S°
The sulfur formed is almost colloidal in nature and such waters will be devoid of oxygen,
except for the possibility of an interface zone where O2 + H2S may be present.
The hydrogen sulfide reacts with iodine and if present in sufficient quantities may be determined iodiometrically.
c. In waters polluted by industrial waste or containing relatively large concentrations of reducing material, Winkler's method is not applicable because any iodine liberated may react with the reducing substances.
Low Concentration Dissolved Oxygen Method Broenkow and Cline (1969) have described a colorimetric dissolved oxygen method which is more suited to low concentrations (<0.4 ml/liter) than the more normal methods described above. The normal Winkler methods described above cannot resolve the 0 to ~0.15 ml/l dissolved oxygen range, and high nitrite levels often occur in low oxygen waters.
Automated Methods A number of investigators (Williams and Jenkinson, 1982; Friederich, Sherman and Codispoti, 1984; Culberson and Huang, 1987) have recently automated the dissolved oxygen titration. These methods reduce eye-strain, improve precision, and allow the data to be directly acquired by computer. They do not require the addition of starch, since the yellow iodine color that is poorly perceived by the human eye can be detected with great precision electronically.
11
REFERENCES Broenkow, W.W. and J.D. Cline. 1969. Colorimetric determination of dissolved oxygen at low concentration. Limnology and Oceanography 14: 450-454.
Carpenter, J.H. 1965a. The accuracy of the Winkler method for dissolved oxygen. Limnology and Oceanography 10: 135-140.
Carpenter, J.H. 1965b. The Chesapeake Bay Institute technique for the Winkler dissolved oxygen method. Limnology and Oceanography 10: 141-143.
Carpenter, J.H. 1966. New measurements of oxygen solubility in pure and natural waters. Limnology and Oceanography 11: 264-277.
Carritt, D.E. and J.H. Carpenter. 1966. Comparison and evaluation of currently employed modifications of the Winkler method for determining dissolved oxygen in seawater; a NASCO report. Journal of Marine Research 24: 286-318.
Culberson, G.H. and S. Huang. 1987. Automated Amperometric Oxygen titration. Deep-Sea Research 34: 875-880.
Friederich, G.E., P. Sherman and L.A. Codispoti. 1984. A high precision automated Winkler titration system based on an HP-85 computer, a single colorimeter and an inexpensive electro-mechanical buret. Bigelow Laboratory for Ocean Sciences Technical Report 42, 24 pp.
Hydrographic Office. 1968. Instruction manual for obtaining oceanographic data. 3rd edition. U.S. Hydrographic Office Publication 607.
Murray, C.N. and J.P. Riley. 1969. The solubility of gases in distilled water and sea water—II. Oxygen. Deep-Sea Research 16: 311-320.
Williams, P.J. LeB. and N.W. Jenkinson. 1982. A transportable microprocessor-controlled precise Winkler titration suitable for field station and shipboard use. Limnology and Oceanography 27: 576-584.
Winkler, L.S. 1888. The determination of dissolved oxygen. Ber. Dtsche. Chem. Ges. 21: 2843-2855.
Wust, G. 1964. Stratification and circulation in the Antilleon-Caribbean basins. Columbia University Press, London and New York, 201 p.
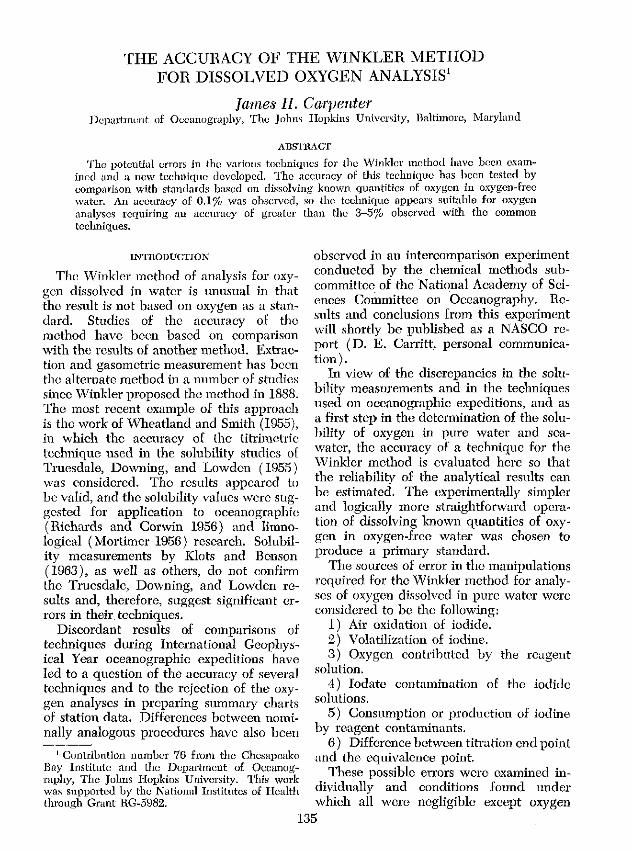
THE ACCURACY OF THE WINKLER METHOD FOR DISSOLVED OXYGEN ANALYSIS'
James II. Carpenter Dcpartrncnt of Occanognlphy, The Johns Hopkins University, Baltimore, Maryland
AllSTHACT
The potential errors in tho various techniques for the 'rVinklcr method Itava been examined and a new technique developed. Tho accuracy of this technique has been tested by comparison with standards based on dissolving known quantities of oxygen in oxygen-freo water. An accuracy of 0.1% was OhWfvcd, so the technique appears suitable for oxygen analyses requiring an accuracy of groater than the 3-5% observed with tho common techniques.
INTllODucrrON
The Winkler mcthod of analysis for oxygen dissolved in water is unusual in that the result is not based on oxygen as a standard. Studies of the accuracy of the method have been based on comparison with the results of another method. Extraction and gasomctric measurement has been the alternate method in a number of studies since Winkler proposed the method in 1888. The most recent example of this approach is tho work of Wheatland and Smith (1955), in which the accuracy of the titrimctric technique used in the solubility studics of Truesdale, Downing, and Lowdcn (1955) was considered. Tho results appeared to bc valid, and the solubility values wcrc suggested for application to oceanographic (Richards and Corwin 1956) and limnological (Mortimer 1956) research. Solubility measurements by Klots and Bonson ( 1963 ), as well as others, do not confirm the Tmesdale, Downing, and Lowden results and, therefore, suggest Significant errors in their techniques.
Discordant results of compalisons of techniques during International Geophysical Year oceanographic expeditions have led to a question of the accuracy of several techniques and to the rejection of the oxygen analyses in preparing summary charts of station data. Differences between nominally analogous procedures have also been
observed in an intercomparison experiment conducted by the chemical methods subcommittee of the National Academy of Sciences Committee on Oceanography. Results and conclusions from this experiment will shortly be published as a NASCO report (D. E. Canitt, personal communication) .
In view of the discrepancies in the solubility measurements and in the techniques used on oceanographic expeditions, and as a first step in the determination of the soluhility of oxygen in pure water and seawater, the accuracy of a technique for the Winkler method is evaluated here so that the reliability of the analytical results can be estimated. The experimentally simpler and logically more straightforward operation of dissolving known quantities of oxygen in oxygen-Iree water was chosen to produce a primary standard.
The sources of error in the manipulations required for the Winkler method for analyses of oxygen dissolved in pure water were considered to be thc following:
1) Air oxidation of iodide. 2) Volatilization of iodine. 3) Oxygen contributed by the reagent
solution. 4) Iodate contamiuation of thc iodide
solutions. 5) Consumption or production of iodine
by reagent contaminants. 6) Difference betwcen titration end point
and the equivalence point. L Contribution number 76 from the Chesapeake Bay Institute and the Department of Oceanography, The Johns Hopkins University. This work was snpported by the National Institutes o.f Health through Grant RG-5982.
These possible errors wero examined individually and conditions found under which all were negligible except oxygen
135
1.36 JAMES H. CARPENTER
contributed by the reagent solutions. As a result of these tests, the following procedure was considered to have minimum errors and was tested for accuracy.
~IETHODS AND MATERIALS
Technique for the Winkler method
Reagents-The first two errors can be reduced by the use of the following reagents:
MnCL·4ILO Nal NaOH H"SOI
(iOO g/liter 6 ml/litcr of sample 600 g/liter I ,. .320 g/liter G m!; hter of sample 500 mljliter 3.6 mljliter of sample
Air oxidation is minimized by a final pH of 2.
Volatilization-Loss of iodine during exposure of iodine solutions to the atmosphere is minimized by the formation of the triiodide complex with the high iodide concentrations produced by these reagents. However, a more reliable system was based on elimination of transfer of the sample until most of tbe iodine had been reduced with tbiosulfate.
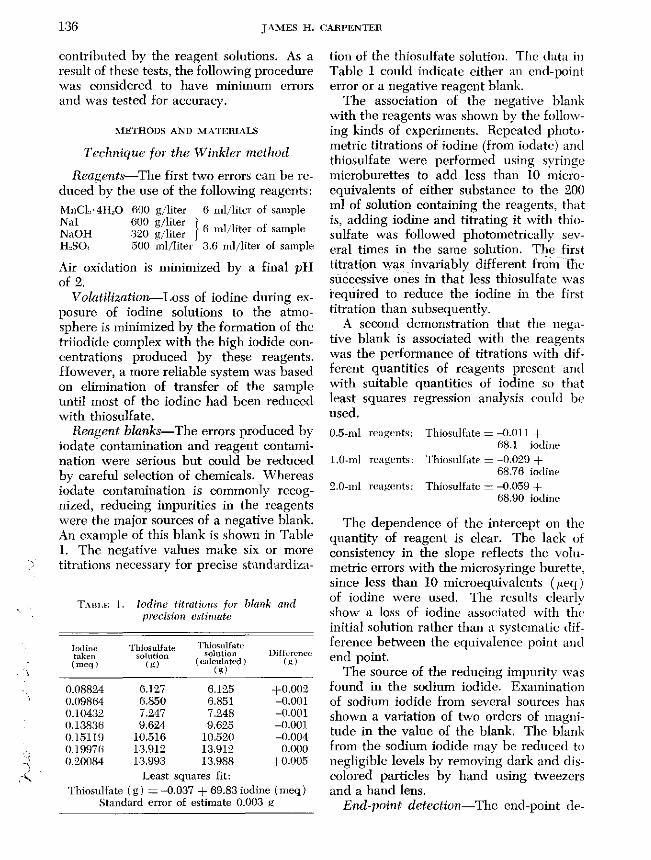
Reagent blanks-The errors produced by iodate contamination and reagent contamination were serious but could be reduced by careful selection of chemicals. Whereas iodate contamination is commonly recognized, reducing impurities in the reagents were the major sources of a negative blank. An example of this blank is shown in Table 1. The negative values make six or more titrations necessary for precise standardiza-
TABLE 1. Iodine titrati()n~ fur blank and precision e.~tim(Jte
Iouine taken (meq)
0.08824 (1.09804 0.10432 0.13830 0.1511!J O.1997(i 0.20084
Thiosulfate solution
un
(').127 6.850 7.247 9.624
10.516 13.912 13.993
Thiosulfatc solution
(calculated) (g)
6.125 6.851 7.248 9.625
10.520 13.912 13.988
Least squares fit:
Differcnc(' (g)
+0.002 -0.001 -0.001 -0.001 -0.004
0.000 +0.005
Thiosulfate (g) = -0.037 + 69.83 iodine (meq) Standard error of estimate 0.003 g
tion of the thiosulfate solution. The uata ill Table 1 could indicate either an end-point error or a negative reagent blank.
The association of the negative blank with the reagents was shown by the following kinds of experiments. Repeated pbotometric titrations of iodine (from iodatc) and thiosulfate were perfOlTIled using syringe microburettes to add less than 10 microequivalents of either substancc to tbe 200 ml of solution containing the reagents, that is, adding iodine and titrating it with thiosulfate was followed photometrically several times in the same solution. The first titration was invariably different fn1m HlC successive ones in that less thiosulfate was required to reduce the iodine in the first titration than subsequently.
A second demonstration that the negative blank is associated with the reagents was the perfonnance of titrations with different quantities of reagents present and with suitable quantities of iodine so that least squares regression analysis could be used.
0.5-ml reagents: Thiosulfate = -(Ulll + 68.1 iodille
1.0-m] reagents: Thioslllfate = -0.029 + 68.76 i{)(lil1(~
2.0-ml reagents: Thiosulfate = -0.059 + ()8.90 iodine
The dependence of the intercept on the quantity of reagent is clear. Tbe lack of consistency in the slope reflects the volumetric errors with the microsyringe burette, since less than 10 microequivalents ("ell) of iodine were used. The results dearly show a loss of iodine associated with th~~ initial solution rather than a systematic difference between the equivalence point and end point.
The source of the reducing impurity was found in the sodium iodide. Examination of sodium iodide from several sources has shown a variation of two orders of magnitude in the value of the blank. The blank from the sodium iodide may be reduced to negligible levels by removing dark and discolored particles by hand using tweezers and a band lens.
End-point detection-The end-point de-
ACCURACY OF WINKLER METHOD 137
tection by visual indication with starch and by amperomeb'ie and potentiometric measurements has been studied by Knowles and Lowden (1953). Colorimetric determination with starch and amperometrie measurement were compared in the study of the iodine-thiosulfate reaction of Bradbury and Hambly (1952). Both these studies showed that the starch-indicated end point is significantly different from the equivalence point in titrations of iodine solutions at concentrations corresponding to airsaturated water. The authors recommended the amperometric technique but remarked on the variable sensitivity of the electrodes.
Since triiodide ion is the most abundant species of iodine present in the solution, particularly near the end point, determination of triiodide ion was expected to be a superior method of end-point detection. Triiodide ion strongly absorbs near-ultraviolet light with maximum absorption at 350 mI" Photometric titration is relatively Simple and free from the erratic behavior of electrodes. The sensitivities of the several iodine end-point techniques, as found hy Bradbury and Hambly (1952) and during this work, are as follows: Visual starch
Co]{n'imctric starch
10 ,ucq/litcl'
2 ,ucq/litel'
Amperomctrk technique (0.02) ,ueq/litcl' calculatetl free iodine
Ultraviolet absorption
0.08 ,ueq/litcr in 0.0] N iodide
0.015 ,ucq/liter in O.<)l N iodidci
Titration p1'ocedu1'e-A sample was placed in a 500-ml Pyrex bottle with rounded stopper and the reagents added with syringes. A 100-ml portion of the resulting solution was removed with a pipette calibrated "to contain." Thiosulfate solulion was added to the bottle contents from a weight burette to nearly complete reaction (very light straw color). A 200-rnl aliquot of the reaction mixture was transferred to tbe photometric titration apparatus, which consisted of a Beckman Model DU spectrophotometer with a modified cell compartment to accommodate a 200-ml Florence flask and a reference air path con-
strncted with foul' mirrors mounted on a modified cell carriage. TI,O contents of the Florence flask were stirred with a magnetic stirrer and thiosulfate solution added with a 1-ml syringe microburette until the optical density was approximately 0.2. Increments of 0.01 ml thiosulfate solution were added and the end point found from a plot of optical density vs. added thiosulfate. The precision of the technique is 0.003 g thiosulfate solution (Table 1).
Standardization of thiosulfate-Iodine generated from biiodate, iodate, or dichromate is commonly used to standardize thiosulfate solutions. Potassium dichromate is not suitable as a standard for millinormal solutions, since the air oxidation error is difficult to avoid at the high acidities required. Even with the precautions of generation of iodine under a nitrogen atmosphere and adjustment of the pH to 3 00-foro titration, intercomparison of assayed (better than 0.1%) potassium dichromate and potassium biiodate ( G. Frederick Smith Co., Columbus, Ohio) gave differences of 0.5%.
Either potassium iodate or potassium biiodate appears to be suitable as an iodine standard. However, the iodate is easier to dry and might he expected to be more rcliable. Comparison of potassium biiodate (G. Frederick Smith Co.), which had been dried over magnesium pOl'ehlorate and had a stated assay of 100.01%, with potassium iodate (Mallinkrodt), dried at 180C and certified as 100.05-99.95%, gave agreement to 0.Q4%.
Preparation of dissolved oxygen solutions
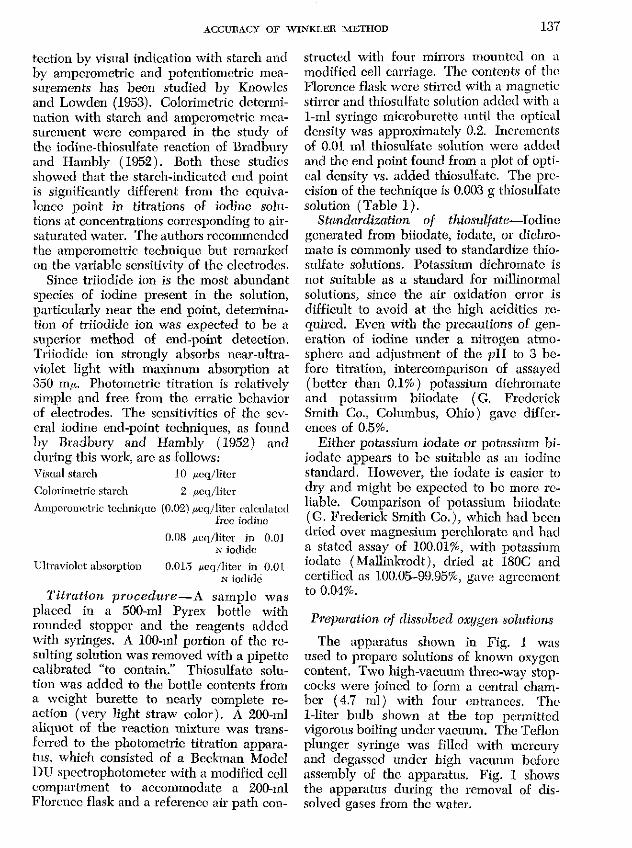
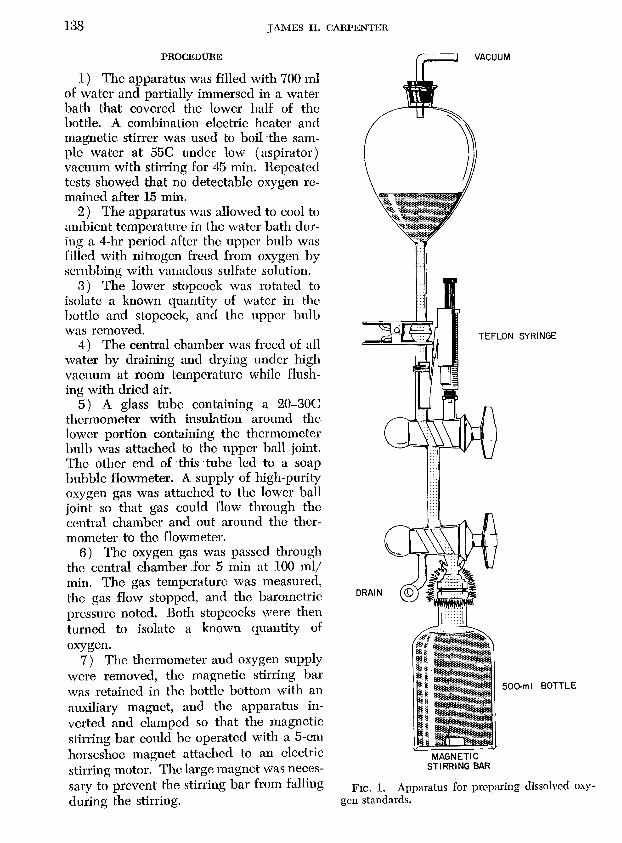
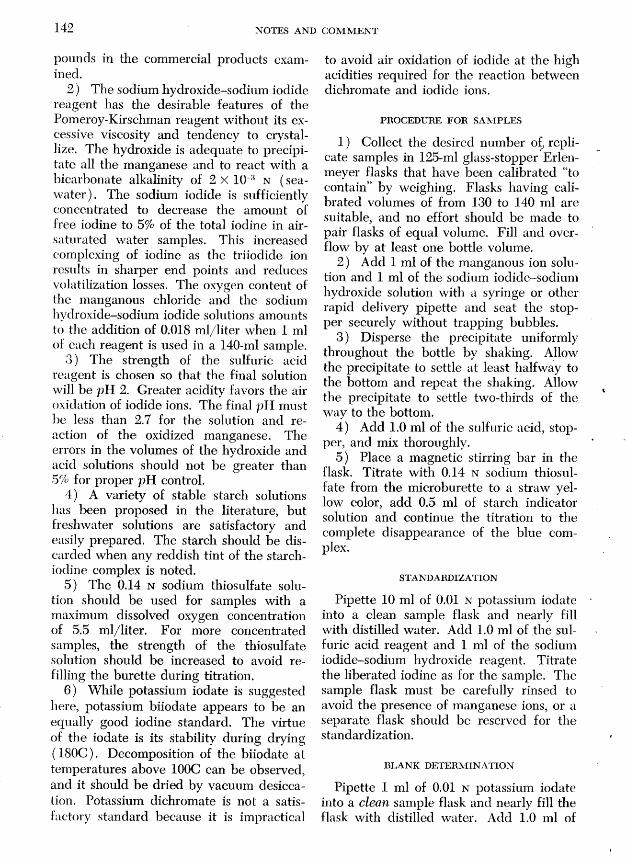
The apparatus shown in Fig. 1 was used to prepare solutions of known oxygen content. Two high-vacuum three-way stopcocks were joined to form a central chamber (4.7 m!) with four entrances. TIw I-liter bulb shown at the top permitted vigorous boiling under vacuum. The Teflon plunger syringe was filled with mercury and degasscd under high vacuum before assembly of the apparatos. Fig. 1 shows the apparatus during the removal of dissolved gases from the water.
138 J AMES II.· CARPENTER
PROCEDURE
1) The apparatus was filled with 700 ml of water and partially immersed in a water bath that covered the lower half of the bottle. A combination eleeb'ic heater and magnetic stirrer was used to boil the sample water at 55e under low (aspirator) vacuum with stirring for 45 min. Repeateo tests showed that no detectable oxygen remained after 15 min.
2) The apparatus was allowed to cool to ambient temperature in the water bath during a 4-hr period after the upper bulb was filled with nitrogen freed from oxygen by scrubbing with vanadous sulfate solution.
3) The lower stopcock was rotated to isolate a known quantity of water in the bottle and stopcock, and the upper bulb was removed.
4) The central chamber was freed of all water by draining and drying under· high vacuum at room temperature while flushing with dried air.
5) A glass tube containing a 20-30C thermometer with insulation around the lower portion containing the thermometer hulb was attached to the upper ball joint. The other end of this tube led to a soap bubble flowmeter. A supply of high-purity oxygen gas was attached to the lower ball joint so that gas could flow through the central chamber and out around the thermometer to the flowmeter.
6) The oxygen gas was passed through the central chamber for 5 min at 100 mlj min. The gas temperature was measured, the gas flow stopped, and the barometric pressure noted. Both stopcocks were then turned to isolate a known quantity of oxygen.
7) The thermometer and oxygen supply were removed, the magnetic stirring bar was retained in the bottle bottom with an auxiliary magnet, and the apparatus inverted and clamped so that the magnetic stirring bar could be operated with a 5-cm horseshoe magnet attached to an electric stirring motor. The large magnet was necessary to prevent the stirring bar from falling during the stirring.
DRAIN
VACUUM
TEFLON SYRINGE
MAGNETIC STIRRING BAR
500-ml BOTTLE
FIG. 1. Apparatus for preparing dissolved oxygen standards.
ACCUnACY OF WINKLER METHOD 139
8) The central chamber was opencd to the water and the syringe. The oxygen was gently transferred to the bottlc, where solution took place in approximately 10 min.
g) The apparatus was undamped and the mercury allowed to run back and forth from the central chamber thoroughly to mix the solution, including the portion in thc stopcock bore. The walls of the bottle werc inspected with a hand lens and all visiblc mercury transferred back into the central chamber by scrubbing with a globule of mercury.
10) The stopcocks wcre rotated and the sample bottle removcd from the apparatus. The excess water was allowed to spill, and the stopper was insOltcd in the bottle, thus isolating a known fraction of the added oxygen.
11) The fraction of the addcd oxygen contained in the bottle was determined by the techoique for the Winklcr method outlined above.
12) The mercury contcnt of the final titrated solution was determined by spcctrophotometric analysis based on measurement of the 320-ml' absorption peak of mercuric tctraioclidc and at 350 mp. to correct for the tracc turbidity of the solution. A 12.5-cm absorption cell permits the determination of O.ll'cq of mercury to 10%.
RESULTS
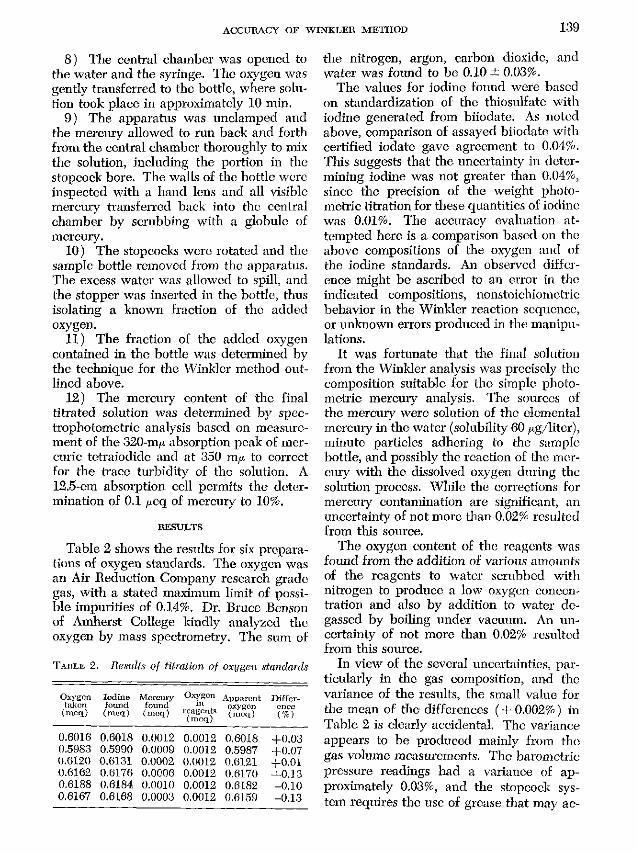
Table 2 shows the results for six preparations of oxygen standards. The oxygen was an Air Reduction Company research grade gas, with a stated maximum limit of possible impurities of 0.14%. Dr. Bruce Bcnson of Amherst College kindly analyzed the oxygen by mass spectrometry. The sum of
TAIlLE 2. Results of titration of oxygen standmds
Oxygen Iodine Mercury Oxygen Apparent Diffcr-takcn found found m. oxygen ence
(meq) (m{)q) (meq) J:(~~~~~ (mcq) (%)
0.6016 0.6018 0.0012 0.0012 0.6018 +0.03 0.5983 0.5990 0.0009 0.0012 0.5987 +0.07 0.6120 0.6131 0.0002 0.0012 0.6121 +0.01 0.6162 0.6176 0.0006 0.0012 0.6170 +0.13 0.6188 0.6184 0.0010 0.0012 0.6182 -0.10 0.6167 0.6168 0.0003 0.0012 0.6159 -0.13
the nitrogen, argon, carbon dioxide, and water was found to be 0.10 ± 0.03%.
The valnes for iodine found wcre based on standardization of the thiosulfate with iodine generated from biiodate. As noted above, comparison of assayed biiodate with certified iodate gave agreement to 0.04%. 111is suggests that the uncertainty in dctermining iodine was not greater than 0.04%, since the precision of the weight photometric titration for these quantities of iodine was 0.01%. The accuracy evaluation attempted here is a comparison based on the above compositions of the oxygen and of the iodine standards. An observed difference might be ascribed to an error in the indicated compositions., nonstoichiomctrie behavior in the Winkler reaction sequence, or unknown errors produced in the manipulations.
It was fortnnate that the final solution from the Winkler analysis was precisely the composition suitable for the simple photometric merculY analysis. The sources of the mercury were solution of the elemental mercury in the water (solubility 60 I,g/liter), minute particles adhering to the sample bottle, and possibly the reaction of the mercury with the dissolved oxygen during the solution process. While the corrections for mercmy contamination are significant, an uncertainty of not more than 0.02% resulted from this. source.
The oxygen content of the reagcnts was found from the addition of various amounts of the reagents to wator scrubbcd with nitrogen to produce a low oxygcn conccn~ tration and also by addition to water degassed by boiling under vacuum. An uncertainty of not more than 0.020/0 rosulted from this som"ce.
In view of the several uncertainties, particularly in thc gas composition, and the variance of the results, the small value for the mean of the differences (+ 0.002'1'0) in Table 2 is clearly accidental. The variance appears to be produced mainly from the gas volume measurements. The barometric pressure readings had a variance of approximately 0.03%, and the stopcock system requires the use of grease that may ac-
140 JAMES H. CABPENTEll
cumulate and thcn be removed to produce volume changes of approximately 0.05%. The effect of these factors could be reduced by redesign of the systcm, but an accuracy of better than 0.10/0 does not appear to serve any useful purpose. Thc high (0.02%) precision of the weight photometric titration docs have an advantage Jor such purposes as measurements of solnhility as a function of temperature and salinity, in which unknown functional dependence must be developed from a limited number of measurements.
CONCLUSIONS
Since the recovery of oxygen was quantitative to the expected accuracy of the prcpared standards (0.1%), it is reasonable to conclude that the Winkler method as outlined here has an accuracy of 0.1%. Comparison of this technique with several other commonly uscd techniques shows differences of up to 50/0, and it is inferrc>d that errors of this magnitude result from inadequacies of the other techniques. An adaptation of the present technique for routine analyses will be described in another paper.
REFERENCES
llllAnnURY, J. n., AND A. N. HAMBLY. 1952. An investigation of errors in the amperometric and starch indicator methods for the titration of millinormal solutions of iodine and thi.o~ sulfate. Australian J. Sci. Res. Ser. A, 5: .541-554.
KLOTS, C. E., AND B. B. BENSON. H)63. Solu~ bilities of nitrogen, oxygen and argon in dis~ tilled water. J. Marine Res., 21: 48-57.
KNOWLES, C., ANn C. F. Lowm'N. 1953. Meth~ ods for detecting the end point in the titration of iodine with thiosulphatc. Analyst, 78: 1,59-164.
1tloHTlMER, C. H. 1956. The oxygen content of air~saturated fresh waters, and aid.~ in calcn~ bting percentage saturation. Intern. Assoc. Theoret. Appl. Limool. Commun. No.6.
RICHARDS, F. A., AND N. CORWIN. 1956. Some oceanographic applications of recent dctermi~ nations of the solubility of oxygen in sea water. Limnol. Oceauog., 1: 2.63-267.
THUESDALE, C. A., A. L. DOWNING, AND C. F. LOWDEN. H)55. The solubHUy of oxygen in pure water and sea-water. J, Appl. Chum. London, 5: 53-62.
VVI-mATLAND, A. B., AND L. }. SM[TlL 195,). Casometric determination of dissolved oxygen in pure and saline water as a check of titri~ metric methods. J. Appl. Chern. London, 5: 144-148.
WJNKLER, L. "V. 1888. Die Bestimmung des im Wasser gcl6stcn Suuerstoffes. Chern. Bcr., 21: 2843-2855.
NOTES AND COMMENT
THE CHESAPEAKE BAY INSTITUTE TECHNIQUE FOR THE WINKLEH
DISSOLVED OXYGEN METHOD
A modified technique for the Winkler determination of dissolved oxygen has been used at the Chesapeake Bay Institute for several years. The modifications result in increased simplicity and speed and reduction in the errors due to manipulation. The unusual features of the technique are the elimination of the volumetrie transfer of the final iodine solution and the reagent concentrations.
The sources of errors in the various techniques for the Winkler method are discussed in detail by Carpenter (1965) and by Carritt (1964), who also reports the results of an intercomparison experiment.
APPARATUS
Sample flasks-Erlenmeyer flasks of 125-ml nominal capacity (130-140 ml calibrated capacity) with full-length 19/38 ground-glass stoppers are used. Bottles may be substituted for the flasks, but more care is required to avoid trapping air bubbles. The stoppers should be rounded or tapered to avoid trapping air bubbles.
Reagent dispensers-Syringes with Chaney adapters are used for the viscous reagent solutions. Any rapid delivery automatic pipette may be substituted.
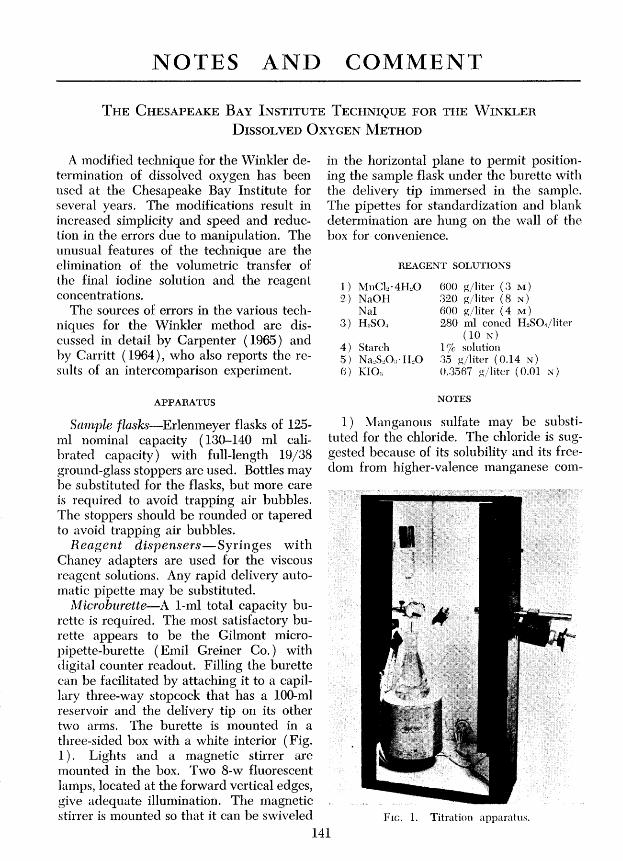
Microburette-A I-ml total capacity burette is required. The most satisfactory burette appears to be the Gilmont micropipette-burette (Emil Greiner Co.) with digital counter readout. Filling the burette can be facilitated by attaching it to a capillary three-way stopcock that has a 100-ml reservoir and the delivery tip on its other two arms. The burette is mounted in a three-sided box with a white interior (Fig. 1 ) . Lights and a magnetic stirrer are mounted in the box. Two 8-w fluorescent lamps, located at the forward vertical edges, give adequate illumination. The magnetic stirrer is mounted so that it can be swiveled
in the horizontal plane to permit positioning the sample flask under the burette with the delivery tip immersed in the sample. The pipettes for standardization and blank determination are hung on the wall of the box for convenience.
REAGENT SOLUTIONS
1) MnCL·4I-LO 2) NaOH
Nal 3) H2S0~
4) Starch .5) Na:SlO:dLO fj) KIO:,
600 g/liter (3 ~I) ;320 g/liter (8 N) 600 g/liter (4 M) 280 ml coned H2S04/liter
(10 N) 1 % solution :3.5 g/liter (0.14 N) 0 .. 3.567 g/liter (0.01 N)
NOTES
1) Manganous sulfate may be substituted for the chloride. The chloride is suggested because of its solubility and its freedom from higher-valence manganese com-
FIG. l. Titration apparatus.
141
142 NOTES AND COMMENT
pounds in the commercial products examined.
2) The sodium hydroxide-sodium iodide reagent has the desirable features of the Pomeroy-Kirschman reagent without its excessive viscosity and tendency to crystallize. The hydroxide is adequate to precipitate all the manganese and to react with a hicarbonate alkalinity of 2 X 10-:"1 N (seawater) . The sodium iodide is sufficiently concentrated to decrease the amount of free iodine to 5% of the total iodine in airsaturated water samples. This increased complexing of iodine as the triiodide ion results in sharper end points and reduces volatilization losses. The oxygen content of the manganous chloride and the sodium hydroxide-sodium iodide solutions amounts to the addition of 0.018 mljliter when 1 ml of each reagent is used in a 140-ml sample.
.'3 ) The strength of the sulfuric acid reagent is chosen so that the final solution win be pH 2. Greater acidity favors the air oxidation of iodide ions. The final pH must he less than 2.7 for the solution and reaction of the oxidized manganese. The errors in the volumes of the hydroxide and acid solutions should not be greater than ,5% for proper pH control.
4) A variety of stable starch solutions has been proposed in the literature, but freshwater solutions are satisfactory and easily prepared. The starch should be discarded when any reddish tint of the starchiodine complex is noted.
5) The 0.14 N sodium thiosulfate solution should be used for samples with a maximum dissolved oxygen concentration of 5.5 mljliter. For more concentrated samples, the strength of the thiosulfate solution should be increased to avoid refilling the burette during titration.
6) While potassium iodate is suggested here, potassium biiodate appears to be an equally good iodine standard. The virtue of the iodate is its stability during drying (180C). Decomposition of the biiodate at temperatures above 100C can be observed, and it should be dried by vacuum desiccation. Potassium dichromate is not a satisfactory standard because it is impractical
to avoid air oxidation of iodide at the high acidities required for the reaction between dichromate and iodide ions.
PROCEDURE FOR SAMPLES
1) Collect the desired number ot replicate samples in 125-ml glass-stopper Erlenmeyer flasks that have been calibrated "to contain" by weighing. Flasks having calibrated volumes of from 130 to 140 ml are suitable, and no effort should be made to pair flasks of equal volume. Fill and overflow by at least one bottle volume.
2) Add 1 ml of the manganous ion solution and 1 ml of the sodium iodide-sodium hydroxide solution with a syringe or other rapid delivery pipette and seat the stopper securely without trapping bubbles.
3) Disperse the precipitate uniformly throughout the bottle by shaking. Allow the precipitate to settle at least halfway to the bottom and repeat the shaking. Allow the precipitate to settle two-thirds of the way to the bottom.
4) Add 1.0 ml of the sulfuric acid, stopper, and mix thoroughly.
5) Place a magnetic stirring bar in the flask. Titrate with 0.14 N sodium thiosulfate from the microburette to a straw yellow color, add 0.5 ml of starch indicator solution and continue the titration to the complete disappearance of the blue complex.
STANDARDIZATION
Pipette 10 ml of 0.01 N potassium iodate into a clean sample flask and nearly fill with distilled water. Add 1.0 ml of .the sulfuric acid reagent and 1 ml of the sodium iodide-sodium hydroxide reagent. Titrate the liberated iodine as for the sample. The sample flask must be carefully rinsed to avoid the presence of manganese ions, or a separate flask should be reserved for the standardization.
BLANK DETERMINATION
Pipette 1 ml of 0.01 N potassium iodate into a clean sample flask and nearly fill the flask with distilled water. Add 1.0 ml of
NOTES AND COMMENT 143
the sulfuric acid reagent, 1 ml of the sodium iodide,-sodium hydroxide reagent, mix, and then add 1 ml of the manganous ion reagent. Titrate precisely to the end point.
Pipette a second 1 ml of 0.01 N potassium iodate into the final solution above. Titrate the liberated iodine.
The difference between the first and second titrations is the reagent and indicator blank. Manganese must be' absent during the hydroxide addition.
The procedure may be repeated using sample water rather than distilled water to determine the blank due to sample constituents that liberate or react with iodine in acid solution. The method is unsuitable for grossly polluted samples.
Either positive or negative blanks may be found for the reagents.
CALCULATION OF RESULTS
The concentration of dissolved oxygen in the sample may be computed from the following equation:
( R - Rblk ) V 109' N 109' E DO = DOl'l'g
(H!<t(\ - Rh1k ) (Vb - Vl'l'g)
where
DO = dissolved oxygen (ml/liter) R sample titration burette reading
R"lk - difference between blank titrations burette readings
R"tt\ standardization burette reading VlO;\ = volume of KIOg standard (ml)
Vh volume of sample bottle (ml) VI'l'1X volume of sample displaced by
reagents (ml) N lOa normality of KIOa standard
( equivalent/liter) E = 5,598 ml O2 / equivalent, and
DOI'('g oxygen added with reagents
For the procedure described,
DO = (R - Rb1k )55,g.8 _ 0.018 ( RRttl - Rh1k ) ( Vb - 2)
GENERAL COMMENTS
Titration of the whole sample has the following features:
1) Speed. Elimination of removing aliquots expedites the titration.
2) Precision estimate. Titration of duplicate aliquots safeguards against gross titration errors and permits the estimation of the precision of the aliquoting and titrating. However, the precision of the method must be based on repetition of the whole procedure. The normal variation in bottle size results in different titers for replicates, which eliminates the personal tendency to obtain the same result for aliquots.
3) Minimum volatilization error. Transfer of aliquots by graduated cylinder re·· suIts in greater losses of iodine than does pipette transfer, suggesting that the common procedure of transfer of the whole sample to a titration vessel also results in serious iodine loss.
4) Convenience. The digital readout 1mrette and absence of the transfer step make precise results possible even under adverse conditions.
5) Cost. The full-length ground-glass stoppers and flasks used are approximately twice as expensive as standard mediumstopper bottles. The burette used is from three to six times as expensive as an ordiIHUY burette, but the cost of the glass parts is comparable to that of an ordinary burette.
6) Calculation. The volume of each bottle and stopper combination enters the calculation of the results, so a factor converting the burette to dissolved oxygen concentration cannot be used.
JAMES H. CARPENTER
Chesapeake Bay Institute, The Johns Hopkins University, Baltimore, Maryland.
REFERENCES
CARPENTER, J. H. 1965. The accuracy of the Winkler method for dissolved oxygen. Limnol. Oceanog., 10: 135-140.
CARRI.TT, D. E. 1964. Intercomparison of methods in chemical oceanography. 1. Precision and accuracy of the Winkler method. National Academy of Sciences-National Research Council. (In press.)
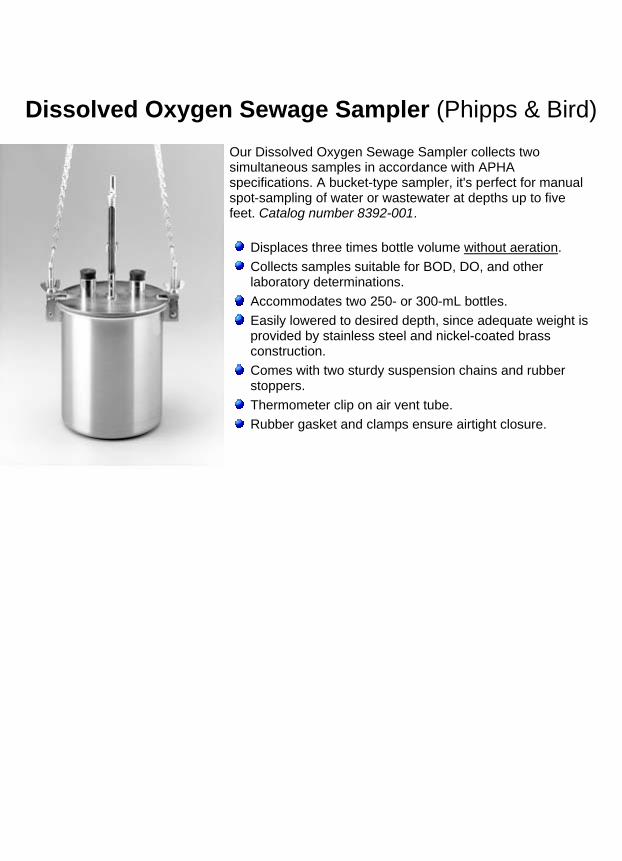
Dissolved Oxygen Sewage Sampler (Phipps & Bird)
Our Dissolved Oxygen Sewage Sampler collects two simultaneous samples in accordance with APHA specifications. A bucket-type sampler, it's perfect for manual spot-sampling of water or wastewater at depths up to five feet. Catalog number 8392-001.
Displaces three times bottle volume without aeration.
Collects samples suitable for BOD, DO, and other laboratory determinations.
Accommodates two 250- or 300-mL bottles.
Easily lowered to desired depth, since adequate weight is provided by stainless steel and nickel-coated brass construction.
Comes with two sturdy suspension chains and rubber stoppers.
Thermometer clip on air vent tube.
Rubber gasket and clamps ensure airtight closure.
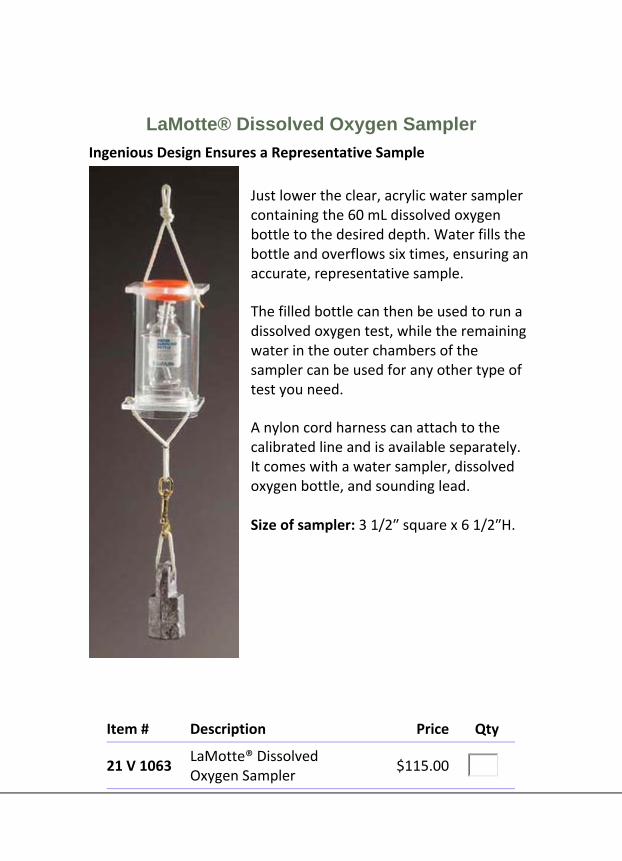
LaMotte® Dissolved Oxygen Sampler
Ingenious Design Ensures a Representative Sample
Just lower the clear, acrylic water sampler containing the 60 mL dissolved oxygen bottle to the desired depth. Water fills the bottle and overflows six times, ensuring an accurate, representative sample.
The filled bottle can then be used to run a dissolved oxygen test, while the remaining water in the outer chambers of the sampler can be used for any other type of test you need.
A nylon cord harness can attach to the calibrated line and is available separately. It comes with a water sampler, dissolved oxygen bottle, and sounding lead. Size of sampler: 3 1/2″ square x 6 1/2″H.
Item # Description Price Qty
21 V 1063 LaMotte® Dissolved Oxygen Sampler
$115.00
(DISSOLVED) (4500-0)/lodometrie Methods 4-97
4500-0 B. lodometric Methods
pie
ometric test is the most precise and reliable titrimetric e for DO analysis. It is based on the addition of divalent
solution, followed by strong alkali, to the sample in oppered bottle. DO rapidly oxidizes an equivalent amount . persed divalent manganous hydroxide precipitate to
s of higher valency states. In the presence of iodide acidic solution, the oxidized manganese reverts to the
state, with the liberation of iodine equivalent to the =:)0 content. The iodine is then titrated with a standard
tion end point can be detected visually, with a starch _ or electrometrically, with potentiometric or dead-stop es. 1 Experienced analysts can maintain a precision of L with visual end-point detection and a precision of ::t:: 5
electrometric end-point detection. 1,2
rated iodine also can be determined directly by simple n spectrophotometers. 3 This method can be used on a asis to provide very accurate estimates for DO in the
-per-liter range provided that interfering particulate lor, and chemical interferences are absent.
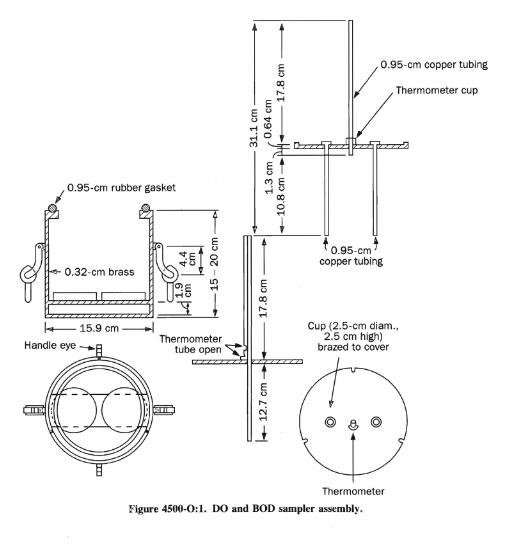
I O.95-em rubber gasket
O,32-cm brass
I--- 15.9 cm -l
f
Thermometer tube open "t
2. Selection of Method
Before selecting a method consider the effect of interferences, particularly oxidizing or reducing materials that may be present in the sample. Certain oxidizing agents liberate iodine from iodides (positive interference) and some reducing agents reduce iodine to iodide (negative interference) . Most organic matter is oxidized partially when the oxidized manganese precipitate is acidified, thus causing negative errors.
Several modifications of the iodometric method are given to minimize the effect of interfering materials .2 Among the more commonly used procedures are the azide modification,4 the permanganate modification,S the alum flocculation modification,6 and the copper sulfate-sulfamic acid flocculation modification.7,s The azide modification (C) effectively removes interference caused by nitrite, which is the most common interference in biologically treated effluents and incubated BOD samples. Use the permanganate modification (D) in the presence of ferrous iron. When the sample contains 5 or more mg ferric iron salts/L, add potassium fluoride (KF) as the first reagent in the azide modification or after the permanganate treatment for ferrous iron. Alternately, eliminate Fe (III) interference by using 85 to 87% phos
t O.95-cm t copper tubing
I O.95-cm copper tubing
Thermometer cup
Cup (2.5-cm diam., 2.5 cm high)
brazed to cover
1
Thermometer
Figure 4500-0:1. DO and BOD sampler assembly.


![Dissolved Oxygen [DO]](https://img.pdfslide.net/doc/110x75/5a6721977f8b9ab12b8b464b/dissolved-oxygen-do.jpg)