Embed Size (px)
Citation preview

One Score or More? Reflections on the
Controversy over a General Factor of Personality EAWOP Conference Muenster - 24th May 2013
Chair: Rab MacIver, Saville Consulting
1. Construct Convergence of Big 5 Personality and Great 8 Competency Variables
(Dr. Rainer Kurz, Saville Consulting)
2. The relationship between General Mental Ability and the General Factor of Personality:
Findings from meta-analytic data
Prof. Matthias Ziegler (Humboldt University, Berlin)
Dr. Jonas Bertling (Educational Testing Service)
3. Is the ‘Big One’ too big to be useful? (Rob Bailey, OPP)
4. The Great One – Not the First One
(Rab MacIver, Saville Consulting)

Construct Convergence of
Big 5 Personality and Great 8 Competency Variables
Dr. Rainer Kurz, Saville Consulting
Contact: [email protected]
The General Mental Ability Factor
• Spearman (1904): General factor ‘g’ plus numerous specific
abilities
• Thurstone (1927):Primary Mental Abilities
• Vernon (1950): Hierarchical model of abilities - reconciling
Spearman and Thurstone models
• Carrol (1993): Three Stratum Theory
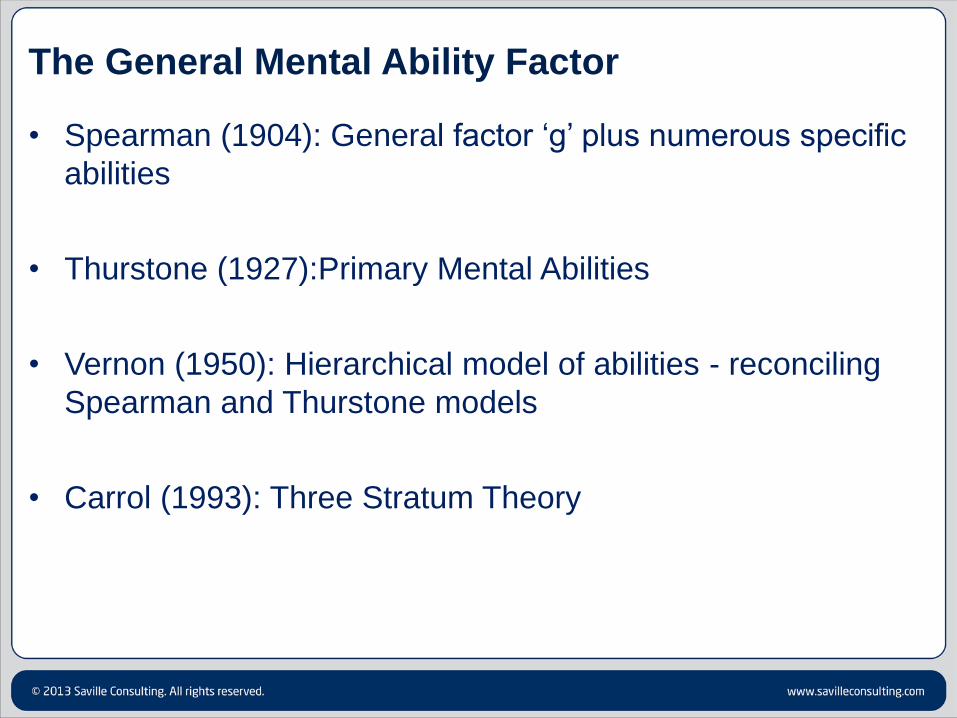
Carrol (1993)
Three Stratum Theory Model of John Carrol (1993).
Source: Kurz, R. (2000). The Facets of Occupational Testing:
General Reasoning Ability, Residual Aptitudes &
Speed-Accuracy Balance. Unpublished PhD thesis. UMIST:
Manchester.
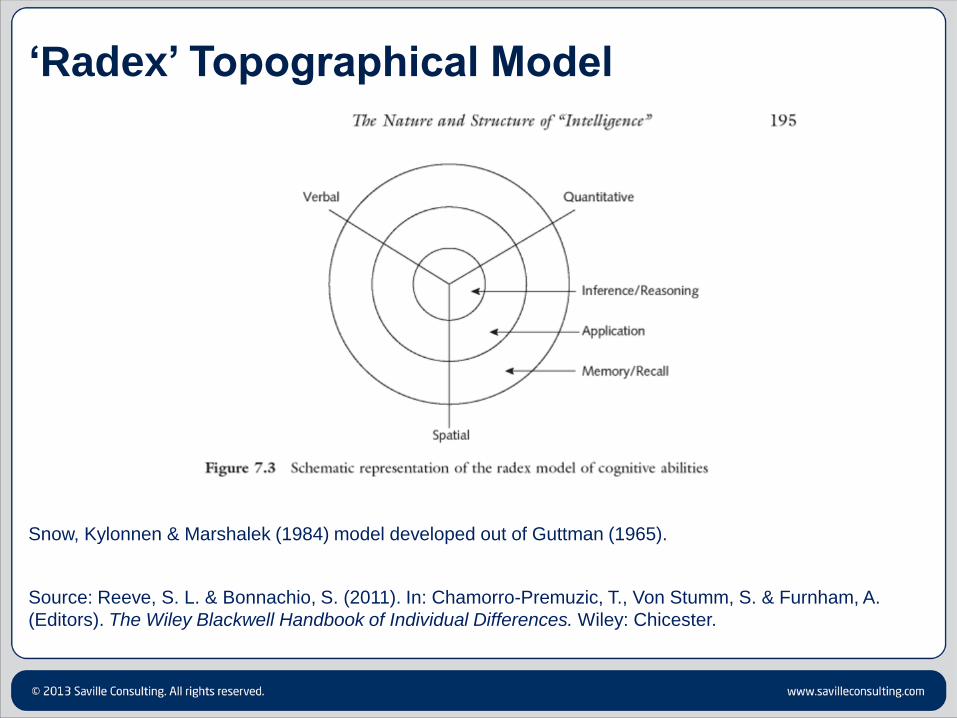
‘Radex’ Topographical Model
Snow, Kylonnen & Marshalek (1984) model developed out of Guttman (1965).
Source: Reeve, S. L. & Bonnachio, S. (2011). In: Chamorro-Premuzic, T., Von Stumm, S. & Furnham, A.
(Editors). The Wiley Blackwell Handbook of Individual Differences. Wiley: Chicester.
‘New’ General Factors savilleconsult ing
© Saville Consult ing 2006. All rights reserved www.savilleconsult ing.com
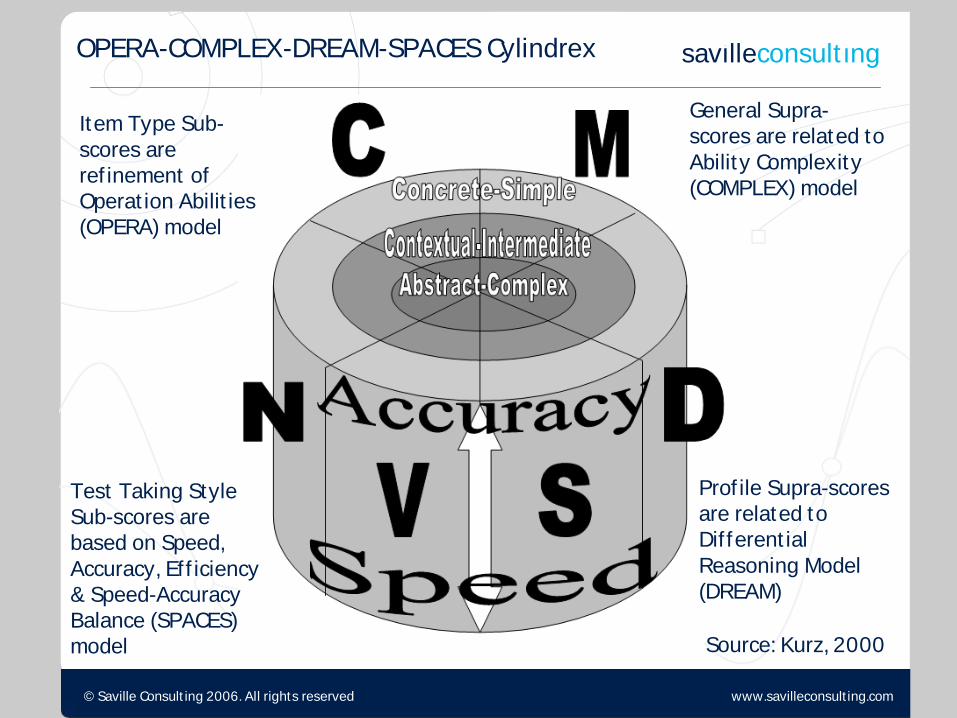
OPERA-COMPLEX-DREAM-SPACES Cylindrex
Source: Kurz, 2000
Item Type Sub-
scores are
ref inement of
Operat ion Abilit ies
(OPERA) model
Test Taking Style
Sub-scores are
based on Speed,
Accuracy, Eff iciency
& Speed-Accuracy
Balance (SPACES)
model
General Supra-
scores are related to
Ability Complexity
(COMPLEX) model
Prof ile Supra-scores
are related to
Dif ferent ial
Reasoning Model
(DREAM)
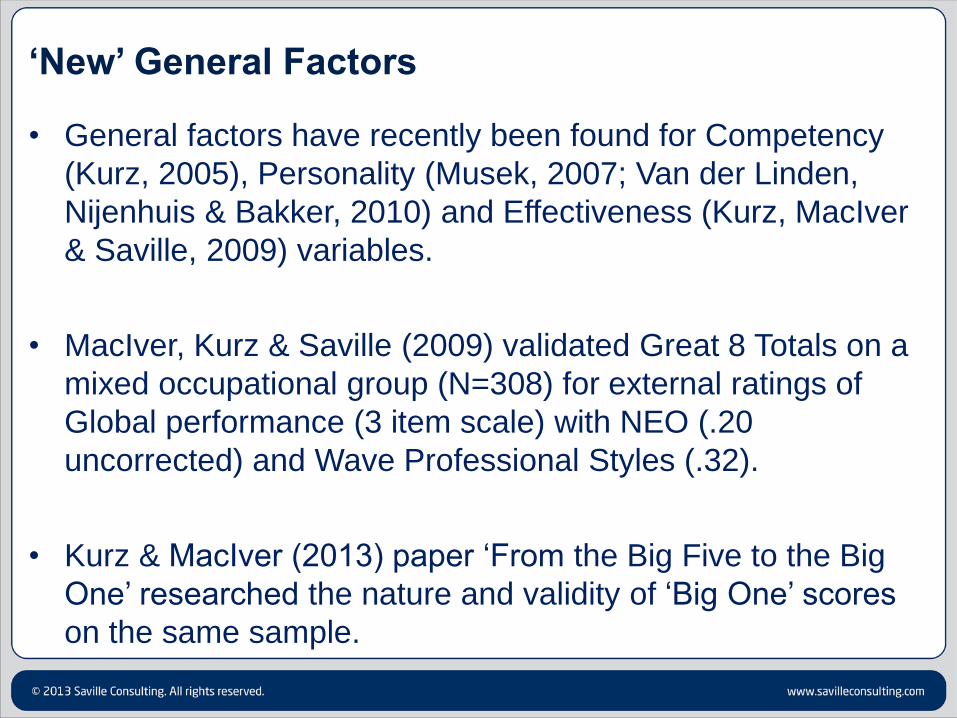
‘New’ General Factors
• General factors have recently been found for Competency
(Kurz, 2005), Personality (Musek, 2007; Van der Linden,
Nijenhuis & Bakker, 2010) and Effectiveness (Kurz, MacIver
& Saville, 2009) variables.
• MacIver, Kurz & Saville (2009) validated Great 8 Totals on a
mixed occupational group (N=308) for external ratings of
Global performance (3 item scale) with NEO (.20
uncorrected) and Wave Professional Styles (.32).
• Kurz & MacIver (2013) paper ‘From the Big Five to the Big
One’ researched the nature and validity of ‘Big One’ scores
on the same sample.

General Factor of Personality (GFP) Critique
Social desirability Statistical
by-product
Ridiculous!
Not consistent-
invariant
GFP has led to scientific debate:
Source:
Dimitri van der Linden (2012): The
General Factor of Personality (GFP)
The ‘debate’ and its relevance for
Selection and Assessment

Structure of the GFP
Van der Linden, Nijenhuis & Bakker (2010; JRP) analysed Big 5 correlations matrices of K=212
independent samples (Total N = 144 117).
Big 5 Scales Factor
Loadings
Openness .42
Conscientiousness .63
Extraversion .57
Agreeableness .57
Neuroticism - .62
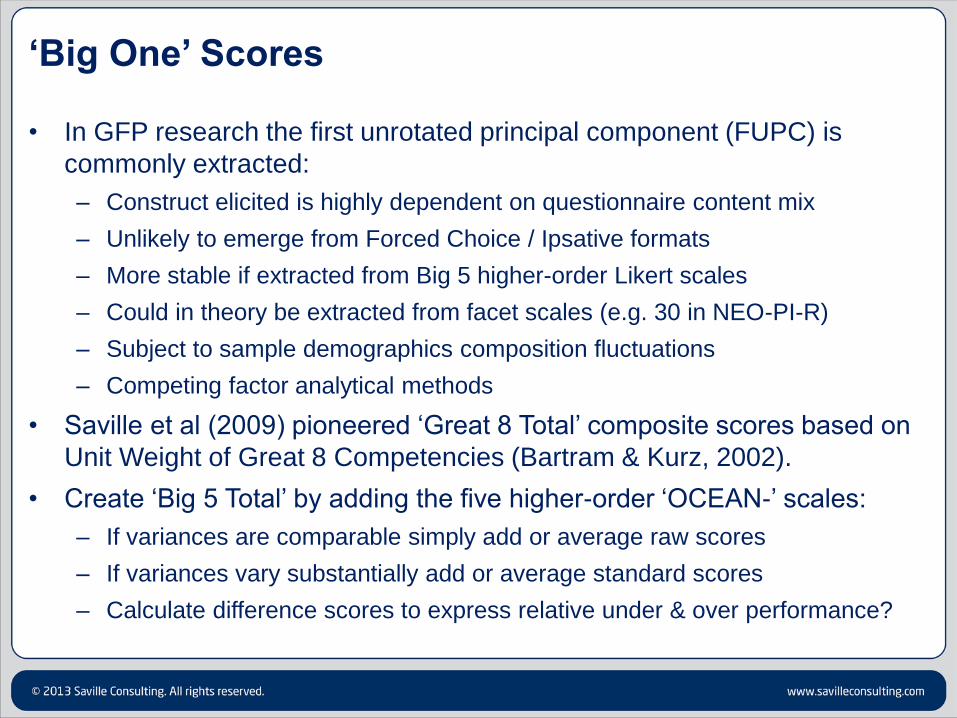
‘Big One’ Scores
• In GFP research the first unrotated principal component (FUPC) is
commonly extracted:
– Construct elicited is highly dependent on questionnaire content mix
– Unlikely to emerge from Forced Choice / Ipsative formats
– More stable if extracted from Big 5 higher-order Likert scales
– Could in theory be extracted from facet scales (e.g. 30 in NEO-PI-R)
– Subject to sample demographics composition fluctuations
– Competing factor analytical methods
• Saville et al (2009) pioneered ‘Great 8 Total’ composite scores based on
Unit Weight of Great 8 Competencies (Bartram & Kurz, 2002).
• Create ‘Big 5 Total’ by adding the five higher-order ‘OCEAN-’ scales:
– If variances are comparable simply add or average raw scores
– If variances vary substantially add or average standard scores
– Calculate difference scores to express relative under & over performance?
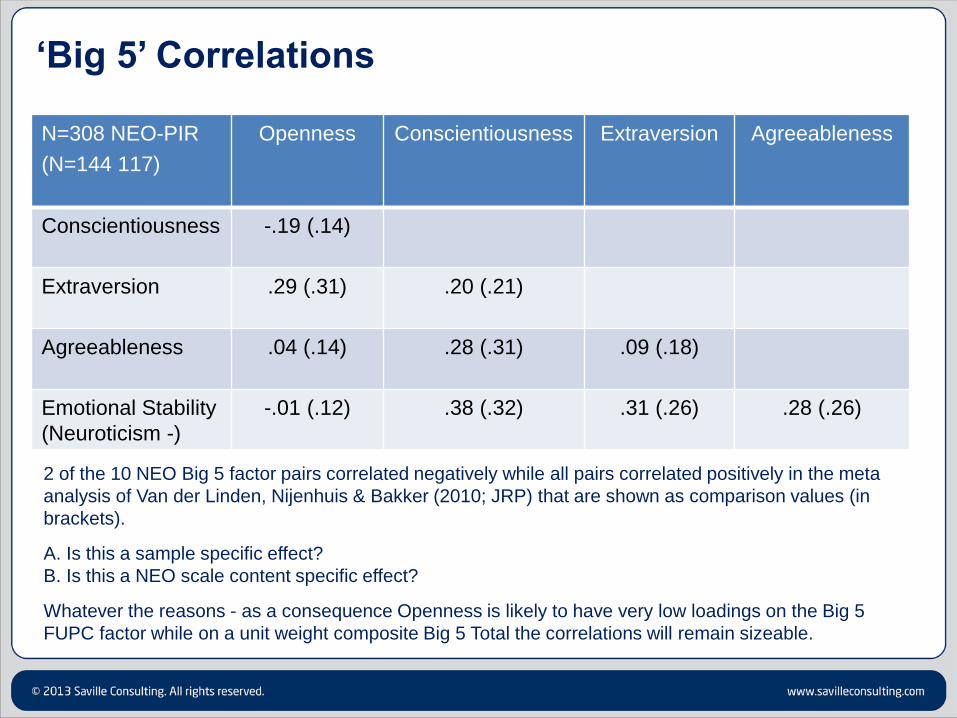
‘Big 5’ Correlations
N=308 NEO-PIR
(N=144 117)
Openness Conscientiousness Extraversion Agreeableness
Conscientiousness
-.19 (.14)
Extraversion
.29 (.31) .20 (.21)
Agreeableness
.04 (.14) .28 (.31) .09 (.18)
Emotional Stability
(Neuroticism -)
-.01 (.12) .38 (.32) .31 (.26) .28 (.26)
2 of the 10 NEO Big 5 factor pairs correlated negatively while all pairs correlated positively in the meta
analysis of Van der Linden, Nijenhuis & Bakker (2010; JRP) that are shown as comparison values (in
brackets).
A. Is this a sample specific effect?
B. Is this a NEO scale content specific effect?
Whatever the reasons - as a consequence Openness is likely to have very low loadings on the Big 5
FUPC factor while on a unit weight composite Big 5 Total the correlations will remain sizeable.

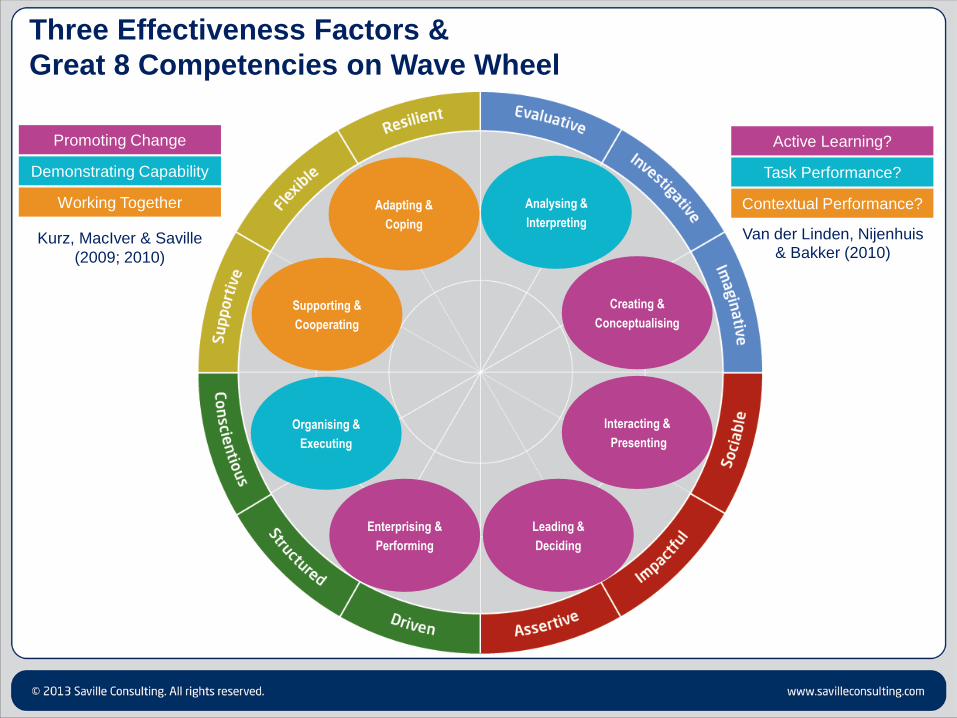
Three Effectiveness Factors
• Kurz et al (2009; 2010) found in Wave Performance 360 data (N=308)
three factors representing well-known Psychological Constructs:
– ‘Working Together’: Agreeableness & Emotional Stability
– ‘Promoting Change’: Openness & Extraversion
– ‘Demonstrating Capability’: Conscientiousness and Reasoning
• The ‘Three Effectiveness Factors’ (3EF) model suggests ‘additions’ to
earlier models:
Kurz, Saville &
MacIver (2009)
Working
Together
Promoting
Change
Demonstrating
Capability
Digman
(1997)
Alpha Beta
DeYoung et al.
(2002)
Stability Plasticity
Hogan & Holland
(2003)
Getting Along Getting Ahead
* putative titles
* ‘Gamma’?
* ‘Getting It
Right’?
* ‘Solidity’?
Supporting &
Cooperating
Analysing &
Interpreting
Task Performance?
Creating &
Conceptualising
Active Learning?
Contextual Performance?
Three Effectiveness Factors &
Great 8 Competencies on Wave Wheel
Adapting &
Coping
Interacting &
Presenting
Leading &
Deciding
Enterprising &
Performing
Organising &
Executing
Demonstrating Capability
Promoting Change
Working Together
Kurz, MacIver & Saville
(2009; 2010)
Van der Linden, Nijenhuis & Bakker (2010)

Validity Comparison
N = 308 Global Performance Global Performance
(Big 5 Total
partialled out)
NEO Big 5 FUPC .17 N/A
NEO Big 5 Total .17 N/A
NEO Great 8 Total .20 N/A
Wave PS Great 8 Total .32 N/A
Openness .03 -.03
Conscientiousness .13 .04
Extraversion .24 .17
Agreeableness -.06 -.20
Emotional Stability (Neuroticism -) .15 .03
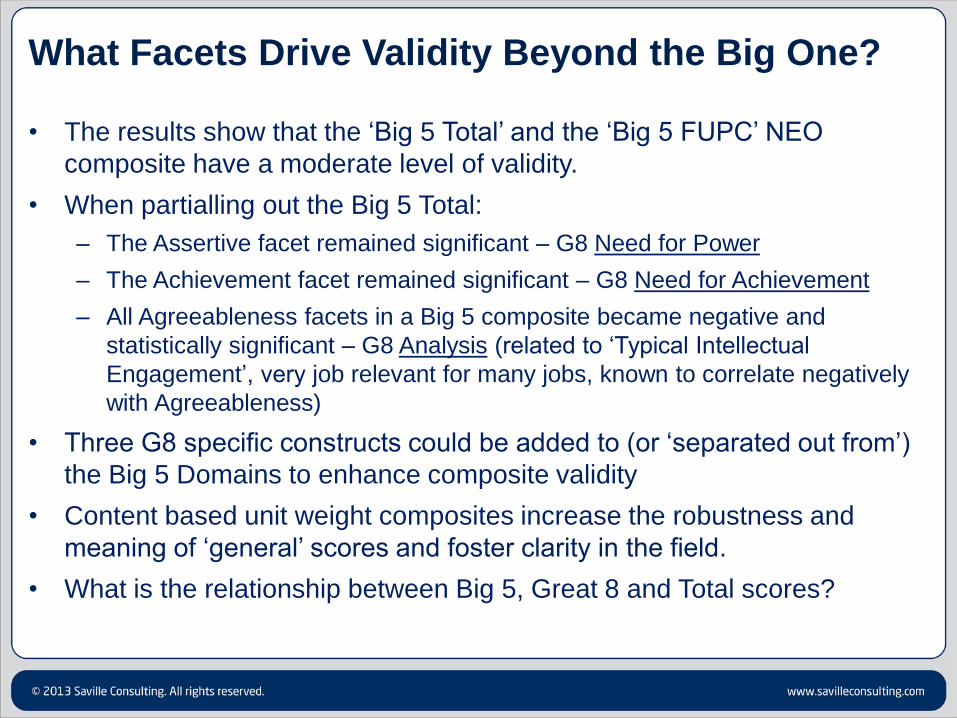
What Facets Drive Validity Beyond the Big One?
• The results show that the ‘Big 5 Total’ and the ‘Big 5 FUPC’ NEO
composite have a moderate level of validity.
• When partialling out the Big 5 Total:
– The Assertive facet remained significant – G8 Need for Power
– The Achievement facet remained significant – G8 Need for Achievement
– All Agreeableness facets in a Big 5 composite became negative and
statistically significant – G8 Analysis (related to ‘Typical Intellectual
Engagement’, very job relevant for many jobs, known to correlate negatively
with Agreeableness)
• Three G8 specific constructs could be added to (or ‘separated out from’)
the Big 5 Domains to enhance composite validity
• Content based unit weight composites increase the robustness and
meaning of ‘general’ scores and foster clarity in the field.
• What is the relationship between Big 5, Great 8 and Total scores?
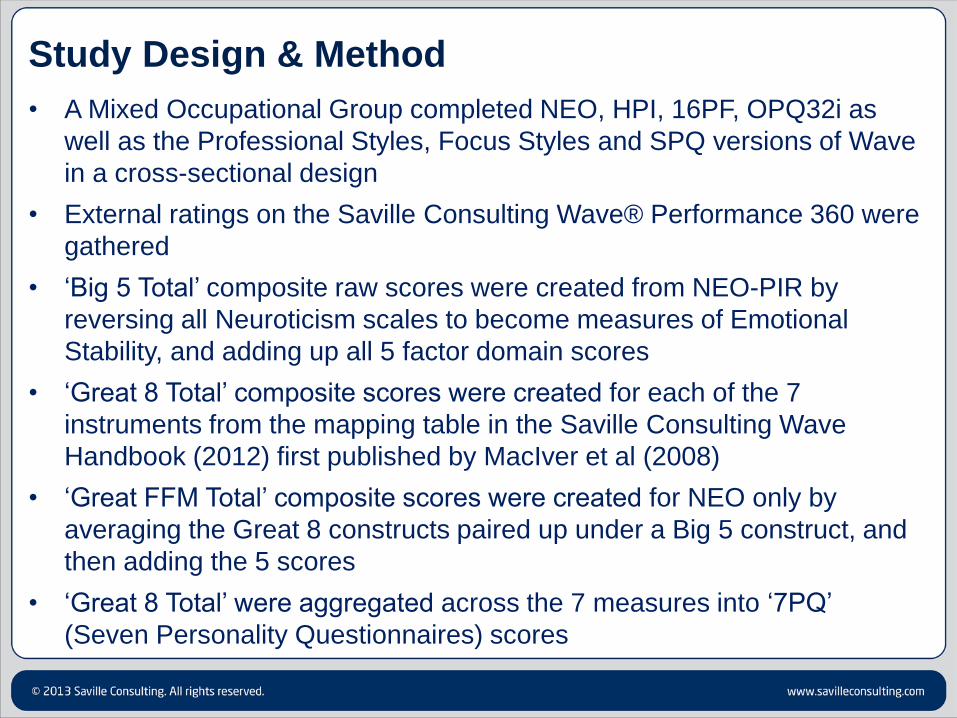
Study Design & Method
• A Mixed Occupational Group completed NEO, HPI, 16PF, OPQ32i as
well as the Professional Styles, Focus Styles and SPQ versions of Wave
in a cross-sectional design
• External ratings on the Saville Consulting Wave® Performance 360 were
gathered
• ‘Big 5 Total’ composite raw scores were created from NEO-PIR by
reversing all Neuroticism scales to become measures of Emotional
Stability, and adding up all 5 factor domain scores
• ‘Great 8 Total’ composite scores were created for each of the 7
instruments from the mapping table in the Saville Consulting Wave
Handbook (2012) first published by MacIver et al (2008)
• ‘Great FFM Total’ composite scores were created for NEO only by
averaging the Great 8 constructs paired up under a Big 5 construct, and
then adding the 5 scores
• ‘Great 8 Total’ were aggregated across the 7 measures into ‘7PQ’
(Seven Personality Questionnaires) scores
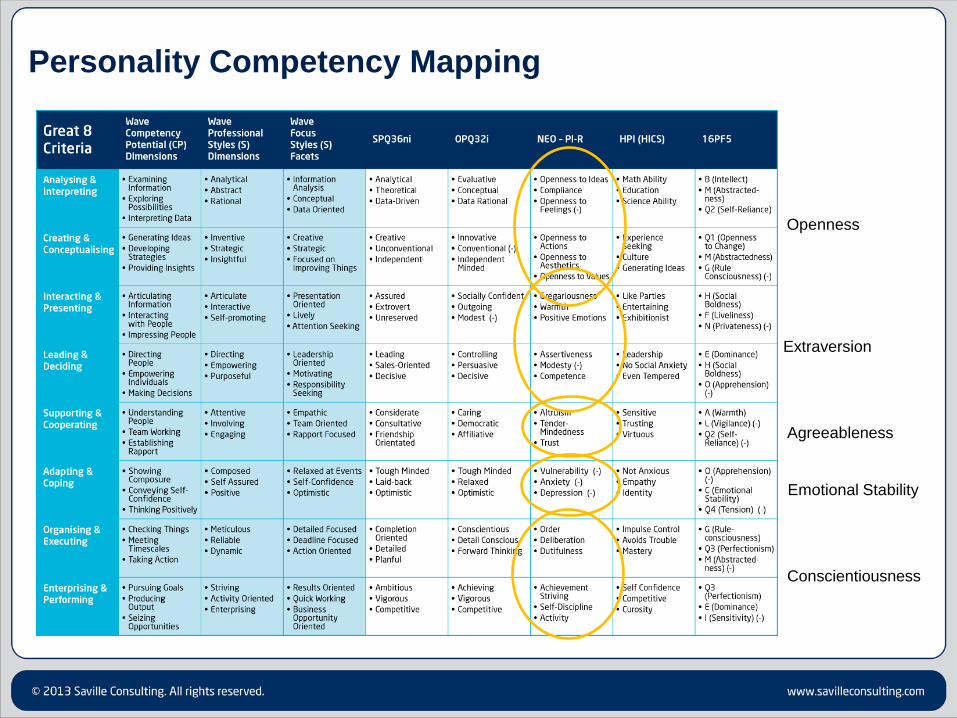
Personality Competency Mapping
Agreeableness
Emotional Stability
Extraversion
Openness
Conscientiousness
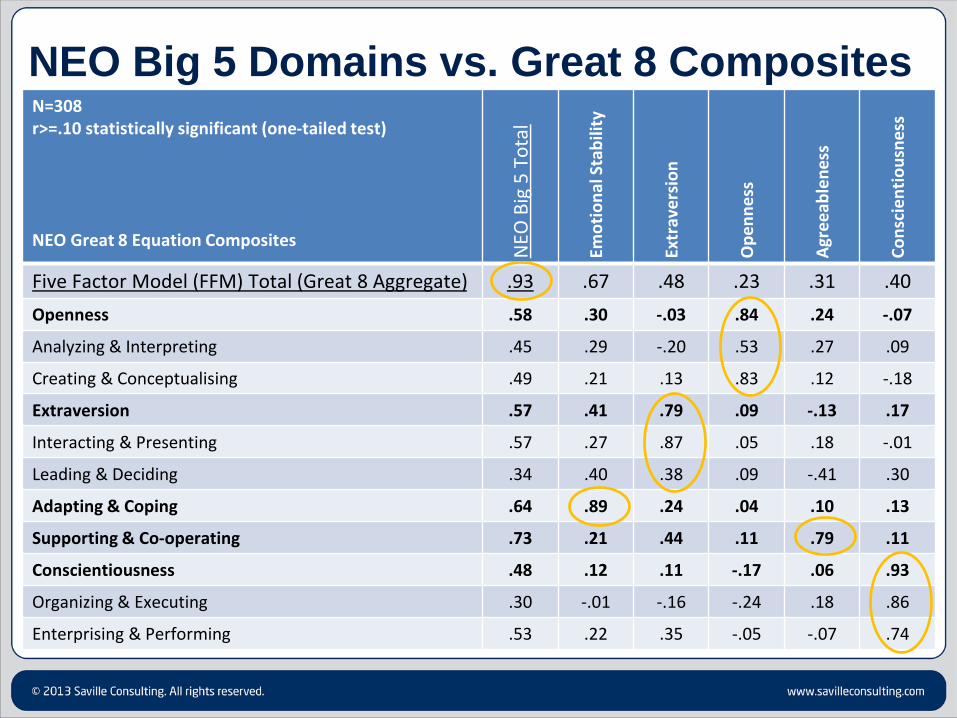
NEO Big 5 Domains vs. Great 8 Composites N=308 r>=.10 statistically significant (one-tailed test) NEO Great 8 Equation Composites
NEO
Big
5 T
ota
l
Emo
tio
nal
Sta
bili
ty
Extr
ave
rsio
n
Op
en
ne
ss
Agr
ee
able
nes
s
Co
nsc
ien
tio
usn
ess
Five Factor Model (FFM) Total (Great 8 Aggregate) .93 .67 .48 .23 .31 .40
Openness .58 .30 -.03 .84 .24 -.07
Analyzing & Interpreting .45 .29 -.20 .53 .27 .09
Creating & Conceptualising .49 .21 .13 .83 .12 -.18
Extraversion .57 .41 .79 .09 -.13 .17
Interacting & Presenting .57 .27 .87 .05 .18 -.01
Leading & Deciding .34 .40 .38 .09 -.41 .30
Adapting & Coping .64 .89 .24 .04 .10 .13
Supporting & Co-operating .73 .21 .44 .11 .79 .11
Conscientiousness .48 .12 .11 -.17 .06 .93
Organizing & Executing .30 -.01 -.16 -.24 .18 .86
Enterprising & Performing .53 .22 .35 -.05 -.07 .74
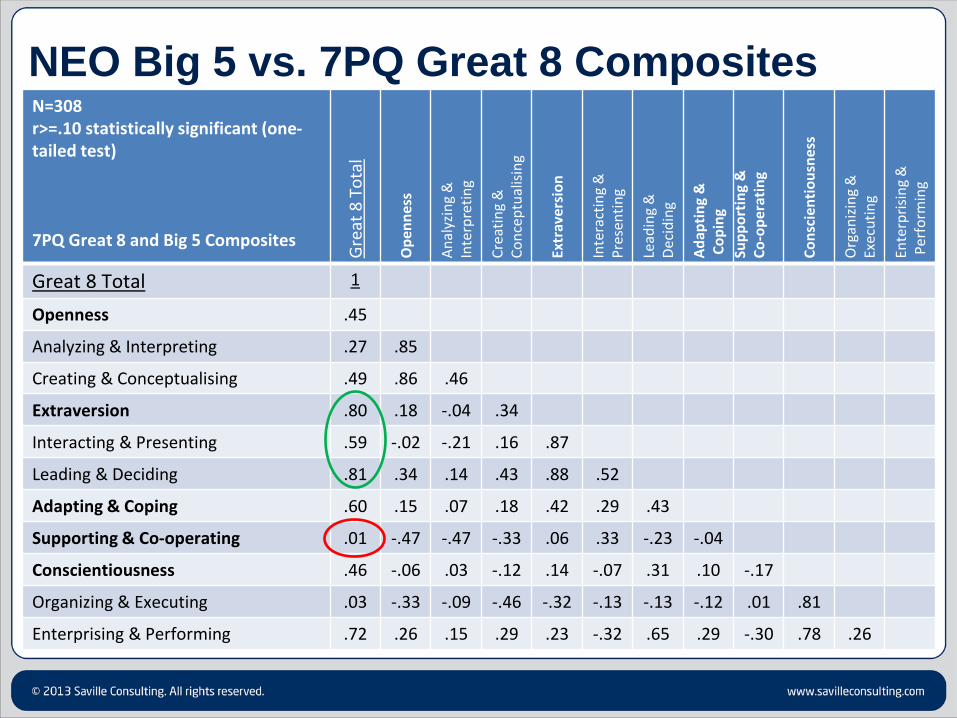
NEO Big 5 vs. 7PQ Great 8 Composites N=308 r>=.10 statistically significant (one-tailed test) 7PQ Great 8 and Big 5 Composites
Gre
at 8
To
tal
Op
enn
ess
An
alyz
ing
&
Inte
rpre
tin
g
Cre
atin
g &
C
on
cep
tual
isin
g
Extr
aver
sio
n
Inte
ract
ing
&
Pre
sen
tin
g
Lead
ing
&
Dec
idin
g
Ad
apti
ng
&
Co
pin
g
Sup
po
rtin
g &
C
o-o
per
atin
g C
on
scie
nti
ou
snes
s
Org
aniz
ing
&
Exec
uti
ng
Ente
rpri
sin
g &
P
erf
orm
ing
Great 8 Total 1
Openness .45
Analyzing & Interpreting .27 .85
Creating & Conceptualising .49 .86 .46
Extraversion .80 .18 -.04 .34
Interacting & Presenting .59 -.02 -.21 .16 .87
Leading & Deciding .81 .34 .14 .43 .88 .52
Adapting & Coping .60 .15 .07 .18 .42 .29 .43
Supporting & Co-operating .01 -.47 -.47 -.33 .06 .33 -.23 -.04
Conscientiousness .46 -.06 .03 -.12 .14 -.07 .31 .10 -.17
Organizing & Executing .03 -.33 -.09 -.46 -.32 -.13 -.13 -.12 .01 .81
Enterprising & Performing .72 .26 .15 .29 .23 -.32 .65 .29 -.30 .78 .26

NEO Big 5 vs. 7PQ Great 8 Composites N=308 r>=.10 statistically significant (one-tailed test) 7PQ Great 8 and Big 5 Composites
NEO
Big
5 T
ota
l
Emo
tio
nal
Sta
bili
ty
Extr
ave
rsio
n
Op
en
ne
ss
Agr
ee
able
nes
s
Co
nsc
ien
tio
usn
ess
Great 8 Total .61 .50 .48 .28 -.14 .27
Openness .11 .10 -.18 .62 -.24 -.07
Analyzing & Interpreting .05 .08 -.34 .41 -.13 .06
Creating & Conceptualising .13 .08 .03 .65 -.28 -.17
Extraversion .33 .36 .61 .16 -.32 -.17
Interacting & Presenting .33 .26 .71 .16 -.32 -.02
Leading & Deciding .24 .36 .36 .12 -.42 .15
Adapting & Coping .52 .81 .29 .06 .09 -.08
Supporting & Co-operating .44 .02 .41 .04 .61 -.06
Conscientiousness .27 .08 .11 -.27 -.12 .79
Organizing & Executing .18 -.06 -.13 -.39 .18 .76
Enterprising & Performing .25 .20 .31 -.03 -.39 .48

Results
• Fairly high convergence between Big 5 and Great 8 constructs
• Within NEO .93 correlation between ‘Big 5 Total’ (aggregation via domain raw
scores) and ‘Great FFM Total’ (aggregation via Great 8 mapping table)
• NEO ‘Big 5 Total’ composite scores correlated .61 with the 7PQ ‘Great 8 Total’.
• Big 5 Domain correlations with 7PQ FFM counter-parts >=.61
• Where a Big 5 Domain has got a pair of Great 8 Factors their pattern varies
considerably
• What about validity?
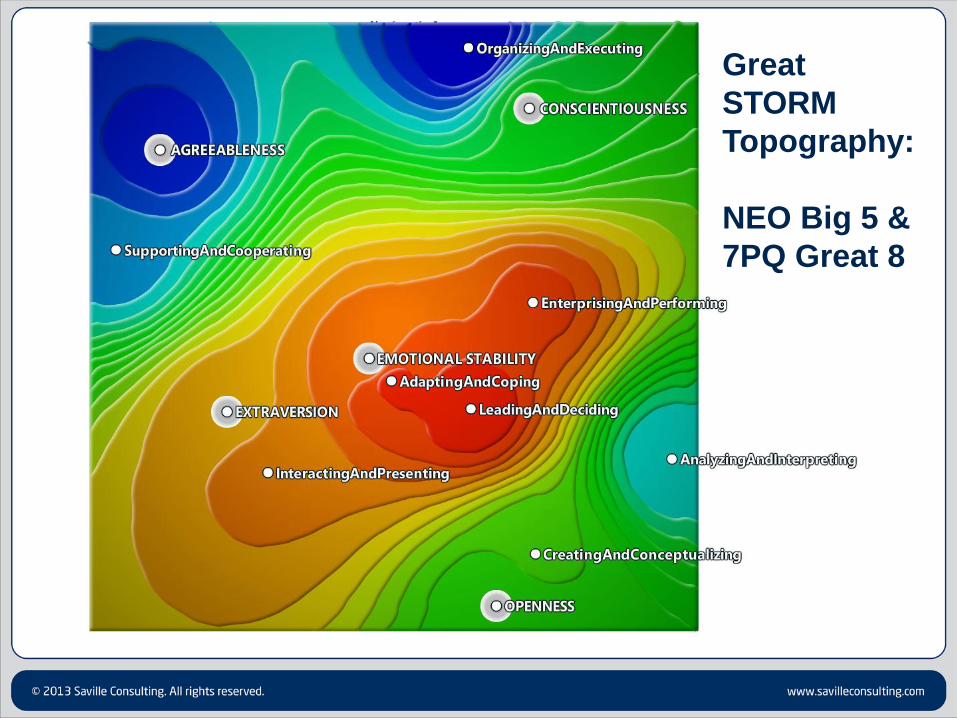
Great
STORM
Topography:
NEO Big 5 &
7PQ Great 8
Construct Convergence of
Big 5 Personality and Great 8 Competency Variables
Dr Rainer Kurz, Saville Consulting
Contact: [email protected]
The Relationship Between General
Mental Ability and the General
Factor of Personality: Findings from
Meta-analytic Data
Prof. Matthias Ziegler, Humboldt Universität zu Berlin
Dr. Jonas Bertling, ETS
EAWOP, May 2013
# 25
Agenda
GFP and intelligence
• prior findings
• 2 explanations
Study idea
Data
Method
Results
Discussion
© Prof. Dr. Matthias Ziegler, 2013

# 26
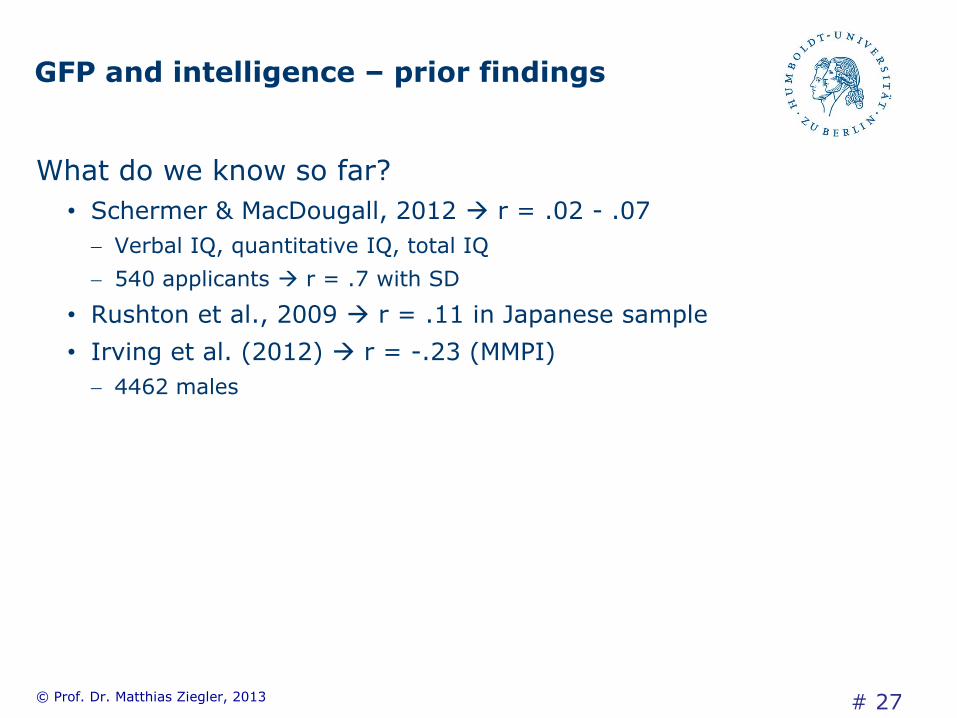
GFP and intelligence – prior findings
What do we know so far?
• Webb, 1915 r = .26
194 male students
• Schermer & Vernon, 2010 r = .26-.28
507 siblings
• Loehlin, 2011 r = .28
490 monozygotic and 317 dizygotic twin pairs
© Prof. Dr. Matthias Ziegler, 2013
# 27
GFP and intelligence – prior findings
What do we know so far?
• Schermer & MacDougall, 2012 r = .02 - .07
Verbal IQ, quantitative IQ, total IQ
540 applicants r = .7 with SD
• Rushton et al., 2009 r = .11 in Japanese sample
• Irving et al. (2012) r = -.23 (MMPI)
4462 males
© Prof. Dr. Matthias Ziegler, 2013

# 28
GFP and intelligence – prior findings
What do we know so far? Mixed findings
• Mostly GFP from questionnaires like NEO or PRF
• Mostly intelligence as g factor derived from EFA
• What about second order factors of intelligence?
gf and gc
© Prof. Dr. Matthias Ziegler, 2013

# 29
GFP and intelligence – 2 explanations
GFP as substance
• Life History Theory: fast and slow parental investment strategies
Extend to which slow strategy is followed co-selects for a number of
attributes including GFP and intelligence correlation
• Evidence from heritability studies
Intelligence
Davies et al., 2011 → 40% of gc and 51% of gf accounted for by linkage
disequilibrium
GFP
Just (2011) in a review up to 82% of the GFP
Riemann & Kandler (2010) did not even find a GFP...
So, GFP is heritable, g and its components are heritable,
therefore, LHT supported! Really?
GFP should be equally correlated to both, gf and gc or stronger
to gf (adjustment)
© Prof. Dr. Matthias Ziegler, 2013

# 30
GFP and intelligence – 2 explanations
GFP as social desirability / faking (SD)
• Numerous studies support the idea
Bäckström et al. (2009), Danay & Ziegler (2011), Ziegler & Bühner
(2009), ...
• How should the correlations with intelligence be, if GFP = SD
socially desirable answers require knowledge about what a society values
and what specific aspects are desired in a given situation
Ziegler, MacCann, & Roberts, 2011
Thus specific knowledge is necessary
König, Melchers, Kleinmann, Richter, & Klehe, 2006, 2007; Ziegler, 2011
GFP should be more strongly correlated with gc than gf
© Prof. Dr. Matthias Ziegler, 2013
# 31
GFP and intelligence – 2 explanations
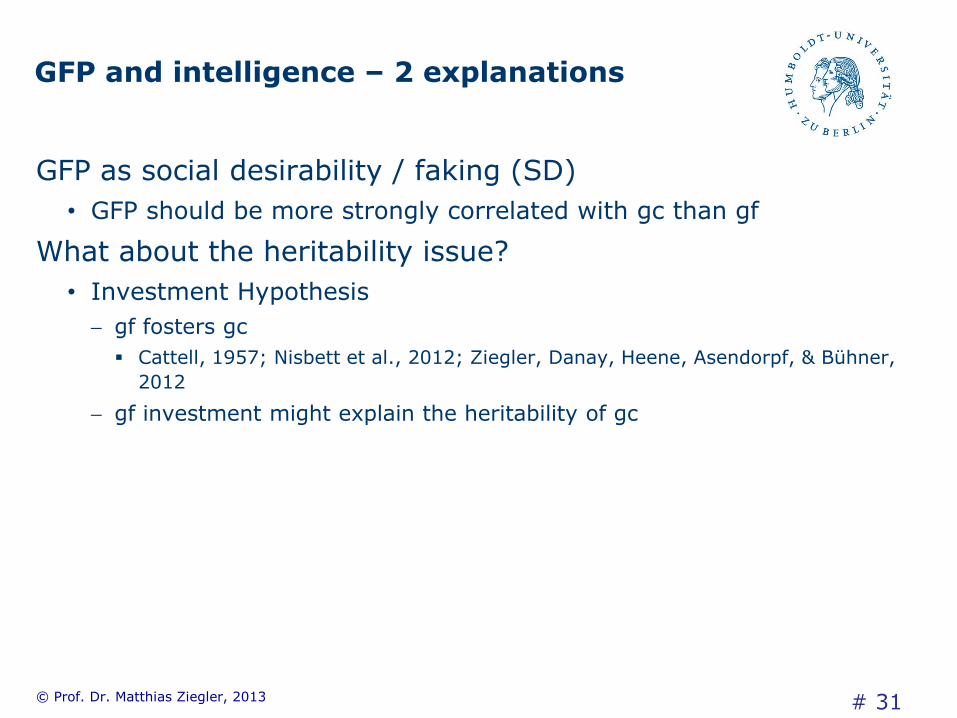
GFP as social desirability / faking (SD)
• GFP should be more strongly correlated with gc than gf
What about the heritability issue?
• Investment Hypothesis
gf fosters gc
Cattell, 1957; Nisbett et al., 2012; Ziegler, Danay, Heene, Asendorpf, & Bühner,
2012
gf investment might explain the heritability of gc
© Prof. Dr. Matthias Ziegler, 2013
# 32
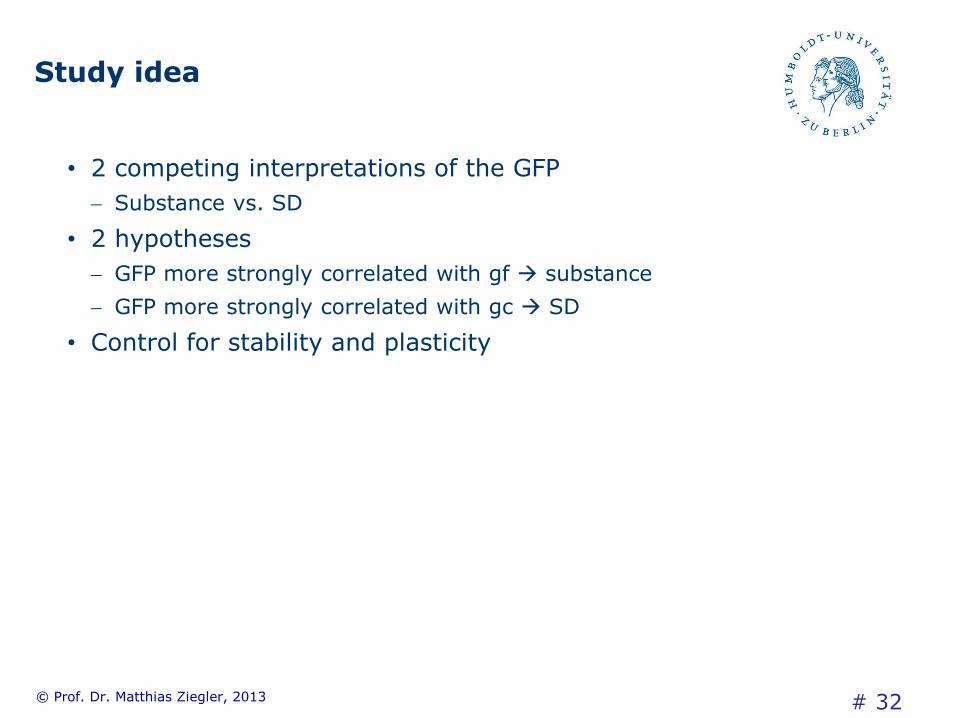
Study idea
• 2 competing interpretations of the GFP
Substance vs. SD
• 2 hypotheses
GFP more strongly correlated with gf substance
GFP more strongly correlated with gc SD
• Control for stability and plasticity
© Prof. Dr. Matthias Ziegler, 2013
# 33
Data
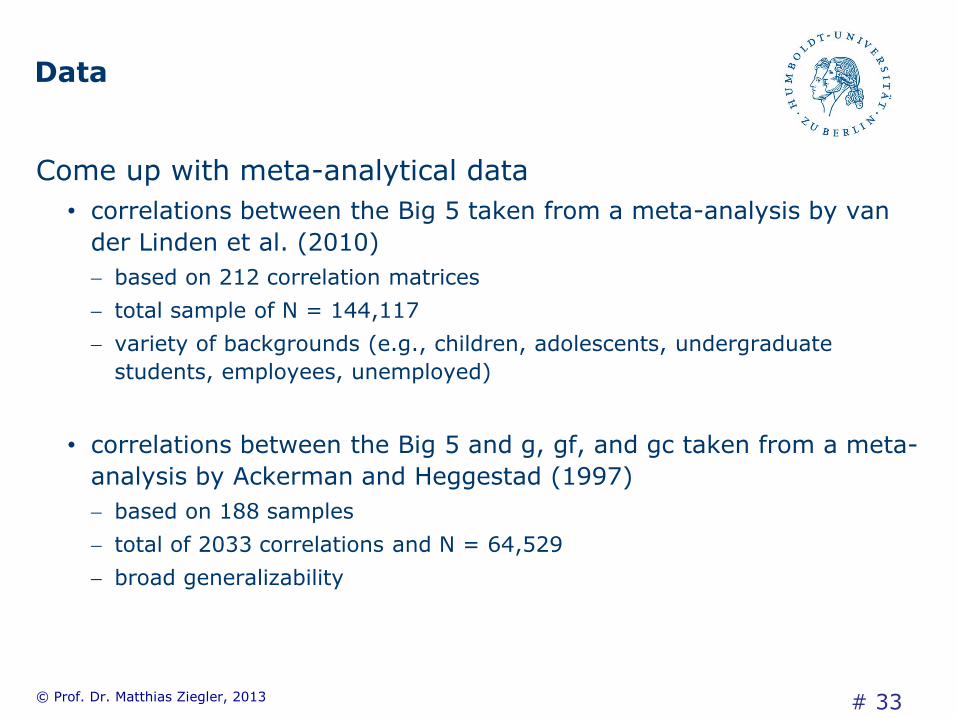
Come up with meta-analytical data
• correlations between the Big 5 taken from a meta-analysis by van
der Linden et al. (2010)
based on 212 correlation matrices
total sample of N = 144,117
variety of backgrounds (e.g., children, adolescents, undergraduate
students, employees, unemployed)
• correlations between the Big 5 and g, gf, and gc taken from a meta-
analysis by Ackerman and Heggestad (1997)
based on 188 samples
total of 2033 correlations and N = 64,529
broad generalizability
© Prof. Dr. Matthias Ziegler, 2013
# 34
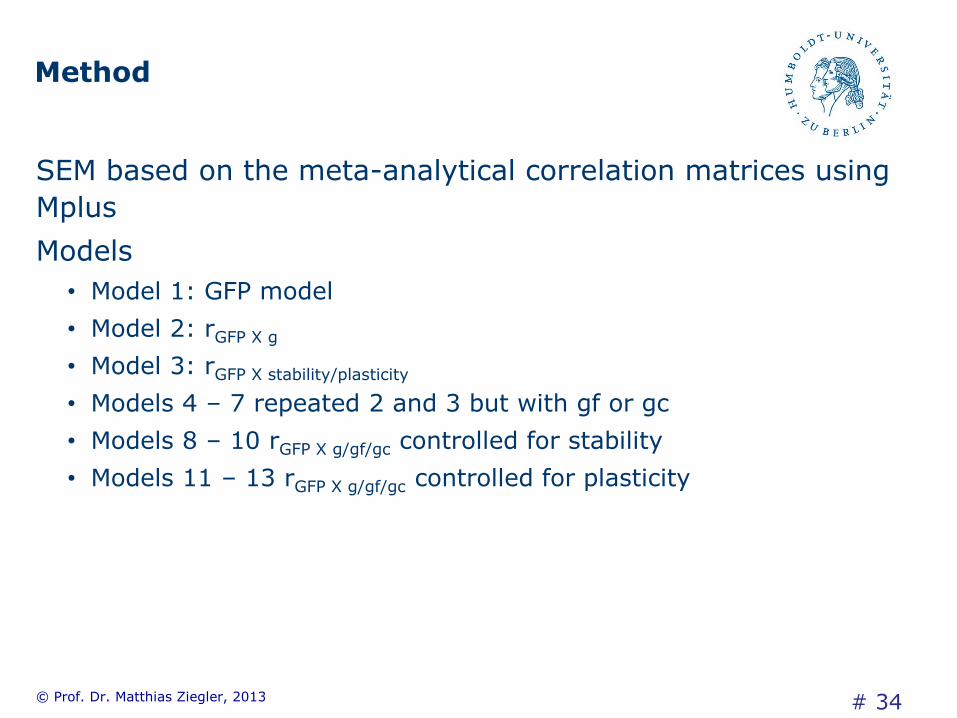
Method
SEM based on the meta-analytical correlation matrices using
Mplus
Models
• Model 1: GFP model
• Model 2: rGFP X g
• Model 3: rGFP X stability/plasticity
• Models 4 – 7 repeated 2 and 3 but with gf or gc
• Models 8 – 10 rGFP X g/gf/gc controlled for stability
• Models 11 – 13 rGFP X g/gf/gc controlled for plasticity
© Prof. Dr. Matthias Ziegler, 2013

# 35
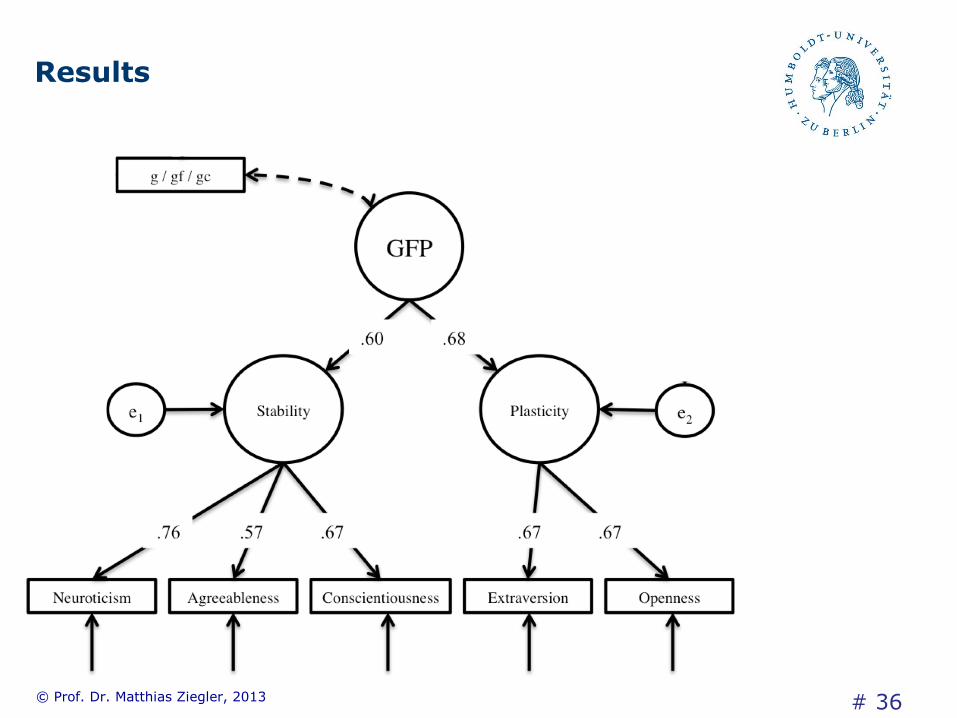
Results
© Prof. Dr. Matthias Ziegler, 2013
# 36
Results
© Prof. Dr. Matthias Ziegler, 2013

# 37
Results
© Prof. Dr. Matthias Ziegler, 2013

# 38
Results
© Prof. Dr. Matthias Ziegler, 2013
# 39
Discussion
Summary of main findings
• Correlation between GFP and g similar to most previous studies
• Stronger correlation with gc
• After partialling plasticity, GFP hardly related to cognitive ability
Not shown Openness responsible
© Prof. Dr. Matthias Ziegler, 2013
# 40
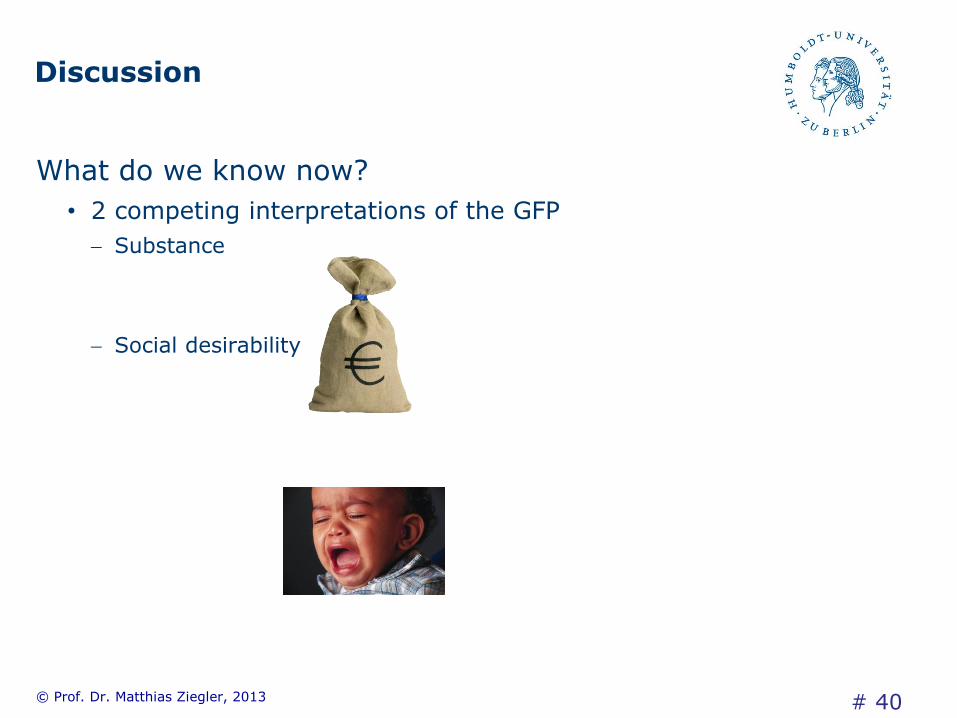
Discussion
What do we know now?
• 2 competing interpretations of the GFP
Substance
Social desirability
© Prof. Dr. Matthias Ziegler, 2013

# 41
Discussion
Outlook
• Focus on stability and plasticity
• Explore the role of Openness
• SD not necessarily an artifact, might have (even evolutionary) value
Practical considerations
• GFP unsuited for personnel selection and personnel development (so
far)
© Prof. Dr. Matthias Ziegler, 2013

# 42
Matthias Ziegler
Humboldt Universität zu Berlin
Institut für Psychologie
Unter den Linden 6
10099 Berlin
phone.: +49 30 / 2093 9447
fax: +49 30 / 2093 9361
Email: [email protected]
Thanks for listening!

© Copyright 2013 OPP Ltd. All rights reserved. Company confidential
Is the ‘Big One’ too big to be useful?
Rob Bailey
OPP Ltd
EAWOP, May 2013
© C
op
yrig
ht
20
13
OP
P L
td. A
ll ri
ghts
res
erve
d.
Co
mp
an
y co
nfi
den
tia
l
Presentation overview
Brief introduction and background
Attempts to find a single factor in 16PF data
Exploration of the utility of broad vs. specific factors
Discussion of findings and implications
© C
op
yrig
ht
20
13
OP
P L
td. A
ll ri
ghts
res
erve
d.
Co
mp
an
y co
nfi
den
tia
l
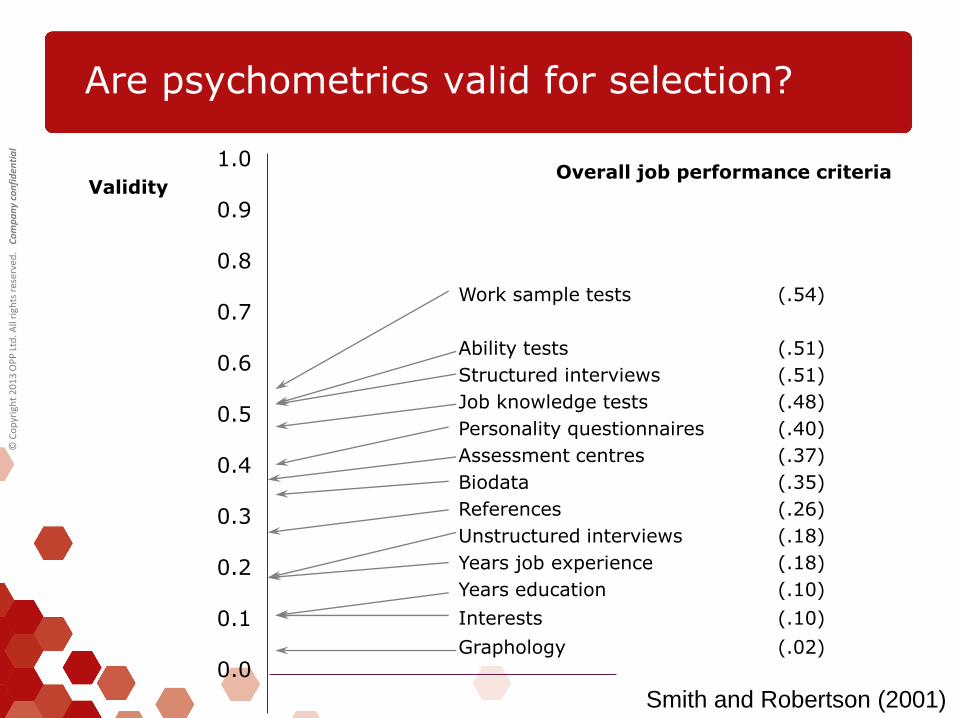
Are psychometrics valid for selection?
1.0
0.9
0.8
0.7
0.6
0.5
0.4
0.3
0.2
0.1
0.0
Work sample tests (.54)
Ability tests (.51)
Structured interviews (.51)
Job knowledge tests (.48)
Personality questionnaires (.40)
Assessment centres (.37)
Biodata (.35)
References (.26)
Unstructured interviews (.18)
Years job experience (.18)
Years education (.10)
Interests (.10)
Graphology (.02)
Validity Overall job performance criteria
Smith and Robertson (2001)

© C
op
yrig
ht
20
13
OP
P L
td. A
ll ri
ghts
res
erve
d.
Co
mp
an
y co
nfi
den
tia
l
Introduction
Personality is a reliable predictor of job satisfaction and success The structure of personality has come under much debate in recent years

© C
op
yrig
ht
20
13
OP
P L
td. A
ll ri
ghts
res
erve
d.
Co
mp
an
y co
nfi
den
tia
l
Introduction
The 5-Factor structure of personality as the most parsimonious structure of personality has been questioned, given observations of inter-correlations among the traits (Digman, 1997)
A two-factor structure has been argued by some researchers:
- Alpha / Beta model (Digman, 1997)
- Stability / Plasticity (DeYoung et al, 2001)
Researchers have recently proposed a universal single-factor structure to personality (The General Factor of Personality, GFP, e.g. Musek, 2007; van der Linden, Nijenhuis, & Bakker, 2010)
© C
op
yrig
ht
20
13
OP
P L
td. A
ll ri
ghts
res
erve
d.
Co
mp
an
y co
nfi
den
tia
l
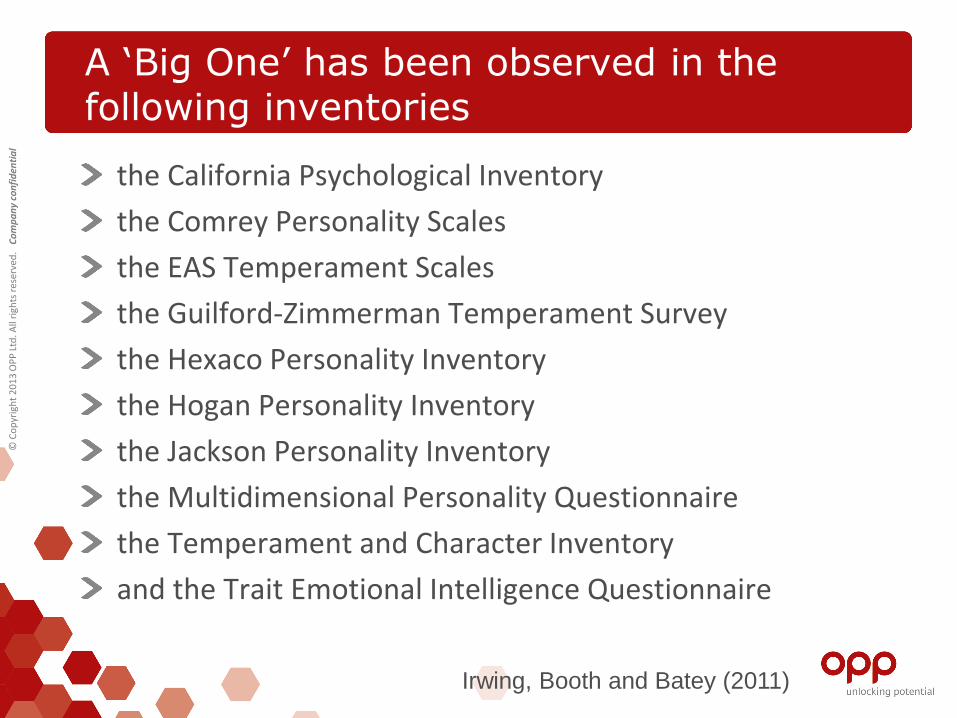
A ‘Big One’ has been observed in the following inventories
the California Psychological Inventory
the Comrey Personality Scales
the EAS Temperament Scales
the Guilford-Zimmerman Temperament Survey
the Hexaco Personality Inventory
the Hogan Personality Inventory
the Jackson Personality Inventory
the Multidimensional Personality Questionnaire
the Temperament and Character Inventory
and the Trait Emotional Intelligence Questionnaire
Irwing, Booth and Batey (2011)

© C
op
yrig
ht
20
13
OP
P L
td. A
ll ri
ghts
res
erve
d.
Co
mp
an
y co
nfi
den
tia
l
What’s in the general factor of personality?
Individuals high on the GFP: – Altruistic – Relaxed – Sociable – Intellectually open – High levels of well-being – Satisfied with life – High self-esteem – Emotional intelligence
Individuals low on the GFP: – Not altruistic – Tense – Reserved – Tough-minded – Low well-being – Dissatisfied with life – Low self-esteem – Lack of emotional intelligence
Good? Bad?
© C
op
yrig
ht
20
13
OP
P L
td. A
ll ri
ghts
res
erve
d.
Co
mp
an
y co
nfi
den
tia
l
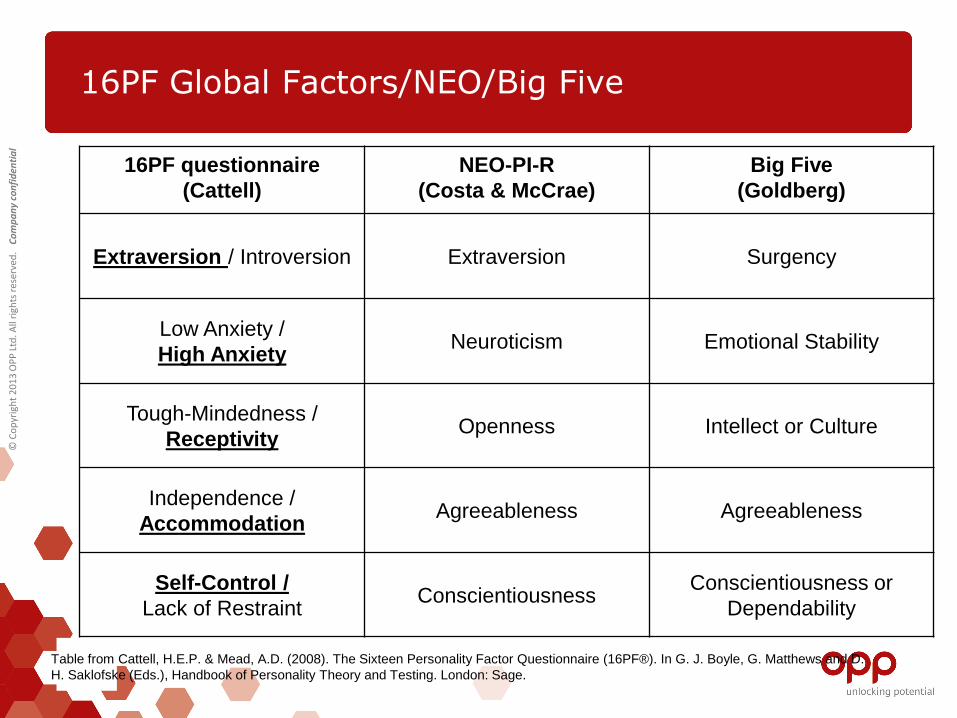
16PF Global Factors/NEO/Big Five
Table from Cattell, H.E.P. & Mead, A.D. (2008). The Sixteen Personality Factor Questionnaire (16PF®). In G. J. Boyle, G. Matthews and D.
H. Saklofske (Eds.), Handbook of Personality Theory and Testing. London: Sage.
16PF questionnaire
(Cattell)
NEO-PI-R
(Costa & McCrae)
Big Five
(Goldberg)
Extraversion / Introversion Extraversion Surgency
Low Anxiety /
High Anxiety Neuroticism Emotional Stability
Tough-Mindedness /
Receptivity Openness Intellect or Culture
Independence /
Accommodation Agreeableness Agreeableness
Self-Control /
Lack of Restraint Conscientiousness
Conscientiousness or
Dependability
© C
op
yrig
ht
20
13
OP
P L
td. A
ll ri
ghts
res
erve
d.
Co
mp
an
y co
nfi
den
tia
l
Is this any use in practice?
• Two criteria which should be considered:
1) Conceptual considerations and empirical evidence
2) Utility for practitioner and value for respondent

© C
op
yrig
ht
20
13
OP
P L
td. A
ll ri
ghts
res
erve
d.
Co
mp
an
y co
nfi
den
tia
l
Previous empirical study: Personality and leadership (Herrmann and Bailey, 2009)
Predictors: Global Factors Predictors: Primary Factors
Leadership skill Predictors
entered
Predictors
included R
Explained
variance
(adjusted)
Predictors
entered
Predictors
included R
Explained
variance
(adjusted)
Doing whatever it
takes IN, EX IN 0.370 13%
E, H, L, Q1,
A, F, N, Q2 E, H 0.387 14%
Decisiveness IN, AX AX- 0.287 8% E, H, L, Q1,
C, O, Q4 Q4, E, O-, C 0.407 15%
Confronting problem
employees IN IN 0.282 8% E, H, L, Q1 E 0.340 11%
Putting people at
ease EX EX 0.241 5%
A, F, H, N,
Q2 N, F, H 0.341 11%

© C
op
yrig
ht
20
13
OP
P L
td. A
ll ri
ghts
res
erve
d.
Co
mp
an
y co
nfi
den
tia
l
© Copyright 2013 OPP Ltd. All rights reserved. Company confidential
Method: measures, participants, procedure
© C
op
yrig
ht
20
13
OP
P L
td. A
ll ri
ghts
res
erve
d.
Co
mp
an
y co
nfi
den
tia
l
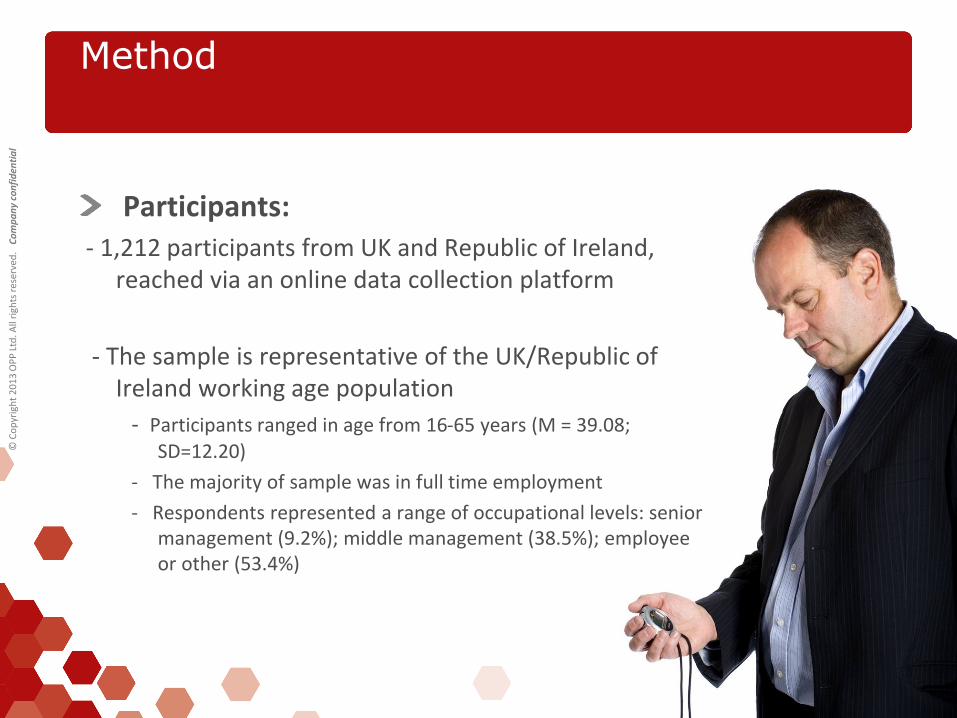
Method
Participants: - 1,212 participants from UK and Republic of Ireland,
reached via an online data collection platform
- The sample is representative of the UK/Republic of Ireland working age population
- Participants ranged in age from 16-65 years (M = 39.08; SD=12.20)
- The majority of sample was in full time employment
- Respondents represented a range of occupational levels: senior management (9.2%); middle management (38.5%); employee or other (53.4%)
© C
op
yrig
ht
20
13
OP
P L
td. A
ll ri
ghts
res
erve
d.
Co
mp
an
y co
nfi
den
tia
l
Method
Measures: - Personality: 185-item European English Version of
the 16 Personality Factor (16PF) 5th Edition Questionnaire (Cattell, & Cattell, 1995)
- Criteria: A battery of additional criterion questions, examining: work preferences, lifestyle choices, topical questions (e.g. attitudes to the recession), and demographics

© C
op
yrig
ht
20
13
OP
P L
td. A
ll ri
ghts
res
erve
d.
Co
mp
an
y co
nfi
den
tia
l
5. How satisfied are you with your current job?
(1=very dissatisfied, 2=quite dissatisfied, 3=neither satisfied nor dissatisfied, 4=quite satisfied, 5=very satisfied)
6. How much do you enjoy the work you do in your current job?
(1=not at all, 2=slightly, 3=quite a lot, 4=very much)
7. How often do you think about quitting your current job (if at all)?
(1=never, 2=rarely, 3=sometimes, 4=often, 5=very often)
8. How likely are you to change job or get another job in the next year?
(1=very unlikely, 2=quite unlikely, 3=unsure, 4=quite likely, 5=very likely)
13. To what extent does your work give you intellectual stimulation?
(1=not at all, 2=quite, 3=very)
19. How much do you invest emotionally in your work?
(1=not at all, 2=to some extent, 3=to a great extent)
Satisfaction at work
© C
op
yrig
ht
20
13
OP
P L
td. A
ll ri
ghts
res
erve
d.
Co
mp
an
y co
nfi
den
tia
l
Method
Analysis: Factor Analysis:
PCA
PAF
Weighed regression equations to create factor scores
Linear regression

© C
op
yrig
ht
20
13
OP
P L
td. A
ll ri
ghts
res
erve
d.
Co
mp
an
y co
nfi
den
tia
l
© Copyright 2013 OPP Ltd. All rights reserved. Company confidential
Results

© C
op
yrig
ht
20
13
OP
P L
td. A
ll ri
ghts
res
erve
d.
Co
mp
an
y co
nfi
den
tia
l
A single factor solution was not a good fit
Fewest possible factors: 2
Replicated in UK and US data
Results
UK Factor 1
UK Factor 2
US Factor 1 US Factor 2
Extraversion -.735 .429 -.664 .499
Anxiety .214 -.859 .061 -.822
Tough-Mindedness .759 .359 .771 .342
Independence -.611 .072 -.656 .369
Self Control .573 .471 .597 .604
UK, N = 1,202 US, N = 30,567
© C
op
yrig
ht
20
13
OP
P L
td. A
ll ri
ghts
res
erve
d.
Co
mp
an
y co
nfi
den
tia
l
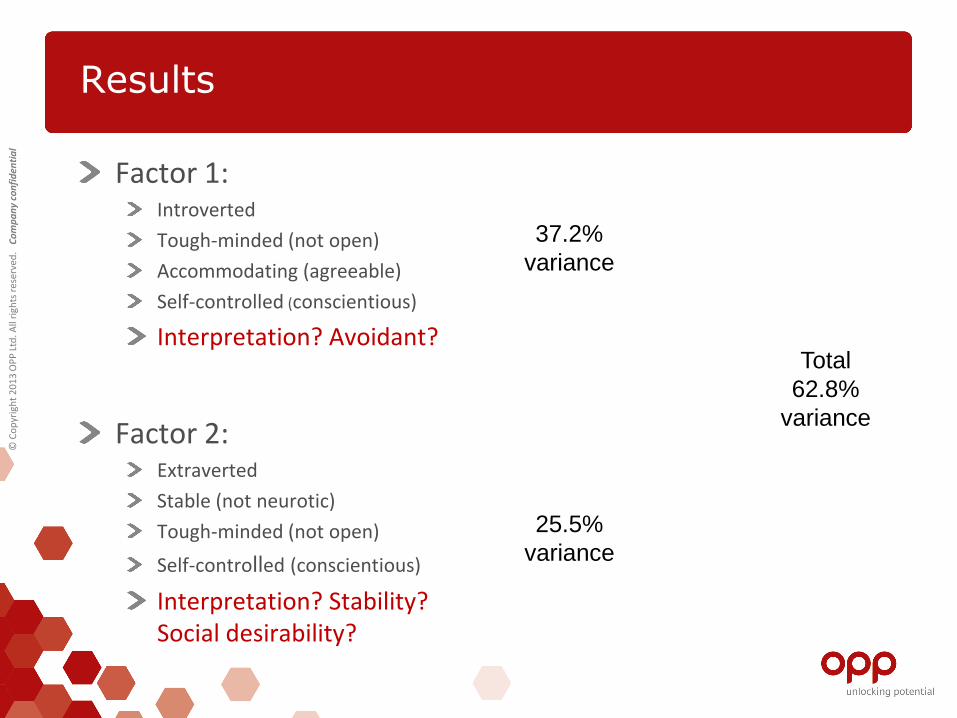
Results
Factor 1: Introverted
Tough-minded (not open)
Accommodating (agreeable)
Self-controlled (conscientious)
Interpretation? Avoidant?
Factor 2: Extraverted
Stable (not neurotic)
Tough-minded (not open)
Self-controlled (conscientious)
Interpretation? Stability? Social desirability?
37.2%
variance
25.5%
variance
Total
62.8%
variance
© C
op
yrig
ht
20
13
OP
P L
td. A
ll ri
ghts
res
erve
d.
Co
mp
an
y co
nfi
den
tia
l
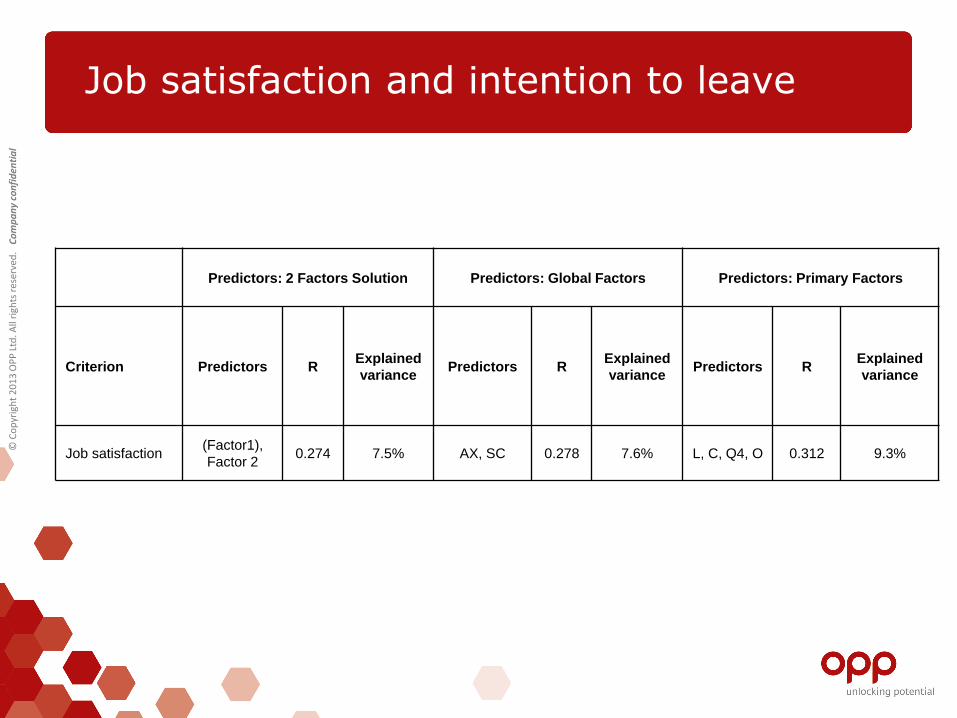
Predictors: 2 Factors Solution Predictors: Global Factors Predictors: Primary Factors
Criterion Predictors R Explained
variance Predictors R
Explained
variance Predictors R
Explained
variance
Job satisfaction (Factor1),
Factor 2 0.274 7.5% AX, SC 0.278 7.6% L, C, Q4, O 0.312 9.3%
Job satisfaction and intention to leave

© C
op
yrig
ht
20
13
OP
P L
td. A
ll ri
ghts
res
erve
d.
Co
mp
an
y co
nfi
den
tia
l
© Copyright 2013 OPP Ltd. All rights reserved. Company confidential
Discussion
© C
op
yrig
ht
20
13
OP
P L
td. A
ll ri
ghts
res
erve
d.
Co
mp
an
y co
nfi
den
tia
l
Discussion
No adequate single factor in UK or US data
Increased predictive power when using more granular personality data
© C
op
yrig
ht
20
13
OP
P L
td. A
ll ri
ghts
res
erve
d.
Co
mp
an
y co
nfi
den
tia
l
Implications
Trade-off between questionnaire length and validity
Impact on high-stakes applications
Under-estimation of the relevance of personality when conducting research on the Big Five
Diminished credibility of psychology and psychometrics
© C
op
yrig
ht
20
13
OP
P L
td. A
ll ri
ghts
res
erve
d.
Co
mp
an
y co
nfi
den
tia
l
Recommendations
Move away from convenient Big Five studies
Investigate specific personality variables and their relationship with specific criteria

© C
op
yrig
ht
20
13
OP
P L
td. A
ll ri
ghts
res
erve
d.
Co
mp
an
y co
nfi
den
tia
l
© Copyright 2013 OPP Ltd. All rights reserved. Company confidential
Conclusion

© C
op
yrig
ht
20
13
OP
P L
td. A
ll ri
ghts
res
erve
d.
Co
mp
an
y co
nfi
den
tia
l
Conclusion
The single factor of personality is of interest in improving our understanding of personality
The predictive power of personality is not in broad/generic concepts, but in the specifics
It is not analogous to a single factor of intelligence
© C
op
yrig
ht
20
13
OP
P L
td. A
ll ri
ghts
res
erve
d.
Co
mp
an
y co
nfi
den
tia
l
References
Cattell, R.B. (1946). Description and measurement of personality. New York: World Book
Cattell, H.E.P., & Cattell, R.B. (1995) Personality structure and the new fifth edition of the 16PF. Educational and Psychological Measurement, 55(6), 926-937.
Costa, Jr, P.T. And McCrae, R.R. (1989) The NEO-FFI Manual Supplement. Odessa, FLA: Psychological Assessment Resources.
DeYoung, C.G., Peterson, J.B., & Higgins, D.M. (2002). Higher order factors of the big five predict conformity: Are there neuroses of health? Personality and Individual Differences, 33(4), 533-552.
Digman, J.M. (1997). Higher-order factors of the Big Five. Journal of Personality and Social Psychology, 73, 1246-1256.
Goldberg, L.R. (1990). An alternative description of personality: The Big Five factor structure. Journal of Personality and Social Psychology, 59, 1216-1229.
© C
op
yrig
ht
20
13
OP
P L
td. A
ll ri
ghts
res
erve
d.
Co
mp
an
y co
nfi
den
tia
l
References
Judge, T.A., Heller, D. and Mount, M.K. (2002) Five-Factor Model of Personality and Job Satisfaction: A Meta-Analysis. Journal of Applied Psychology, 87 (3), 530-541.
McCrae, R.R., & Costa, P.T. Jr. (1987). Validation of the Five Factor Model of personality across instruments and observers. Journal of Personality and Social Psychology, 52(1), 81-90.
Musek, J. (2007). A general factor of personality: Evidence of the Big One in the Five Factor model. Journal of Research in Personality, 41, 1213-1233.
van der Linden, D., Nijenhuis, J., Bekker, A.B. (2010). The General Factor of Personality: A meta-analysis of Big Five inter-correlations and a criterion-related validity study. Journal of Research in Personality, 44, 315-327.

© C
op
yrig
ht
20
13
OP
P L
td. A
ll ri
ghts
res
erve
d.
Co
mp
an
y co
nfi
den
tia
l
© Copyright 2013 OPP Ltd. All rights reserved. Company confidential
Thank you!
Any questions?
From the Great Eight to the Great One The Great One – Not the First One
Rab MacIver, Saville Consulting
Contact: [email protected]
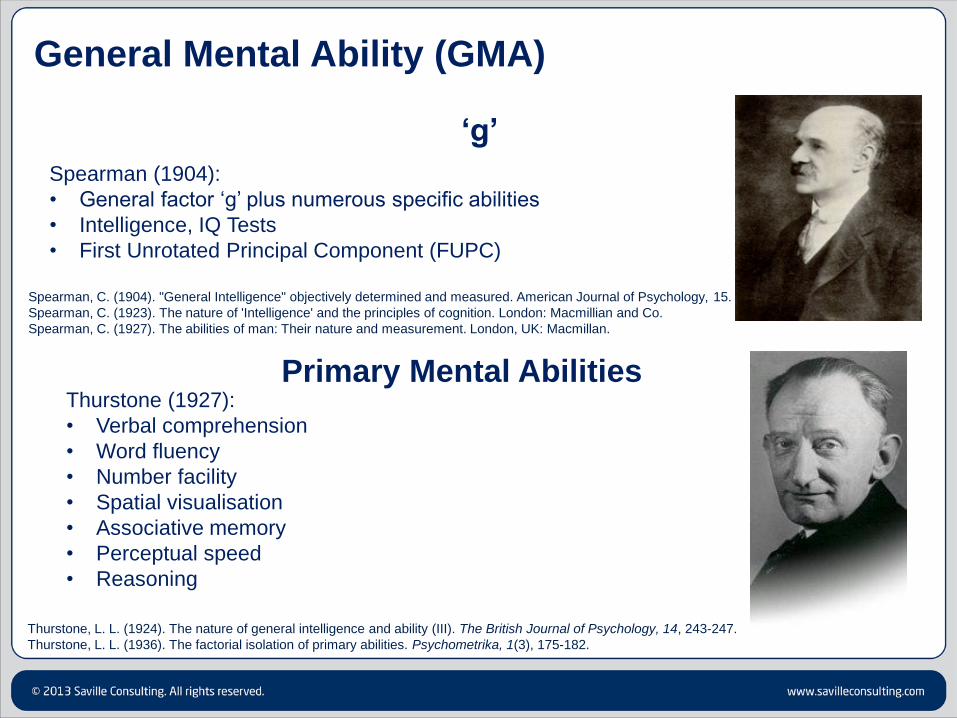
Spearman, C. (1904). "General Intelligence" objectively determined and measured. American Journal of Psychology, 15.
Spearman, C. (1923). The nature of 'Intelligence' and the principles of cognition. London: Macmillian and Co.
Spearman, C. (1927). The abilities of man: Their nature and measurement. London, UK: Macmillan.
‘g’
General Mental Ability (GMA)
Spearman (1904):
• General factor ‘g’ plus numerous specific abilities
• Intelligence, IQ Tests
• First Unrotated Principal Component (FUPC)
Thurstone (1927):
• Verbal comprehension
• Word fluency
• Number facility
• Spatial visualisation
• Associative memory
• Perceptual speed
• Reasoning
Primary Mental Abilities
Thurstone, L. L. (1924). The nature of general intelligence and ability (III). The British Journal of Psychology, 14, 243-247.
Thurstone, L. L. (1936). The factorial isolation of primary abilities. Psychometrika, 1(3), 175-182.

Reasoning at Work
Working with Information Working with Things
Working with
Words
Working with
Numbers Working with
Details
Letter
Checking Code
Checking
Working with
Systems
Working with
Designs Working with
Equipment
Number
Checking
Finding
Errors
Classifying
Information
Reasoning Ability Hierarchy
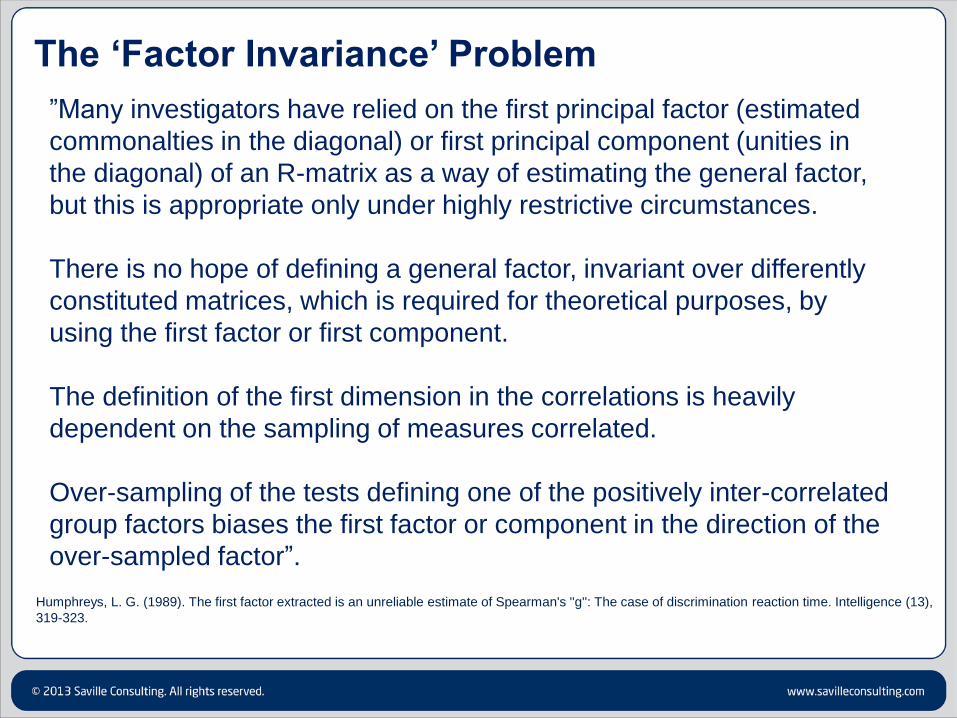
Humphreys, L. G. (1989). The first factor extracted is an unreliable estimate of Spearman's ''g'': The case of discrimination reaction time. Intelligence (13),
319-323.
The ‘Factor Invariance’ Problem
”Many investigators have relied on the first principal factor (estimated
commonalties in the diagonal) or first principal component (unities in
the diagonal) of an R-matrix as a way of estimating the general factor,
but this is appropriate only under highly restrictive circumstances.
There is no hope of defining a general factor, invariant over differently
constituted matrices, which is required for theoretical purposes, by
using the first factor or first component.
The definition of the first dimension in the correlations is heavily
dependent on the sampling of measures correlated.
Over-sampling of the tests defining one of the positively inter-correlated
group factors biases the first factor or component in the direction of the
over-sampled factor”.
A Big One?
A First Factor of Personality:
FUPC or
Unit Weighted?
A First Factor of Work Performance:
FUPC or
Unit Weighted?
The key validity question? How do these overall predictor
scores and the criterion scores relate to each other?
Criterion Centric Models
• To this end there is a need for a priori models of how scales relate to
performance (predictor-criterion alignment) – starting at the criterion end
• The Great Eight Competencies (Kurz & Bartram, 2002)
• The Saville Consulting BAG Framework
• BAG emphasises the need to tie in behavioural competencies with ability
models and – critically – overall work effectiveness
• Wave provides example of how we can look to align personality predictor
scales to criterion model – scale by scale
• The Great Eight provides basis for comparing across conventional
criteria covered by different personality questionnaires
Predictors
• Wave Professional Styles, Wave Focus Styles,
Hogan Personality Inventory, NEO-PI-R, 16PF.
• Other tools ruled out of this analysis that had too
few scales or were fully ipsative or both.

Criteria
36 Behavioural Dimensions on 7 point Likert scale of
effectiveness
Criteria and Predictors Aligned to One Model.
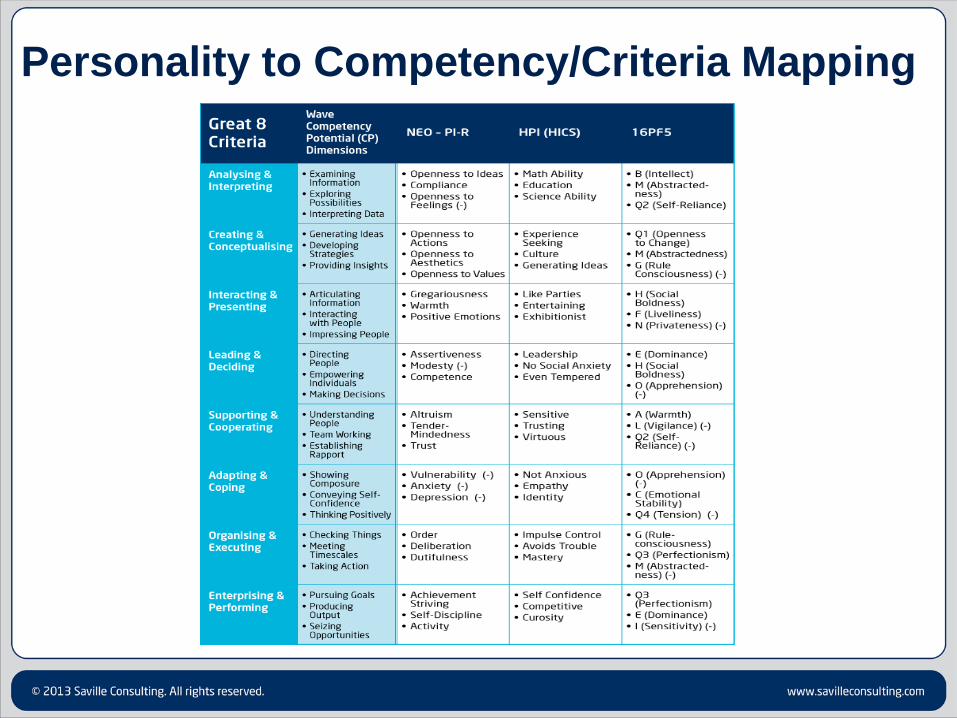
Personality to Competency/Criteria Mapping

Relating Criteria to Predictors…Creating A
Big One…
• Extract First Unrotated Principle Component
(FUPC) out of the Great 8 criteria & extract FUPC
out of all the personality scales in each predictor
questionnaire (Black Box – Loose Control of
Criterion-Predictor Alignment)
• Specifically align predictors to criteria and create
two sets of aligned scores. Unit weight (add) the
eight predictor forecast scores and unit weight the
criteria (Transparent – Tight Control of Criterion-
Predictor Alignment)
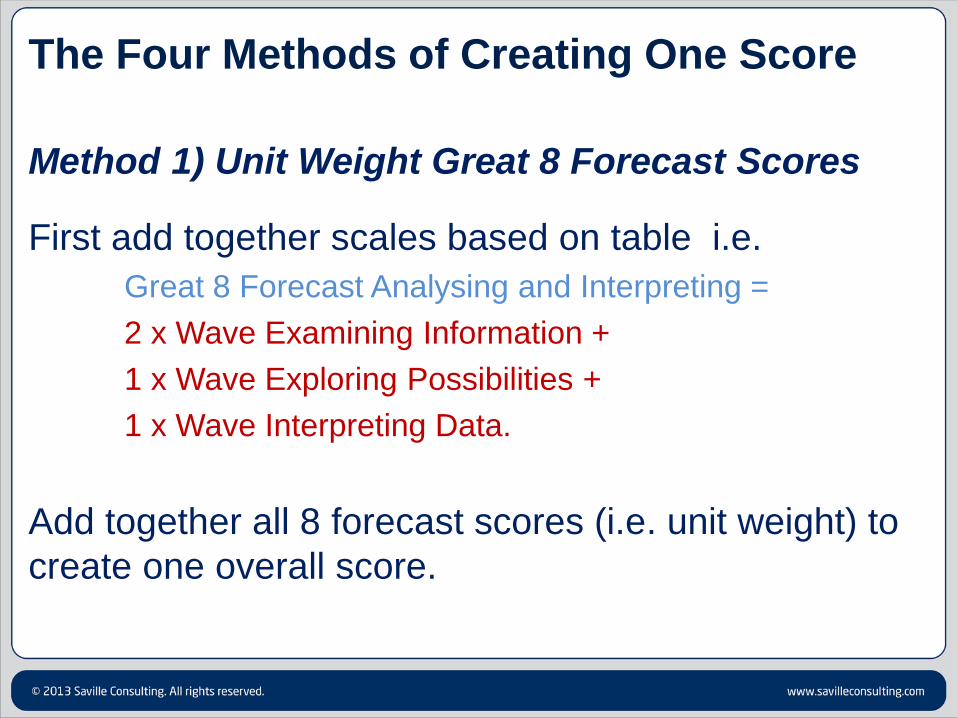
The Four Methods of Creating One Score
Method 1) Unit Weight Great 8 Forecast Scores
First add together scales based on table i.e.
Great 8 Forecast Analysing and Interpreting =
2 x Wave Examining Information +
1 x Wave Exploring Possibilities +
1 x Wave Interpreting Data.
Add together all 8 forecast scores (i.e. unit weight) to
create one overall score.

The Four Methods of Creating One Score
Method 2) FUPC Great 8 Forecasts
The First Unrotated Principle Component of the
Great Eight Forecast Scores (i.e. rather than unit
weight).
Method 3) FUPC of Great 8 Aligned Scales
FUPC of the 24 Scales* that were aligned
to/underpin the criteria of the Great 8 Competencies
*16 scales for 16PF. Some scales used twice as in more than one competency forecast.
*16 scales in the case of 16PF as some scales used in more than one
competency forecast

The Four Methods of Creating One Score
Method 4) FUPC of All Scales
FUPC with All Scales in Each Questionnaire
The Same Four Methods were used on the Criterion Side to
Create four Scores from Unit Weighting 8 Criteria (1) through
to FUPC of all 36 Criterion Scales (4).
The following slide shows the results when the same method is
used on both the predictor and criterion side.
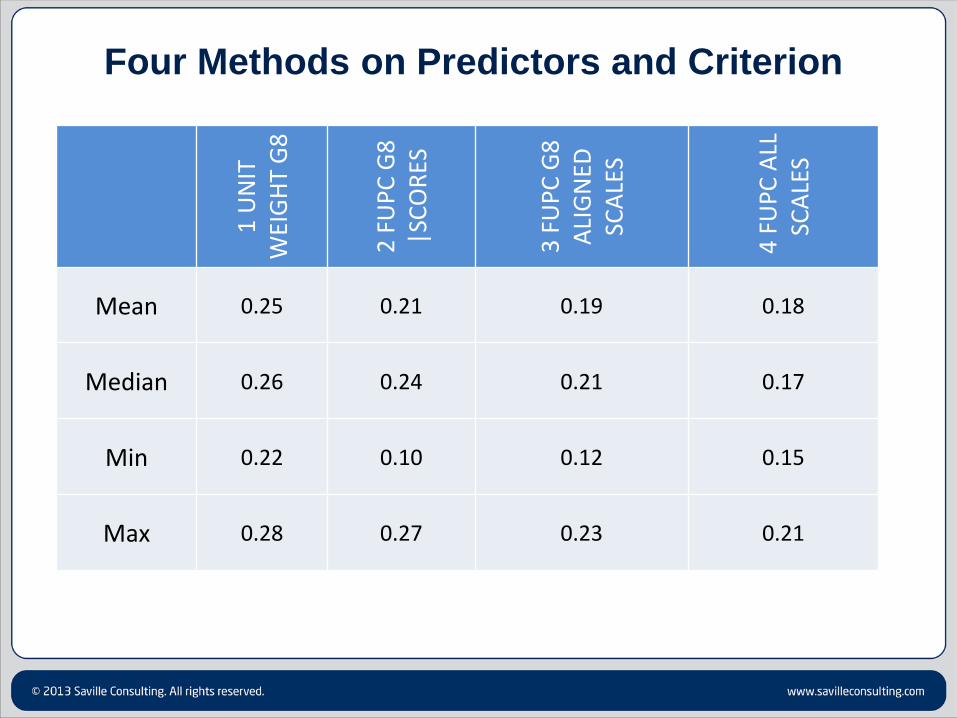
Four Methods on Predictors and Criterion
1 U
NIT
W
EIG
HT
G8
2 F
UP
C G
8
|SC
OR
ES
3 F
UP
C G
8
ALI
GN
ED
SCA
LES
4 F
UP
C A
LL
SCA
LES
Mean 0.25 0.21 0.19 0.18
Median 0.26 0.24 0.21 0.17
Min 0.22 0.10 0.12 0.15
Max 0.28 0.27 0.23 0.21

Beyond Competencies
• How do the forecasts method relate to overall
performance?
• Correlate with measure of overall effectiveness – a
more important measure of effectiveness?
Overall Scale of Global Work Effectiveness (3 items):
• Cronbach’s Alpha of .67 (N=308) in this study
• Correlates with 9 item full scale at .67 (N=347).
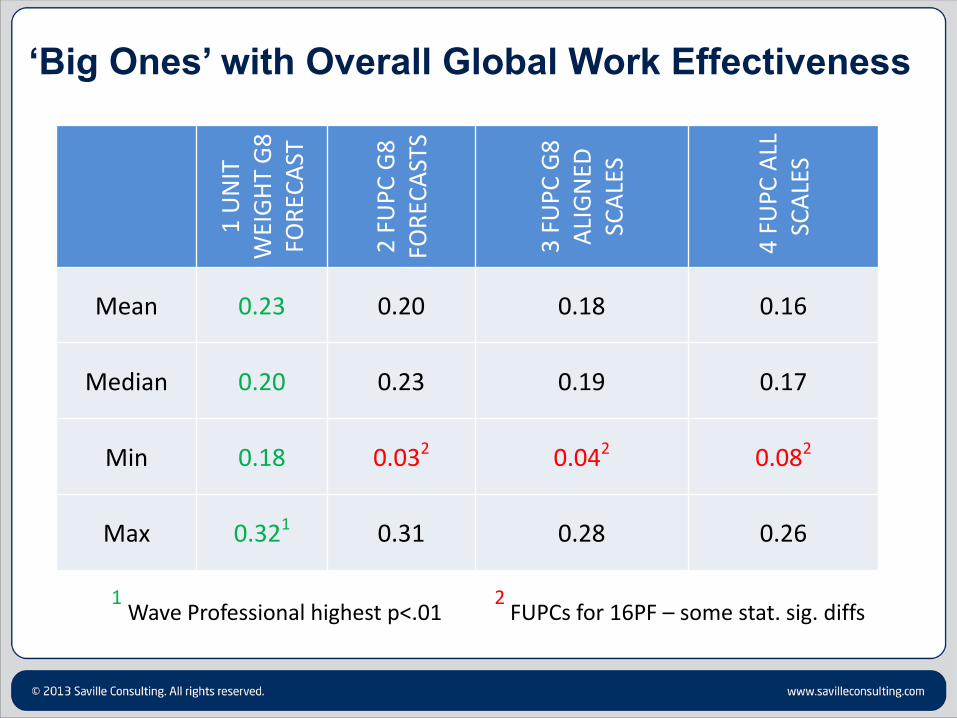
‘Big Ones’ with Overall Global Work Effectiveness
1 U
NIT
W
EIG
HT
G8
FO
REC
AST
2 F
UP
C G
8
FOR
ECA
STS
3 F
UP
C G
8
ALI
GN
ED
SCA
LES
4 F
UP
C A
LL
SCA
LES
Mean 0.23 0.20 0.18 0.16
Median 0.20 0.23 0.19 0.17
Min 0.18 0.032 0.042 0.082
Max 0.321 0.31 0.28 0.26
1 Wave Professional highest p<.01
2 FUPCs for 16PF – some stat. sig. diffs

Throw away the Big One?
Is the shared variance Social Desirability (SD) or Substance?
If SD - why is there validity?
1) SD variance may well be valid (we shouldn’t just
assume SD is a bias!)
2) The Dawes Rule – there is valid stuff in there.
Selection methods do have to result in overall decisions
– so while avoiding an FUPC – we still need to investigate
alternative methods to aggregate scores to make overall
decisions.
– and no

Conclusions
• The validity against an external rating of overall global work
effectiveness was relatively stable for the unit weighted
measures and ranged from .18 to .32 (.31 to .57 adjusted for
criterion unreliability).
• The FUPCs are less stable and unit weights provide a more
acceptable baseline of relating predictors to criteria (logic
applies to Big Five as well as Great Eight).
• Does weighting across the variables according to the
importance of the criteria form the basis of a flexible Great
One rather than an unstable Big One?

From the Great Eight to the Great One The Great One – Not the First One
Rab MacIver, Saville Consulting
Contact: [email protected]

One Score or More? Reflections on the
Controversy over a General Factor of Personality EAWOP Conference Muenster - 24th May 2013
Chair: Rab MacIver, Saville Consulting
1. Construct Convergence of Big 5 Personality and Great 8 Competency Variables
(Dr Rainer Kurz, Saville Consulting)
2. The relationship between General Mental Ability and the General Factor of Personality:
Findings from meta-analytic data
Prof. Matthias Ziegler (Humboldt University, Berlin)
Jonas Bertling (Educational Testing Service)
3. Is the ‘Big One’ too big to be useful?(Rob Bailey, OPP)
4. The Great One – Not the First One
(Rab MacIver, Saville Consulting)