Embed Size (px)
Citation preview
1
One-step assembly of Re(I) tricarbonyl 2-pyridyltetrazolato metallacalix[3]arene with aqua
emission and reversible three-electron oxidation
Phillip J. Wright, Sara Muzzioli, Brian W. Skelton, Paolo Raiteri, Jackson Lee, George
Koutsantonis, Debbie S. Silvester, Stefano Stagni* and Massimiliano Massi*
Supplementary Information
General Remarks
All reagents and solvents were purchased from Sigma Aldrich and used as received without further
purification. 2-(1H-tetrazol-5-yl)pyridine was synthesised according to previously published
procedures.1, 2
Acidic alumina for column chromatography was of Brockmann I activity. Nuclear
magnetic resonance spectra, consisting of 1H,
13C, HSQC, and HMBC were recorded using a
Bruker Avance 400 spectrometer (400.1 MHz for 1H, 100 MHz for
13C) at 300 K.
1H and
13C
chemical shifts were referenced to residual solvent signals. Infrared spectra were recorded in the
solid state, using an attenuated total reflectance Perkin-Elmer Spectrum 100 FT-IR, equipped with a
diamond stage. Compounds were scanned from 4000 to 650 cm-1
. The intensities of the IR bands
are reported as strong (s), medium (m), or weak (w). Melting points were determined Using a BI
Barnstead Electrothermal 9100 apparatus. Elemental analyses were obtained at the Central Science
Laboratory, University of Tasmania, using a Thermo Finnigan EA 1112 Series Flash.
Photophysical Measurements
Absorption spectra were recorded at room temperature using a Perkin Elmer Lambda 35 UV/Vis
spectrometer. Uncorrected steady state emission and excitation spectra were recorded on an
Edinburgh FLSP920 spectrometer equipped with a 450 W Xenon arc lamp, double excitation and
single emission monochromators and a peltier cooled Hamamatsu R928P photomultiplier tube
(185-850 nm). Emission and excitation spectra were corrected for source intensity (lamp and
grating) and emission spectral response (detector and grating) by a calibration curve supplied with
the instrument. According to the approach described by Demas and Crosby,3 luminescence quantum
yields (Φem) were measured in optically dilute solutions (O.D. < 0.1 at excitation wavelength)
obtained from absorption spectra on a wavelength scale [nm] and compared to the reference emitter
by the following equation:
Electronic Supplementary Material (ESI) for Dalton TransactionsThis journal is © The Royal Society of Chemistry 2013
2
Fx = Fr
Ar lr( )Ax lx( )
é
ë ê
ù
û ú Ir lr( )Ix lx( )
é
ë ê
ù
û ú nx
2
nr2
é
ë ê
ù
û ú Dx
Dr
é
ë ê
ù
û ú
where A is the absorbance at the excitation wavelength (), I is the intensity of the excitation light at
the excitation wavelength (), n is the refractive index of the solvent, D is the integrated intensity of
the luminescence and Φ is the quantum yield. The subscripts r and x refer to the reference and the
sample, respectively. The quantum yield determinations were performed at identical excitation
wavelength for the sample and the reference, therefore cancelling the I(r)/I(x) term in the
equation. All the Re complexes were measured against an air-equilibrated water solution of
Ru(bpy)3Cl2 used as reference (Φr = 0.028).4 Emission lifetimes () were determined with the single
photon counting technique (TCSPC) with the same Edinburgh FLSP920 spectrometer using pulsed
picosecond LEDs (EPLED 295 or EPLED 360, FHWM < 800 ps) as the excitation source, with
repetition rates between 10 kHz and 1 MHz, and the above-mentioned R928P PMT as detector. The
goodness of fit was assessed by minimising the reduced 2
function and by visual inspection of the
weighted residuals. To record the 77 K luminescence spectra, the samples were put in glass tubes (2
mm diameter) and inserted in a special quartz dewar filled up with liquid nitrogen. The solvent
(dichloromethane) used for the preparation of the solutions for the photophysical investigations was
of spectrometric grade. The prepared solution was filtered through a 0.2 m syringe filter before
measurement. Deaerated samples were prepared by the freeze-pump-thaw technique. Experimental
uncertainties are estimated to be ±8% for lifetime determinations, ±20% for quantum yields, ±2 nm
and ±5 nm for absorption and emission peaks, respectively.
X-ray Diffraction
Crystallographic data for the structure of 1 were collected at 100(2) K on an Oxford Diffraction
Gemini diffractometer fitted with Cu Kα radiation. Following analytical absorption corrections and
solution by direct methods, the structure was refined against F2 with full-matrix least-squares using
the program SHELXL-97.5 The data were collected at 180 K since the crystal appeared to
deteriorate at lower temperatures. The solvent was modelled as two molecules of dichloromethane,
one of which was found to be disordered over two sets of sites with occupancies constrained to 0.5
after trial refinement. Geometries of the disordered atoms were restrained to ideal values.
Anisotropic displacement parameters were employed for the non-hydrogen atoms. All hydrogen
atoms were added at calculated positions and refined by use of a riding model with isotropic
displacement parameters based on those of the parent atom.
Electronic Supplementary Material (ESI) for Dalton TransactionsThis journal is © The Royal Society of Chemistry 2013

3
Cyclic Voltammetry in Ionic liquid
A gold microelectrode (made in house and kindly donated by the group of Professor Richard
Compton at Oxford University, UK) was polished and modified with a section of disposable
micropipette tip into which microlitre quantities of the ionic liquid solvent can be placed. The
electrode was then inserted into a “T-cell” apparatus as described elsewhere.6 A silver wire (0.5 mm
diameter) was inserted from the top and acted as a combined counter and reference electrode. The
T-cell was placed inside an aluminium Faraday cage and connected to a vacuum pump (Edwards
ES50). The samples for electrochemistry were prepared by dissolving the required amount of
rhenium complex in a minimal amount of dichloromethane and then adding this solution to the
ionic liquid (1-hexyl-3-methylimidazolium tris(pentafluoroethyl)trifluorophosphate) in order to
obtain a final concentration of the order of 10 mM. The solution was left in an open container to
allow the dichloromethane to evaporate. 40 µL of this sample were transferred into the T-cell with
the use of a micropipette. Experiments requiring the use of ferrocene followed the above procedure,
however 10 µL of a 10 mM solution of ferrocene in acetonitrile was added into the T-cell apparatus
along with the ionic liquid containing the rhenium complex. Cyclic voltammetry experiments were
performed using a PGSTAT302N potentiostat (Eco-Chemie, Netherlands) interfaced to a PC with
GPES (General Purpose Electrochemical System) software. The step potential was fixed at 0.01 V.
The potentials are referenced to an internal reference Ferrocene/Ferrocenium redox couple
according to IUPAC recommendations,7 and established in ionic liquids.
8, 9 Scans were performed
using a potential window within the range of -1.7 – 2.5 V reliant on the compound investigated.
Reported potentials were obtained from a scan rate of 100 mVs-1
.
Computational Calculations.
Time-dependent density functional theory calculations were performed with GAUSSIAN 0910
in
order to calculate the absorption spectra for the title compound. Prior to these calculations, the
structures were relaxed at the B3LYP level of theory. The Re atoms were treated with the Stuttgart-
Dresden (SDD) effective core potential,11
the Pople 6-311G** basis set was used for C, H, and N
atoms and the effect of the solvent was mimicked with the PCM solvation model.12
The low-lying
singlet-singlet excitation energies were calculated at the same level of theory, and the spectra were
reproduced as the superposition of Gaussian functions with heights proportional to calculated
intensities and a variance of 11nm. Because of the large number of atoms, the computational cost of
the TDDFT calculations for 1 became excessive and therefore we limited the calculations to lower-
energy transitions up to 295 nm.
Electronic Supplementary Material (ESI) for Dalton TransactionsThis journal is © The Royal Society of Chemistry 2013
4
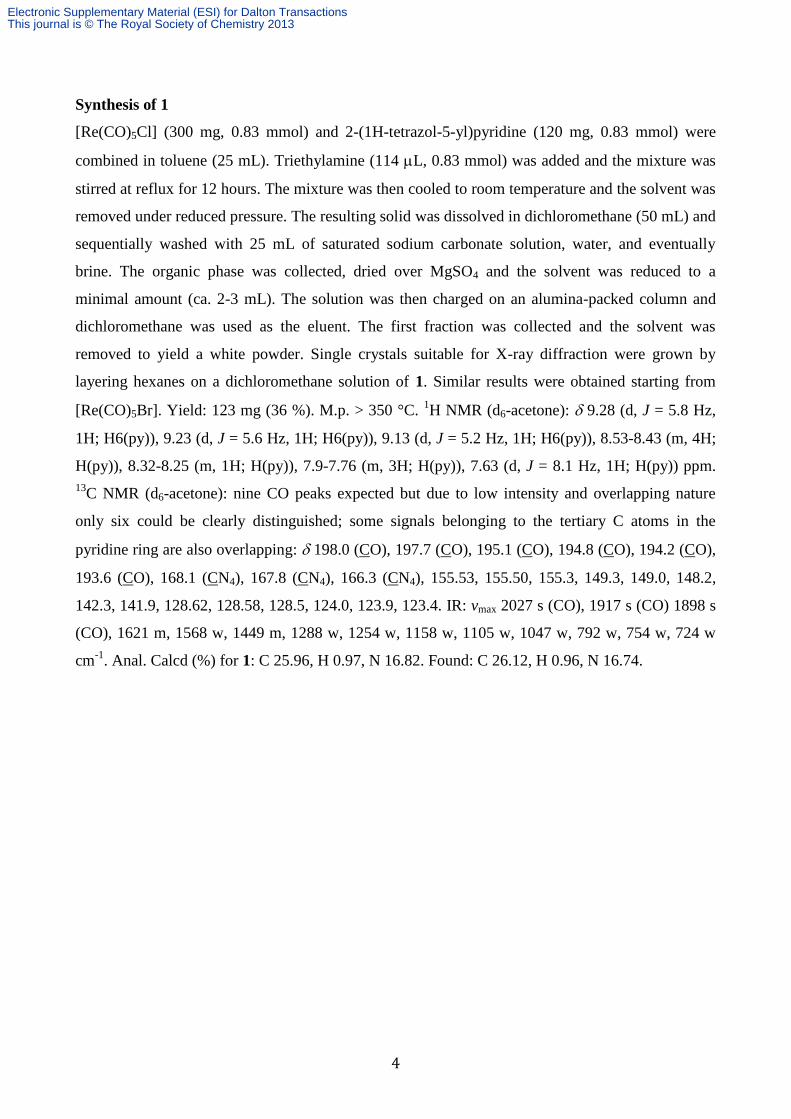
Synthesis of 1
[Re(CO)5Cl] (300 mg, 0.83 mmol) and 2-(1H-tetrazol-5-yl)pyridine (120 mg, 0.83 mmol) were
combined in toluene (25 mL). Triethylamine (114 L, 0.83 mmol) was added and the mixture was
stirred at reflux for 12 hours. The mixture was then cooled to room temperature and the solvent was
removed under reduced pressure. The resulting solid was dissolved in dichloromethane (50 mL) and
sequentially washed with 25 mL of saturated sodium carbonate solution, water, and eventually
brine. The organic phase was collected, dried over MgSO4 and the solvent was reduced to a
minimal amount (ca. 2-3 mL). The solution was then charged on an alumina-packed column and
dichloromethane was used as the eluent. The first fraction was collected and the solvent was
removed to yield a white powder. Single crystals suitable for X-ray diffraction were grown by
layering hexanes on a dichloromethane solution of 1. Similar results were obtained starting from
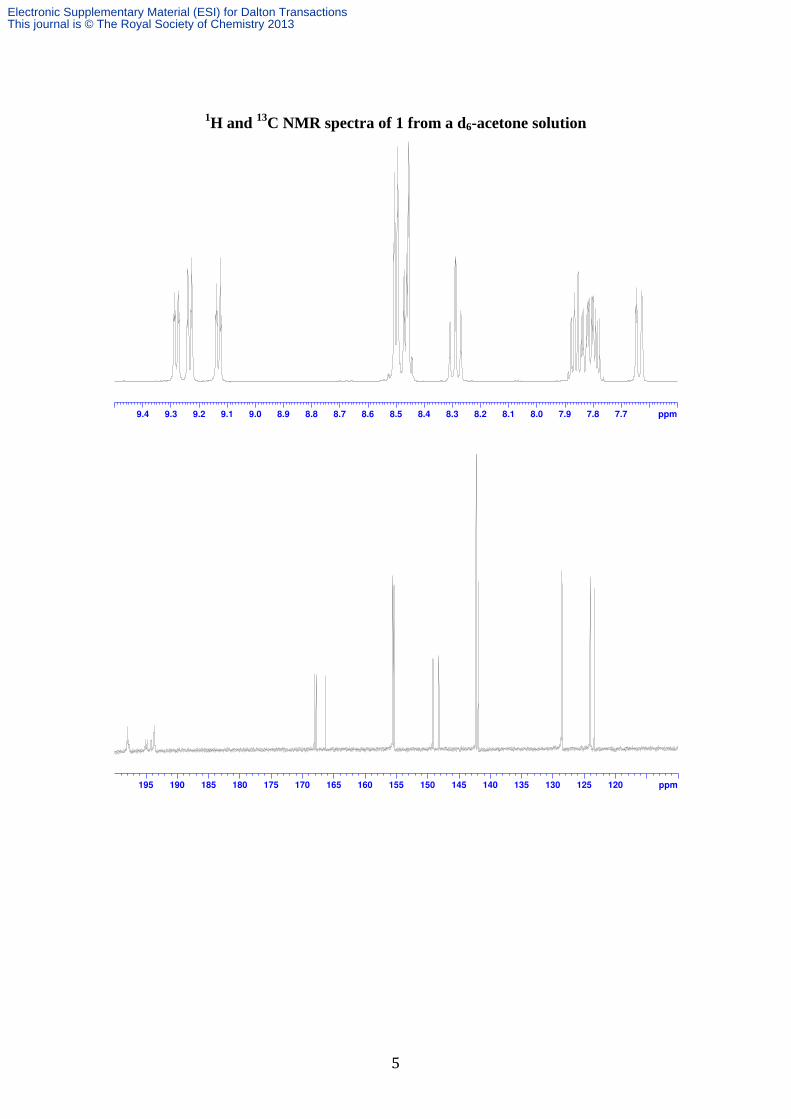
[Re(CO)5Br]. Yield: 123 mg (36 %). M.p. > 350 °C. 1H NMR (d6-acetone): 9.28 (d, J = 5.8 Hz,
1H; H6(py)), 9.23 (d, J = 5.6 Hz, 1H; H6(py)), 9.13 (d, J = 5.2 Hz, 1H; H6(py)), 8.53-8.43 (m, 4H;
H(py)), 8.32-8.25 (m, 1H; H(py)), 7.9-7.76 (m, 3H; H(py)), 7.63 (d, J = 8.1 Hz, 1H; H(py)) ppm.
13C NMR (d6-acetone): nine CO peaks expected but due to low intensity and overlapping nature
only six could be clearly distinguished; some signals belonging to the tertiary C atoms in the
pyridine ring are also overlapping: 198.0 (CO), 197.7 (CO), 195.1 (CO), 194.8 (CO), 194.2 (CO),
193.6 (CO), 168.1 (CN4), 167.8 (CN4), 166.3 (CN4), 155.53, 155.50, 155.3, 149.3, 149.0, 148.2,
142.3, 141.9, 128.62, 128.58, 128.5, 124.0, 123.9, 123.4. IR: vmax 2027 s (CO), 1917 s (CO) 1898 s
(CO), 1621 m, 1568 w, 1449 m, 1288 w, 1254 w, 1158 w, 1105 w, 1047 w, 792 w, 754 w, 724 w
cm-1
. Anal. Calcd (%) for 1: C 25.96, H 0.97, N 16.82. Found: C 26.12, H 0.96, N 16.74.
Electronic Supplementary Material (ESI) for Dalton TransactionsThis journal is © The Royal Society of Chemistry 2013
5
1H and
13C NMR spectra of 1 from a d6-acetone solution
Electronic Supplementary Material (ESI) for Dalton TransactionsThis journal is © The Royal Society of Chemistry 2013
6
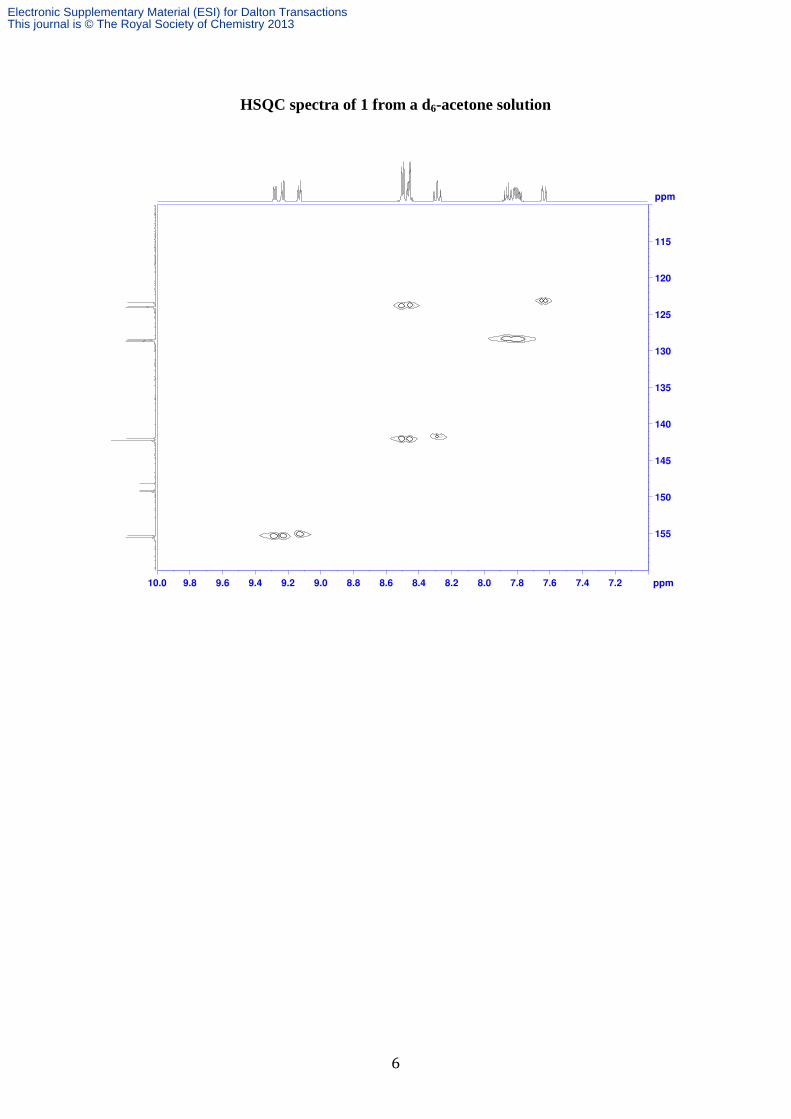
HSQC spectra of 1 from a d6-acetone solution
Electronic Supplementary Material (ESI) for Dalton TransactionsThis journal is © The Royal Society of Chemistry 2013

7
HMBC spectra of 1 from a d6-acetone solution
Electronic Supplementary Material (ESI) for Dalton TransactionsThis journal is © The Royal Society of Chemistry 2013

8
X-ray structural characterisation
The metallacalix[3]arene 1 crystallises in the monoclinic space group P21/n. Each 2PyTz links two
adjacent rhenium centres with a μ2-η2:η
1 binding mode, involving the pyridine N atom and the
tetrazole N1 atom for one rhenium centre and the tetrazole N3 atom to bridge the adjacent rhenium.
The three 2PyTz are arranged in a slightly concave equilateral triangle, with sides averaging 6.3 Å.
The triangular disposition of the metallacalix[3]arene leaves a cavity of about 4 Å, estimated by the
diameter of the circle inscribed within the triangle (Figure S1). However, the likelihood of
molecular inclusion in the cavity is slim as evidenced by the visualised void spaces using
CrystalExplorer (Figure S2).13
Individual triangular units of 1 do not seem to be involved in
hydrogen bonding or π-stacking throughout the lattice. Three molecules of dichloromethane are also
present in the lattice. The high R-factor could be attributed to poor crystal quality and problems
modelling the solvent molecules.
Figure S1. Calculated dimensions of the triangular cavity formed by the metallaclix[3]arene
complex.
Figure S2. Representation of the void space (grey area) within the cavity of 1.
Electronic Supplementary Material (ESI) for Dalton TransactionsThis journal is © The Royal Society of Chemistry 2013

9
Selected bond lengths [Å] and angles [°] for 1
_____________________________________________________
Re(1)-C(12) 1.887(13)
Re(1)-C(11) 1.915(13)
Re(1)-C(13) 1.959(13)
Re(1)-N(34) 2.145(10)
Re(1)-N(12) 2.181(10)
Re(1)-N(352) 2.199(11)
Re(2)-C(21) 1.905(13)
Re(2)-C(22) 1.908(16)
Re(2)-C(23) 1.929(15)
Re(2)-N(14) 2.171(10)
Re(2)-N(22) 2.176(11)
Re(2)-N(152) 2.213(12)
Re(3)-C(33) 1.890(18)
Re(3)-C(31) 1.924(15)
Re(3)-C(32) 1.930(14)
Re(3)-N(24) 2.145(12)
Re(3)-N(252) 2.190(12)
Re(3)-N(32) 2.195(10)
C(12)-Re(1)-C(11) 90.0(5)
C(12)-Re(1)-C(13) 90.7(5)
C(11)-Re(1)-C(13) 89.2(6)
C(12)-Re(1)-N(34) 95.6(4)
C(11)-Re(1)-N(34) 96.6(5)
C(13)-Re(1)-N(34) 171.4(5)
C(12)-Re(1)-N(12) 177.3(4)
C(11)-Re(1)-N(12) 89.4(5)
C(13)-Re(1)-N(12) 92.0(5)
N(34)-Re(1)-N(12) 81.8(4)
C(12)-Re(1)-N(352) 92.4(5)
C(11)-Re(1)-N(352) 170.5(5)
C(13)-Re(1)-N(352) 100.0(5)
N(34)-Re(1)-N(352) 74.0(4)
N(12)-Re(1)-N(352) 87.6(4)
C(21)-Re(2)-C(22) 87.3(6)
C(21)-Re(2)-C(23) 89.3(6)
C(22)-Re(2)-C(23) 90.9(5)
Electronic Supplementary Material (ESI) for Dalton TransactionsThis journal is © The Royal Society of Chemistry 2013

10
C(21)-Re(2)-N(14) 100.5(5)
C(22)-Re(2)-N(14) 95.4(5)
C(23)-Re(2)-N(14) 168.6(5)
C(21)-Re(2)-N(22) 92.0(5)
C(22)-Re(2)-N(22) 173.1(5)
C(23)-Re(2)-N(22) 95.9(5)
N(14)-Re(2)-N(22) 78.0(4)
C(21)-Re(2)-N(152) 174.3(5)
C(22)-Re(2)-N(152) 94.8(5)
C(23)-Re(2)-N(152) 95.9(5)
N(14)-Re(2)-N(152) 74.1(4)
N(22)-Re(2)-N(152) 85.3(4)
C(33)-Re(3)-C(31) 89.1(7)
C(33)-Re(3)-C(32) 90.6(7)
C(31)-Re(3)-C(32) 86.9(5)
C(33)-Re(3)-N(24) 169.4(6)
C(31)-Re(3)-N(24) 100.2(5)
C(32)-Re(3)-N(24) 95.0(5)
C(33)-Re(3)-N(252) 96.1(6)
C(31)-Re(3)-N(252) 174.5(5)
C(32)-Re(3)-N(252) 95.0(5)
N(24)-Re(3)-N(252) 74.5(4)
C(33)-Re(3)-N(32) 95.9(6)
C(31)-Re(3)-N(32) 92.4(5)
C(32)-Re(3)-N(32) 173.5(5)
N(24)-Re(3)-N(32) 78.8(4)
N(252)-Re(3)-N(32) 85.1(4)
Electronic Supplementary Material (ESI) for Dalton TransactionsThis journal is © The Royal Society of Chemistry 2013

11
Photophysical studies
Excitation and emission spectra of a 10-5
M solution of 1 at room temperature
The broad and structureless profile of the emission spectrum indicates the almost exclusive charge transfer (CT) nature of the emissive state and negligible mixing with excited states of LC nature, despite the marked blue-shifted emission maximum on comparing 1 with neutral rhenium tricarbonyl complexes. This is likely to be due to the fact that the LC transition is raised in energy as a consequence of the coordination of the tetrazole ring to two metal centres, a behavior we have previously observed in complexes of Pt(II) bound to the same 2PyTz ligand.14
Electronic Supplementary Material (ESI) for Dalton TransactionsThis journal is © The Royal Society of Chemistry 2013
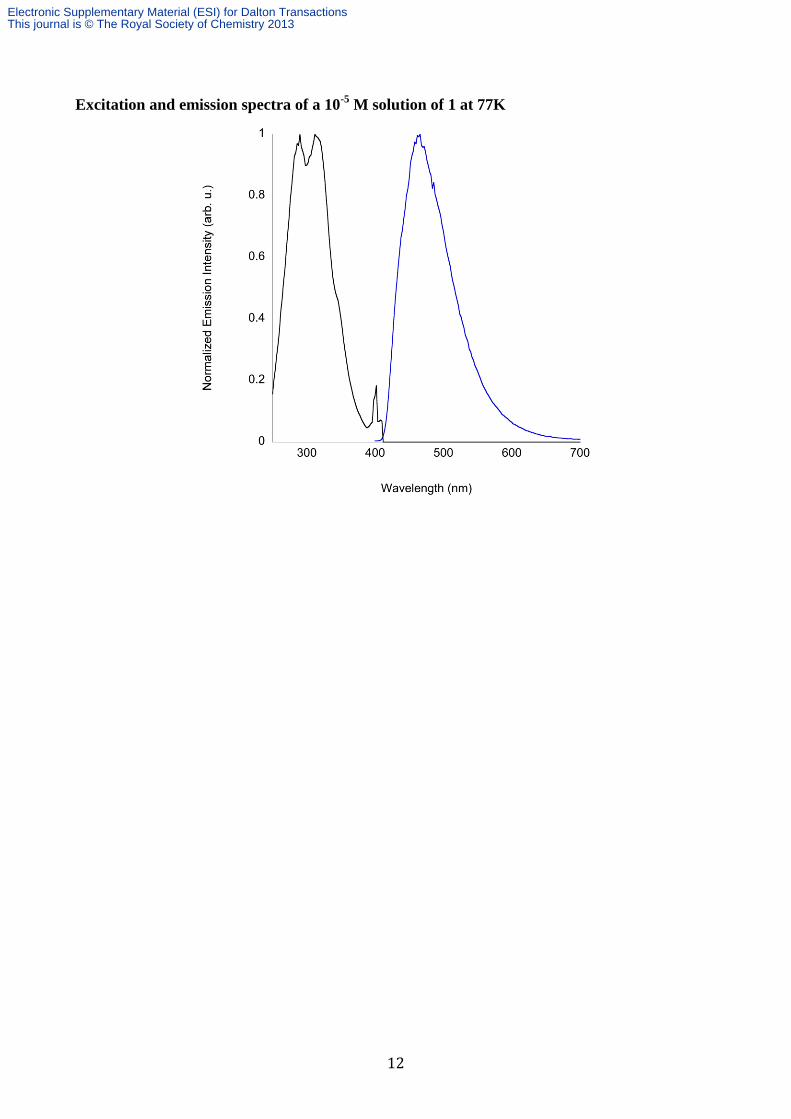
12
Excitation and emission spectra of a 10-5
M solution of 1 at 77K
Electronic Supplementary Material (ESI) for Dalton TransactionsThis journal is © The Royal Society of Chemistry 2013

13
Simulated TDDFT absorption spectrum
0
0.1
0.2
0.3
0.4
0.5
0.6
0.7
300 320 340 360 380 400 420 440
Ab
sorp
tio
n
Wavelength (nm)
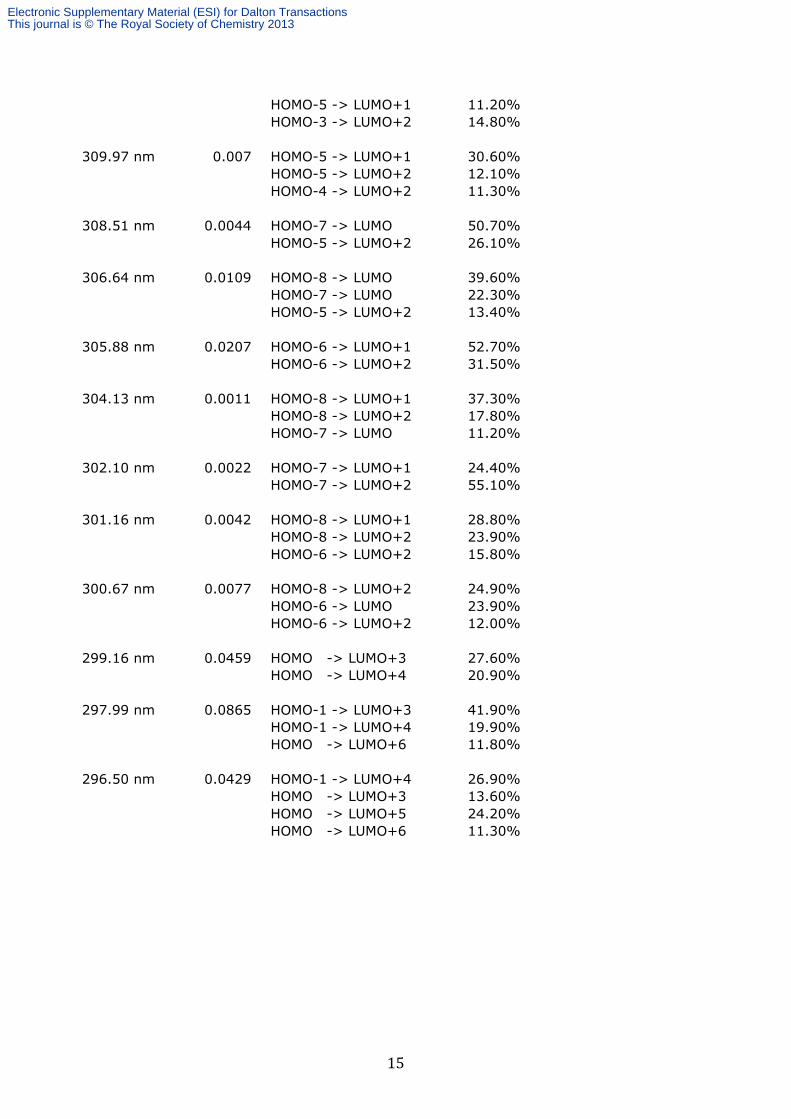
List of calculated transitions
Wavelength Intensity Levels Character
368.09 nm 0.0074 HOMO-1 -> LUMO 42.70%
HOMO -> LUMO 26.00%
HOMO -> LUMO+1 14.40%
365.58 nm 0.0024 HOMO-1 -> LUMO+1 24.30%
HOMO -> LUMO 11.40%
HOMO -> LUMO+1 21.00%
HOMO -> LUMO+2 23.80%
365.18 nm 0.0006 HOMO-1 -> LUMO 16.70%
HOMO-1 -> LUMO+2 29.60%
HOMO -> LUMO+1 27.60%
345.25 nm 0.0234 HOMO-2 -> LUMO 21.40%
HOMO -> LUMO 26.10%
HOMO -> LUMO+2 11.30%
342.28 nm 0.0388 HOMO-4 -> LUMO 25.10%
HOMO-2 -> LUMO 10.40%
Electronic Supplementary Material (ESI) for Dalton TransactionsThis journal is © The Royal Society of Chemistry 2013

14
341.35 nm 0.1566 HOMO-1 -> LUMO+1 19.60%
HOMO -> LUMO 25.90%
339.53 nm 0.0265 HOMO-4 -> LUMO+1 10.30%
HOMO-3 -> LUMO+1 10.60%
HOMO-1 -> LUMO+1 18.80%
HOMO-1 -> LUMO+2 14.90%
HOMO -> LUMO+2 12.80%
339.14 nm 0.0241 HOMO-1 -> LUMO 15.40%
HOMO-1 -> LUMO+2 14.90%
HOMO -> LUMO+1 15.50%
HOMO -> LUMO+2 18.40%
337.19 nm 0.0055 HOMO-7 -> LUMO+1 12.90%
HOMO-5 -> LUMO+1 11.70%
HOMO-1 -> LUMO+1 21.00%
HOMO-1 -> LUMO+2 14.20%
335.84 nm 0.0808 HOMO-6 -> LUMO 35.60%
HOMO-6 -> LUMO+2 13.20%
332.40 nm 0.0456 HOMO-8 -> LUMO 14.70%
HOMO-3 -> LUMO 14.30%
328.92 nm 0.0929 HOMO-7 -> LUMO+1 32.30%
HOMO-7 -> LUMO+2 15.80%
HOMO-3 -> LUMO+1 14.30%
320.46 nm 0.0343 HOMO-4 -> LUMO 15.40%
HOMO-3 -> LUMO 50.40%
318.75 nm 0.0012 HOMO-4 -> LUMO 26.00%
HOMO-3 -> LUMO+2 15.40%
HOMO-2 -> LUMO+1 34.80%
318.23 nm 0.0029 HOMO-3 -> LUMO+1 13.20%
HOMO-2 -> LUMO+1 29.20%
HOMO-2 -> LUMO+2 36.20%
314.47 nm 0.0158 HOMO-4 -> LUMO+1 35.40%
HOMO-4 -> LUMO+2 18.10%
HOMO-3 -> LUMO+2 20.30%
313.76 nm 0.0108 HOMO-5 -> LUMO 12.40%
HOMO-2 -> LUMO 24.20%
HOMO-2 -> LUMO+2 26.80%
313.52 nm 0.0056 HOMO-4 -> LUMO+2 36.70%
HOMO-3 -> LUMO+1 23.60%
HOMO-3 -> LUMO+2 13.20%
311.24 nm 0.0153 HOMO-5 -> LUMO 32.90%
Electronic Supplementary Material (ESI) for Dalton TransactionsThis journal is © The Royal Society of Chemistry 2013
15
HOMO-5 -> LUMO+1 11.20%
HOMO-3 -> LUMO+2 14.80%
309.97 nm 0.007 HOMO-5 -> LUMO+1 30.60%
HOMO-5 -> LUMO+2 12.10%
HOMO-4 -> LUMO+2 11.30%
308.51 nm 0.0044 HOMO-7 -> LUMO 50.70%
HOMO-5 -> LUMO+2 26.10%
306.64 nm 0.0109 HOMO-8 -> LUMO 39.60%
HOMO-7 -> LUMO 22.30%
HOMO-5 -> LUMO+2 13.40%
305.88 nm 0.0207 HOMO-6 -> LUMO+1 52.70%
HOMO-6 -> LUMO+2 31.50%
304.13 nm 0.0011 HOMO-8 -> LUMO+1 37.30%
HOMO-8 -> LUMO+2 17.80%
HOMO-7 -> LUMO 11.20%
302.10 nm 0.0022 HOMO-7 -> LUMO+1 24.40%
HOMO-7 -> LUMO+2 55.10%
301.16 nm 0.0042 HOMO-8 -> LUMO+1 28.80%
HOMO-8 -> LUMO+2 23.90%
HOMO-6 -> LUMO+2 15.80%
300.67 nm 0.0077 HOMO-8 -> LUMO+2 24.90%
HOMO-6 -> LUMO 23.90%
HOMO-6 -> LUMO+2 12.00%
299.16 nm 0.0459 HOMO -> LUMO+3 27.60%
HOMO -> LUMO+4 20.90%
297.99 nm 0.0865 HOMO-1 -> LUMO+3 41.90%
HOMO-1 -> LUMO+4 19.90%
HOMO -> LUMO+6 11.80%
296.50 nm 0.0429 HOMO-1 -> LUMO+4 26.90%
HOMO -> LUMO+3 13.60%
HOMO -> LUMO+5 24.20%
HOMO -> LUMO+6 11.30%
Electronic Supplementary Material (ESI) for Dalton TransactionsThis journal is © The Royal Society of Chemistry 2013

16
Selected occupied orbitals for 1
HOMO
HOMO-1
HOMO-2
Electronic Supplementary Material (ESI) for Dalton TransactionsThis journal is © The Royal Society of Chemistry 2013

17
HOMO-3
HOMO-4
HOMO-5
Electronic Supplementary Material (ESI) for Dalton TransactionsThis journal is © The Royal Society of Chemistry 2013

18
HOMO-6
HOMO-7
HOMO-8
Electronic Supplementary Material (ESI) for Dalton TransactionsThis journal is © The Royal Society of Chemistry 2013
19
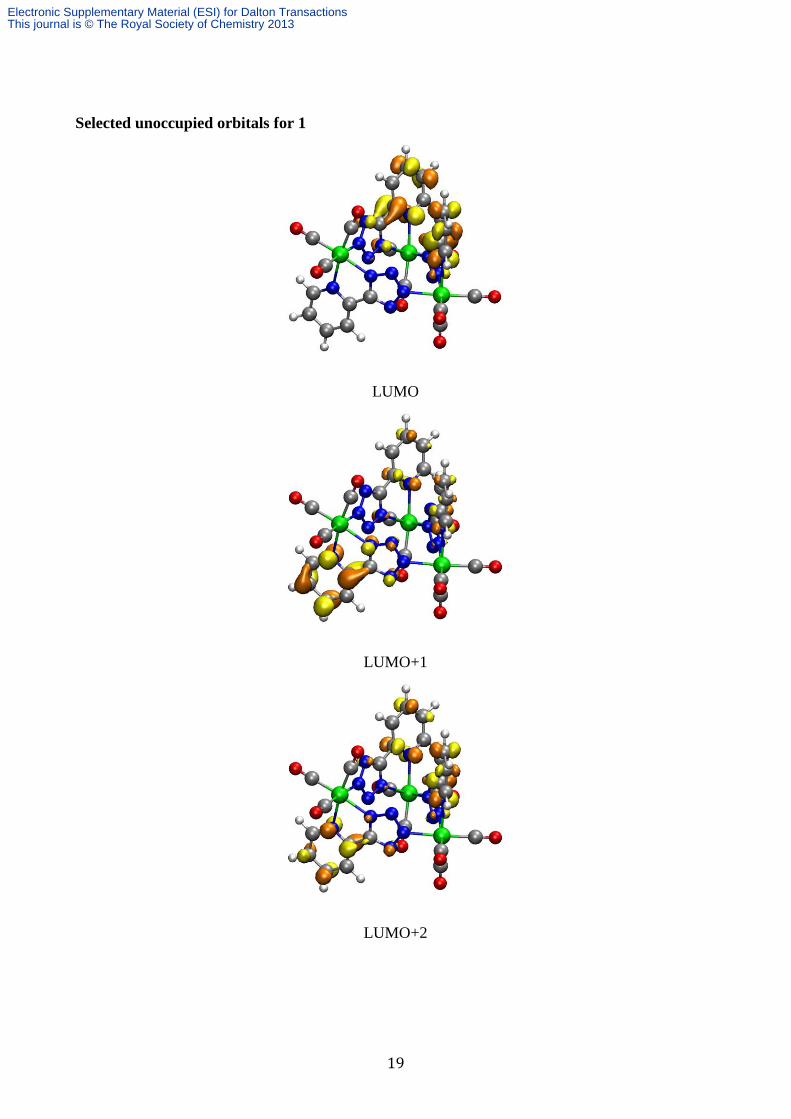
Selected unoccupied orbitals for 1
LUMO
LUMO+1
LUMO+2
Electronic Supplementary Material (ESI) for Dalton TransactionsThis journal is © The Royal Society of Chemistry 2013
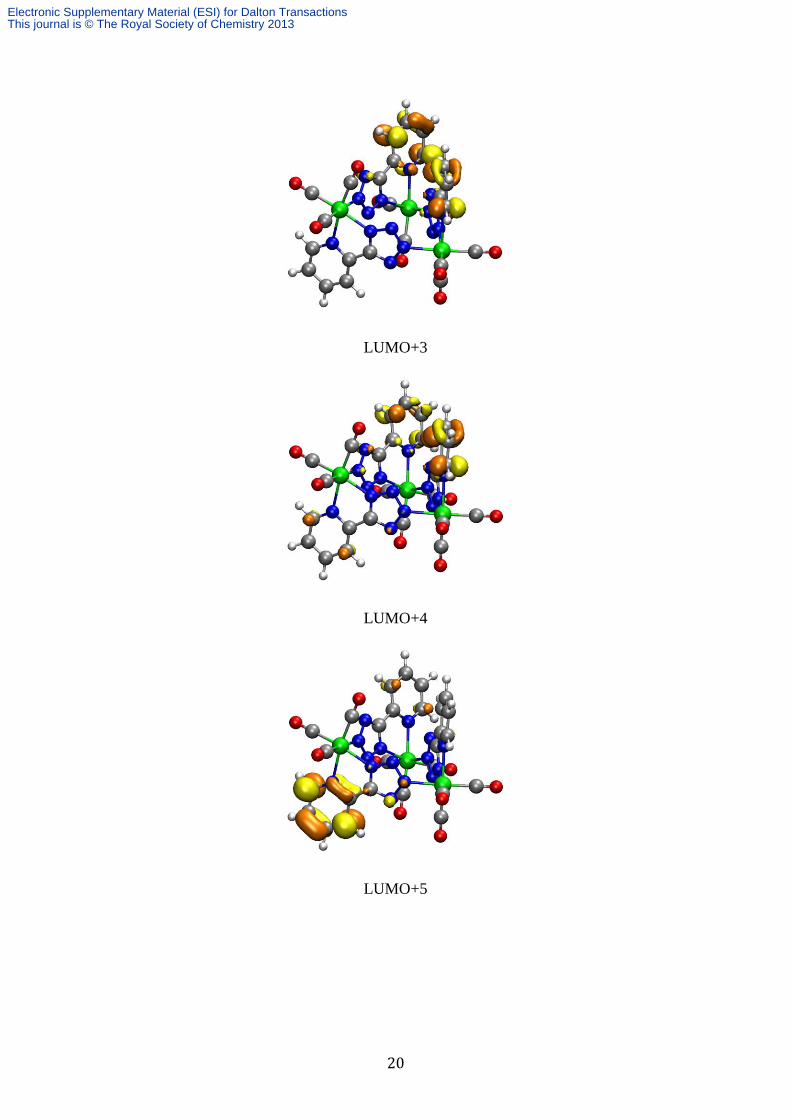
20
LUMO+3
LUMO+4
LUMO+5
Electronic Supplementary Material (ESI) for Dalton TransactionsThis journal is © The Royal Society of Chemistry 2013

21
LUMO+6
Electronic Supplementary Material (ESI) for Dalton TransactionsThis journal is © The Royal Society of Chemistry 2013

22
References
1. Z. P. Demko and K. B. Sharpless, Journal of Organic Chemistry, 2001, 66, 7945-7950.
2. K. Koguro, T. Oga, S. Mitsui and R. Orita, Synthesis, 1998, 910-914.
3. J. N. Demas and G. A. Crosby, Journal of Physical Chemistry, 1971, 75, 991-1024.
4. D. F. Eaton, Pure and Applied Chemistry, 1988, 60, 1107-1114.
5. G. M. Sheldrick, Acta Cryst. , 2008, A64, 112-122.
6. D. S. Silvester, A. J. Wain, L. Aldous, C. Hardacre and R. G. Compton, Journal of
Electroanalytical Chemistry, 2006, 596, 131-140.
7. G. Gritzner and J. Kuta, Pure and Applied Chemistry, 1984, 56, 461-466.
8. L. E. Barrosse-Antle, A. M. Bond, R. G. Compton, A. M. O'Mahony, E. I. Rogers and D. S.
Silvester, Chemistry An Asian Journal, 2010, 5, 202-230.
9. E. I. Rogers, D. S. Silvester, D. L. Poole, L. Aldous, C. Hardacre and R. G. Compton,
Journal of Physical Chemistry C, 2008, 112, 2729-2735.
10. M. J. Frisch et al., Gaussian 09, Revision C.01, (2010) Gaussian Inc., Wallingford CT.
11. D. Andrae, U. Haubermann, M. Dolg, H. Stoll and H. Preub, Theoretica Chimica Acta,
1990, 77, 123-141.
12. J. Tomasi, B. Mennucci and R. Cammi, Chemical Reviews, 2005, 105, 2999-3093.
13. M. J. Turner, J. J. McKinnon, D. Jayatilaka and M. A. Spackman, Crystengcomm, 2011, 13,
1804-1813.
14. K. D. M. MaGee, P. J. Wright, S. Muzzioli, C. M. Siedlovskas, P. Raiteri, M. V. Baker, D.
H. Brown, S. Stagni and M. Massi, Dalton Trans., 2013, 42, 4233.
Electronic Supplementary Material (ESI) for Dalton TransactionsThis journal is © The Royal Society of Chemistry 2013