Embed Size (px)
Citation preview

Mon. Not. R. Astron. Soc. 000, 1–23 (2014) Printed 9 July 2014 (MN LATEX style file v2.2)
One thousand cataclysmic variables from the CatalinaReal-time Transient Survey
E. Breedt1?, B. T. Gansicke1, A. J. Drake2, P. Rodrıguez-Gil3,4, S. G. Parsons5,
T. R. Marsh1, P. Szkody6, M. R. Schreiber5, S. G. Djorgovski21 Department of Physics, University of Warwick, Coventry, UK2 California Institute of Technology, 1200 E. California Blvd, CA 91225, USA3 Instituto de Astrofısica de Canarias, Vıa Lactea s/n, La Laguna, E-38205, Santa Cruz de Tenerife, Spain4 Departamento de Astrofısica, Universidad de La Laguna, La Laguna, E-38206, Santa Cruz de Tenerife, Spain5 Instituto de Fısica y Astronomıa, Universidad de Valparaıso, Avenida Gran Bretana 1111, Valparaıso, Chile6 Department of Astronomy, University of Washington, Box 351580, Seattle, WA 98195-1580, USA
Accepted/Received
ABSTRACTOver six years of operation, the Catalina Real-time Transient Survey (CRTS) hasidentified 1043 cataclysmic variable (CV) candidates — the largest sample of CVsfrom a single survey to date. Here we provide spectroscopic identification of 85 systemsfainter than g > 19, including three AM CVn binaries, one helium-enriched CV, onepolar and one new eclipsing CV. We analyse the outburst properties of the full sampleand show that it contains a large fraction of low accretion rate CVs with long outburstrecurrence times. We argue that most of the high accretion rate dwarf novae in thesurvey footprint have already been found and that future CRTS discoveries will bemostly low accretion rate systems. We find that CVs with white dwarf dominatedspectra have significantly fewer outbursts in their CRTS light curves compared todisc-dominated CVs, reflecting the difference in their accretion rates. Comparing theCRTS sample to other samples of CVs, we estimate the overall external completenessto be 23.6 per cent, but show that as much as 56 per cent of CVs have variabilityamplitudes that are too small to be selected using the transient selection criteriaemployed by current ground-based surveys. The full table of CRTS CVs, includingtheir outburst and spectroscopic properties examined in this paper, is provided in theonline materials.
Key words: stars: binaries: close – stars: cataclysmic variables – stars: dwarf novae
1 INTRODUCTION
Cataclysmic Variable stars (CVs) are compact binary starsconsisting of white dwarfs accreting from Roche lobe fill-ing, low mass, main sequence stars. (See Warner 1995 for acomprehensive review.) The accretion is driven by angularmomentum loss, and the process is equally applicable to thelong term evolution of a variety of other compact binariessuch as millisecond pulsars (e.g. Taam et al. 2000) and X-raybinaries (e.g. van Haaften et al. 2013). As accreting whitedwarfs, CVs also remain possible progenitors of Type Ia su-pernovae (Zorotovic et al. 2011; Kafka et al. 2012; Toonenet al. 2014), which play a central role in calibrating the ex-tragalactic distance scale. Compared to most other compactbinary populations, CVs are plentiful, bright and nearby,
? E-mail: [email protected]
making them the ideal population for the development andtesting of binary evolution models (e.g Kolb 1993; Howellet al. 1997, 2001).
In the majority of CVs, accretion occurs via an accre-tion disc around the white dwarf. The disc often dominatesthe luminosity of the system, so the component stars arenot visible in the optical part of CV spectra unless the ac-cretion rate is sufficiently low and the disc correspondinglyfaint. The accretion discs in CVs are subject to a thermalinstability, which causes quasi-periodic, large-amplitude out-bursts, known as “dwarf nova outbursts” (Meyer & Meyer-Hofmeister 1981; Osaki 1989). The onset of the outburst isfast: the system brightens by 2 – 6 magnitudes over a pe-riod as short as a day. The disc typically stays in a hot,viscous, bright state for a few days, then fades back to itsquiescent brightness. Outburst recurrence times vary fromsystem to system and depend primarily on the mass trans-
c© 2014 RAS
arX
iv:1
407.
1907
v1 [
astr
o-ph
.SR
] 7
Jul
201
4

2 E. Breedt et al.
fer rate from the donor star and the size of the accretiondisc. At the two extremes, the ER UMa-type stars are seenin outburst every few days while the WZ Sge-type stars canspend several decades in quiescence before another outburstoccurs (Robertson et al. 1995; Patterson et al. 2002). As aresult of these bright outbursts, dwarf novae are commonlyobserved as optical transients, and variability remains oneof the most efficient ways of discovering new CVs. Currentlyactive large area transient surveys include the Catalina Real-time Transient Survey (CRTS, Drake et al. 2009), the Palo-mar Transient Factory (PTF, Law et al. 2009), the MobileAstronomical System of the Telescope Robots (MASTER,Lipunov et al. 2010) and the All Sky Automated Survey(ASAS, Pojmanski 1997). CVs are also expected to be a sig-nificant fraction of the transients detected by future surveyssuch as the Gaia Science Alerts (Perryman et al. 2001) andthe Large Synoptic Survey Telescope survey (LSST, Ivezicet al. 2008).
Most of the dwarf novae with orbital periods shorterthan 2 hours also show superoutbursts, which last longerand are brighter than normal outbursts. During superout-bursts, the light curves of these CVs display photometricmodulations on a period slightly longer than the orbital pe-riod. These are known as ‘superhumps’ and result from thedynamical interaction between the disc and the donor star.The superhump period is closely related to the mass ratio ofthe two component stars and is a good proxy for the orbitalperiod (e.g. Patterson et al. 2005; Kato et al. 2009; Gansickeet al. 2009).
The orbital period is the most readily observable prop-erty of a CV, and provides important clues to the evolution-ary state of the system. CVs evolve from long (few hours)to short periods, down to a minimum of ∼ 80 min. At thispoint, the donor has lost so much mass that it cannot sustainhydrogen burning in its core any longer and it becomes de-generate. The thermal timescale of the donor star (i.e. thetimescale on which it responds to the mass loss) becomeslonger than the mass loss timescale, so it cannot contractrapidly enough to establish thermal equilibrium. In orderto accommodate the star, the binary orbit has to expandand the orbital period increases again (e.g. Rappaport et al.1982; Kolb & Baraffe 1999). As a system evolves towardsthe period minimum, the accretion rate drops and the evo-lution slows down, so a key prediction of these evolutionarymodels is an accumulation of CVs at the minimum period.Despite it being a long-standing prediction, the first obser-vational confirmation of such a spike in the orbital periodhistogram was only found recently, in the Sloan Digital SkySurvey (SDSS) sample of CVs (Gansicke et al. 2009). Thereare two main reasons for the success of the SDSS-based workin uncovering the previously “missing” CVs. Firstly, by se-lecting targets spectroscopically, a well-known observationalbias could be eliminated. CVs near the period minimumhave very low accretion rates, so undergo less frequent out-bursts. A survey which selects CVs based on large ampli-tude variability, such as dwarf nova outbursts, is thereforebiased against these WZ Sge type systems, which have longoutburst recurrence times, but which make up a consider-able, if not dominant, fraction of the entire CV population(e.g. Pretorius et al. 2007; Howell 2001). The low accretionrate CVs are also intrinsically faint, so the unprecedenteddepth of the SDSS spectroscopic survey (g . 19.0) was the
second key ingredient needed to find the period minimumspike. Despite the bias towards CVs with infrequent out-bursts, transient surveys still play an important role in CVdiscovery, as they can probe much deeper over a large skyarea than is possible with spectroscopic surveys. The biascan also be reduced by using a low threshold for transientselection, so that outbursts are detected even if the targetis not at maximum brightness when it is observed, or thatsmall amplitude variations are detected as well. The major-ity of CVs are photometrically variable, even if they do notdisplay dwarf nova outbursts.
Our analysis in this paper is based on the Catalina Real-time Transient Survey (CRTS), which utilises the imagesfrom the Catalina Sky Survey to identify supernovae, CVs,flaring AGN and other optical transient phenomena (Drakeet al. 2009). More than 9000 transient sources have beendetected since the start of CRTS operations in 2007 Novem-ber. The Catalina Sky Survey itself started in 2004, withthe main aim of finding near-earth objects1. It consists ofthree separate telescopes which repeatedly scan a combined∼ 30 000 deg2 of sky between −75◦ < δ < 65◦, except for afew degrees around the Galactic plane. The three telescopesrun separate sub-surveys, known as the Catalina SchmidtSurvey (CSS), the Mount Lemmon Survey (MLS) and SidingSpring Survey (SSS). Details of the telescopes and the ob-serving program are given by Drake et al. (2009) and Drakeet al. (2014). In terms of finding CVs, the Catalina Real-timeTransient Survey benefits not only from a large sky area andan increased depth compared to other transient surveys, butalso from the long baseline of observations. With a typicalobserving cadence of ∼ 2 weeks over the 6-year baseline,it has a higher probability of observing the infrequent out-bursts of low accretion rate CVs. The limiting magnitude ofthe survey is 19 – 21 (depending on the telescope), which isup to 2 mag deeper than the spectroscopic selection limit ofSDSS. Considering also the large amplitudes of dwarf novaoutbursts, CRTS is, in principle, sensitive to dwarf novaewith quiescent magnitudes as faint as ∼26.
The survey has already discovered many new CVs, andis a rich source for follow-up studies (e.g. Woudt et al. 2012;Thorstensen & Skinner 2012; Coppejans et al. 2014). Thetransient selection criteria, CV identification process, spa-tial distribution and photometric properties of the overallsample were presented by Drake et al. (2014). In this pa-per, we focus on the spectroscopic and outburst propertiesof the sample. We first present identification spectroscopyof 85 systems — 72 from our own follow-up observations,seven spectra from the latest data release of the Sloan Digi-tal Sky Survey and a further six spectra from the Public ESOSpectroscopic Survey for Transient Objects. In the secondpart of this paper, we investigate the outburst properties ofthe full sample of CRTS CVs candidates (from CSS, MLSand SSS) up to and including 2013 November 11, a totalof 1043 unique targets. We finally compare the sample toother known CV samples to make an estimate of the CRTScompleteness and its CV detection efficiency.
CRTS transients are assigned a detection ID in the form{CSS/MLS/SSS} {date}:HHMMSS±DDMMSS, to indicatethe survey in which the target was first found, the discovery
1 http://www.lpl.arizona.edu/css/
c© 2014 RAS, MNRAS 000, 1–23

1000 CVs from CRTS 3
date (usually the first bright detection compared to previ-ous observations and/or catalogues), and the target coor-dinates. Once the transient has been classified (e.g. Drakeet al. 2009, 2014) it is assigned a CRTS identifier of the formCRTS JHHMMSS.S+DDMMSS. We will use the latter formto refer to the CVs in this paper, but include the survey tele-scope and discovery date information in the online table, asit is used in parts of our analysis. For simplicity, we will usean abbreviated form of the CRTS ID in figure labels, i.e.CRTS HHMM±DDMM.
2 IDENTIFICATION SPECTROSCOPY
We first present the spectra from our own observations inthis section and the next. A further 13 spectra, identified inpublic spectroscopic surveys, will be presented in Section 4.
We obtained identification spectra of a total of 72 faintCV candidates identified by the CRTS, using the Gran Tele-scopio Canarias (GTC; La Palma, Spain) and the Geminitelescopes (North: Mauna Kea, Hawaii and South: CerroPachon, Chile). The observations were carried out in servicemode during 2010, 2011 and 2013. A log of the observationsis shown in Table 1 and the spectra are shown in Figure A1in the appendix. We selected our targets to be fainter thang = 19 and to fall within the SDSS photometric survey area,but made no selection based on the colour or the observedoutburst activity. The SDSS photometry provides a usefuladditional calibration of the Gemini spectra, as describedbelow.
2.1 Gemini GMOS spectroscopy
All the Gemini observations were made in Service Mode, us-ing the Gemini Multi-Object Spectrographs (GMOS) fittedwith a low resolution grating (R150) and a 1′′ slit. Eachobservation was executed as three individual exposures: oneat a central wavelength setting of 7400A and the other twowith a central wavelength shift of 50A up and down. Thiswas done to (partially) fill the gaps in the spectrum causedby the physical gaps between the three CCDs of the detectorarray, and also to improve the background subtraction.
The observations were carried out between 2010 Augustand 2011 May, and 2013 February to June. The 2010 and2013 observations were carried out as Band-3 programmes,meaning that weather conditions were often cloudy and/orthe seeing poor. We compensated for this by using longerexposure times. Occasionally, if the conditions deterioratedtoo much, the three exposures could not be carried out con-secutively. The balance was then observed later in the nightwhen the weather had sufficiently improved, or on a fol-lowing night. The date listed in Table 1 corresponds to thefirst observation for each target. The 2013 observations ben-efited from an upgrade to the GMOS-North detector arrayto a set of deep depletion CCDs with greater sensitivity andless fringing. This led to much improved spectra, despite theBand-3 weather conditions. For these observations we usedtwo central wavelength settings, 7400A and 7350A, as wellas nodding along the slit to improve the sky subtraction.
Neither GMOS is equipped with an Atmospheric Dis-persion Corrector (ADC), so a few of our observations wereaffected by flux loss in the blue part of the spectrum. The
effect is usually minimised by observing at the parallactic an-gle, i.e. aligning the slit with the direction of the dispersion,so that most of the flux enters the slit. The parallactic anglechanges with the target’s position on the sky, so it cannot bepredetermined for queue-scheduled observations like these.Unfortunately, on GMOS the slit angle is set by the choice ofguide star for the on-instrument wavefront sensor. In Band-3 conditions, this guide star needs to be bright enough toenable guiding through clouds, limiting the number of suit-able guide stars, and hence the number of slit position anglesavailable for the observation. In order to minimise slit losses,we identified multiple guide stars where possible and useda wide slit. We also selected the g band filter for target ac-quisition, which means that the target was centred on theslit near the middle of the spectral range. We chose not toimpose airmass restrictions on our observations, in order toincrease the scheduling flexibility of the programme. Occa-sionally this meant that observations had to be carried outusing a slit angle far off the parallactic angle, with a detri-mental effect on the blue flux. The targets affected by thisproblem are marked with asterisks in Figure A1.
The acquisition images from GMOS are written to discand are available as part of the data package. We carriedout photometry on these images, but because of the Band-3weather conditions, the measurements are not very accu-rate. However, since a dwarf nova outburst typically causesa brightening of several magnitudes, we could reliably usethe photometry to determine whether an object was in out-burst at the time of our observations.
We reduced and optimally extracted the spectra fromCCD2 and CCD3, using starlink packages figaro, kappaand pamela. CCD1 covers the spectral region redwards of9300A, where almost all of our targets were undetected forthe exposure times used, so it was discarded. Significantfringing is apparent in the extracted spectra redwards ofabout 7000A, especially for the faintest targets. The wave-length calibration is based on copper-argon arc lamp expo-sures taken during the day as part of the standard calibra-tion program. The wavelength calibration for CCD3 (thebluest part of the spectrum) is rather poor, because of thesmall number of arc- and sky lines are found in this spec-tral range (rms of the residuals for the blue wavelength fitis 0.33A, compared to 0.08A for the red part of the spec-trum). We therefore adjusted the wavelength scale to shiftthe emission lines to their zero velocity position before co-adding the individual exposures. This has the added ad-vantage of reducing the amount of orbital smearing of theemission lines. The extracted spectra have a spectral rangeof ∼ 3800− 9200A, with a resolution of 20.7A, as measuredfrom width of night sky emission lines.
The spectroscopic flux calibration was applied in twosteps. We first corrected for the instrument response us-ing a standard star observation taken during each observingsemester, then we scaled each spectrum by a constant factorto match its quiescent SDSS photometry2. If the target was
2 CVs are inherently variable objects, so multiple photometric
measurements often differ. We considered all available photomet-ric measurements from SDSS DR7 and DR9, and took the faintest
set of ugriz photometry as a best estimate of the quiescent mag-nitude of each target. The g band magnitudes determined thisway are shown in Table 1.
c© 2014 RAS, MNRAS 000, 1–23

4 E. Breedt et al.
Table 1. Observation log of our spectroscopic identification program, ordered by target right ascension. The Gemini spectra consistof three individual exposures. The observation date refers only to the first spectrum of that target, but the exposure time is the total
exposure time in minutes. (This is an extract only. The complete table listing all 72 targets is available in the supplementary materials
online.)
RA DEC OBSERVATION EXP.CRTS ID (deg) (deg) INSTRUMENT DATE (UT) (min) COMMENT
CRTS J004902.0+074726 12.259 7.791 GMOS-South 2010-09-14 06:41:06.9 46.0 PA > 70◦ off parallactic
CRTS J010522.2+110253 16.342 11.048 GMOS-South 2010-12-04 00:53:20.8 42.0CRTS J011306.7+215250 18.278 21.881 GMOS-North 2010-09-18 13:00:27.8 45.0
CRTS J035003.4+370052 57.514 37.014 GMOS-North 2010-09-19 13:50:37.8 27.0
CRTS J043517.8+002941 68.824 0.495 GMOS-South 2010-12-15 05:27:56.7 46.0CRTS J043546.9+090837 68.945 9.144 GMOS-South 2010-11-05 03:23:17.0 47.0 Poor seeing, high humidity
CRTS J043829.1+004016 69.621 0.671 GMOS-South 2010-12-04 07:23:01.7 28.0
CRTS J073339.3+212201 113.414 21.367 GMOS-North 2010-11-12 12:19:00.8 45.0 Cloudy. . . . . . . . . . . . . . . . . .
in outburst during our observations, or considerably fainterthan the assumed quiescent brightness from SDSS, we ap-plied no scaling. Flux and colour differences between ourspectra and the photometry are obvious in several targets(Figure A1), but that is expected given how variable CVsare. The wavelength and flux calibration, and averaging ofthe individual exposures were done using molly3.
2.2 GTC OSIRIS spectroscopy
Seven targets were observed with the OSIRIS spectrographon the Gran Telescopio Canarias (also known as GTC orGranTeCan) in 2011 March and May (see Table 1 onlineand Figure A1). The observations were carried out in Ser-vice Mode, using the R300B grism, a 1′′ wide slit and 2× 2binning of the CCD. This setup delivers a spectral range ofapproximately 3900–9970A at a resolution of 11.6A. Acqui-sition was done in the r band using 15 second exposures andall spectra were taken at the parallactic angle, under spec-troscopic sky conditions. Exposure times for the individualtargets varied between 2 – 30 minutes.
We debiased and flat fielded the spectra using standardprocedures in IRAF4. As for the Gemini spectra above, weused pamela to optimally extract the spectra and mollyto carry out the wavelength calibration. Finally we flux cal-ibrated the spectra using observations of a standard star,GD140, taken on the same night as the target observations.
3 NOTES ON INDIVIDUAL OBJECTS
All 72 of the targets we observed have spectra that are typi-cal of accreting white dwarf binary systems. The spectra areshown in Figure A1, arranged by increasing right ascension.In this section, we use the spectra and the correspondingCRTS light curves to classify the targets, and highlight a
3 molly was written by TRM and is available from
http://www.warwick.ac.uk/go/trmarsh/software/.4 IRAF is distributed by the National Optical Astronomy Ob-servatory, which is operated by the Association of Universitiesfor Research in Astronomy (AURA) under cooperative agreementwith the National Science Foundation.
few systems worthy of further observations. The main spec-tral properties are summarised in Table 2.
3.1 AMCVn systems and helium enriched CVs
AM Canum Venaticorum (AM CVn) stars are a small classof ultracompact binaries, consisting of a white dwarf accret-ing from another white dwarf or a semi-degenerate heliumdonor. They are characterised by their hydrogen deficientspectra and short orbital periods (∼ 5 − 65 minutes). Cur-rently, 39 AM CVn binaries are known (see e.g. Solheim 2010for an overview, and Carter et al. (2013a, 2014), Levitanet al. (2013) and Kupfer et al. (2013) for recent discoveries).
Our identification spectroscopy revealed threenew AM CVn binaries, CRTS J043517.8+002941,CRTS J074419.7+325448 and CRTS J084413.6-012807.Their spectra are typical of AM CVn systems, with weak,but clearly discernible Hei and Heii emission lines on ablue continuum, and an absence of any hydrogen lines.CRTS J043517.8+002941 was also detected and identifiedas an AM CVn independently by the Palomar TransientFactory, where it is known as PTF1 J043517.73+002940.7.Levitan et al. (2013) obtained Keck-I/LRIS spectra in qui-escence and estimated its orbital period to be 34.31 ± 1.94minutes.
All three binaries fall within the SDSS footprint wherea targeted spectroscopic search for AM CVn systems wascarried out (Roelofs et al. 2009; Rau et al. 2010; Carteret al. 2013a), but none of them were detected in that sur-vey. The survey involved spectroscopic identification obser-vations of colour-selected targets in SDSS DR9, down to adereddened magnitude of g = 20.5, and is ∼ 70 per centcomplete. Two of the three AM CVns identified by us arefainter than this limit, and the third, though bright enough,falls outside the colour selection box used to select their tar-gets for follow-up spectroscopy. In fact, the DR9 colours ofboth CRTS J074419.7+325448 and CRTS J084413.6-012807are redder than the g − r < −0.1 cut applied (see Table 3).This cut is based on the colours of known AM CVn binaries,and was made to eliminate (mainly) quasar contaminantsand increase the efficiency of the search program. It is how-ever important to note that disc accretors are colour-variabledue to the changes in the disc during or near an outburst.Both these targets fall inside the colour cut (i.e. they have
c© 2014 RAS, MNRAS 000, 1–23
1000 CVs from CRTS 5
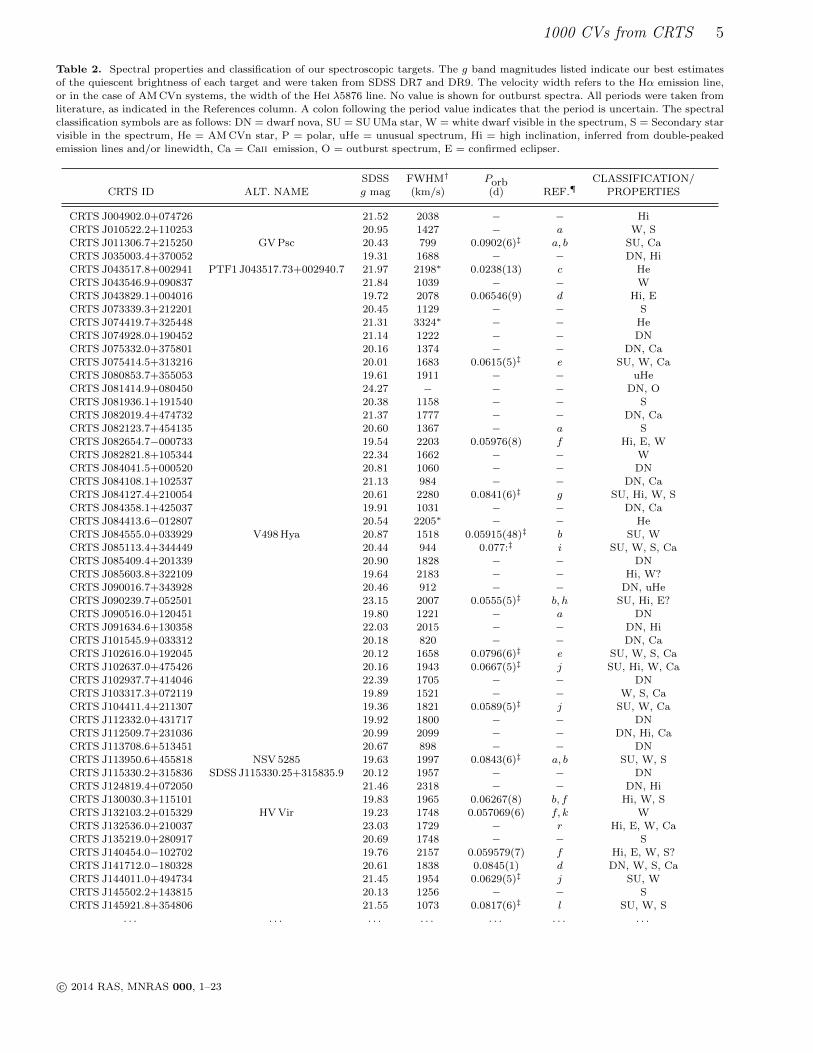
Table 2. Spectral properties and classification of our spectroscopic targets. The g band magnitudes listed indicate our best estimatesof the quiescent brightness of each target and were taken from SDSS DR7 and DR9. The velocity width refers to the Hα emission line,
or in the case of AM CVn systems, the width of the Hei λ5876 line. No value is shown for outburst spectra. All periods were taken from
literature, as indicated in the References column. A colon following the period value indicates that the period is uncertain. The spectralclassification symbols are as follows: DN = dwarf nova, SU = SU UMa star, W = white dwarf visible in the spectrum, S = Secondary star
visible in the spectrum, He = AM CVn star, P = polar, uHe = unusual spectrum, Hi = high inclination, inferred from double-peaked
emission lines and/or linewidth, Ca = Caii emission, O = outburst spectrum, E = confirmed eclipser.
SDSS FWHM† Porb CLASSIFICATION/CRTS ID ALT. NAME g mag (km/s) (d) REF.¶ PROPERTIES
CRTS J004902.0+074726 21.52 2038 − − Hi
CRTS J010522.2+110253 20.95 1427 − a W, SCRTS J011306.7+215250 GV Psc 20.43 799 0.0902(6)‡ a, b SU, Ca
CRTS J035003.4+370052 19.31 1688 − − DN, Hi
CRTS J043517.8+002941 PTF1 J043517.73+002940.7 21.97 2198∗ 0.0238(13) c HeCRTS J043546.9+090837 21.84 1039 − − W
CRTS J043829.1+004016 19.72 2078 0.06546(9) d Hi, E
CRTS J073339.3+212201 20.45 1129 − − SCRTS J074419.7+325448 21.31 3324∗ − − He
CRTS J074928.0+190452 21.14 1222 − − DN
CRTS J075332.0+375801 20.16 1374 − − DN, CaCRTS J075414.5+313216 20.01 1683 0.0615(5)‡ e SU, W, Ca
CRTS J080853.7+355053 19.61 1911 − − uHeCRTS J081414.9+080450 24.27 − − − DN, O
CRTS J081936.1+191540 20.38 1158 − − S
CRTS J082019.4+474732 21.37 1777 − − DN, CaCRTS J082123.7+454135 20.60 1367 − a S
CRTS J082654.7−000733 19.54 2203 0.05976(8) f Hi, E, W
CRTS J082821.8+105344 22.34 1662 − − WCRTS J084041.5+000520 20.81 1060 − − DN
CRTS J084108.1+102537 21.13 984 − − DN, Ca
CRTS J084127.4+210054 20.61 2280 0.0841(6)‡ g SU, Hi, W, SCRTS J084358.1+425037 19.91 1031 − − DN, Ca
CRTS J084413.6−012807 20.54 2205∗ − − He
CRTS J084555.0+033929 V498 Hya 20.87 1518 0.05915(48)‡ b SU, WCRTS J085113.4+344449 20.44 944 0.077:‡ i SU, W, S, Ca
CRTS J085409.4+201339 20.90 1828 − − DN
CRTS J085603.8+322109 19.64 2183 − − Hi, W?CRTS J090016.7+343928 20.46 912 − − DN, uHe
CRTS J090239.7+052501 23.15 2007 0.0555(5)‡ b, h SU, Hi, E?CRTS J090516.0+120451 19.80 1221 − a DN
CRTS J091634.6+130358 22.03 2015 − − DN, Hi
CRTS J101545.9+033312 20.18 820 − − DN, CaCRTS J102616.0+192045 20.12 1658 0.0796(6)‡ e SU, W, S, Ca
CRTS J102637.0+475426 20.16 1943 0.0667(5)‡ j SU, Hi, W, Ca
CRTS J102937.7+414046 22.39 1705 − − DNCRTS J103317.3+072119 19.89 1521 − − W, S, Ca
CRTS J104411.4+211307 19.36 1821 0.0589(5)‡ j SU, W, Ca
CRTS J112332.0+431717 19.92 1800 − − DNCRTS J112509.7+231036 20.99 2099 − − DN, Hi, Ca
CRTS J113708.6+513451 20.67 898 − − DNCRTS J113950.6+455818 NSV 5285 19.63 1997 0.0843(6)‡ a, b SU, W, SCRTS J115330.2+315836 SDSS J115330.25+315835.9 20.12 1957 − − DNCRTS J124819.4+072050 21.46 2318 − − DN, HiCRTS J130030.3+115101 19.83 1965 0.06267(8) b, f Hi, W, S
CRTS J132103.2+015329 HV Vir 19.23 1748 0.057069(6) f, k W
CRTS J132536.0+210037 23.03 1729 − r Hi, E, W, CaCRTS J135219.0+280917 20.69 1748 − − S
CRTS J140454.0−102702 19.76 2157 0.059579(7) f Hi, E, W, S?CRTS J141712.0−180328 20.61 1838 0.0845(1) d DN, W, S, CaCRTS J144011.0+494734 21.45 1954 0.0629(5)‡ j SU, W
CRTS J145502.2+143815 20.13 1256 − − S
CRTS J145921.8+354806 21.55 1073 0.0817(6)‡ l SU, W, S. . . . . . . . . . . . . . . . . . . . .
c© 2014 RAS, MNRAS 000, 1–23

6 E. Breedt et al.
Table 2. continued. Spectral properties and classification of our spectroscopic targets.
SDSS FWHM† Porb CLASSIFICATION/
CRTS ID ALT. NAME g mag (km/s) (d) REF.¶ PROPERTIES
. . . . . . . . . . . . . . . . . . . . .
CRTS J151020.7+182303 21.38 1877 − − S
CRTS J152158.8+261223 21.09 1993 − − Hi, WCRTS J154544.9+442830 20.95 1171 0.0742(5)‡ e DN, Ca
CRTS J155430.6+365043 21.74 1791 0.069: m DN
CRTS J160003.7+331114 VW CrB 19.89 2106 0.0705(5)‡ n Hi, W, SCRTS J160844.8+220610 20.94 1845 − − DN, Hi
CRTS J163805.4+083758 V544 Her 19.74 1258 0.069(3): p S
CRTS J164748.0+433845 21.59 3651 − − uHe, HiCRTS J165002.8+435616 22.91 1751 − − DN
CRTS J171202.9+275411 21.42 958 − − DN
CRTS J171223.1+362516 20.87 − − − DN, OCRTS J172515.5+073249 20.66 1736 − − W
CRTS J173307.9+300635 22.53 1378 − − DN, S?
CRTS J210043.9−005212 22.27 − − − DN, OCRTS J210650.6+110250 20.51 1556 − − DN, Ca
CRTS J210954.1+163052 23.48 − − a DN, OCRTS J214842.5−000723 V340 Aqr 23.05 1607 − − DN
CRTS J224823.7−092059 21.15 1628 − − W
CRTS J231142.8+204036 21.24 996 0.08: q DN, Ca
† Refers to Hα, except for the starred values, which refer to Hei λ5876.∗No hydrogen in the spectrum. Linewidth refers to the Hei λ5876 line.
‡ Derived from the superhump period, using equation 1 of Gansicke et al. (2009)
¶ References: a – Thorstensen & Skinner (2012), b – Kato et al. (2009), c – Levitan et al. (2013), d – Coppejans et al. (2014), e – Katoet al. (2012), f – Woudt et al. (2012), g – Kato et al. (2014), h – Uemura & Arai (2008), vsnet-alert 9955, i – Maehara (2008),
vsnet-alert 10723, j – Kato et al. (2010), k – Patterson et al. (2003), l – Kato et al. (2013), m – Boyd (2008), vsnet-outburst 9500, n –
Nogami et al. (2004), p – Howell et al. (1990), q – Masi (2012), vsnet-alert 14696, r – This paper.
‘normal’ AM CVn colours) when their SDSS DR7 photome-try is considered. They were fainter and bluer at the time ofthe DR7 observations than when the DR9 photometry wastaken. It appears that they were rising towards or fadingafter an outburst at the time of their DR9 observations andthat the colour-variability was large enough to push themout of the (NUV−u, g − r) colour selection box.
Our follow-up sample also contain two helium-enriched CVs. The Gemini North spectrum ofCRTS J080853.7+355053 displays strong lines of hy-drogen, identifying it as a CV rather than an AM CVnsystem. The line flux ratios however reveal that it has anenhanced helium abundance compared to normal CVs. Wemeasure Hei5876/Hα= 0.938± 0.003, compared to 0.2− 0.4for typical dwarf novae (e.g. Szkody 1981; Thorstensen &Taylor 2001). There are no features from the companionstar visible in the spectrum, but the high He/H ratiosuggests that it had undergone significant nuclear evolutionbefore mass transfer started in this binary.
Two similar systems have recently been discov-ered, CRTS J112253.3−111037 (Breedt et al. 2012) andCRTS J111126.9+571239 (Carter et al. 2013b; Littlefieldet al. 2013). Both these binaries have orbital periods wellbelow the orbital period minimum of CVs and enhancedhelium in their optical spectra. As the binary continuesto evolve, the spectrum will become increasingly heliumrich. Podsiadlowski et al. (2003) proposed this mecha-nism as a possible formation channel for AM CVn bina-ries, but because of the lack of observed progenitor bi-
naries, as well as long evolutionary timescales required,this formation channel is considered less likely than al-ternatives (e.g. Nelemans et al. 2010). Population synthe-sis models suggest that less than two per cent of com-pact binaries could form this way (Nelemans et al. 2004),favouring instead models which involve two phases of com-mon envelope evolution to reduce the binary to its com-pact size. However, CRTS J080853.7+355053 is now thethird such system discovered by CRTS. Its orbital periodis still unknown, but given the similarity of its spectrum toCRTS J112253.3−111037 and CRTS J111126.9+571239, weexpect it to be well below 80 minutes as well. With the ad-dition of the recently discovered BOKS 45906, a 56 minuteCV in the Kepler field (Ramsay et al. 2014), evolved CVsnow account for 10 per cent of all semi-detached white dwarfbinaries with orbital periods below the CV period minimum(Breedt et al. 2012). This fraction increases to 12 per centif CRTS J080853.7+355053 is included as well. With such alarge fraction of possible progenitors, the evolved CV chan-nel can clearly not be neglected when considering pathwaysof AM CVn formation.
There are several other AM CVn candidates and ul-tracompact CVs among the full sample of CRTS CVcandidates that did not form part of our spectroscopicfollow-up. CRTS J045019.8-093113 was identified as a pos-sible AM CVn by Drake et al. (2012), and photometricfollow-up by Woudt et al. (2013) revealed a period of47.28 ± 0.01 min. They note that it is unusual for anAM CVn at such a long period to undergo outbursts. Lev-
c© 2014 RAS, MNRAS 000, 1–23

1000 CVs from CRTS 7
Table 3. Dereddened magnitudes of the AM CVn systems and helium-enriched binaries identified in our follow-up sample.
CRTS ID GALEX SDSS DR7 MJD SDSS DR9 MJD NOTE
FUV NUV u g (g − r) [DR7] u g (g − r) [DR9]
CRTS J043517.8+002941 – – – – – – 21.502 21.684 −0.239 51136.3 a, d
CRTS J074419.7+325448 20.349 20.568 20.923 21.131 −0.292 51961.1 20.479 20.602 +0.029 54152.3 b
CRTS J084413.6−012807 19.898 20.164 20.050 20.264 −0.160 52016.2 20.121 20.004 −0.034 54057.4 b
CRTS J080853.7+355053 19.608 19.533 19.550 19.612 −0.009 52262.3 – – – – c, e
CRTS J164748.0+433845 21.900 21.550 21.326 21.551 −0.258 51991.4 – – – – c, e
a – AM CVn binary, also known as PTF1 J043517.73+002940.7. b – New AM CVn binary. c – Helium-enriched CV. d – Area not
covered by GALEX GR6 or SDSS DR7. e – No new DR9 measurement.
itan et al. (2013) also identifies CRTS J163239.3+351108(=PTF1 J163239.39+351107.3) as a possible AM CVn, butthe spectrum they obtained was insufficient to confirm thisclassification. An outburst spectrum of CRTS J102842.9-081927 by vsnet5 observers was reported to show both hy-drogen and helium lines (Kato & Kinugasa 2009, vsnet-alert 11166) but photometry carried out by Woudt et al.(2012) revealed a very short period of 52 minutes. A shortphotometric period is also seen in CRTS J233313.0-155744(62 min, Woudt & Warner 2011) but little else is knownabout this system at present. CRTS also detected outburstsof the known AM CVn binaries CP Eri, SDSSJ1721+2733(Rau et al. 2010) and SDSSJ0926+3624 (Copperwheat et al.2011)6. So, in the complete sample of 1043 CRTS CVs andCV candidates, seven are confirmed AM CVn systems, anda further six have periods below the CV period minimum.
We also include in this section the spectrum ofCRTS J164748.0+433845. It appears to show only broadHeii in emission, on top of an otherwise featureless bluecontinuum. Closer inspection reveals weak Hα emission aswell, but no other lines are apparent in the spectrum. Itis possible that the system was in outburst during our ob-servations (the acquisition magnitude is 1.85 mag brighterthan its quiescent magnitude from SDSS) but the isolatedstrong Heii line remains unusual. Strong Heii emission isoften associated with a magnetic white dwarf, but it canalso be enhanced by accretion activity during a dwarf novaoutburst. The field containing CRTS J164748.0+433845 hasbeen observed 80 times over the nine years of CSS observa-tions, but it has only been detected on five of those nights,since it is well below the CSS detection limit during its faintstate. We note that the SDSS colours of this system (Ta-ble 3) fall inside the colour selection box for AM CVn, asdefined by Carter et al. (2013a). The nature of this systemis currently unclear. Its blue colour and unusually strongHeii emission certainly makes it worthy of further observa-tions to determine whether it is another AM CVn system.
3.2 White dwarf dominated spectra
In most of the known non-magnetic cataclysmic variables,the luminosity is dominated by the emission from the ac-cretion disc. If however the accretion rate is low and the
5 http://www.kusastro.kyoto-u.ac.jp/vsnet/6 The corresponding CRTS IDs are CRTS J031032.8-094506,CRTS J172102.5+273301 and CRTS J092638.7+362402.
accretion disc faint, spectral features from the componentstars may be visible in the optical spectra.
25 of our spectra display broad absorption wingsin the Balmer lines, formed in the atmosphere of thewhite dwarf. These targets are labelled “W” in Table 2.In CRTS J075414.5+313216, CRTS J130030.3+115101,CRTS J132103.2+015329, CRTS J140454.0-102702 andCRTS J172515.5+073249 the flux is strongly dominatedby the white dwarf. Such a strong signature of the whitedwarf in the optical spectrum is often seen in old, shortperiod CVs with low accretion rates (Gansicke et al. 2009).Photometric observations are available for four of thesefive CVs, confirming that they have short orbital periods.Kato et al. (2012) find a superhump period of 90.86 min inCRTS J075414.5+313216. The spectrum of this system alsodisplays broad Caii emission, likely from the accretion disc.Woudt et al. (2012) found a strong double-humped modula-tion in the quiescent light curve of CRTS J130030.3+115101and measured an orbital period of 90.24 min. They alsoreport CRTS J140454.0-102702 to be an eclipsing CV witha period of 86.05 min. CRTS J132103.2+015329, also knownas HV Vir, has an orbital period of 82.18 minutes (Pattersonet al. 2003; Woudt et al. 2012).
There are also several targets in which the white dwarfsignal is slightly weaker but still clearly visible at Hβand Hγ. CRTS J043546.9+090837, CRTS J082821.8+105344and CRTS J224823.7−092059 are among the faintest tar-gets we observed spectroscopically. Only Hα, Hβ and weakHei λ5876 emission lines are visible in their spectra, but thelines are strong enough to clearly identify these targets asCVs.
CRTS J010522.2+110253, CRTS J084555.0+033929,CRTS J102637.0+475426, CRTS J104411.4+211307 andCRTS J144011.0+494734 are brighter, but display sim-ilar weak absorption from the white dwarf plus strongBalmer and Hei emission lines. Photometric observa-tions during the decline from outburst revealed super-hump periods for four of these targets: 86.92 min inCRTS J084555.0+033929 (=V498 Hya) (Kato et al. 2009),119.4 min in CRTS J102637.0+475426 (Kato et al. 2012),85.09 min in CRTS J104411.4+211307 and 92.90 min inCRTS J144011.0+494734 (Kato et al. 2010). The period ofCRTS J010522.2+110253 is unknown.
It is interesting to note that for the majority of targetsdiscussed in this section, only a single outburst has beenobserved by CRTS. Of course, the coarse sampling of CRTSobservations means that some outbursts could have been
c© 2014 RAS, MNRAS 000, 1–23

8 E. Breedt et al.
missed, but over a baseline of nine years, observing onlya single outburst is strongly suggestive of a long outburstrecurrence time, and strengthens the classification of thesedwarf novae as WZ Sge-type stars. We return to this issuein section 6.2.
The spectra of five stars display absorption fea-tures from both the white dwarf and an M-type donorstar: CRTS J084127.4+210054, CRTS J085113.4+344449,CRTS J102616.0+192045, CRTS J103317.3+072119 andCRTS J145921.8+354806. Although this implies a lowaccretion rate in these systems, they are unlikely to beWZ Sge stars, as the donor would be too faint to see in theoptical spectrum of WZ Sge stars. The CRTS light curves ofall five these systems show multiple outbursts. Superhumpperiods reveal that these systems are close to the loweredge of the period gap, so it is possible that the donor isonly just filling its Roche lobe after evolving through thegap, and that the accretion rate is still low. We note thatthe dwarf nova IR Com (Porb = 125.4 min, so also at thelower edge of the period gap) spent more than two yearsin a ‘low state’, which is very unusual for a non-magneticCV (Manser & Gansicke 2014). While earlier spectra ofthis system are clearly disc-dominated with strong emissionlines, the low state spectrum resembles a detached binarywith little evidence of accretion. This suggests that theaccretion initially occurs in short bursts, and the systemtakes some time to reach a stable mass transfer rate.
The CRTS CVs which show both the white dwarf andthe donor star in their spectra have superhump periods of126.3 min in CRTS J084127.4+210054 (Kato et al. 2013),∼ 115 min in CRTS J085113.4+344449 (Maehara 2008,vsnet-alert 10723), 119.0 min in CRTS J102616.0+192045(Kato et al. 2012) and 122.6 min in CRTS J145921.8+354806(Kato et al. 2013). The period of CRTS J103317.3+072119is not known. Its spectrum is very blue, with only a smallcontribution from the donor star.
3.3 Donor star visible in the continuum
The donor star is recognised in the optical spectrum byabsorption bands from Mg (near 5200A) and TiO (near7100A). Five of our targets have spectra which show featuresconsistent with an M star donor: CRTS J073339.3+212201,CRTS J082123.7+454135, CRTS J135219.0+280917,CRTS J145502.2+143815 and CRTS J160003.7+331114.The latter is also known as VW CrB and has a superhumpperiod of 104.9 min (Nogami et al. 2004).
Additionally, three spectra show evidence of a K stardonor: CRTS J081936.1+191540, CRTS J151020.7+182303and CRTS J163805.4+083758 (=V544 Her). The latter is aknown, but poorly studied dwarf nova. The continuum ap-pears to be that of a hot (K type) donor star, typical oflong period systems. However, Howell et al. (1990) measurea photometric period of only 100 min. A normal main se-quence K star is too large to fit inside the Roche lobe ofsuch a short period binary. A typical CV at this orbital pe-riod has a M5–6 donor (Knigge et al. 2011). It thereforeappears that this is a binary in which mass transfer onlystarted after the donor had already started to evolve. Thehot donor star seen in the spectrum is the evolved core,stripped from its outer layers by the accretion process. An-other such CV has recently been reported by Thorstensen
(2013) (CRTS J134052.1+151341) and it is thought that thesame process is responsible for some sub-period minimumCVs, such as V485 Cen (Augusteijn et al. 1993) and EI Psc(Thorstensen et al. 2002). V544 Her is worthy of further ob-servations.
3.4 High inclination systems
The spectra of high inclination (eclipsing) CVs often havebroad, double-peaked emission lines, resulting from the ve-locity difference between opposite parts of the outer accre-tion disc. This spectral feature is often taken as indicativeof a high inclination, and therefore a CV that could poten-tially show eclipses of the white dwarf by the secondary star.Eclipsing systems are very useful, since geometrical mod-elling of their light curves allows for precise measurementsof the system parameters, such as masses and radii of thecomponent stars, binary inclination and orbital period (e.g.Littlefair et al. 2008; Savoury et al. 2011).
18 of our targets display double-peaked emission linesin their spectra. Three of these have already been con-firmed as eclipsers: CRTS J043829.1+004016 was found tobe a deeply eclipsing CV (∼ 1 mag) by Coppejans et al.(2014), who measured an orbital period of 94.306 min.The same group also reported CRTS J082654.7−000733 andCRTS J140454.0−102702 to be eclipsing CVs, with orbitalperiods of 85.794 min and 86.05 min, respectively (Woudtet al. 2012). Consistent with the short orbital periods, ourspectra of these two CVs show clear absorption from thewhite dwarf in the Balmer lines (see section 3.2), and in thecase of CRTS J140454.0−102702, the spectrum is stronglydominated by the white dwarf emission.
CRTS J132536.0+210037 is a new eclipsing CV, clearlyrevealed as such by its SDSS photometry and CRTS lightcurve in Figure A1. The SDSS riz magnitudes match ourGemini spectrum well, but the g band measurement is3.5 mag fainter, as it was taken while the system was ineclipse. The CRTS light curve shows that the quiescentbrightness is ∼ 19.5 mag. The spectrum shows clear ab-sorption wings around Hβ and Hγ, so we expect it to havea short (< 90 min) orbital period.
The other 14 high inclination systems are flagged in Ta-ble 2. Six of these display absorption features from the whitedwarf as well. We note that there are reports of a shalloweclipse in outburst photometry of CRTS J090239.7+052501(Uemura & Arai 2008, vsnet-alert 9955). The system is wellbelow the CRTS detection limit during quiescence (g =23.15), so high time resolution observations of the eclipseduring quiescence, will require a large aperture telescope.Its orbital period, estimated from the superhump period, is79.9 minutes (Kato et al. 2009).
3.5 Dwarf novae in outburst
Four of our spectra are typical of dwarf novae in ornear outburst. The spectra of CRTS J171223.1+362516 andCRTS J210043.9−005212 display broad Balmer absorptionfrom the optically thick accretion disc, as well as weakHα emission. They were detected at g = 17.0 and 18.7mag respectively at the time of our Gemini observations,which is 3.9 and 2.9 mag brighter than their SDSS g
c© 2014 RAS, MNRAS 000, 1–23

1000 CVs from CRTS 9
band magnitudes. The spectra of CRTS J081414.9+080450and CRTS J210954.1+163052 show a bright continuum, butreasonably strong Balmer emission as well. Their acquisi-tion magnitudes were respectively 4.2 and 1.2 magnitudesbrighter than their SDSS g band magnitudes, and matchthe magnitudes of the outburst detections in their CRTSlight curves (Figure A1). These two CVs were probably onthe rise to, or cooling down from, an outburst when theirspectra were taken. We note that CRTS J081414.9+080450displays strong Heii λ4686 in its spectrum, which may bedue to the enhanced accretion flow. We compared our spec-troscopy observation dates with the CRTS light curves, butnone of the four outbursts were covered by the CRTS obser-vations.
3.6 Ordinary quiescent dwarf novae
The combination of Balmer and He emission line spectra andlight curves showing at least one outburst event, confirm theclassification of the remaining 31 targets in our spectroscopicsample as dwarf novae. They are marked as ‘DN’ in Table 2,or as ‘SU’ if a superhump period has been reported in lit-erature. Our spectroscopic observations were taken duringquiescence. Most of the targets are below the CRTS detec-tion limit in quiescence, and were only discovered as a resultof a bright outburst.
For completeness, we note thatCRTS J090516.0+120451 and CRTS J113950.6+455818were observed by Thorstensen & Skinner (2012) as well,but we include our spectra here as they extend further intothe blue. CRTS J115330.2+315836 was observed by SDSSsix weeks after our Gemini observation (see section 4.1),and CRTS J171202.9+275411 was also observed by Wilset al. (2010).
4 OTHER NEW SPECTROSCOPICIDENTIFICATIONS
In addition to the 72 spectra from our own spectroscopicfollow-up program presented in the previous section, a fur-ther 13 targets from the full sample of 1043 CRTS CVs havepreviously unpublished spectra available in public spectro-scopic surveys.
4.1 SDSS BOSS
The Baryonic Oscillations Spectroscopic Survey (BOSS) isthe most recent (and ongoing) optical spectroscopic surveyfrom the SDSS. The first three years of BOSS observationswere published on 2013 July 31 as part of SDSS Data Re-lease 10 (DR10, Ahn et al. 2014). Among the ∼ 145 000BOSS stellar spectra available, we found eight matchesto our CRTS CV sample. For completeness, we includethe BOSS spectrum of CRTS J115330.2+315836, which wastaken six weeks after our Gemini observation, shown in Fig-ure A1. Of the eight CVs identified among the BOSS spec-tra, only CRTS J221519.8−003257 (=V344 Aql) is a previ-ously known CV.
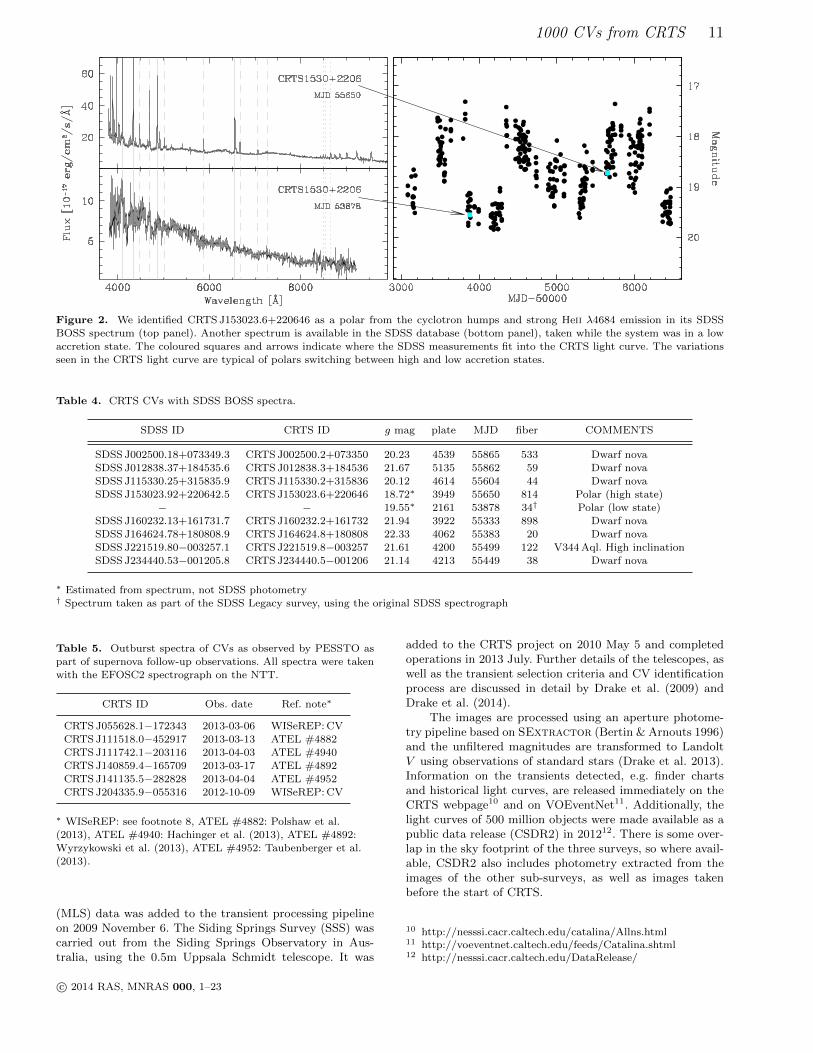
CRTS J153023.6+220646 has an older SDSS spectrumavailable in addition to the BOSS spectrum (Figure 2), but
it was not previously recognised as a CV. The BOSS spec-trum displays obvious cyclotron humps in the continuum aswell as a very strong Heii λ4684 emission line — hallmarksof a magnetic CV. The CRTS light curve is typical of polarvariability. It shows variations of ∼ 3 mag as the systemsswitches between high and low accretion states. The olderSDSS spectrum was taken during the low state, when the ac-cretion was switched off. The system was much fainter, andZeeman splitting from the magnetic white dwarf is visiblein Balmer lines of the spectrum.
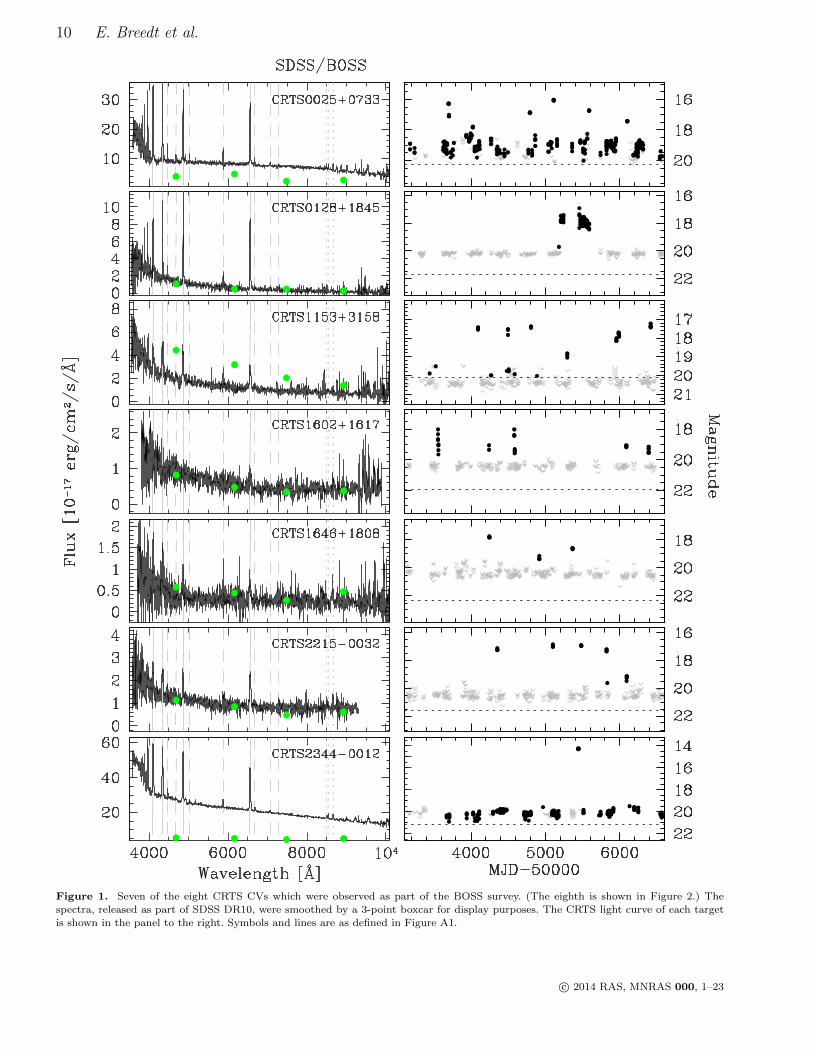
The other seven spectra are shown in Figure 1 alongwith their CRTS light curves. The spectra display clearBalmer emission and the variability of the light curves iden-tify them as normal dwarf novae. Table 4 list the basic spec-tral properties of the BOSS CVs, as well as the plate-MJD-fibre information to locate their DR10 spectra.
4.2 PESSTO
PESSTO is the Public ESO Spectroscopic Survey for Tran-sient Objects7 carried out by a consortium of institutions onthe European Southern Observatory’s (ESO) New Technol-ogy Telescope on La Silla, Chile, using the EFOSC2 (opti-cal) and SOFI (near-infrared) spectrographs. The main aimof the survey is to follow-up and classify supernovae acrossa range of parameters such as luminosity and metallicity.Transients are selected from various surveys such as La Silla-Quest, SkyMapper, Pan-STARRS1 as well as CRTS. As apublic survey, the spectra are made available immediatelyin the ESO archive and are also uploaded to the WISeREPdatabase (Weizmann Interactive Supernova data REPosi-tory; Yaron & Gal-Yam 2012)8.
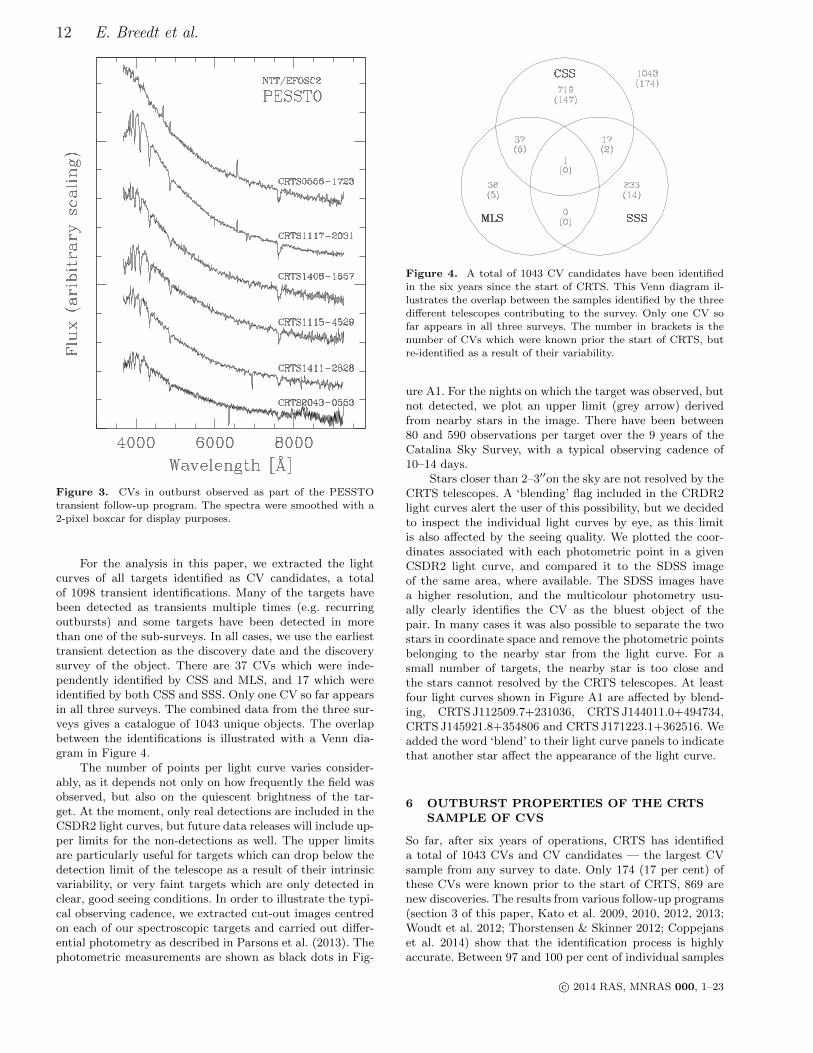
Most targets observed by PESSTO are supernovae,but occasionally a large amplitude transient turns outto be a dwarf nova in outburst. We found spectra forsix CRTS CVs in the WISeREP database, four of whichwere reported as “stellar” in Astronomer’s Telegrams9 (seeTable 5). All six targets have steep blue spectra withBalmer absorption, typical of CVs in outburst. The spectraof CRTS J055628.1−172343 and CRTS J111742.1−203116show Hα in emission. The spectra are shown in Figure 3and information on the observations are given in Table 5.All six CVs are below the CRTS detection limit in quies-cence and have only been observed during these discoveryoutbursts.
5 CV LIGHT CURVES FROM CRTS
Three telescopes, equipped with identical 4k×4k pixel CCDcameras, contribute imaging data to the Catalina SkySurvey. CRTS started searching the imaging data of theCatalina Schmidt Survey (CSS) for transients on 2007November 8. The survey is carried out using the 0.7mCatalina Schmidt telescope on Mount Bigelow, just north ofTucson, Arizona, USA. On the nearby Mount Lemmon, the1.5m telescope is used to scan the ecliptic latitudes for near-earth objects and transients. The Mount Lemmon Survey
7 http://www.pessto.org8 http://www.weizmann.ac.il/astrophysics/wiserep/9 ATEL, http://www.astronomerstelegram.org/
c© 2014 RAS, MNRAS 000, 1–23
10 E. Breedt et al.
Figure 1. Seven of the eight CRTS CVs which were observed as part of the BOSS survey. (The eighth is shown in Figure 2.) The
spectra, released as part of SDSS DR10, were smoothed by a 3-point boxcar for display purposes. The CRTS light curve of each target
is shown in the panel to the right. Symbols and lines are as defined in Figure A1.
c© 2014 RAS, MNRAS 000, 1–23
1000 CVs from CRTS 11
Figure 2. We identified CRTS J153023.6+220646 as a polar from the cyclotron humps and strong Heii λ4684 emission in its SDSS
BOSS spectrum (top panel). Another spectrum is available in the SDSS database (bottom panel), taken while the system was in a lowaccretion state. The coloured squares and arrows indicate where the SDSS measurements fit into the CRTS light curve. The variations
seen in the CRTS light curve are typical of polars switching between high and low accretion states.
Table 4. CRTS CVs with SDSS BOSS spectra.
SDSS ID CRTS ID g mag plate MJD fiber COMMENTS
SDSS J002500.18+073349.3 CRTS J002500.2+073350 20.23 4539 55865 533 Dwarf novaSDSS J012838.37+184535.6 CRTS J012838.3+184536 21.67 5135 55862 59 Dwarf nova
SDSS J115330.25+315835.9 CRTS J115330.2+315836 20.12 4614 55604 44 Dwarf nova
SDSS J153023.92+220642.5 CRTS J153023.6+220646 18.72∗ 3949 55650 814 Polar (high state)− − 19.55∗ 2161 53878 34† Polar (low state)
SDSS J160232.13+161731.7 CRTS J160232.2+161732 21.94 3922 55333 898 Dwarf nova
SDSS J164624.78+180808.9 CRTS J164624.8+180808 22.33 4062 55383 20 Dwarf novaSDSS J221519.80−003257.1 CRTS J221519.8−003257 21.61 4200 55499 122 V344 Aql. High inclination
SDSS J234440.53−001205.8 CRTS J234440.5−001206 21.14 4213 55449 38 Dwarf nova
∗ Estimated from spectrum, not SDSS photometry† Spectrum taken as part of the SDSS Legacy survey, using the original SDSS spectrograph
Table 5. Outburst spectra of CVs as observed by PESSTO aspart of supernova follow-up observations. All spectra were taken
with the EFOSC2 spectrograph on the NTT.
CRTS ID Obs. date Ref. note∗
CRTS J055628.1−172343 2013-03-06 WISeREP: CV
CRTS J111518.0−452917 2013-03-13 ATEL #4882
CRTS J111742.1−203116 2013-04-03 ATEL #4940CRTS J140859.4−165709 2013-03-17 ATEL #4892
CRTS J141135.5−282828 2013-04-04 ATEL #4952
CRTS J204335.9−055316 2012-10-09 WISeREP: CV
∗ WISeREP: see footnote 8, ATEL #4882: Polshaw et al.
(2013), ATEL #4940: Hachinger et al. (2013), ATEL #4892:Wyrzykowski et al. (2013), ATEL #4952: Taubenberger et al.
(2013).
(MLS) data was added to the transient processing pipelineon 2009 November 6. The Siding Springs Survey (SSS) wascarried out from the Siding Springs Observatory in Aus-tralia, using the 0.5m Uppsala Schmidt telescope. It was
added to the CRTS project on 2010 May 5 and completedoperations in 2013 July. Further details of the telescopes, aswell as the transient selection criteria and CV identificationprocess are discussed in detail by Drake et al. (2009) andDrake et al. (2014).
The images are processed using an aperture photome-try pipeline based on SExtractor (Bertin & Arnouts 1996)and the unfiltered magnitudes are transformed to LandoltV using observations of standard stars (Drake et al. 2013).Information on the transients detected, e.g. finder chartsand historical light curves, are released immediately on theCRTS webpage10 and on VOEventNet11. Additionally, thelight curves of 500 million objects were made available as apublic data release (CSDR2) in 201212. There is some over-lap in the sky footprint of the three surveys, so where avail-able, CSDR2 also includes photometry extracted from theimages of the other sub-surveys, as well as images takenbefore the start of CRTS.
10 http://nesssi.cacr.caltech.edu/catalina/Allns.html11 http://voeventnet.caltech.edu/feeds/Catalina.shtml12 http://nesssi.cacr.caltech.edu/DataRelease/
c© 2014 RAS, MNRAS 000, 1–23
12 E. Breedt et al.
Figure 3. CVs in outburst observed as part of the PESSTOtransient follow-up program. The spectra were smoothed with a
2-pixel boxcar for display purposes.
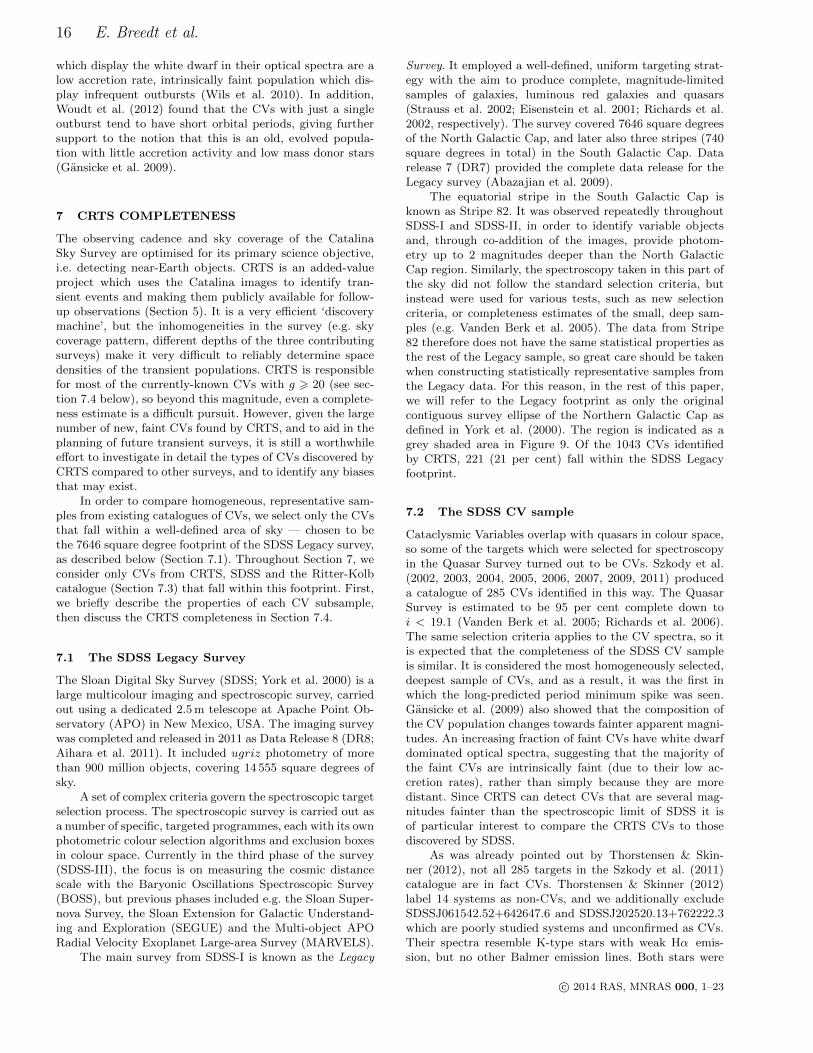
For the analysis in this paper, we extracted the lightcurves of all targets identified as CV candidates, a totalof 1098 transient identifications. Many of the targets havebeen detected as transients multiple times (e.g. recurringoutbursts) and some targets have been detected in morethan one of the sub-surveys. In all cases, we use the earliesttransient detection as the discovery date and the discoverysurvey of the object. There are 37 CVs which were inde-pendently identified by CSS and MLS, and 17 which wereidentified by both CSS and SSS. Only one CV so far appearsin all three surveys. The combined data from the three sur-veys gives a catalogue of 1043 unique objects. The overlapbetween the identifications is illustrated with a Venn dia-gram in Figure 4.
The number of points per light curve varies consider-ably, as it depends not only on how frequently the field wasobserved, but also on the quiescent brightness of the tar-get. At the moment, only real detections are included in theCSDR2 light curves, but future data releases will include up-per limits for the non-detections as well. The upper limitsare particularly useful for targets which can drop below thedetection limit of the telescope as a result of their intrinsicvariability, or very faint targets which are only detected inclear, good seeing conditions. In order to illustrate the typi-cal observing cadence, we extracted cut-out images centredon each of our spectroscopic targets and carried out differ-ential photometry as described in Parsons et al. (2013). Thephotometric measurements are shown as black dots in Fig-
Figure 4. A total of 1043 CV candidates have been identified
in the six years since the start of CRTS. This Venn diagram il-lustrates the overlap between the samples identified by the three
different telescopes contributing to the survey. Only one CV so
far appears in all three surveys. The number in brackets is thenumber of CVs which were known prior the start of CRTS, but
re-identified as a result of their variability.
ure A1. For the nights on which the target was observed, butnot detected, we plot an upper limit (grey arrow) derivedfrom nearby stars in the image. There have been between80 and 590 observations per target over the 9 years of theCatalina Sky Survey, with a typical observing cadence of10–14 days.
Stars closer than 2–3′′on the sky are not resolved by theCRTS telescopes. A ‘blending’ flag included in the CRDR2light curves alert the user of this possibility, but we decidedto inspect the individual light curves by eye, as this limitis also affected by the seeing quality. We plotted the coor-dinates associated with each photometric point in a givenCSDR2 light curve, and compared it to the SDSS imageof the same area, where available. The SDSS images havea higher resolution, and the multicolour photometry usu-ally clearly identifies the CV as the bluest object of thepair. In many cases it was also possible to separate the twostars in coordinate space and remove the photometric pointsbelonging to the nearby star from the light curve. For asmall number of targets, the nearby star is too close andthe stars cannot resolved by the CRTS telescopes. At leastfour light curves shown in Figure A1 are affected by blend-ing, CRTS J112509.7+231036, CRTS J144011.0+494734,CRTS J145921.8+354806 and CRTS J171223.1+362516. Weadded the word ‘blend’ to their light curve panels to indicatethat another star affect the appearance of the light curve.
6 OUTBURST PROPERTIES OF THE CRTSSAMPLE OF CVS
So far, after six years of operations, CRTS has identifieda total of 1043 CVs and CV candidates — the largest CVsample from any survey to date. Only 174 (17 per cent) ofthese CVs were known prior to the start of CRTS, 869 arenew discoveries. The results from various follow-up programs(section 3 of this paper, Kato et al. 2009, 2010, 2012, 2013;Woudt et al. 2012; Thorstensen & Skinner 2012; Coppejanset al. 2014) show that the identification process is highlyaccurate. Between 97 and 100 per cent of individual samples
c© 2014 RAS, MNRAS 000, 1–23

1000 CVs from CRTS 13
Figure 5. CRTS discovery rate of supernovae (left) and CVs
(right), for each of the three contributing surveys as labelled.Using the number of supernovae as a proxy for the detection
efficiency, the bottom panel shows that the effective CV discoveryrate is decreasing.
of CV candidates which were followed up, were confirmed asCVs.
Of the 869 new discoveries, at least 154 have beenconfirmed spectroscopically so far. A further 86 of thenew CRTS discoveries have been confirmed by photometricfollow-up. In total (including the previously known CVs), atleast 40 per cent of candidates have been spectroscopicallyor photometrically confirmed as CVs. In the sections thatfollow, we will assume that all objects in the catalogue aregenuine cataclysmic variables.
6.1 Discovery rate
The largest fraction of transients detected by CRTS are su-pernovae. They account for just over 20 per cent of the totalnumber of CRTS transients, compared to the ∼ 13 per centwhich are identified as CVs. Supernovae are observed as asingle brightening events (as opposed to repeated outburstsobserved in many dwarf novae) and are often associatedwith a faint galaxy in the survey images. Supernovae alsostay bright for longer than the dwarf novae, which helps todifferentiate between the transient types. There are severalobserving programs aimed at confirming these supernovaespectroscopically (e.g. PESSTO, see section 4.2). If we as-sume that supernovae occur at a constant rate, the numberof supernovae discovered can act as a proxy for the overalltransient detection efficiency of CRTS, and allow us to cal-
culate an effective CV discovery rate. Since the CVs and su-pernovae are identified using the same process, and from thesame survey data, this method is particularly useful for re-moving effects such as the slowly expanding survey footprintand varying weather conditions on the number of transientsobserved.
The top panels of Figure 5 show histograms of the num-ber of supernovae and CVs identified by each of the threecontributing surveys. We bin the histograms to reflect thenumber of transients per year, since the start of CRTS oper-ations (2007 November). The MLS and SSS data are binnedto match the CSS histogram bins for direct comparison. Bin-ning per year also has the advantage that all bins are affectedby seasonal weather effects equally.
Supernovae are typically detected at fainter magnitudesthan CVs (see fig. 3 of Drake et al. 2014), so the larger MLStelescope discovers relatively more supernovae compared toCVs than the other two surveys. In fact, as shown in Fig-ure 5, MLS contributes very little to the overall CV count,only ∼ 10 CVs/year. The opposite is true of the SSS, whichused the smallest telescope – this survey discovered morethan double the number of CVs compared to supernovaeeach year.
Since MLS contributes very few CVs overall and SSShas finished operations, the future discovery rate of CVs willbe almost entirely determined by CSS. The CSS-discoveredCVs are shown in the top panel of Figure 5. They are clearlyfewer in number than the supernovae, and their discoveryrate has decreased from ∼ 130 to ∼ 100 CVs/year overthe lifetime of CRTS. In contrast, the number of super-novae increases year-on-year, corresponding to the increasein the sky area surveyed by CSS. Normalising the numberof CV identifications by the supernova identifications (bot-tom panel of Figure 5), shows a steep decline in the effectivediscovery rate of CVs. Although we expect this decline tocontinue, we do not expect it to decrease rapidly to zeroas the current rate suggests. In the next section we showthat CRTS contains a large fraction of low accretion ratesystems that will dominate CRTS CV discoveries in futureyears. Due to their long outburst intervals, their discoveryrate is expected to be low, even if they exist in the largenumbers suggested by population models. Therefore, we ex-pect the discovery rate to flatten off into a long ‘tail’, withmany more to be discovered.
6.2 Outburst frequencies
The outburst frequency is a key property of the CRTS sam-ple of CVs, as it determines the likelihood of discoveringa particular system. On a physical level, the outburst fre-quency depends mainly on the mass transfer rate from thedonor star and the size of the accretion disc (Shafter et al.1986; Shafter 1992), so it is important to consider the selec-tion effects this may have on the overall sample.
The sky coverage of CRTS is very inhomogeneous, with40 and 600 epochs at each location. The lightcurves in Fig-ures 1 and A1 clearly illustrate how this translates to verydifferent sampling patterns for different targets. The num-ber and frequency of observations vary considerably betweendifferent light curves.
Clearly, large gaps in the light curves will bias the sam-ple against CVs with less frequent outbursts. However, these
c© 2014 RAS, MNRAS 000, 1–23

14 E. Breedt et al.
low accretion rate CVs typically have larger outburst am-plitudes (e.g. Warner 1995, p.144), which means that theyexceed the 2 magnitude threshold by which CRTS CVs areselected, for longer. This makes them easier to find com-pared to those with more frequent, but smaller outburstamplitudes, and biases the sample in the opposite way. Infact, Thorstensen & Skinner (2012) find that there is a sig-nificant bias against dwarf novae with outburst amplitudes∆m < 6.
It is, in principle, possible to carry out simulations to es-timate the number of outbursts that may have been missedwhen they occurred between observations. However, suchsimulations include a large number of uncertain and vari-able parameters, such as the average outburst frequency,outburst duration, outburst amplitude, and the particularsampling pattern for the target under consideration. Wetherefore decided to characterise the sample using only theobserved outburst properties.
Although some outbursts of a given target may havebeen missed between observations, the number of outburstsobserved over the length of the CRTS project gives an in-dication of the current mass transfer rate in that binary.Figure 6 shows the number of outbursts observed in thelight curve of each of the 1043 CRTS CVs, as a function ofthe discovery date of the system13. Points in the ‘zero out-bursts’ bin are known polars, or systems which show polar-like high and low states in their light curves rather thandwarf nova outbursts. For clarity, each year of CRTS oper-ations is shown in a different colour and the points in eachbin are offset vertically by a small random amount to betterillustrate the density of systems. The histograms in the righthand panels represent the number of CVs in each outburstbin.
In all three surveys, the shape of the discovery out-burst distribution slopes down towards more recent discov-ery dates, i.e. systems displaying more outbursts in total intheir light curves were discovered earlier in the survey. Thisis unsurprising, since frequently outbursting dwarf novae willhave had many outbursts detected, even if gaps in the rel-atively sparse sampling of CRTS implies that some of theiroutbursts may have been missed. Similarly, the discovery ofa new CRTS CV implies that it had not been detected asa transient (i.e. in outburst) before, so a smaller number ofoutbursts are expected in more recently discovered systems.Note however, that ‘quiescent’ photometry of these recentlydiscovered targets are available from the Catalina Sky Sur-vey from before the start of CRTS — the discovery date issimply the date the target was first detected as a transient.
Figure 6 shows that CVs which have only had one ob-served outburst, span all six years of CRTS operations (i.e.all six different colours appear in the horizontal bar n = 1where n is the number of outbursts.) The histograms of allthree surveys are dominated by systems with just a singleoutburst observed by CRTS. This strongly suggests that the
13 We excluded outbursts which occurred before the CRTSstarted processing the Catalina images for transients. While theseearlier outbursts are useful to help constrain the average accre-
tion rate, they did not contribute to the discovery of the CV, soare not included in Fig. 6.
Figure 6. Number of outbursts detected in the light curves of
each of the 1043 CVs, split by the three surveys so that the dif-
ferent starting dates are evident. The scatter plots on the leftindicate the number of outbursts as a function of discovery date,
and the right hand panels show histograms of the number of CVs
for which that number of outbursts have been observed. We ap-plied a small vertical scatter to the outburst number in order
to illustrate the density of points in each bin more clearly. All
points within a pair of horizontal dashed lines have the numberof outbursts indicated by the integer number on the vertical axis.
Polars, which show high/low state transitions but no outbursts,are plotted as zero on the vertical scale.
c© 2014 RAS, MNRAS 000, 1–23

1000 CVs from CRTS 15
Figure 7. Cumulative distribution of CSS CVs with one (black),three (green), five (blue) and nine (red) outbursts observed by
CRTS. The number of CVs with a single observed outburst con-
tinues to increase at a steady rate. Dwarf novae with high accre-tion activity, and hence a large number of outbursts, were dis-
covered early in the survey (steep initial rise). Their distributionsalso flatten off early, suggesting that most dwarf novae with an
accretion rate high enough to produce one outburst per year have
already been found.
sample contains a large fraction of CVs with a long outburstrecurrence time, i.e. low accretion rate WZ Sge-type systems.
To illustrate this point further, we separate the CVsaccording to the number of outbursts in their light curvesand plot the number of systems in each group as a cumula-tive distribution against their discovery dates (Figure 7). Weonly show data from CSS here, in order to use the longestavailable light curves and to remove any biases that resultfrom the later starting dates of the MLS and SSS surveys.The cumulative distribution of systems with just one ob-served outburst increases at a steady rate, apart from theseasonal observing gaps visible as short horizontal stretchesin the distribution. CRTS is still discovering ∼ 150 new CVsper year (Figure 5), and this increase in single-outburst CVsis likely to continue for another few years before most dwarfnovae are found and the slope will flatten off. In contrast,CVs with a large number of outbursts, like the n = 9 caseshown in Figure 7, rise steeply in the early part of the survey,but also flattens off early. Due to their high levels of accre-tion activity, most of these systems have been discoveredand future observations will simply see more outbursts fromthe same systems, rather than finding many new CVs withsimilarly high accretion rates. The cumulative distributionsuggest that the majority of dwarf novae in the CRTS sur-vey area, with an accretion rate high enough to produce anaverage of one outburst per year, have already been found.Most future CRTS discoveries of dwarf novae will be systemswith a lower accretion rate.
Finally in this section, we compare the outburst prop-erties of the white dwarf dominated CVs with the rest ofthe sample. As discussed in Section 3.2, CVs which showthe absorption wings of the white dwarf in their spectra,must have a low accretion rate, since for higher accretionrates the bright accretion disc dominates the optical lumi-nosity so that the white dwarf is not visible in the spectrum.Given our interpretation of the number of outbursts as the
Figure 8. A comparison between the number of outbursts ob-served from CVs whose spectra reveal the white dwarf (black),
both the white dwarf and the donor star (red) and those where
the white dwarf is not seen in the spectrum (blue). A two-sidedKolmogorov-Smirnov test shows that the likelihood that the white
dwarf dominated sample was drawn from the same parent popula-
tion as the disc-dominated sample is only 0.19 per cent, while forthose showing both the white dwarf and the donor the likelihood
is much higher, 56 per cent.
average accretion rate, do the white dwarf dominated CVsalso show fewer outbursts? We visually inspected the spec-tra of all CRTS CVs for which we are aware that a spectrumis available, including the CVs known prior to the start ofCRTS. Out of a total 250 CRTS CVs with spectra, we found21 to be white dwarf dominated and an additional 14 to dis-play features from both the white dwarf and the donor star.For 21 CVs we know only of spectra taken during outburst,so these were disregarded. The cumulative distributions ofthe number of outbursts in the light curves of the threegroups of CVs are shown in Figure 8.
57 per cent of the white dwarf dominated CVs (12/21)show only a single outburst in their CRTS light curves, inagreement with our interpretation of white dwarf dominatedCVs as low accretion rate systems. The lightcurve of one ofthe white dwarf dominated CVs displays four outbursts anda further three have had three outbursts each, which im-plies a much higher accretion rate. It is possible that theseare low inclination systems, in which the disc is seen almostface-on and the white dwarf is not obscured. There are nowhite dwarf dominated CVs which have had more than fourobserved outbursts over the duration of the CRTS observa-tions.
The outburst distributions of the other two samplesare very different. Only 20 per cent have only one observedoutburst, while 40 per cent of each sample have had morethan four outbursts. The distribution of CVs in which bothcomponent stars are visible in the optical spectrum is sta-tistically indistinguishable from the disc-dominated popu-lation in terms of their outburst behaviour. A two-sidedKolmogorov-Smirnov test reveals that the likelihood of thetwo samples originating from the same parent populationis 56 per cent. The white dwarf dominated sample is sig-nificantly different. The probability that it is drawn fromthe same population as the disc-dominated systems is only0.18 per cent. This supports the interpretation that the CVs
c© 2014 RAS, MNRAS 000, 1–23
16 E. Breedt et al.
which display the white dwarf in their optical spectra are alow accretion rate, intrinsically faint population which dis-play infrequent outbursts (Wils et al. 2010). In addition,Woudt et al. (2012) found that the CVs with just a singleoutburst tend to have short orbital periods, giving furthersupport to the notion that this is an old, evolved popula-tion with little accretion activity and low mass donor stars(Gansicke et al. 2009).
7 CRTS COMPLETENESS
The observing cadence and sky coverage of the CatalinaSky Survey are optimised for its primary science objective,i.e. detecting near-Earth objects. CRTS is an added-valueproject which uses the Catalina images to identify tran-sient events and making them publicly available for follow-up observations (Section 5). It is a very efficient ‘discoverymachine’, but the inhomogeneities in the survey (e.g. skycoverage pattern, different depths of the three contributingsurveys) make it very difficult to reliably determine spacedensities of the transient populations. CRTS is responsiblefor most of the currently-known CVs with g > 20 (see sec-tion 7.4 below), so beyond this magnitude, even a complete-ness estimate is a difficult pursuit. However, given the largenumber of new, faint CVs found by CRTS, and to aid in theplanning of future transient surveys, it is still a worthwhileeffort to investigate in detail the types of CVs discovered byCRTS compared to other surveys, and to identify any biasesthat may exist.
In order to compare homogeneous, representative sam-ples from existing catalogues of CVs, we select only the CVsthat fall within a well-defined area of sky — chosen to bethe 7646 square degree footprint of the SDSS Legacy survey,as described below (Section 7.1). Throughout Section 7, weconsider only CVs from CRTS, SDSS and the Ritter-Kolbcatalogue (Section 7.3) that fall within this footprint. First,we briefly describe the properties of each CV subsample,then discuss the CRTS completeness in Section 7.4.
7.1 The SDSS Legacy Survey
The Sloan Digital Sky Survey (SDSS; York et al. 2000) is alarge multicolour imaging and spectroscopic survey, carriedout using a dedicated 2.5 m telescope at Apache Point Ob-servatory (APO) in New Mexico, USA. The imaging surveywas completed and released in 2011 as Data Release 8 (DR8;Aihara et al. 2011). It included ugriz photometry of morethan 900 million objects, covering 14 555 square degrees ofsky.
A set of complex criteria govern the spectroscopic targetselection process. The spectroscopic survey is carried out asa number of specific, targeted programmes, each with its ownphotometric colour selection algorithms and exclusion boxesin colour space. Currently in the third phase of the survey(SDSS-III), the focus is on measuring the cosmic distancescale with the Baryonic Oscillations Spectroscopic Survey(BOSS), but previous phases included e.g. the Sloan Super-nova Survey, the Sloan Extension for Galactic Understand-ing and Exploration (SEGUE) and the Multi-object APORadial Velocity Exoplanet Large-area Survey (MARVELS).
The main survey from SDSS-I is known as the Legacy
Survey. It employed a well-defined, uniform targeting strat-egy with the aim to produce complete, magnitude-limitedsamples of galaxies, luminous red galaxies and quasars(Strauss et al. 2002; Eisenstein et al. 2001; Richards et al.2002, respectively). The survey covered 7646 square degreesof the North Galactic Cap, and later also three stripes (740square degrees in total) in the South Galactic Cap. Datarelease 7 (DR7) provided the complete data release for theLegacy survey (Abazajian et al. 2009).
The equatorial stripe in the South Galactic Cap isknown as Stripe 82. It was observed repeatedly throughoutSDSS-I and SDSS-II, in order to identify variable objectsand, through co-addition of the images, provide photom-etry up to 2 magnitudes deeper than the North GalacticCap region. Similarly, the spectroscopy taken in this part ofthe sky did not follow the standard selection criteria, butinstead were used for various tests, such as new selectioncriteria, or completeness estimates of the small, deep sam-ples (e.g. Vanden Berk et al. 2005). The data from Stripe82 therefore does not have the same statistical properties asthe rest of the Legacy sample, so great care should be takenwhen constructing statistically representative samples fromthe Legacy data. For this reason, in the rest of this paper,we will refer to the Legacy footprint as only the originalcontiguous survey ellipse of the Northern Galactic Cap asdefined in York et al. (2000). The region is indicated as agrey shaded area in Figure 9. Of the 1043 CVs identifiedby CRTS, 221 (21 per cent) fall within the SDSS Legacyfootprint.
7.2 The SDSS CV sample
Cataclysmic Variables overlap with quasars in colour space,so some of the targets which were selected for spectroscopyin the Quasar Survey turned out to be CVs. Szkody et al.(2002, 2003, 2004, 2005, 2006, 2007, 2009, 2011) produceda catalogue of 285 CVs identified in this way. The QuasarSurvey is estimated to be 95 per cent complete down toi < 19.1 (Vanden Berk et al. 2005; Richards et al. 2006).The same selection criteria applies to the CV spectra, so itis expected that the completeness of the SDSS CV sampleis similar. It is considered the most homogeneously selected,deepest sample of CVs, and as a result, it was the first inwhich the long-predicted period minimum spike was seen.Gansicke et al. (2009) also showed that the composition ofthe CV population changes towards fainter apparent magni-tudes. An increasing fraction of faint CVs have white dwarfdominated optical spectra, suggesting that the majority ofthe faint CVs are intrinsically faint (due to their low ac-cretion rates), rather than simply because they are moredistant. Since CRTS can detect CVs that are several mag-nitudes fainter than the spectroscopic limit of SDSS it isof particular interest to compare the CRTS CVs to thosediscovered by SDSS.
As was already pointed out by Thorstensen & Skin-ner (2012), not all 285 targets in the Szkody et al. (2011)catalogue are in fact CVs. Thorstensen & Skinner (2012)label 14 systems as non-CVs, and we additionally excludeSDSSJ061542.52+642647.6 and SDSSJ202520.13+762222.3which are poorly studied systems and unconfirmed as CVs.Their spectra resemble K-type stars with weak Hα emis-sion, but no other Balmer emission lines. Both stars were
c© 2014 RAS, MNRAS 000, 1–23

1000 CVs from CRTS 17
targeted as part of SEGUE, and their photometric coloursmake them more likely to be giant stars with chromosphericactivity rather than CVs. This leaves 269 CVs in the sam-ple, 228 of which fall within the Legacy footprint. Howevernine of these spectra were not obtained as part of the Legacyprogram, but were selected using the target algorithms forSEGUE and MARVELS. We exclude these as well, leaving219 SDSS Legacy CVs in the sample. The SDSS CV sampleis shown along with the CRTS CVs in Figure 9, relative tothe sky footprint of the Legacy survey.
Only 52 of the 219 SDSS Legacy CVs (23.7 per cent)were re-identified by CRTS as a result of their optical vari-ability. We downloaded the CSDR2 light curves (see Sec-tion 5) of all the SDSS Legacy CVs and visually inspectedthem to understand the reasons they were not detected asCVs by CRTS. The results are summarised in Table 6. Asexpected, most of the SDSS CVs missing from CRTS aresystems which show very little photometric variability, orvariability with an amplitude less than 2 magnitudes. Someof the CVs which show ‘little variability’ will be high ac-cretion rate ‘novalike’ systems, which have hot, stable discswhich never undergo outbursts. Others, in this same cate-gory, are likely to be dwarf novae, but no outbursts have sofar been observed by CRTS. Future CRTS observations maystill recover some of these dwarf novae. The 2 magnitude (or3σ) threshold used to select transients (see below) excludesCVs which display photometric variability smaller this limit,but this cut is necessary to avoid including too many largeamplitude variable stars in the sample of transients. Thiscut seems to affect the polars in particular, since the statetransitions increase the observed scatter in the light curveand are also typically ∆m . 2 mag.
CRTS covers almost all of the Legacy footprint, butthere are some small gaps in RA at northern declinations,δ & 55◦. Two SDSS CVs (0.9 per cent) fall outside the CRTScoverage area for this reason. Only three of the SDSS CVs(1.4 per cent) have sparsely observed light curves, which sug-gests that coverage is not the main cause of missing knownCVs.
The pipeline photometry from each night is comparedboth to past CRTS observations (using a minimum of 40images, median stacked), as well as to photometric cata-logues such as the USNO14 or SDSS catalogues. In orderto be flagged as a transient, a target has to be more than2 mag brighter than the catalogue magnitude, or brighterthan three times the scatter in the historical light curve ofthe target, with a minimum brightening of 0.65 mag (Drakeet al. 2014). It is not possible to flag targets which aremeasured to be much fainter than their comparison mag-nitudes, because poor weather conditions and chip defectswould cause too many spurious detections. Therefore, if aCV is in outburst or in a high state in the comparison cat-alogue, it is unlikely to ever meet the criteria to be flaggedas a transient. This accounts for a significant fraction of theSDSS CVs which were not re-identified by CRTS. CRTSmaintains a CV Watchlist15, where known CVs which are in
14 United States Naval Observatory. Photometric catalogue
available from http://tdc-www.harvard.edu/catalogs/ub1.html
(USNO-B1.0)15 http://nesssi.cacr.caltech.edu/catalina/CVservice/CVtable.html
outburst in comparison catalogues are monitored. 33 SDSSCVs (15.1 per cent) appear on the Watchlist. It is unclearhow many CVs may be undiscovered as a result of an out-burst magnitude in the comparison catalogue, but it exposesa bias against systems with very high accretion rates and fre-quent outbursts, and polars with extended high/low states,as they are more likely to be bright in the comparison cat-alogues.
A further three SDSS CVs (1.4 per cent) have beendetected, but their classification as CVs were not certainenough to be added to the CV list. Transients like these,which are detected in a high/outburst state, but are notdetected in the median stacked image, are added to the Or-phancat database and may need additional observations tosecure their classifications. All three of the SDSS CVs whichappear only in Orphancat have g > 20 in quiescence.
In summary, 23.7 per cent of SDSS Legacy CVs arerecovered by CRTS. Those that were not identified can beexplained within the CRTS photometric limits and selectioncriteria.
7.3 The Ritter-Kolb catalogue
We carried out a similar analysis on the Ritter-Kolb cata-logue of CVs (RKCat, Ritter & Kolb 2003)16. This cataloguecontains all CVs that are studied well enough that at leasttheir orbital periods are known, and lists various propertiesof each CV. It is the only sample that covers low galacticlatitudes and the galactic plane. The latest edition, version7.20, contains 1094 entries, including several CVs which werediscovered by CRTS and SDSS. We first filter out these sys-tems from the catalogue so that it provides an independentsample of 862 CVs, and then select those which lie withinthe Legacy footprint to compare to the CRTS and SDSSLegacy samples. For simplicity, we will use the term ‘Ritter-Kolb CVs’ in this paper to refer only to those CVs whichwere discovered by methods or surveys other than CRTS orSDSS.
Figure 9 shows the sky distribution of the 862 Ritter-Kolb CVs along with the full CRTS sample. 129 Ritter-KolbCVs fall within the Legacy footprint, of which 30 systems(23.3 per cent), known prior to the start to CRTS, wererecovered.
As for the SDSS sample, the greatest reason for not re-covering more Ritter-Kolb CVs, is a lack of large amplitudephotometric variability (Table 6). 55 targets in the sample(41 per cent) display variability of less than 2 mag, or vari-ability that does not meet the transient selection criteria.Outburst magnitudes in comparison catalogues account for26 of the missing systems (20.2 per cent), all of which are in-cluded in the Watchlist. Additionally, the Ritter-Kolb CVssuffer from saturation problems in CRTS. They are typicallybrighter in quiescence than the SDSS and CRTS CVs (seeFigure 10) so when observed in outburst, they will saturate(V ∼ 12) and will be rejected by the transient pipeline. Infact, CSDR2 cautions about the reliability of photometryV < 13, because of the nonlinearity of the detector responseat these magnitudes. We found nine such CVs in the sample(7.0 per cent). Six CVs (4.7 per cent) are rejected because
16 http://www.mpa-garching.mpg.de/RKcat/
c© 2014 RAS, MNRAS 000, 1–23

18 E. Breedt et al.
Table 6. CRTS recovery of CVs from the SDSS and Ritter-Kolb catalogues.
SDSS RKCat
Total number of Legacy CVs: 219 129
Recovered by CRTS: 52 (23.7%) 30 (23.3%)
Not recovered:Little photometric variability 80 (36.5%) 29 (22.5%)
Variable, but not transient, or var< 2mag 42 (19.2%) 24 (18.4%)
Bright in comparison catalogue 33 (15.1%) 26 (20.2%)Saturates in outburst 0 (0%) 9 (7.0%)
Unreliable photometry/blending 4 (1.8%) 6 (4.7%)
Orphancat: too faint in quiescence 3 (1.4%) 1 (0.8%)Poor coverage 3 (1.4%) 3 (2.3%)
Area not covered by CRTS 2 (0.9%) 0 (0%)
Should be detected – outbursts 0 (0%) 1 (0.8%)
Figure 10. SDSS-g band magnitude distribution of the SDSS
(red), Ritter-Kolb (blue) and CRTS (grey) samples of CVs in theLegacy footprint. CRTS contributes most of the CVs fainter than
g = 20 to the known population.
of blending or unreliable photometry. Two of these reside inclusters (M5-V101 in the globular cluster M5 – Hourihaneet al. 2011, and the polar EU Cnc inside the open clusterM67 – Williams et al. 2013) making it difficult to reliablyidentify the transient object in the low resolution CRTS im-ages. CRTS now excludes a small region around every knownglobular cluster to reduce spurious detections as a result ofcrowding. Three CVs have a nearby bright (V < 14) starwhich affects the photometry, and one other is blended witha fainter nearby star.
In total, 23.3 per cent of the Ritter-Kolb Legacy sampleis recovered by CRTS. We found only one CV which shouldhave been detected but was missed for unknown reasons.This CV, SDSS J075107.50+300628.4, was previously iden-tified as a dwarf nova by Wils et al. (2010), and its CRTSlight curve displays multiple bright outbursts. It is not aWatchlist CV.
7.4 Completeness of the CRTS CV sample
As discussed in the previous two sections, CRTS recov-ered 23.6 per cent of the known SDSS+RKCat CVs in theLegacy footprint. Although this may seem low, it is im-portant to remember that since CRTS is sensitive only toCVs which display large amplitude variability, its overall
external completeness is not expected to be high. Table 6shows that between ∼ 40 − 56 per cent of CVs are hiddenfrom transient surveys due to their lack of large amplitude(> 2mag) photometric variability. The internal complete-ness of the survey appears to be high. We found only oneof the (219 + 129 =)348 known CVs in this part of the skywhich was not detected by CRTS and which could not beexplained by the transient selection criteria and photometriclimits of the survey (Table 6).
If we restrict the analysis only to dwarf novae in theLegacy samples, we find that 144/219 of the SDSS CVsare classified as dwarf novae, of which 47 (32.6 per cent)were recovered. The dwarf nova recovery fraction is similarin RKCat. 70/129 CVs are classified as dwarf novae, and26 (37.1 per cent) of these were recovered. Thorstensen &Skinner (2012) suggest that a bias towards large outburstamplitudes could account for the known CVs which werenot detected. However, we find that the light curves of mostof the ‘missing’ dwarf novae fall into the ‘Little variability’category, i.e. even though previous observations have shownthese systems to be dwarf novae, no outbursts have been ob-served by CRTS over the six years of the project. The out-burst frequency and observing cadence therefore also playa major role in the detection probability of a given dwarfnova. 23 of the ‘missing’ dwarf novae are included on theWatchlist.
Both Wils et al. (2010) and Thorstensen & Skinner(2012) have already noted that most of the new CVs discov-ered by CRTS are faint systems that could not be detectedin quiescence by SDSS or other previous surveys. This isillustrated again in Figure 10, which shows a direct compar-ison between the quiescent g band magnitude distributionsof the three Legacy samples of CVs. CVs collected in theRitter-Kolb catalogue dominate the bright end of the distri-bution, where SDSS and CRTS saturate. On the faint side,CRTS is responsible for most of the CVs with g > 20 and al-most all fainter than g > 22. With very little to compare thesample to, assessing the external completeness of CRTS atthese faint magnitudes directly from observations is not pos-sible. Instead, we investigate the sensitivity of the survey tofaint CVs, by dividing the sample into ‘new discoveries’ and‘previously known’ CVs (Figure 11). The g band distribu-tion of the combined SDSS+RKCat Legacy sample is shownas a red, dashed-line histogram, representing all CVs known
c© 2014 RAS, MNRAS 000, 1–23
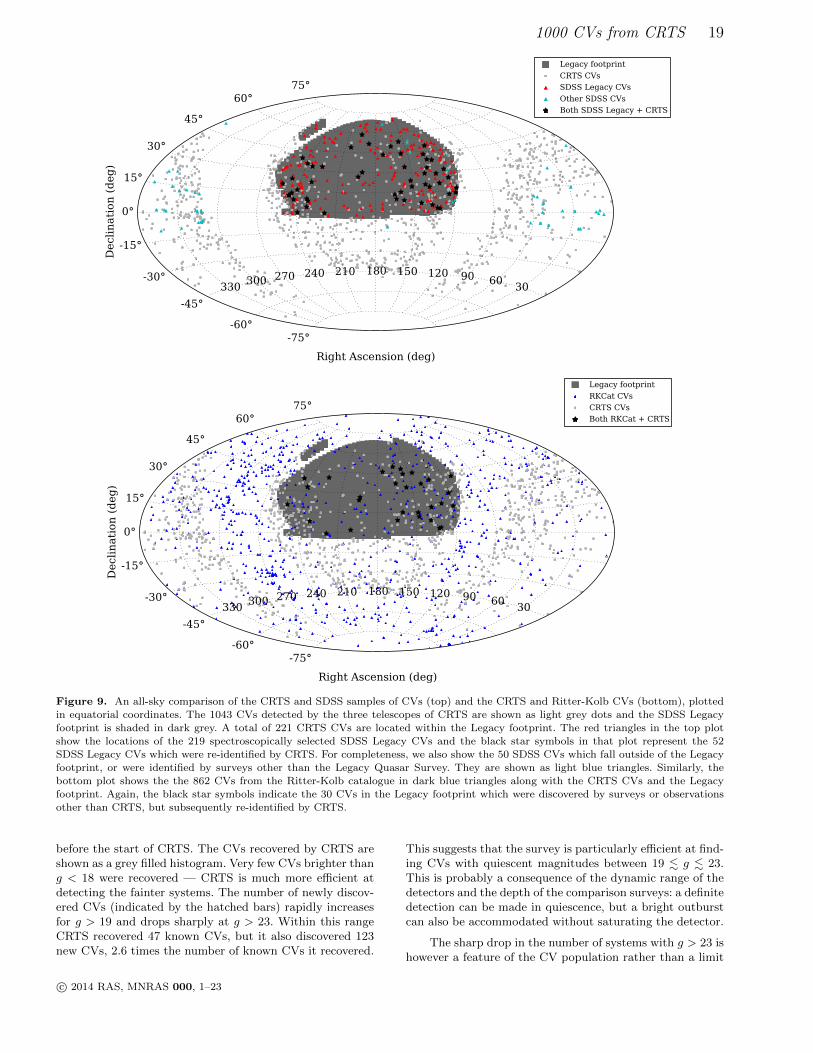
1000 CVs from CRTS 19
-75°-60°
-45°
-30°
-15°
0°
15°
30°
45°
60°75°
Decl
inati
on
(d
eg
)
330300 270 240 210 180 150 120 90 60
30
Right Ascension (deg)
Legacy footprint
CRTS CVs
SDSS Legacy CVs
Other SDSS CVs
Both SDSS Legacy + CRTS
-75°-60°
-45°
-30°
-15°
0°
15°
30°
45°
60°75°
Decl
inati
on
(d
eg
)
330300 270 240 210 180 150 120 90 60
30
Right Ascension (deg)
Legacy footprint
RKCat CVs
CRTS CVs
Both RKCat + CRTS
Figure 9. An all-sky comparison of the CRTS and SDSS samples of CVs (top) and the CRTS and Ritter-Kolb CVs (bottom), plottedin equatorial coordinates. The 1043 CVs detected by the three telescopes of CRTS are shown as light grey dots and the SDSS Legacyfootprint is shaded in dark grey. A total of 221 CRTS CVs are located within the Legacy footprint. The red triangles in the top plot
show the locations of the 219 spectroscopically selected SDSS Legacy CVs and the black star symbols in that plot represent the 52SDSS Legacy CVs which were re-identified by CRTS. For completeness, we also show the 50 SDSS CVs which fall outside of the Legacy
footprint, or were identified by surveys other than the Legacy Quasar Survey. They are shown as light blue triangles. Similarly, thebottom plot shows the the 862 CVs from the Ritter-Kolb catalogue in dark blue triangles along with the CRTS CVs and the Legacy
footprint. Again, the black star symbols indicate the 30 CVs in the Legacy footprint which were discovered by surveys or observationsother than CRTS, but subsequently re-identified by CRTS.
before the start of CRTS. The CVs recovered by CRTS areshown as a grey filled histogram. Very few CVs brighter thang < 18 were recovered — CRTS is much more efficient atdetecting the fainter systems. The number of newly discov-ered CVs (indicated by the hatched bars) rapidly increasesfor g > 19 and drops sharply at g > 23. Within this rangeCRTS recovered 47 known CVs, but it also discovered 123new CVs, 2.6 times the number of known CVs it recovered.
This suggests that the survey is particularly efficient at find-ing CVs with quiescent magnitudes between 19 . g . 23.This is probably a consequence of the dynamic range of thedetectors and the depth of the comparison surveys: a definitedetection can be made in quiescence, but a bright outburstcan also be accommodated without saturating the detector.
The sharp drop in the number of systems with g > 23 ishowever a feature of the CV population rather than a limit
c© 2014 RAS, MNRAS 000, 1–23

20 E. Breedt et al.
Figure 11. g band magnitude distribution of the recov-
ered, previously known CVs (grey) and newly discovered CVs
(black hatched) in CRTS. The sample of previously known CVs(SDSS+RKCat) is shown for comparison (red dash). Note the
large number of new CVs in the range 19 < g < 23.
to the survey sensitivity. SDSS photometry is available forthe whole of the Legacy footprint, complete to a depth of22.2 in the g band (Abazajian et al. 2004). Slightly deeperphotometry is available in areas observed under good seeingand low sky brightness conditions. If a substantial part ofthe CV population had apparent magnitudes fainter thang > 23, we would expect to find many transients with nocounterpart in the SDSS photometric catalogue. However,of all the transients in the Legacy footprint, we found onlyone which does not have a corresponding SDSS object. Thismust mean that g ∼ 23 represents a distance limit intrinsicto the CV population, rather than simply the limiting mag-nitude of the SDSS photometry or the photometric limit setby the fixed exposure time of the surveys used by CRTS.Assuming Mg = 11.6 as the average absolute magnitudeof low-luminosity CVs (Gansicke et al. 2009), g = 23 cor-responds to a distance of d = 1905 pc. Even consideringthe range of Galactic latitudes covered by the Legacy foot-print, this suggests that the CV population is distributedwell beyond the Galactic thin disc. A more detailed analysisof the scale height of the CRTS CV population is presentedby Drake et al. (2014), who also conclude that many of theCRTS CVs belong to the Galactic thick disc.
7.5 Spectroscopic completeness and the whitedwarf dominated CVs
One of the key features of the SDSS CV sample was a largenumber of systems with white dwarf dominated spectra andshort orbital periods, Porb . 100 min (Gansicke et al. 2009).All of these CVs are fainter than g = 17.4 and display nofeatures from the secondary star in their spectra, so these arelikely to be evolved, low accretion rate, WZ Sge-type dwarfnovae. We now look for similar CVs in the CRTS sample.The bottom panel of Figure 12 illustrates the spectroscopicfollow-up of the CRTS CVs within the Legacy footprint.The spectroscopic identification is essentially complete upto g 6 19, largely thanks to the SDSS spectroscopic survey.Other spectroscopic follow-up observations, including thosepresented in Section 2, have so far provided spectra for 45per cent of CRTS Legacy CVs fainter than g > 20. The
Figure 12. g band magnitude distribution of the SDSS (top)and CRTS (bottom) CVs in the Legacy footprint. Spectra are
available for all the SDSS CVs. Those which are white dwarfdominated are indicated by the filled red bars. The full CRTS
Legacy sample is shown as a dashed grey histogram, and those
for which spectra are available as filled grey bars. The white dwarfdominated CRTS CVs are shown in black.
CVs with spectra showing the wide absorption wings char-acteristic of a white dwarf are shown as black solid bars.As in the case of the SDSS, these WZ Sge candidates area small fraction of the total number of spectra available(33/219 = 15.1 per cent for SDSS, 16/130 = 12.3 per centfor CRTS).
Four of the 33 SDSS white dwarf dominated CVs shownin Figure 12 were recovered by CRTS (12.1 per cent). Such asmall recovery fraction is consistent with the interpretationthat they are low accretion rate systems with long outburstrecurrence times. The CRTS light curves of the four sys-tems which were recovered also only display a small num-ber of outbursts. They are SDSS J133941.12+484727.4 (=V355 UMa, 1 outburst), SDSS J161027.61+090738.4 (1 out-burst), SDSS J155644.23-000950.2 (= V493 Ser, 2 outbursts)and SDSS J122740.82+513924.9 (3 outbursts). The four CVsfall one each in the four magnitude bins from g = 17 − 21.The 12 new contributions from CRTS display similarly fewoutbursts: two with three outbursts, three with two out-bursts and seven with a single outburst.
Three outbursts in six years, as observed in some ofthese white dwarf dominated CVs, imply a much higher ac-cretion rate than in WZ Sge itself, for which the outburstrecurrence time is 2–3 decades. CRTS is only starting touncover the low accretion rate population, many more lowaccretion rate CVs remain to be discovered (Figure 7). Incontrast to the SDSS sample, which showed that an increas-ing fraction of CVs towards fainter magnitudes are whitedwarf dominated (Gansicke et al. 2009), we find that thewhite dwarf dominated spectra represent a constant frac-tion (∼14 per cent) of the spectra in each magnitude bing > 19. We recognise however that our spectroscopic follow-up is subject to a bias, since proportionally fewer low accre-
c© 2014 RAS, MNRAS 000, 1–23

1000 CVs from CRTS 21
tion rate objects were discovered early in the survey whenour spectroscopic observations were carried out. The 6 yearlength of the CRTS project is still short compared to thelong outburst recurrence times of WZ Sge dwarf novae. Forexample, 25/33 (75.8 per cent) of the SDSS Legacy CVswhich are white dwarf dominated show only small amplitudevariability in their CRTS light curves and have no observedoutbursts17.
CV population models predict that ∼ 50− 77 per centof all CVs should have evolved beyond the period min-imum (e.g Kolb 1993; Howell 2001; Knigge et al. 2011),and WZ Sge-type dwarf novae are often considered the bestcandidates for this evolved population. However, even atthe faint magnitudes probed by CRTS, observations can-not (yet) account for the large number of systems expectedfrom theoretical models.
8 SUMMARY
We presented identification spectra of 85 transient objectsidentified as cataclysmic variable candidates by the CatalinaReal-time Transient Survey. 72 of the spectra are fromour own follow-up program on the Gemini Telescopes andGranTeCan, seven are from the Sloan Digital Sky SurveyBaryonic Oscillations Spectroscopic Survey (plus one addi-tional spectrum of a target also observed by us on GeminiNorth) and a further six are from the Public ESO Spectro-scopic Survey for Transient Objects. Our sample includesthree AM CVn binaries, at least one helium-enriched CV,one polar and 80 dwarf novae.
25 of the spectra display clear absorption features of thewhite dwarf in the Balmer lines, indicative of a low accretionrate. We found five CVs for which both the white dwarf andthe donor star are visible in the spectrum, all with orbitalperiods at the lower edge of the period gap. The spectrum ofCRTS J163805.4+083758 (=V544 Her), shows evidence for aK-type star donor, but an (uncertain) period of only 100 minis reported for this system (Howell et al. 1990). Further ob-servations are required to confirm this period, since a normalK star would be too large to fit in a 100 min binary. If theshort period is confirmed, the donor star in this system musthave been stripped of its outer layers during a rapid masstransfer phase earlier in its evolution (see e.g. Thorstensen2013).
The spectra of 18 of our targets display double-peaked emission lines. Three of these are known eclips-ing CVs and we also identified a new eclipsing system,CRTS J132536.0+210037, from its SDSS photometry. Wewere unable to determine the orbital period from its CRTSlight curve, but the white dwarf features in its spectrumsuggests that the period is < 90 minutes.
Using the CRTS light curves, we analysed the outburstproperties of the full sample of 1043 CVs identified by CRTSduring its first six years of operation. We showed that therate at which new CVs are discovered by CRTS is slowingdown. This is at least partially due to the fact that mostof the high accretion rate systems were found early in the
17 33 of the SDSS Legacy CVs are white dwarf dominated. 4 arerecovered by CRTS, 2 are Watchlist targets, 2 have poor CRTScoverage and 25 show only small amplitude variability.
survey and that the lower accretion rate systems discoverednow have a lower detection rate due to their longer outburstrecurrence times. Low accretion rate CVs are expected todominate future CRTS discoveries of dwarf novae, so thedetection rate is expected to slowly decrease even further.
CVs with white dwarf dominated spectra have signifi-cantly fewer outbursts in their CRTS light curves than discdominated systems. We do however find some white dwarfdominated CVs that have as many as 3 or 4 outburst dur-ing the six years of CRTS monitoring, which imply a muchhigher accretion rate than expected for WZ Sge systems. Wefound no significant difference between the outburst proper-ties of disc dominated CVs and CVs at the lower edge of theperiod gap for which both the white dwarf and the donorstar are visible in the spectrum.
In order to estimate the completeness of the CRTS sam-ple, we compared the CRTS CVs with known CVs from theSDSS CV and the Ritter-Kolb (RKCat) catalogues. In orderto make a robust, unbiased comparison between the differ-ent samples, we selected only those CVs which fall withinthe SDSS Legacy footprint. This selection resulted in sub-samples of 221/1043 CRTS CVs, 219/269 SDSS CVs and129/862 RKCat CVs. CRTS recovered 23.6 per cent of theSDSS+RKCat CVs. As expected, the main reason for CVsto be ‘missed’ by CRTS (and by implication, other transientsurveys as well) is the lack of large amplitude (> 2mag) pho-tometric variability. Dwarf novae with frequent outbursts orpolars which undergo frequent transitions between high andlow states are also more likely to be overlooked, because ofthe higher likelihood of being in outburst/high state in thecomparison catalogues. The internal completeness of CRTSis however high. We found only one out of the 348 knownCVs in the Legacy footprint that was not detected and couldnot be explained by the transient selection criteria and/orphotometric limits of the survey.
CRTS is responsible for most of the known CVs fainterthan g > 20. There is a sharp drop in the number of systemsfor g > 23, but we find only one CRTS CV in the Legacyfootprint which does not have an SDSS photometric coun-terpart. This suggests that this limit is intrinsic to the CVpopulation (i.e. a distance limit) and not simply a detectionlimit of the photometric survey.
At present, spectra are available for 130/221 CRTS CVsin the Legacy footprint and they represent a constant frac-tion of the spectra in each magnitude bin g > 19. Furtherspectroscopic identification of faint CRTS CVs should becarried out to determine whether the fraction of white dwarfdominated systems increase towards fainter magnitudes asobserved in the SDSS CV sample (Gansicke et al. 2009). Thegrowing number of single-outburst CVs in the CRTS sample(Figure 7) suggests that CRTS is only starting to uncoverthe low accretion rate population, so many more CVs remainto be discovered, and future spectroscopic samples may beincreasingly white dwarf dominated.
ACKNOWLEDGMENTS
We thank the referee, Steve Howell, for a helpful and pos-itive report that improved the clarity of our presentation.We also thank Gayathri Eknath who helped to compile the
c© 2014 RAS, MNRAS 000, 1–23

22 E. Breedt et al.
outburst data used in Figure 6 during a summer project atthe University of Warwick.
EB and TRM are supported by a grant from the UKSTFC, number ST/L000733/1. BTG is supported by the Eu-ropean Research Council under the European Union’s Sev-enth Framework Programme (FP/2007-2013) / ERC GrantAgreement n. 320964 (WDTracer). PRG is supported by aRamon y Cajal fellowship (RYC–2010–05762), and acknowl-edges support provided by the Spanish grant AYA2012–38700. SGP and MRS acknowledge nancial support fromFONDECYT in the form of grants number 3140585 and1141269 respectively. PS acknowledges support from theNSF through grant AST-1008734.
CRTS are supported by the U.S. National Science Foun-dation under grants AST-0909182 and CNS-0540369. Thework at Caltech was supported in part by the NASA Fermigrant 08-FERMI08-0025, and by the Ajax Foundation. TheCSS survey is funded by the National Aeronautics andSpace Administration under Grant No. NNG05GF22G is-sued through the Science Mission Directorate Near-EarthObjects Observations Program.
The spectra presented in this paper were obtained withthe Gemini Telescopes, under programs GN-2010B-Q-76,GS-2010B-Q-57, GN-2011A-Q-74, GS-2011A-Q-49 and GN-2013A-Q-89, and the Gran Telescopio Canarias (GTC), un-der program ID GTC30-11A. The Gemini Observatory is op-erated by the Association of Universities for Research in As-tronomy, Inc., under a cooperative agreement with the NSFon behalf of the Gemini partnership: the National ScienceFoundation (United States), the National Research Coun-cil (Canada), CONICYT (Chile), the Australian ResearchCouncil (Australia), Ministerio da Ciencia, Tecnologia e In-ovacao (Brazil) and Ministerio de Ciencia, Tecnologıa e In-novacion Productiva (Argentina). The Gran Telescopio Ca-narias (GTC) is operated at the Spanish Observatorio delRoque de los Muchachos of the Instituto de Astrofısica deCanarias, on the island of La Palma.
We gratefully acknowledge the use of the topcat soft-ware (Taylor 2005) in this research, the International Vari-able Star Index database (VSX) operated at AAVSO, Cam-bridge, Massachusetts, as well as the Sloan Digital Sky Sur-vey (SDSS), funded by the Alfred P. Sloan Foundation, theParticipating Institutions, the National Science Foundation,and the U.S. Department of Energy, Office of Science. Fur-ther information, including a list of participating institutionsmay be found on the SDSS web sites, http://www.sdss.org/(for SDSS-I and SDSS-II) and http://www.sdss3.org/ (forSDSS-III).
REFERENCES
Abazajian K. et al., 2004, AJ, 128, 502Abazajian K. N. et al., 2009, ApJS, 182, 543Ahn C. P. et al., 2014, ApJS, 211, 17Aihara H. et al., 2011, ApJS, 193, 29Augusteijn T., van Kerkwijk M. H., van Paradijs J., 1993,A&A, 267, L55
Bertin E., Arnouts S., 1996, A&AS, 117, 393Breedt E., Gansicke B. T., Marsh T. R., Steeghs D., DrakeA. J., Copperwheat C. M., 2012, MNRAS, 425, 2548
Carter P. J. et al., 2014, MNRAS, 439, 2848
Carter P. J. et al., 2013a, MNRAS, 429, 2143Carter P. J. et al., 2013b, MNRAS, 431, 372Coppejans D. L. et al., 2014, MNRAS, 437, 510Copperwheat C. M. et al., 2011, MNRAS, 410, 1113Drake A. J. et al., 2013, ApJ, 763, 32Drake A. J. et al., 2009, ApJ, 696, 870Drake A. J. et al., 2012, ATel, 4678, 1Drake A. J. et al., 2014, MNRAS, 441, 1186Eisenstein D. J. et al., 2001, AJ, 122, 2267Gansicke B. T. et al., 2009, MNRAS, 397, 2170Hachinger S. et al., 2013, ATel, 4940, 1Hourihane A. P., Callanan P. J., Cool A. M., ReynoldsM. T., 2011, MNRAS, 414, 184
Howell S. B., 2001, PASJ, 53, 675Howell S. B., Nelson L. A., Rappaport S., 2001, ApJ, 550,897
Howell S. B., Rappaport S., Politano M., 1997, MNRAS,287, 929
Howell S. B., Szkody P., Kreidl T. J., Mason K. O.,Puchnarewicz E. M., 1990, PASP, 102, 758
Ivezic Z. et al., 2008, ArXiv e-prints 0805.2366Kafka S., Honeycutt R. K., Williams R., 2012, MNRAS,425, 1585
Kato T. et al., 2013, PASJ, 65, 23Kato T. et al., 2014, PASJ, 66, 30Kato T. et al., 2009, PASJ, 61, 395Kato T. et al., 2012, PASJ, 64, 21Kato T. et al., 2010, PASJ, 62, 1525Knigge C., Baraffe I., Patterson J., 2011, ApJS, 194, 28Kolb U., 1993, A&A, 271, 149Kolb U., Baraffe I., 1999, MNRAS, 309, 1034Kupfer T., Groot P. J., Levitan D., Steeghs D., MarshT. R., Rutten R. G. M., Nelemans G., 2013, MNRAS,432, 2048
Law N. M. et al., 2009, PASP, 121, 1395Levitan D. et al., 2013, MNRAS, 430, 996Lipunov V. et al., 2010, Advances in Astronomy, 2010Littlefair S. P., Dhillon V. S., Marsh T. R., Gansicke B. T.,Southworth J., Baraffe I., Watson C. A., Copperwheat C.,2008, MNRAS, 388, 1582
Littlefield C. et al., 2013, AJ, 145, 145Manser C. J., Gansicke B. T., 2014, MNRAS, 442, L23Meyer F., Meyer-Hofmeister E., 1981, A&A, 104, L10Nelemans G., Yungelson L. R., Portegies Zwart S. F., 2004,MNRAS, 349, 181
Nelemans G., Yungelson L. R., van der Sluys M. V., ToutC. A., 2010, MNRAS, 401, 1347
Nogami D., Uemura M., Ishioka R., Kato T., Pietz J., 2004,PASJ, 56, 155
Osaki Y., 1989, PASJ, 41, 1005Parsons S. G. et al., 2013, MNRAS, 429, 256Patterson J. et al., 2005, PASP, 117, 1204Patterson J. et al., 2002, PASP, 114, 721Patterson J. et al., 2003, PASP, 115, 1308Perryman M. A. C. et al., 2001, A&A, 369, 339Podsiadlowski P., Han Z., Rappaport S., 2003, MNRAS,340, 1214
Pojmanski G., 1997, Acta Astron., 47, 467Polshaw J. et al., 2013, ATel, 4882, 1Pretorius M. L., Knigge C., Kolb U., 2007, MNRAS, 374,1495
Ramsay G. et al., 2014, MNRAS, 438, 789
c© 2014 RAS, MNRAS 000, 1–23

1000 CVs from CRTS 23
Rappaport S., Joss P. C., Webbink R. F., 1982, ApJ, 254,616
Rau A., Roelofs G. H. A., Groot P. J., Marsh T. R., Nele-mans G., Steeghs D., Salvato M., Kasliwal M. M., 2010,ApJ, 708, 456
Richards G. T. et al., 2002, AJ, 123, 2945
Richards G. T. et al., 2006, AJ, 131, 2766
Ritter H., Kolb U., 2003, A&A, 404, 301
Robertson J. W., Honeycutt R. K., Turner G. W., 1995,PASP, 107, 443
Roelofs G. H. A. et al., 2009, MNRAS, 394, 367
Savoury C. D. J. et al., 2011, MNRAS, 415, 2025
Shafter A. W., 1992, ApJ, 394, 268
Shafter A. W., Wheeler J. C., Cannizzo J. K., 1986, ApJ,305, 261
Solheim J.-E., 2010, PASP, 122, 1133
Strauss M. A. et al., 2002, AJ, 124, 1810
Szkody P., 1981, ApJ, 247, 577
Szkody P. et al., 2002, AJ, 123, 430
Szkody P. et al., 2011, AJ, 142, 181
Szkody P. et al., 2009, AJ, 137, 4011
Szkody P. et al., 2003, AJ, 126, 1499
Szkody P. et al., 2006, AJ, 131, 973
Szkody P. et al., 2004, AJ, 128, 1882
Szkody P. et al., 2005, AJ, 129, 2386
Szkody P. et al., 2007, AJ, 134, 185
Taam R. E., King A. R., Ritter H., 2000, ApJ, 541, 329
Taubenberger S. et al., 2013, ATel, 4952, 1
Taylor M. B., 2005, in Astronomical Society of the PacificConference Series, Vol. 347, Astronomical Data AnalysisSoftware and Systems XIV, Shopbell P., Britton M., EbertR., eds., p. 29
Thorstensen J. R., 2013, PASP, 125, 506
Thorstensen J. R., Fenton W. H., Patterson J. O., KempJ., Krajci T., Baraffe I., 2002, ApJL, 567, L49
Thorstensen J. R., Skinner J. N., 2012, AJ, 144, 81
Thorstensen J. R., Taylor C. J., 2001, MNRAS, 326, 1235
Toonen S., Voss R., Knigge C., 2014, MNRAS, 441, 354
van Haaften L. M., Nelemans G., Voss R., Toonen S., Porte-gies Zwart S. F., Yungelson L. R., van der Sluys M. V.,2013, A&A, 552, A69
Vanden Berk D. E. et al., 2005, AJ, 129, 2047
Warner B., 1995, Cambridge Astrophysics Series, 28
Williams K. A., Howell S. B., Liebert J., Smith P. S., BelliniA., Rubin K. H. R., Bolte M., 2013, AJ, 145, 129
Wils P., Gansicke B. T., Drake A. J., Southworth J., 2010,MNRAS, 402, 436
Woudt P. A., Warner B., 2011, ATel, 3705, 1
Woudt P. A., Warner B., de Bude D., Macfarlane S.,Schurch M. P. E., Zietsman E., 2012, MNRAS, 421, 2414
Woudt P. A., Warner B., Motsoaledi M., 2013, ATel, 4726,1
Wyrzykowski L. et al., 2013, ATel, 4892, 1
Yaron O., Gal-Yam A., 2012, PASP, 124, 668
York D. G. et al., 2000, AJ, 120, 1579
Zorotovic M., Schreiber M. R., Gansicke B. T., 2011, A&A,536, A42
This paper has been typeset from a TEX/ LATEX file preparedby the author.
APPENDIX A: SPECTRA AND LIGHTCURVES OF CRTS CVS
In the figures that follow, we show the spectra of all 72 CRTSCVs we observed with Gemini and/or GTC, along with theirCRTS lightcurves. Details of the observations are given inTable 1 in the Online Materials. The light grey vertical linesin the left hand panels indicate the rest wavelengths of thehydrogen Balmer lines (solid lines), the helium I and II lines(dashed lines) and the calcium triplet (dotted lines). Thered dots are the quiescent griz photometric measurementstaken from SDSS DR7 and DR9. Where the SDSS photom-etry is not shown, the target was in outburst during ourspectroscopic observations, or considerably fainter than thefaintest SDSS photometry available. An asterisk followingthe target name indicates that the spectrum suffered blueflux loss due to differential atmospheric dispersion (see Sec-tion 2.1). The CRTS light curve of each target is shown inthe right hand panel. For the nights when the target was ob-served but not detected, we plot upper limits (grey arrows),derived from nearby stars. The black horizontal dotted lineis the g band magnitude from SDSS. The figure captionsgive more information on specific targets where neccessary.
c© 2014 RAS, MNRAS 000, 1–23

24 E. Breedt et al.
Figure A1. Spectra and light curves of CRTS CVs. The SDSS photometry of CRTS J035003.4+370052 was taken during outburst.During our Gemini observation the target was much fainter, g = 22.9.
c© 2014 RAS, MNRAS 000, 1–23

1000 CVs from CRTS 25
Figure A1. continued. Spectra and light curves of CRTS CVs.
c© 2014 RAS, MNRAS 000, 1–23

26 E. Breedt et al.
Figure A1. continued. Spectra and light curves of CRTS CVs. CRTS J081414.9+080450 was in outburst during our observations,so the SDSS photometry is not shown with the spectrum. The spectra of CRTS J081414.9+080450, CRTS J081936.1+191540 and
CRTS J082123.7+454135 are affected by blue flux loss due to atmospheric dispersion (see Section 2.1).
c© 2014 RAS, MNRAS 000, 1–23

1000 CVs from CRTS 27
Figure A1. continued. Spectra and light curves of CRTS CVs.
c© 2014 RAS, MNRAS 000, 1–23

28 E. Breedt et al.
Figure A1. continued. Spectra and light curves of CRTS CVs.
c© 2014 RAS, MNRAS 000, 1–23
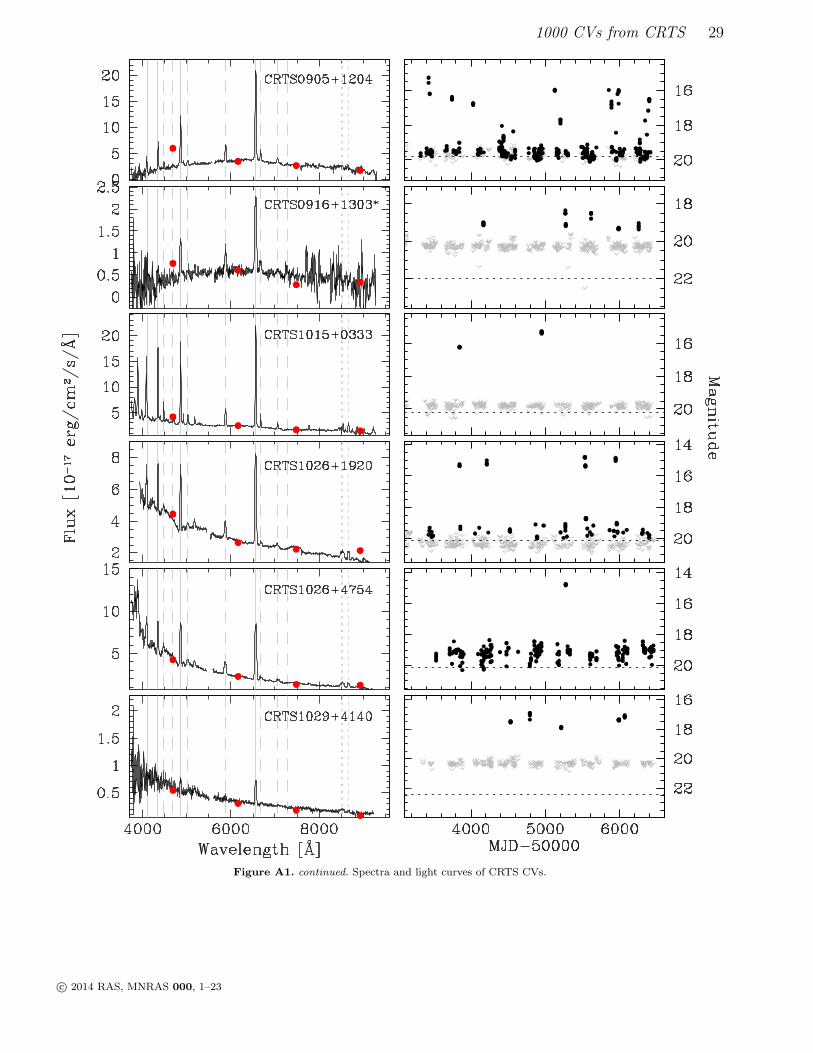
1000 CVs from CRTS 29
Figure A1. continued. Spectra and light curves of CRTS CVs.
c© 2014 RAS, MNRAS 000, 1–23
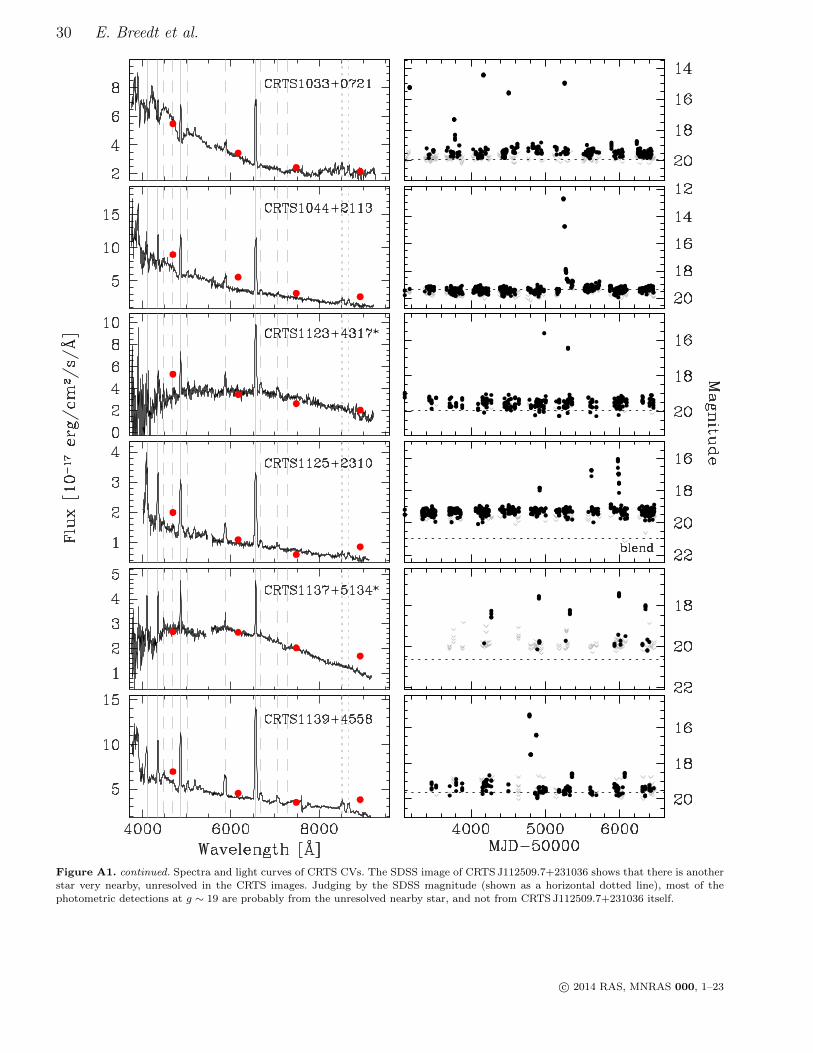
30 E. Breedt et al.
Figure A1. continued. Spectra and light curves of CRTS CVs. The SDSS image of CRTS J112509.7+231036 shows that there is anotherstar very nearby, unresolved in the CRTS images. Judging by the SDSS magnitude (shown as a horizontal dotted line), most of the
photometric detections at g ∼ 19 are probably from the unresolved nearby star, and not from CRTS J112509.7+231036 itself.
c© 2014 RAS, MNRAS 000, 1–23

1000 CVs from CRTS 31
Figure A1. continued. Spectra and light curves of CRTS CVs. CRTS J132536.0+210037 is an eclipsing CV. The g band measurementwas taken while the system was in eclipse, so is much fainter than the riz magnitudes and does not appear on the spectrum plot. From
the light curve, it is clear that the quiescent brightness is ∼ 19.5 mag.
c© 2014 RAS, MNRAS 000, 1–23

32 E. Breedt et al.
Figure A1. continued. Spectra and light curves of CRTS CVs. The SDSS images of CRTS J144011.0+494734 andCRTS J145921.8+354806 show that both targets have another star nearby, unresolved in the CRTS images. It is likely that some of
the photometric detections at g ∼ 20 are from the nearby stars rather than from the CVs. The SDSS magnitudes shown refer to the CVonly. The stars are resolved in SDSS.
c© 2014 RAS, MNRAS 000, 1–23
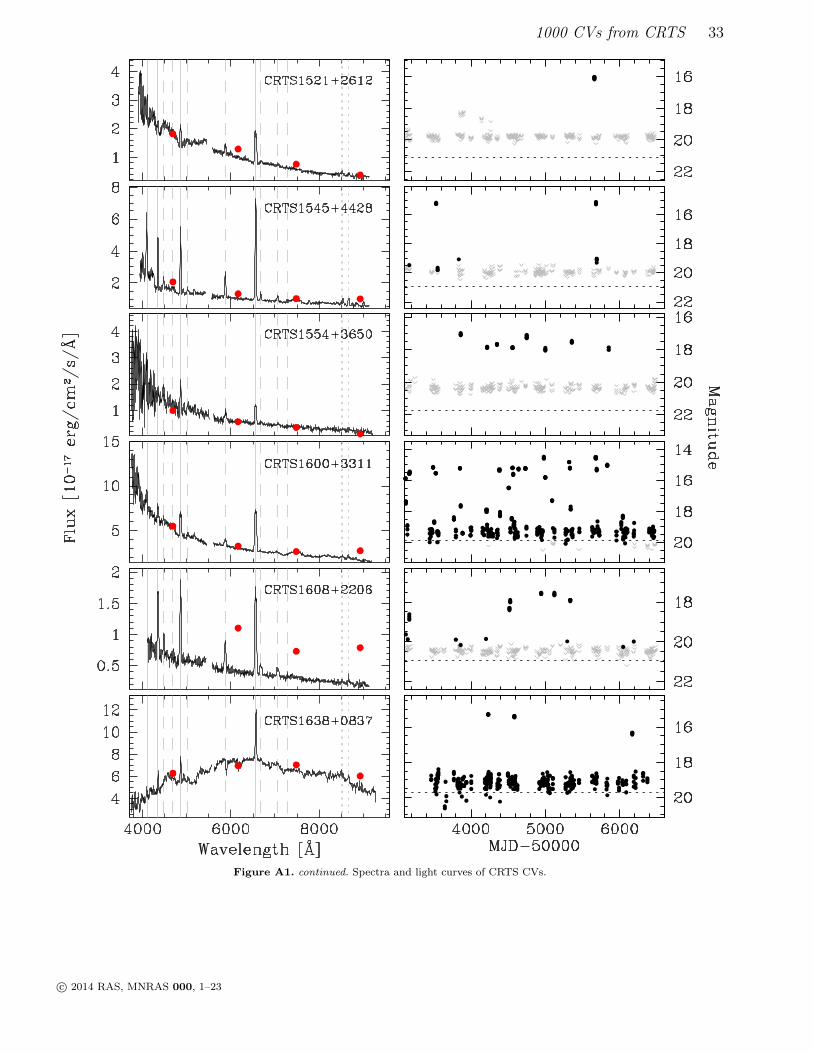
1000 CVs from CRTS 33
Figure A1. continued. Spectra and light curves of CRTS CVs.
c© 2014 RAS, MNRAS 000, 1–23
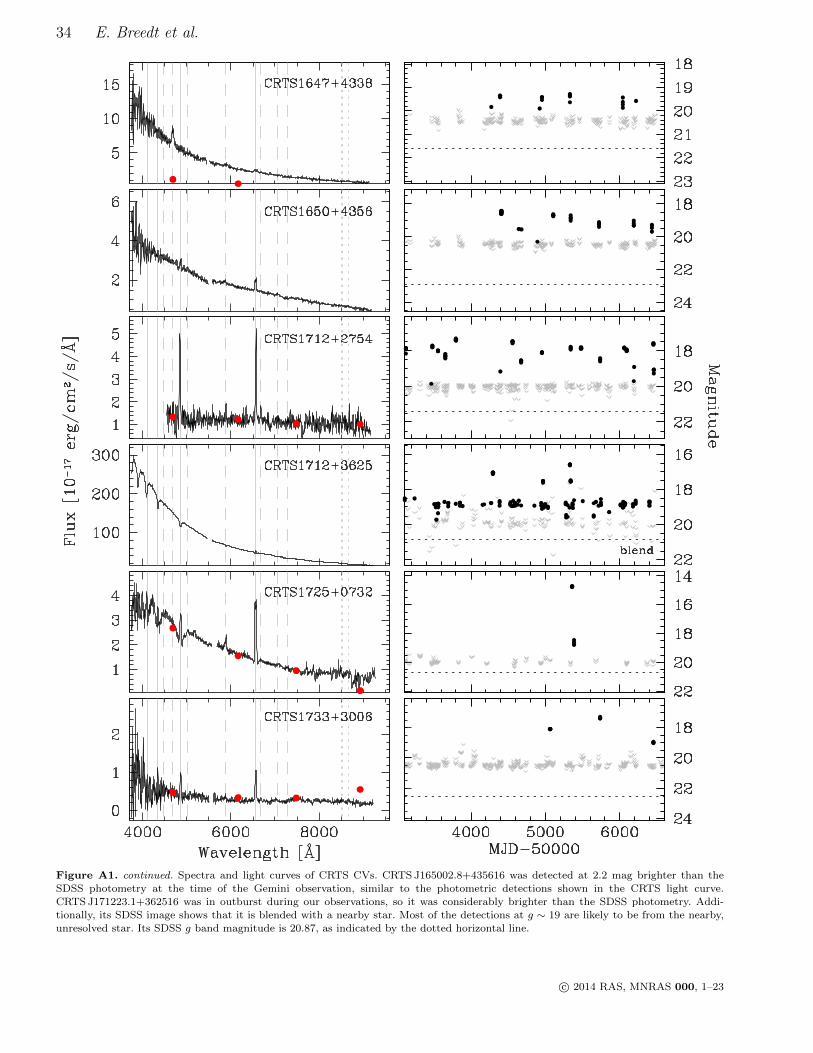
34 E. Breedt et al.
Figure A1. continued. Spectra and light curves of CRTS CVs. CRTS J165002.8+435616 was detected at 2.2 mag brighter than the
SDSS photometry at the time of the Gemini observation, similar to the photometric detections shown in the CRTS light curve.CRTS J171223.1+362516 was in outburst during our observations, so it was considerably brighter than the SDSS photometry. Addi-tionally, its SDSS image shows that it is blended with a nearby star. Most of the detections at g ∼ 19 are likely to be from the nearby,
unresolved star. Its SDSS g band magnitude is 20.87, as indicated by the dotted horizontal line.
c© 2014 RAS, MNRAS 000, 1–23

1000 CVs from CRTS 35
Figure A1. continued. Spectra and light curves of CRTS CVs. The SDSS photometry of CRTS J210650.6+110250 was taken while thesystem was in a bright state on the rise to or just after an outburst, so do not match the Gemini spectrum. Both CRTS J210043.9-005212
and CRTS J210954.1+163052 were in outburst at the time of the Gemini observations. CRTS J210954.1+163052 is affected by flux lossdue to atmospheric dispersion in the blue part of the spectrum.
c© 2014 RAS, MNRAS 000, 1–23