Embed Size (px)
Citation preview
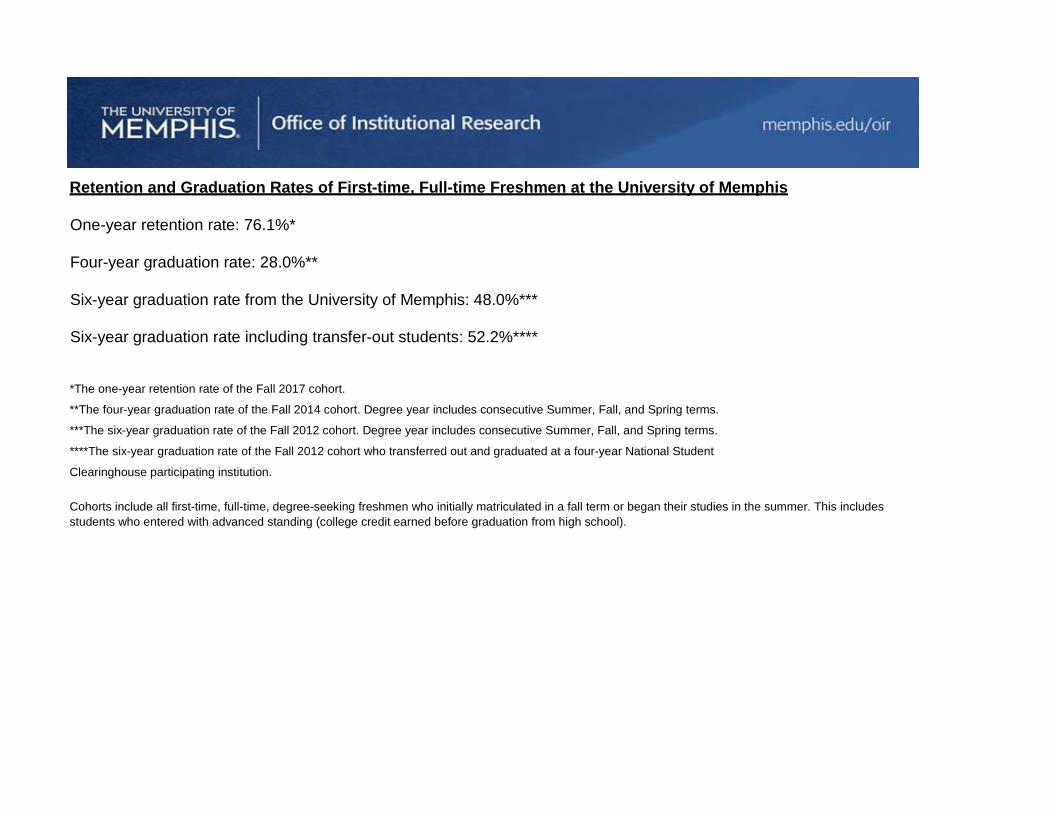
Retention and Graduation Rates of First-time, Full-time Freshmen at the University of Memphis
One-year retention rate: 76.1%*
Four-year graduation rate: 28.0%**
Six-year graduation rate from the University of Memphis: 48.0%***
Six-year graduation rate including transfer-out students: 52.2%****
*The one-year retention rate of the Fall 2017 cohort.
**The four-year graduation rate of the Fall 2014 cohort. Degree year includes consecutive Summer, Fall, and Spring terms.
***The six-year graduation rate of the Fall 2012 cohort. Degree year includes consecutive Summer, Fall, and Spring terms.
****The six-year graduation rate of the Fall 2012 cohort who transferred out and graduated at a four-year National Student
Clearinghouse participating institution.
Cohorts include all first-time, full-time, degree-seeking freshmen who initially matriculated in a fall term or began their studies in the summer. This includes students who entered with advanced standing (college credit earned before graduation from high school).
http://oir.memphis.edu/WebReports/Retention/RetentionConsolidated.pdf (Retention V5.SAS)Office of Institutional Research -- Thursday, Sep 20, 2018
Graduation rates shown are cumulative. Retention rates include students who are still enrolled or have graduated. This factsheet reports changes over time in persistence statistics for first-time,full-time freshmen attending the University of Memphis. Students who initially matriculated in a fall term or began their studies in the summer are considered first-time freshmen. This includes studentswho entered with advanced standing (college credit earned before graduation from high school). Each student is followed for eight years (or through the most recent year available) after his/herinitialterm. A student who enrolled for classes in the fall term of a given year is said to have been retained for that year. NOTE: GRADUATION YEAR INCLUDES FALL THROUGH SUMMER TERMS.
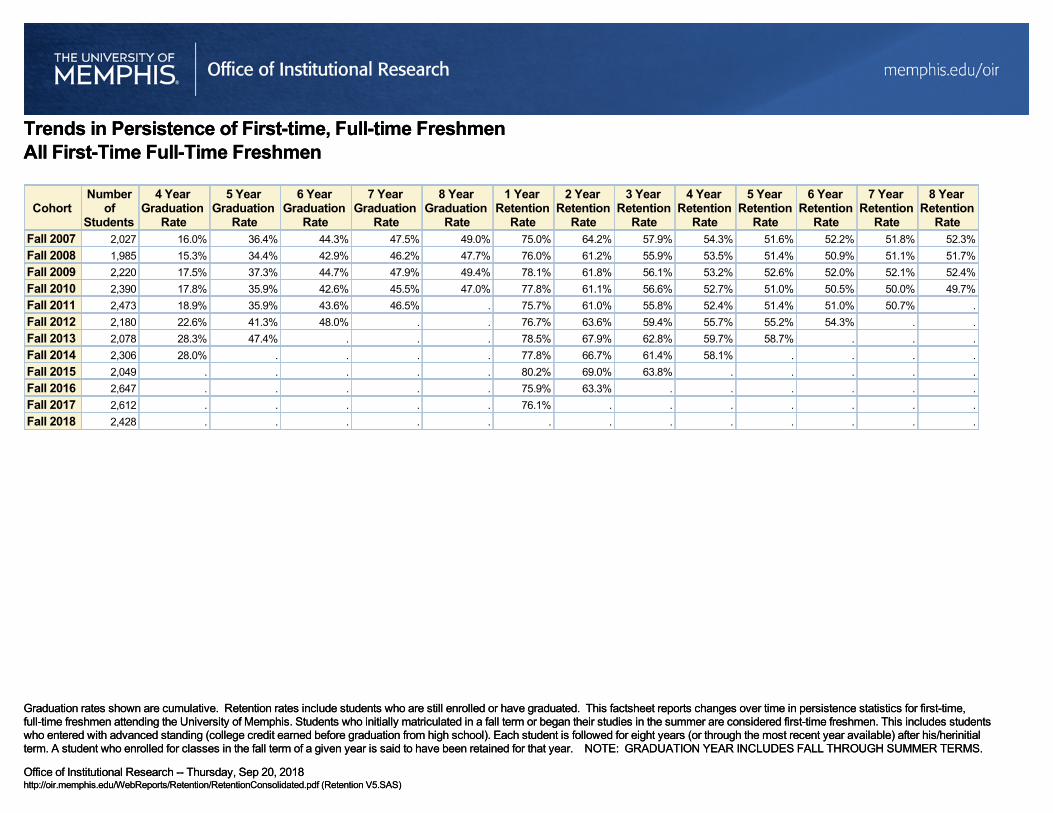
Trends in Persistence of First-time, Full-time FreshmenAll First-Time Full-Time Freshmen
http://oir.memphis.edu/WebReports/Retention/RetentionConsolidated.pdf (Retention V5.SAS)Office of Institutional Research -- Thursday, Sep 20, 2018
Graduation rates shown are cumulative. Retention rates include students who are still enrolled or have graduated. This factsheet reports changes over time in persistence statistics for first-time,full-time freshmen attending the University of Memphis. Students who initially matriculated in a fall term or began their studies in the summer are considered first-time freshmen. This includes studentswho entered with advanced standing (college credit earned before graduation from high school). Each student is followed for eight years (or through the most recent year available) after his/herinitialterm. A student who enrolled for classes in the fall term of a given year is said to have been retained for that year. NOTE: GRADUATION YEAR INCLUDES FALL THROUGH SUMMER TERMS.
Trends in Persistence of First-time, Full-time FreshmenAll First-Time Full-Time Freshmen
CohortNumber
ofStudents
4 YearGraduation
Rate
5 YearGraduation
Rate
6 YearGraduation
Rate
7 YearGraduation
Rate
8 YearGraduation
Rate
1 YearRetention
Rate
2 YearRetention
Rate
3 YearRetention
Rate
4 YearRetention
Rate
5 YearRetention
Rate
6 YearRetention
Rate
7 YearRetention
Rate
8 YearRetention
RateFall 2007 2,027 16.0% 36.4% 44.3% 47.5% 49.0% 75.0% 64.2% 57.9% 54.3% 51.6% 52.2% 51.8% 52.3%
Fall 2008 1,985 15.3% 34.4% 42.9% 46.2% 47.7% 76.0% 61.2% 55.9% 53.5% 51.4% 50.9% 51.1% 51.7%
Fall 2009 2,220 17.5% 37.3% 44.7% 47.9% 49.4% 78.1% 61.8% 56.1% 53.2% 52.6% 52.0% 52.1% 52.4%
Fall 2010 2,390 17.8% 35.9% 42.6% 45.5% 47.0% 77.8% 61.1% 56.6% 52.7% 51.0% 50.5% 50.0% 49.7%
Fall 2011 2,473 18.9% 35.9% 43.6% 46.5% . 75.7% 61.0% 55.8% 52.4% 51.4% 51.0% 50.7% .
Fall 2012 2,180 22.6% 41.3% 48.0% . . 76.7% 63.6% 59.4% 55.7% 55.2% 54.3% . .
Fall 2013 2,078 28.3% 47.4% . . . 78.5% 67.9% 62.8% 59.7% 58.7% . . .
Fall 2014 2,306 28.0% . . . . 77.8% 66.7% 61.4% 58.1% . . . .
Fall 2015 2,049 . . . . . 80.2% 69.0% 63.8% . . . . .
Fall 2016 2,647 . . . . . 75.9% 63.3% . . . . . .
Fall 2017 2,612 . . . . . 76.1% . . . . . . .
Fall 2018 2,428 . . . . . . . . . . . . .
Graduation rates shown are cumulative. This factsheet reports changes over time in persistence statistics for first-time, full-time freshmen attending the University of Memphis. Students who initiallymatriculated in a fall term or began their studies in the summer are considered first-time freshmen. This includes students who entered with advanced standing (college credit earned beforegraduation from high school). NOTE: GRADUATION YEAR INCLUDES FALL THROUGH SUMMER TERMS.
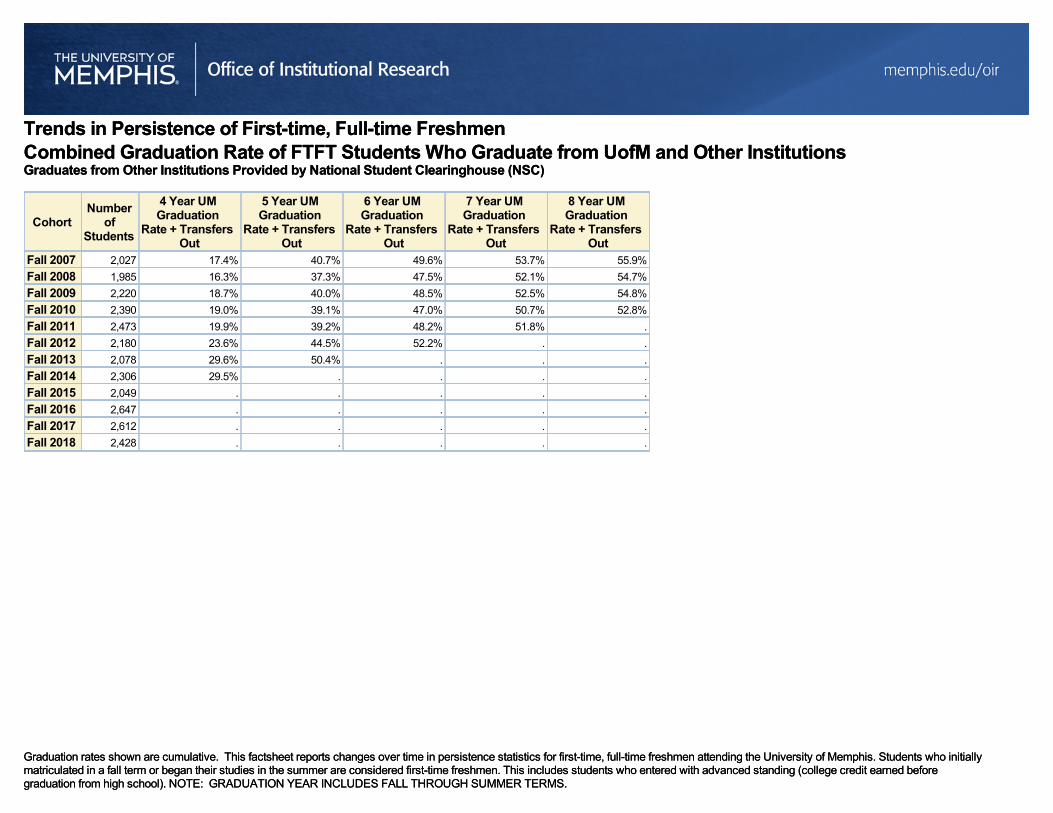
Trends in Persistence of First-time, Full-time FreshmenCombined Graduation Rate of FTFT Students Who Graduate from UofM and Other InstitutionsGraduates from Other Institutions Provided by National Student Clearinghouse (NSC)
Graduation rates shown are cumulative. This factsheet reports changes over time in persistence statistics for first-time, full-time freshmen attending the University of Memphis. Students who initiallymatriculated in a fall term or began their studies in the summer are considered first-time freshmen. This includes students who entered with advanced standing (college credit earned beforegraduation from high school). NOTE: GRADUATION YEAR INCLUDES FALL THROUGH SUMMER TERMS.
Trends in Persistence of First-time, Full-time FreshmenCombined Graduation Rate of FTFT Students Who Graduate from UofM and Other InstitutionsGraduates from Other Institutions Provided by National Student Clearinghouse (NSC)
CohortNumber
ofStudents
4 Year UMGraduation
Rate + TransfersOut
5 Year UMGraduation
Rate + TransfersOut
6 Year UMGraduation
Rate + TransfersOut
7 Year UMGraduation
Rate + TransfersOut
8 Year UMGraduation
Rate + TransfersOut
Fall 2007 2,027 17.4% 40.7% 49.6% 53.7% 55.9%
Fall 2008 1,985 16.3% 37.3% 47.5% 52.1% 54.7%
Fall 2009 2,220 18.7% 40.0% 48.5% 52.5% 54.8%
Fall 2010 2,390 19.0% 39.1% 47.0% 50.7% 52.8%
Fall 2011 2,473 19.9% 39.2% 48.2% 51.8% .
Fall 2012 2,180 23.6% 44.5% 52.2% . .
Fall 2013 2,078 29.6% 50.4% . . .
Fall 2014 2,306 29.5% . . . .
Fall 2015 2,049 . . . . .
Fall 2016 2,647 . . . . .
Fall 2017 2,612 . . . . .
Fall 2018 2,428 . . . . .
Graduation rates shown are cumulative. Retention rates include students who are still enrolled or have graduated. This factsheet reports changes over time in persistence statistics for first-time,full-time freshmen attending the University of Memphis. Students who initially matriculated in a fall term or began their studies in the summer are considered first-time freshmen. This includes studentswho entered with advanced standing (college credit earned before graduation from high school). Each student is followed for eight years (or through the most recent year available) after his/herinitialterm. A student who enrolled for classes in the fall term of a given year is said to have been retained for that year. NOTE: GRADUATION YEAR INCLUDES FALL THROUGH SUMMER TERMS.
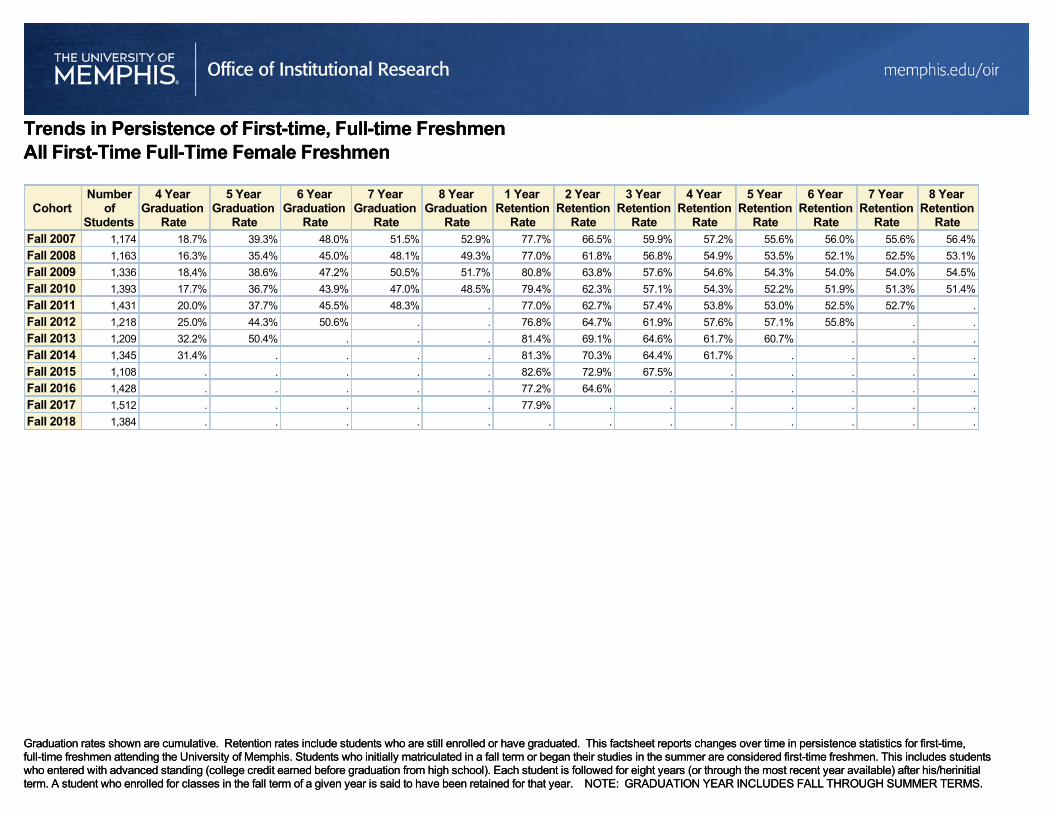
Trends in Persistence of First-time, Full-time FreshmenAll First-Time Full-Time Female Freshmen
Graduation rates shown are cumulative. Retention rates include students who are still enrolled or have graduated. This factsheet reports changes over time in persistence statistics for first-time,full-time freshmen attending the University of Memphis. Students who initially matriculated in a fall term or began their studies in the summer are considered first-time freshmen. This includes studentswho entered with advanced standing (college credit earned before graduation from high school). Each student is followed for eight years (or through the most recent year available) after his/herinitialterm. A student who enrolled for classes in the fall term of a given year is said to have been retained for that year. NOTE: GRADUATION YEAR INCLUDES FALL THROUGH SUMMER TERMS.
Trends in Persistence of First-time, Full-time FreshmenAll First-Time Full-Time Female Freshmen
CohortNumber
ofStudents
4 YearGraduation
Rate
5 YearGraduation
Rate
6 YearGraduation
Rate
7 YearGraduation
Rate
8 YearGraduation
Rate
1 YearRetention
Rate
2 YearRetention
Rate
3 YearRetention
Rate
4 YearRetention
Rate
5 YearRetention
Rate
6 YearRetention
Rate
7 YearRetention
Rate
8 YearRetention
RateFall 2007 1,174 18.7% 39.3% 48.0% 51.5% 52.9% 77.7% 66.5% 59.9% 57.2% 55.6% 56.0% 55.6% 56.4%
Fall 2008 1,163 16.3% 35.4% 45.0% 48.1% 49.3% 77.0% 61.8% 56.8% 54.9% 53.5% 52.1% 52.5% 53.1%
Fall 2009 1,336 18.4% 38.6% 47.2% 50.5% 51.7% 80.8% 63.8% 57.6% 54.6% 54.3% 54.0% 54.0% 54.5%
Fall 2010 1,393 17.7% 36.7% 43.9% 47.0% 48.5% 79.4% 62.3% 57.1% 54.3% 52.2% 51.9% 51.3% 51.4%
Fall 2011 1,431 20.0% 37.7% 45.5% 48.3% . 77.0% 62.7% 57.4% 53.8% 53.0% 52.5% 52.7% .
Fall 2012 1,218 25.0% 44.3% 50.6% . . 76.8% 64.7% 61.9% 57.6% 57.1% 55.8% . .
Fall 2013 1,209 32.2% 50.4% . . . 81.4% 69.1% 64.6% 61.7% 60.7% . . .
Fall 2014 1,345 31.4% . . . . 81.3% 70.3% 64.4% 61.7% . . . .
Fall 2015 1,108 . . . . . 82.6% 72.9% 67.5% . . . . .
Fall 2016 1,428 . . . . . 77.2% 64.6% . . . . . .
Fall 2017 1,512 . . . . . 77.9% . . . . . . .
Fall 2018 1,384 . . . . . . . . . . . . .

Graduation rates shown are cumulative. Retention rates include students who are still enrolled or have graduated. This factsheet reports changes over time in persistence statistics for first-time,full-time freshmen attending the University of Memphis. Students who initially matriculated in a fall term or began their studies in the summer are considered first-time freshmen. This includes studentswho entered with advanced standing (college credit earned before graduation from high school). Each student is followed for eight years (or through the most recent year available) after his/herinitialterm. A student who enrolled for classes in the fall term of a given year is said to have been retained for that year. NOTE: GRADUATION YEAR INCLUDES FALL THROUGH SUMMER TERMS.
Trends in Persistence of First-time, Full-time FreshmenAll First-Time Full-Time Male Freshmen
CohortNumber
ofStudents
4 YearGraduation
Rate
5 YearGraduation
Rate
6 YearGraduation
Rate
7 YearGraduation
Rate
8 YearGraduation
Rate
1 YearRetention
Rate
2 YearRetention
Rate
3 YearRetention
Rate
4 YearRetention
Rate
5 YearRetention
Rate
6 YearRetention
Rate
7 YearRetention
Rate
8 YearRetention
RateFall 2007 853 12.3% 32.4% 39.0% 42.0% 43.6% 71.3% 61.1% 55.2% 50.3% 46.1% 47.0% 46.5% 46.7%
Fall 2008 822 13.9% 33.0% 40.0% 43.7% 45.5% 74.5% 60.2% 54.5% 51.3% 48.5% 49.1% 49.3% 49.9%
Fall 2009 884 16.2% 35.2% 41.0% 43.9% 45.9% 73.9% 58.7% 53.8% 51.1% 50.1% 49.0% 49.3% 49.3%
Fall 2010 997 18.1% 34.9% 40.7% 43.3% 45.0% 75.6% 59.5% 55.8% 50.5% 49.3% 48.6% 48.2% 47.4%
Fall 2011 1,042 17.5% 33.6% 41.1% 44.1% . 73.8% 58.6% 53.6% 50.4% 49.3% 48.8% 48.0% .
Fall 2012 962 19.5% 37.5% 44.8% . . 76.4% 62.3% 56.3% 53.4% 52.9% 52.3% . .
Fall 2013 869 22.9% 43.4% . . . 74.6% 66.2% 60.2% 56.8% 55.9% . . .
Fall 2014 961 23.1% . . . . 72.9% 61.8% 57.1% 53.0% . . . .
Fall 2015 941 . . . . . 77.5% 64.3% 59.4% . . . . .
Fall 2016 1,219 . . . . . 74.3% 61.9% . . . . . .
Fall 2017 1,100 . . . . . 73.6% . . . . . . .
Fall 2018 1,044 . . . . . . . . . . . . .
Graduation rates shown are cumulative. Retention rates include students who are still enrolled or have graduated. This factsheet reports changes over time in persistence statistics for first-time,full-time freshmen attending the University of Memphis. Students who initially matriculated in a fall term or began their studies in the summer are considered first-time freshmen. This includes studentswho entered with advanced standing (college credit earned before graduation from high school). Each student is followed for eight years (or through the most recent year available) after his/herinitialterm. A student who enrolled for classes in the fall term of a given year is said to have been retained for that year. NOTE: GRADUATION YEAR INCLUDES FALL THROUGH SUMMER TERMS.
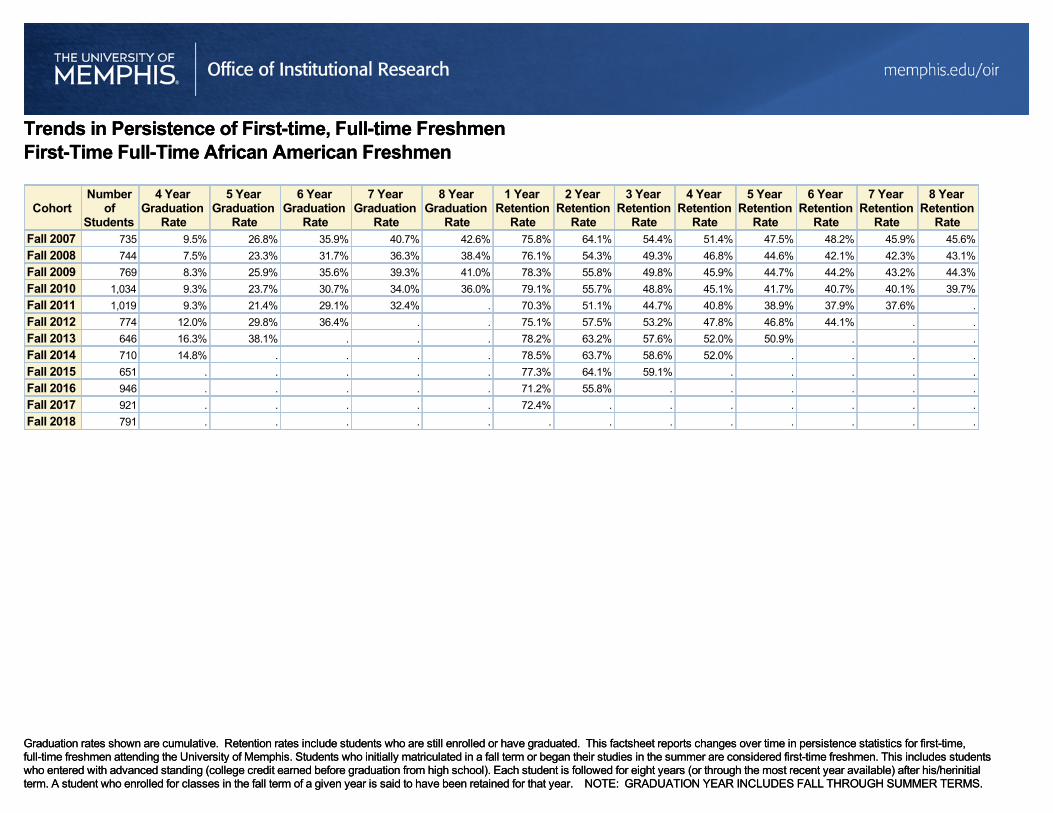
Trends in Persistence of First-time, Full-time FreshmenFirst-Time Full-Time African American Freshmen
Graduation rates shown are cumulative. Retention rates include students who are still enrolled or have graduated. This factsheet reports changes over time in persistence statistics for first-time,full-time freshmen attending the University of Memphis. Students who initially matriculated in a fall term or began their studies in the summer are considered first-time freshmen. This includes studentswho entered with advanced standing (college credit earned before graduation from high school). Each student is followed for eight years (or through the most recent year available) after his/herinitialterm. A student who enrolled for classes in the fall term of a given year is said to have been retained for that year. NOTE: GRADUATION YEAR INCLUDES FALL THROUGH SUMMER TERMS.
Trends in Persistence of First-time, Full-time FreshmenFirst-Time Full-Time African American Freshmen
CohortNumber
ofStudents
4 YearGraduation
Rate
5 YearGraduation
Rate
6 YearGraduation
Rate
7 YearGraduation
Rate
8 YearGraduation
Rate
1 YearRetention
Rate
2 YearRetention
Rate
3 YearRetention
Rate
4 YearRetention
Rate
5 YearRetention
Rate
6 YearRetention
Rate
7 YearRetention
Rate
8 YearRetention
RateFall 2007 735 9.5% 26.8% 35.9% 40.7% 42.6% 75.8% 64.1% 54.4% 51.4% 47.5% 48.2% 45.9% 45.6%
Fall 2008 744 7.5% 23.3% 31.7% 36.3% 38.4% 76.1% 54.3% 49.3% 46.8% 44.6% 42.1% 42.3% 43.1%
Fall 2009 769 8.3% 25.9% 35.6% 39.3% 41.0% 78.3% 55.8% 49.8% 45.9% 44.7% 44.2% 43.2% 44.3%
Fall 2010 1,034 9.3% 23.7% 30.7% 34.0% 36.0% 79.1% 55.7% 48.8% 45.1% 41.7% 40.7% 40.1% 39.7%
Fall 2011 1,019 9.3% 21.4% 29.1% 32.4% . 70.3% 51.1% 44.7% 40.8% 38.9% 37.9% 37.6% .
Fall 2012 774 12.0% 29.8% 36.4% . . 75.1% 57.5% 53.2% 47.8% 46.8% 44.1% . .
Fall 2013 646 16.3% 38.1% . . . 78.2% 63.2% 57.6% 52.0% 50.9% . . .
Fall 2014 710 14.8% . . . . 78.5% 63.7% 58.6% 52.0% . . . .
Fall 2015 651 . . . . . 77.3% 64.1% 59.1% . . . . .
Fall 2016 946 . . . . . 71.2% 55.8% . . . . . .
Fall 2017 921 . . . . . 72.4% . . . . . . .
Fall 2018 791 . . . . . . . . . . . . .
Graduation rates shown are cumulative. Retention rates include students who are still enrolled or have graduated. This factsheet reports changes over time in persistence statistics for first-time,full-time freshmen attending the University of Memphis. Students who initially matriculated in a fall term or began their studies in the summer are considered first-time freshmen. This includes studentswho entered with advanced standing (college credit earned before graduation from high school). Each student is followed for eight years (or through the most recent year available) after his/herinitialterm. A student who enrolled for classes in the fall term of a given year is said to have been retained for that year. NOTE: GRADUATION YEAR INCLUDES FALL THROUGH SUMMER TERMS.
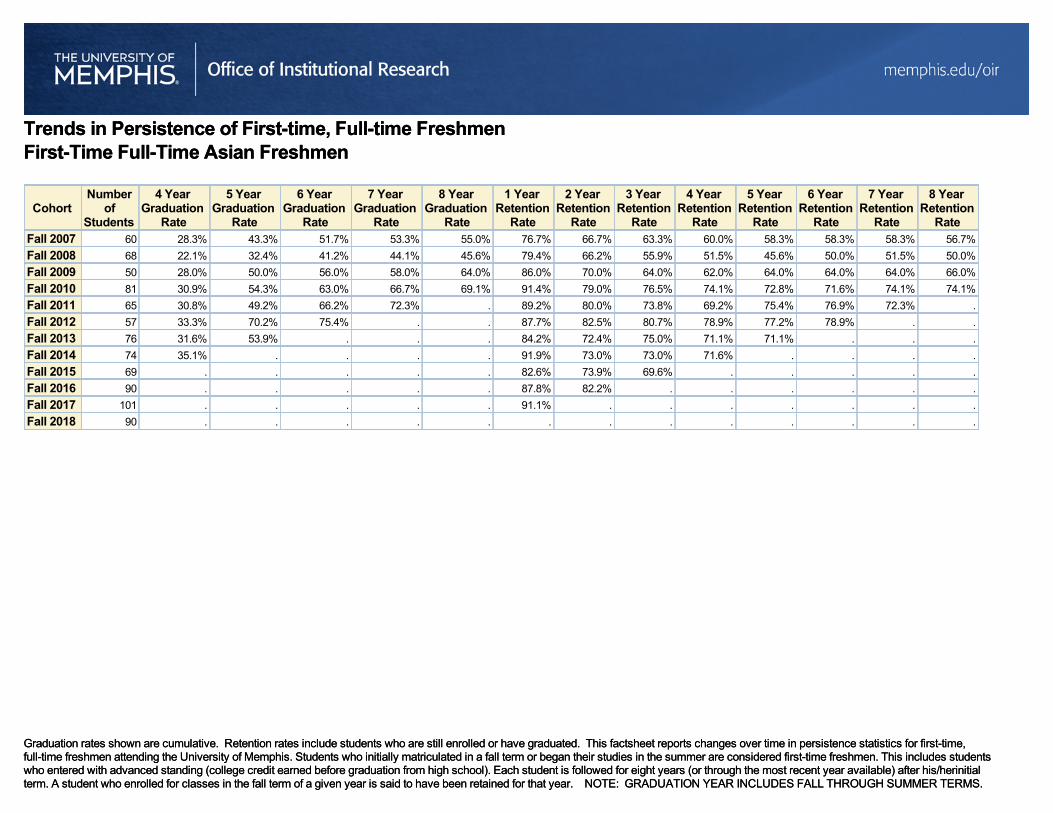
Trends in Persistence of First-time, Full-time FreshmenFirst-Time Full-Time Asian Freshmen
Graduation rates shown are cumulative. Retention rates include students who are still enrolled or have graduated. This factsheet reports changes over time in persistence statistics for first-time,full-time freshmen attending the University of Memphis. Students who initially matriculated in a fall term or began their studies in the summer are considered first-time freshmen. This includes studentswho entered with advanced standing (college credit earned before graduation from high school). Each student is followed for eight years (or through the most recent year available) after his/herinitialterm. A student who enrolled for classes in the fall term of a given year is said to have been retained for that year. NOTE: GRADUATION YEAR INCLUDES FALL THROUGH SUMMER TERMS.
Trends in Persistence of First-time, Full-time FreshmenFirst-Time Full-Time Asian Freshmen
CohortNumber
ofStudents
4 YearGraduation
Rate
5 YearGraduation
Rate
6 YearGraduation
Rate
7 YearGraduation
Rate
8 YearGraduation
Rate
1 YearRetention
Rate
2 YearRetention
Rate
3 YearRetention
Rate
4 YearRetention
Rate
5 YearRetention
Rate
6 YearRetention
Rate
7 YearRetention
Rate
8 YearRetention
RateFall 2007 60 28.3% 43.3% 51.7% 53.3% 55.0% 76.7% 66.7% 63.3% 60.0% 58.3% 58.3% 58.3% 56.7%
Fall 2008 68 22.1% 32.4% 41.2% 44.1% 45.6% 79.4% 66.2% 55.9% 51.5% 45.6% 50.0% 51.5% 50.0%
Fall 2009 50 28.0% 50.0% 56.0% 58.0% 64.0% 86.0% 70.0% 64.0% 62.0% 64.0% 64.0% 64.0% 66.0%
Fall 2010 81 30.9% 54.3% 63.0% 66.7% 69.1% 91.4% 79.0% 76.5% 74.1% 72.8% 71.6% 74.1% 74.1%
Fall 2011 65 30.8% 49.2% 66.2% 72.3% . 89.2% 80.0% 73.8% 69.2% 75.4% 76.9% 72.3% .
Fall 2012 57 33.3% 70.2% 75.4% . . 87.7% 82.5% 80.7% 78.9% 77.2% 78.9% . .
Fall 2013 76 31.6% 53.9% . . . 84.2% 72.4% 75.0% 71.1% 71.1% . . .
Fall 2014 74 35.1% . . . . 91.9% 73.0% 73.0% 71.6% . . . .
Fall 2015 69 . . . . . 82.6% 73.9% 69.6% . . . . .
Fall 2016 90 . . . . . 87.8% 82.2% . . . . . .
Fall 2017 101 . . . . . 91.1% . . . . . . .
Fall 2018 90 . . . . . . . . . . . . .

Graduation rates shown are cumulative. Retention rates include students who are still enrolled or have graduated. This factsheet reports changes over time in persistence statistics for first-time,full-time freshmen attending the University of Memphis. Students who initially matriculated in a fall term or began their studies in the summer are considered first-time freshmen. This includes studentswho entered with advanced standing (college credit earned before graduation from high school). Each student is followed for eight years (or through the most recent year available) after his/herinitialterm. A student who enrolled for classes in the fall term of a given year is said to have been retained for that year. NOTE: GRADUATION YEAR INCLUDES FALL THROUGH SUMMER TERMS.
Trends in Persistence of First-time, Full-time FreshmenFirst-Time Full-Time Hispanic Freshmen
CohortNumber
ofStudents
4 YearGraduation
Rate
5 YearGraduation
Rate
6 YearGraduation
Rate
7 YearGraduation
Rate
8 YearGraduation
Rate
1 YearRetention
Rate
2 YearRetention
Rate
3 YearRetention
Rate
4 YearRetention
Rate
5 YearRetention
Rate
6 YearRetention
Rate
7 YearRetention
Rate
8 YearRetention
RateFall 2007 39 12.8% 35.9% 41.0% 43.6% 43.6% 66.7% 56.4% 53.8% 53.8% 48.7% 48.7% 48.7% 48.7%
Fall 2008 40 17.5% 35.0% 40.0% 40.0% 42.5% 72.5% 57.5% 55.0% 50.0% 42.5% 45.0% 47.5% 47.5%
Fall 2009 36 25.0% 38.9% 44.4% 44.4% 44.4% 66.7% 52.8% 52.8% 47.2% 47.2% 47.2% 44.4% 44.4%
Fall 2010 84 13.1% 32.1% 42.9% 45.2% 46.4% 77.4% 58.3% 56.0% 52.4% 51.2% 50.0% 50.0% 48.8%
Fall 2011 101 17.8% 41.6% 49.5% 51.5% . 80.2% 65.3% 57.4% 56.4% 56.4% 51.5% 53.5% .
Fall 2012 87 23.0% 49.4% 54.0% . . 80.5% 70.1% 69.0% 60.9% 57.5% 60.9% . .
Fall 2013 108 24.1% 47.2% . . . 76.9% 70.4% 61.1% 59.3% 59.3% . . .
Fall 2014 124 26.6% . . . . 80.6% 66.9% 66.1% 66.1% . . . .
Fall 2015 124 . . . . . 87.9% 75.0% 70.2% . . . . .
Fall 2016 151 . . . . . 77.5% 67.5% . . . . . .
Fall 2017 147 . . . . . 81.6% . . . . . . .
Fall 2018 177 . . . . . . . . . . . . .
Graduation rates shown are cumulative. Retention rates include students who are still enrolled or have graduated. This factsheet reports changes over time in persistence statistics for first-time,full-time freshmen attending the University of Memphis. Students who initially matriculated in a fall term or began their studies in the summer are considered first-time freshmen. This includes studentswho entered with advanced standing (college credit earned before graduation from high school). Each student is followed for eight years (or through the most recent year available) after his/herinitialterm. A student who enrolled for classes in the fall term of a given year is said to have been retained for that year. NOTE: GRADUATION YEAR INCLUDES FALL THROUGH SUMMER TERMS.
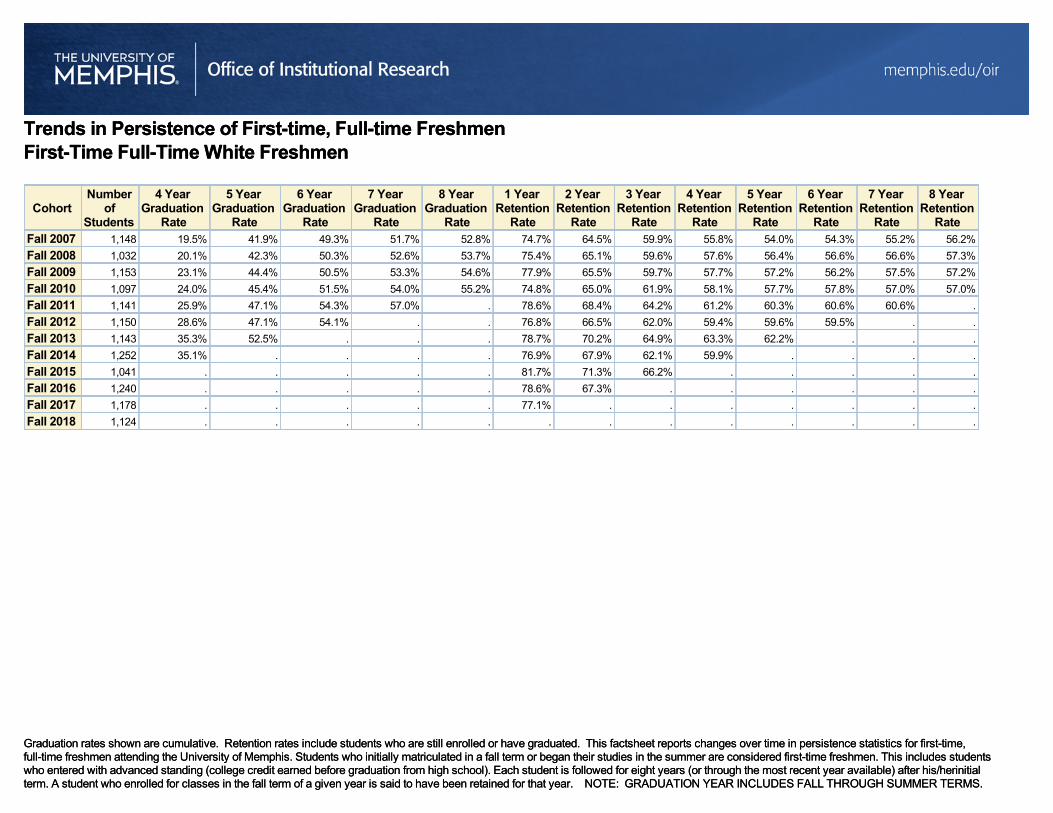
Trends in Persistence of First-time, Full-time FreshmenFirst-Time Full-Time White Freshmen
Graduation rates shown are cumulative. Retention rates include students who are still enrolled or have graduated. This factsheet reports changes over time in persistence statistics for first-time,full-time freshmen attending the University of Memphis. Students who initially matriculated in a fall term or began their studies in the summer are considered first-time freshmen. This includes studentswho entered with advanced standing (college credit earned before graduation from high school). Each student is followed for eight years (or through the most recent year available) after his/herinitialterm. A student who enrolled for classes in the fall term of a given year is said to have been retained for that year. NOTE: GRADUATION YEAR INCLUDES FALL THROUGH SUMMER TERMS.
Trends in Persistence of First-time, Full-time FreshmenFirst-Time Full-Time White Freshmen
CohortNumber
ofStudents
4 YearGraduation
Rate
5 YearGraduation
Rate
6 YearGraduation
Rate
7 YearGraduation
Rate
8 YearGraduation
Rate
1 YearRetention
Rate
2 YearRetention
Rate
3 YearRetention
Rate
4 YearRetention
Rate
5 YearRetention
Rate
6 YearRetention
Rate
7 YearRetention
Rate
8 YearRetention
RateFall 2007 1,148 19.5% 41.9% 49.3% 51.7% 52.8% 74.7% 64.5% 59.9% 55.8% 54.0% 54.3% 55.2% 56.2%
Fall 2008 1,032 20.1% 42.3% 50.3% 52.6% 53.7% 75.4% 65.1% 59.6% 57.6% 56.4% 56.6% 56.6% 57.3%
Fall 2009 1,153 23.1% 44.4% 50.5% 53.3% 54.6% 77.9% 65.5% 59.7% 57.7% 57.2% 56.2% 57.5% 57.2%
Fall 2010 1,097 24.0% 45.4% 51.5% 54.0% 55.2% 74.8% 65.0% 61.9% 58.1% 57.7% 57.8% 57.0% 57.0%
Fall 2011 1,141 25.9% 47.1% 54.3% 57.0% . 78.6% 68.4% 64.2% 61.2% 60.3% 60.6% 60.6% .
Fall 2012 1,150 28.6% 47.1% 54.1% . . 76.8% 66.5% 62.0% 59.4% 59.6% 59.5% . .
Fall 2013 1,143 35.3% 52.5% . . . 78.7% 70.2% 64.9% 63.3% 62.2% . . .
Fall 2014 1,252 35.1% . . . . 76.9% 67.9% 62.1% 59.9% . . . .
Fall 2015 1,041 . . . . . 81.7% 71.3% 66.2% . . . . .
Fall 2016 1,240 . . . . . 78.6% 67.3% . . . . . .
Fall 2017 1,178 . . . . . 77.1% . . . . . . .
Fall 2018 1,124 . . . . . . . . . . . . .
Graduation rates shown are cumulative. Retention rates include students who are still enrolled or have graduated. This factsheet reports changes over time in persistence statistics for first-time,full-time freshmen attending the University of Memphis. Students who initially matriculated in a fall term or began their studies in the summer are considered first-time freshmen. This includes studentswho entered with advanced standing (college credit earned before graduation from high school). Each student is followed for eight years (or through the most recent year available) after his/herinitialterm. A student who enrolled for classes in the fall term of a given year is said to have been retained for that year. NOTE: GRADUATION YEAR INCLUDES FALL THROUGH SUMMER TERMS.
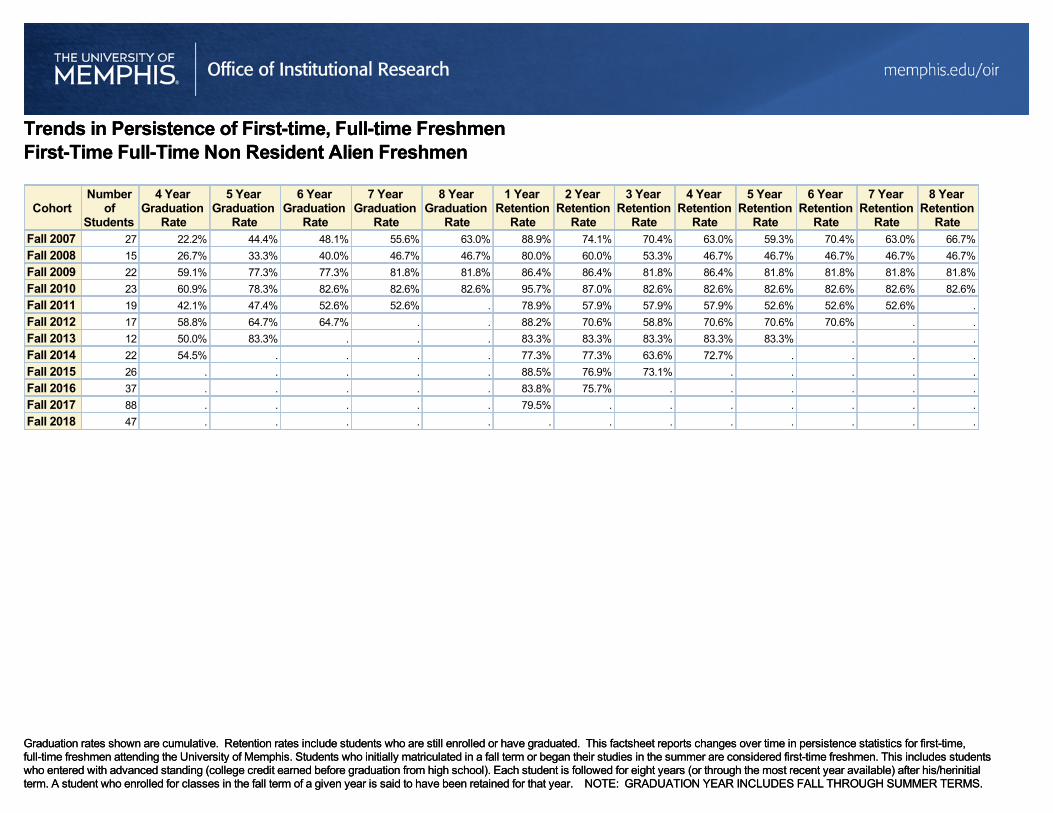
Trends in Persistence of First-time, Full-time FreshmenFirst-Time Full-Time Non Resident Alien Freshmen
Graduation rates shown are cumulative. Retention rates include students who are still enrolled or have graduated. This factsheet reports changes over time in persistence statistics for first-time,full-time freshmen attending the University of Memphis. Students who initially matriculated in a fall term or began their studies in the summer are considered first-time freshmen. This includes studentswho entered with advanced standing (college credit earned before graduation from high school). Each student is followed for eight years (or through the most recent year available) after his/herinitialterm. A student who enrolled for classes in the fall term of a given year is said to have been retained for that year. NOTE: GRADUATION YEAR INCLUDES FALL THROUGH SUMMER TERMS.
Trends in Persistence of First-time, Full-time FreshmenFirst-Time Full-Time Non Resident Alien Freshmen
CohortNumber
ofStudents
4 YearGraduation
Rate
5 YearGraduation
Rate
6 YearGraduation
Rate
7 YearGraduation
Rate
8 YearGraduation
Rate
1 YearRetention
Rate
2 YearRetention
Rate
3 YearRetention
Rate
4 YearRetention
Rate
5 YearRetention
Rate
6 YearRetention
Rate
7 YearRetention
Rate
8 YearRetention
RateFall 2007 27 22.2% 44.4% 48.1% 55.6% 63.0% 88.9% 74.1% 70.4% 63.0% 59.3% 70.4% 63.0% 66.7%
Fall 2008 15 26.7% 33.3% 40.0% 46.7% 46.7% 80.0% 60.0% 53.3% 46.7% 46.7% 46.7% 46.7% 46.7%
Fall 2009 22 59.1% 77.3% 77.3% 81.8% 81.8% 86.4% 86.4% 81.8% 86.4% 81.8% 81.8% 81.8% 81.8%
Fall 2010 23 60.9% 78.3% 82.6% 82.6% 82.6% 95.7% 87.0% 82.6% 82.6% 82.6% 82.6% 82.6% 82.6%
Fall 2011 19 42.1% 47.4% 52.6% 52.6% . 78.9% 57.9% 57.9% 57.9% 52.6% 52.6% 52.6% .
Fall 2012 17 58.8% 64.7% 64.7% . . 88.2% 70.6% 58.8% 70.6% 70.6% 70.6% . .
Fall 2013 12 50.0% 83.3% . . . 83.3% 83.3% 83.3% 83.3% 83.3% . . .
Fall 2014 22 54.5% . . . . 77.3% 77.3% 63.6% 72.7% . . . .
Fall 2015 26 . . . . . 88.5% 76.9% 73.1% . . . . .
Fall 2016 37 . . . . . 83.8% 75.7% . . . . . .
Fall 2017 88 . . . . . 79.5% . . . . . . .
Fall 2018 47 . . . . . . . . . . . . .
Graduation rates shown are cumulative. Retention rates include students who are still enrolled or have graduated. This factsheet reports changes over time in persistence statistics for first-time,TRANSFER students attending the University of Memphis. These students did not begin their studies at the UofM as first-time freshmen. Transfer students are classified as Freshmen, Sophomore,Junior, or Senior based on transfer hours. This includes advanced standing (college credit earned before graduation from high school). Each student is followed for eight years (or through the mostrecent year available) after his/herinitial term. A student who enrolled for classes in the fall term of a given year is said to have been retained for that year. NOTE: GRADUATION YEAR INCLUDESFALL THROUGH SUMMER TERMS.
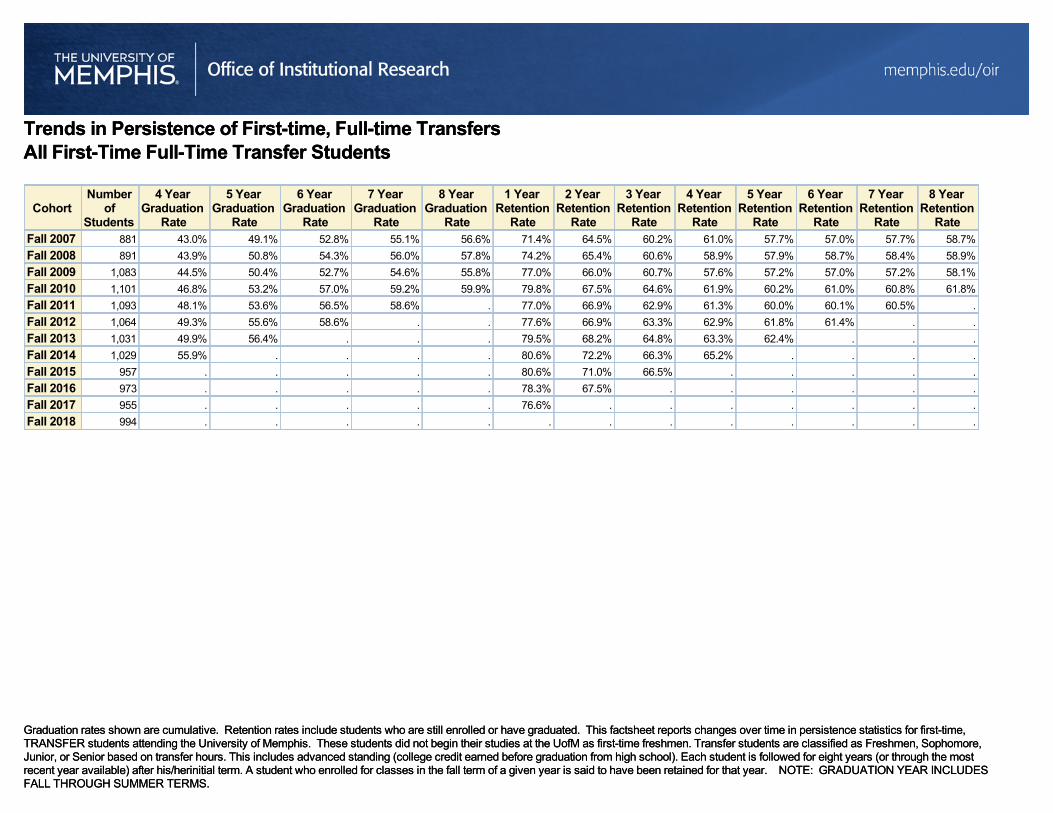
Trends in Persistence of First-time, Full-time TransfersAll First-Time Full-Time Transfer Students
Graduation rates shown are cumulative. Retention rates include students who are still enrolled or have graduated. This factsheet reports changes over time in persistence statistics for first-time,TRANSFER students attending the University of Memphis. These students did not begin their studies at the UofM as first-time freshmen. Transfer students are classified as Freshmen, Sophomore,Junior, or Senior based on transfer hours. This includes advanced standing (college credit earned before graduation from high school). Each student is followed for eight years (or through the mostrecent year available) after his/herinitial term. A student who enrolled for classes in the fall term of a given year is said to have been retained for that year. NOTE: GRADUATION YEAR INCLUDESFALL THROUGH SUMMER TERMS.
Trends in Persistence of First-time, Full-time TransfersAll First-Time Full-Time Transfer Students
CohortNumber
ofStudents
4 YearGraduation
Rate
5 YearGraduation
Rate
6 YearGraduation
Rate
7 YearGraduation
Rate
8 YearGraduation
Rate
1 YearRetention
Rate
2 YearRetention
Rate
3 YearRetention
Rate
4 YearRetention
Rate
5 YearRetention
Rate
6 YearRetention
Rate
7 YearRetention
Rate
8 YearRetention
RateFall 2007 881 43.0% 49.1% 52.8% 55.1% 56.6% 71.4% 64.5% 60.2% 61.0% 57.7% 57.0% 57.7% 58.7%
Fall 2008 891 43.9% 50.8% 54.3% 56.0% 57.8% 74.2% 65.4% 60.6% 58.9% 57.9% 58.7% 58.4% 58.9%
Fall 2009 1,083 44.5% 50.4% 52.7% 54.6% 55.8% 77.0% 66.0% 60.7% 57.6% 57.2% 57.0% 57.2% 58.1%
Fall 2010 1,101 46.8% 53.2% 57.0% 59.2% 59.9% 79.8% 67.5% 64.6% 61.9% 60.2% 61.0% 60.8% 61.8%
Fall 2011 1,093 48.1% 53.6% 56.5% 58.6% . 77.0% 66.9% 62.9% 61.3% 60.0% 60.1% 60.5% .
Fall 2012 1,064 49.3% 55.6% 58.6% . . 77.6% 66.9% 63.3% 62.9% 61.8% 61.4% . .
Fall 2013 1,031 49.9% 56.4% . . . 79.5% 68.2% 64.8% 63.3% 62.4% . . .
Fall 2014 1,029 55.9% . . . . 80.6% 72.2% 66.3% 65.2% . . . .
Fall 2015 957 . . . . . 80.6% 71.0% 66.5% . . . . .
Fall 2016 973 . . . . . 78.3% 67.5% . . . . . .
Fall 2017 955 . . . . . 76.6% . . . . . . .
Fall 2018 994 . . . . . . . . . . . . .

Graduation rates shown are cumulative. Retention rates include students who are still enrolled or have graduated. This factsheet reports changes over time in persistence statistics for first-time,TRANSFER students attending the University of Memphis. These students did not begin their studies at the UofM as first-time freshmen. Transfer students are classified as Freshmen, Sophomore,Junior, or Senior based on transfer hours. This includes advanced standing (college credit earned before graduation from high school). Each student is followed for eight years (or through the mostrecent year available) after his/herinitial term. A student who enrolled for classes in the fall term of a given year is said to have been retained for that year. NOTE: GRADUATION YEAR INCLUDESFALL THROUGH SUMMER TERMS.
Trends in Persistence of First-time, Full-time TransfersFreshmen Transfer Students
CohortNumber
ofStudents
4 YearGraduation
Rate
5 YearGraduation
Rate
6 YearGraduation
Rate
7 YearGraduation
Rate
8 YearGraduation
Rate
1 YearRetention
Rate
2 YearRetention
Rate
3 YearRetention
Rate
4 YearRetention
Rate
5 YearRetention
Rate
6 YearRetention
Rate
7 YearRetention
Rate
8 YearRetention
RateFall 2008 307 25.1% 35.5% 40.4% 41.4% 44.6% 69.1% 57.0% 48.9% 47.6% 46.9% 47.2% 45.6% 46.6%
Fall 2009 260 24.6% 35.8% 39.6% 41.9% 42.3% 70.0% 57.7% 52.3% 49.2% 46.5% 44.6% 45.0% 45.8%
Fall 2010 309 28.2% 38.2% 44.7% 48.5% 49.5% 78.6% 61.5% 56.0% 51.8% 49.8% 51.1% 50.8% 51.8%
Fall 2011 270 21.1% 30.0% 35.9% 40.0% . 68.1% 55.9% 49.3% 43.7% 41.9% 41.5% 42.2% .
Fall 2012 188 25.5% 37.8% 43.1% . . 72.9% 60.6% 53.7% 51.1% 50.5% 45.7% . .
Fall 2013 178 27.5% 41.6% . . . 73.0% 60.1% 53.9% 55.1% 52.8% . . .
Fall 2014 185 31.4% . . . . 71.9% 61.1% 48.6% 45.9% . . . .
Fall 2015 192 . . . . . 74.5% 62.5% 55.7% . . . . .
Fall 2016 178 . . . . . 68.0% 55.1% . . . . . .
Fall 2017 187 . . . . . 63.1% . . . . . . .
Fall 2018 217 . . . . . . . . . . . . .

Graduation rates shown are cumulative. Retention rates include students who are still enrolled or have graduated. This factsheet reports changes over time in persistence statistics for first-time,TRANSFER students attending the University of Memphis. These students did not begin their studies at the UofM as first-time freshmen. Transfer students are classified as Freshmen, Sophomore,Junior, or Senior based on transfer hours. This includes advanced standing (college credit earned before graduation from high school). Each student is followed for eight years (or through the mostrecent year available) after his/herinitial term. A student who enrolled for classes in the fall term of a given year is said to have been retained for that year. NOTE: GRADUATION YEAR INCLUDESFALL THROUGH SUMMER TERMS.
Trends in Persistence of First-time, Full-time TransfersFreshmen Transfer Students
CohortNumber
ofStudents
4 YearGraduation
Rate
5 YearGraduation
Rate
6 YearGraduation
Rate
7 YearGraduation
Rate
8 YearGraduation
Rate
1 YearRetention
Rate
2 YearRetention
Rate
3 YearRetention
Rate
4 YearRetention
Rate
5 YearRetention
Rate
6 YearRetention
Rate
7 YearRetention
Rate
8 YearRetention
RateFall 2008 307 25.1% 35.5% 40.4% 41.4% 44.6% 69.1% 57.0% 48.9% 47.6% 46.9% 47.2% 45.6% 46.6%
Fall 2009 260 24.6% 35.8% 39.6% 41.9% 42.3% 70.0% 57.7% 52.3% 49.2% 46.5% 44.6% 45.0% 45.8%
Fall 2010 309 28.2% 38.2% 44.7% 48.5% 49.5% 78.6% 61.5% 56.0% 51.8% 49.8% 51.1% 50.8% 51.8%
Fall 2011 270 21.1% 30.0% 35.9% 40.0% . 68.1% 55.9% 49.3% 43.7% 41.9% 41.5% 42.2% .
Fall 2012 188 25.5% 37.8% 43.1% . . 72.9% 60.6% 53.7% 51.1% 50.5% 45.7% . .
Fall 2013 178 27.5% 41.6% . . . 73.0% 60.1% 53.9% 55.1% 52.8% . . .
Fall 2014 185 31.4% . . . . 71.9% 61.1% 48.6% 45.9% . . . .
Fall 2015 192 . . . . . 74.5% 62.5% 55.7% . . . . .
Fall 2016 178 . . . . . 68.0% 55.1% . . . . . .
Fall 2017 187 . . . . . 63.1% . . . . . . .
Fall 2018 217 . . . . . . . . . . . . .

Graduation rates shown are cumulative. Retention rates include students who are still enrolled or have graduated. This factsheet reports changes over time in persistence statistics for first-time,TRANSFER students attending the University of Memphis. These students did not begin their studies at the UofM as first-time freshmen. Transfer students are classified as Freshmen, Sophomore,Junior, or Senior based on transfer hours. This includes advanced standing (college credit earned before graduation from high school). Each student is followed for eight years (or through the mostrecent year available) after his/herinitial term. A student who enrolled for classes in the fall term of a given year is said to have been retained for that year. NOTE: GRADUATION YEAR INCLUDESFALL THROUGH SUMMER TERMS.
Trends in Persistence of First-time, Full-time TransfersSophomore Transfer Students
CohortNumber
ofStudents
4 YearGraduation
Rate
5 YearGraduation
Rate
6 YearGraduation
Rate
7 YearGraduation
Rate
8 YearGraduation
Rate
1 YearRetention
Rate
2 YearRetention
Rate
3 YearRetention
Rate
4 YearRetention
Rate
5 YearRetention
Rate
6 YearRetention
Rate
7 YearRetention
Rate
8 YearRetention
RateFall 2008 304 42.4% 50.3% 52.3% 54.6% 55.3% 75.0% 65.8% 59.9% 58.2% 56.6% 57.6% 56.6% 56.3%
Fall 2009 408 44.4% 49.0% 51.7% 53.7% 55.6% 79.4% 66.2% 61.5% 56.6% 57.1% 57.1% 57.4% 58.6%
Fall 2010 411 44.5% 51.6% 55.2% 57.7% 58.4% 77.6% 66.2% 65.5% 62.0% 59.4% 59.9% 59.6% 60.1%
Fall 2011 429 48.3% 54.5% 56.9% 59.0% . 77.9% 67.6% 61.8% 62.0% 61.1% 60.4% 60.6% .
Fall 2012 413 44.3% 51.6% 54.5% . . 75.3% 63.7% 59.6% 60.5% 58.1% 58.4% . .
Fall 2013 381 43.6% 50.1% . . . 77.2% 64.8% 61.7% 58.8% 57.0% . . .
Fall 2014 390 53.8% . . . . 82.3% 72.6% 66.2% 65.1% . . . .
Fall 2015 385 . . . . . 84.2% 72.7% 68.6% . . . . .
Fall 2016 376 . . . . . 77.1% 65.4% . . . . . .
Fall 2017 384 . . . . . 77.3% . . . . . . .
Fall 2018 415 . . . . . . . . . . . . .

Graduation rates shown are cumulative. Retention rates include students who are still enrolled or have graduated. This factsheet reports changes over time in persistence statistics for first-time,TRANSFER students attending the University of Memphis. These students did not begin their studies at the UofM as first-time freshmen. Transfer students are classified as Freshmen, Sophomore,Junior, or Senior based on transfer hours. This includes advanced standing (college credit earned before graduation from high school). Each student is followed for eight years (or through the mostrecent year available) after his/herinitial term. A student who enrolled for classes in the fall term of a given year is said to have been retained for that year. NOTE: GRADUATION YEAR INCLUDESFALL THROUGH SUMMER TERMS.
Trends in Persistence of First-time, Full-time TransfersJunior Transfer Students
CohortNumber
ofStudents
4 YearGraduation
Rate
5 YearGraduation
Rate
6 YearGraduation
Rate
7 YearGraduation
Rate
8 YearGraduation
Rate
1 YearRetention
Rate
2 YearRetention
Rate
3 YearRetention
Rate
4 YearRetention
Rate
5 YearRetention
Rate
6 YearRetention
Rate
7 YearRetention
Rate
8 YearRetention
RateFall 2008 217 68.2% 69.6% 72.8% 74.7% 76.5% 80.2% 75.1% 75.6% 74.7% 73.3% 73.7% 75.6% 77.0%
Fall 2009 305 57.7% 62.3% 63.3% 64.6% 65.2% 81.3% 73.8% 66.9% 64.9% 65.6% 65.6% 66.2% 66.2%
Fall 2010 285 65.3% 68.1% 70.5% 71.2% 71.6% 86.0% 74.7% 72.3% 70.9% 70.5% 71.6% 71.2% 73.3%
Fall 2011 295 67.1% 69.2% 70.5% 71.5% . 84.7% 75.3% 74.6% 73.9% 71.9% 73.6% 73.6% .
Fall 2012 329 65.3% 69.6% 71.4% . . 83.6% 74.5% 74.2% 73.3% 73.6% 73.9% . .
Fall 2013 359 63.5% 67.4% . . . 85.5% 74.9% 72.4% 70.8% 70.5% . . .
Fall 2014 320 66.3% . . . . 83.4% 76.3% 74.1% 72.5% . . . .
Fall 2015 284 . . . . . 80.6% 73.2% 70.8% . . . . .
Fall 2016 324 . . . . . 84.3% 74.1% . . . . . .
Fall 2017 302 . . . . . 83.4% . . . . . . .
Fall 2018 297 . . . . . . . . . . . . .
Graduation rates shown are cumulative. Retention rates include students who are still enrolled or have graduated. This factsheet reports changes over time in persistence statistics for first-time,TRANSFER students attending the University of Memphis. These students did not begin their studies at the UofM as first-time freshmen. Transfer students are classified as Freshmen, Sophomore,Junior, or Senior based on transfer hours. This includes advanced standing (college credit earned before graduation from high school). Each student is followed for eight years (or through the mostrecent year available) after his/herinitial term. A student who enrolled for classes in the fall term of a given year is said to have been retained for that year. NOTE: GRADUATION YEAR INCLUDESFALL THROUGH SUMMER TERMS.
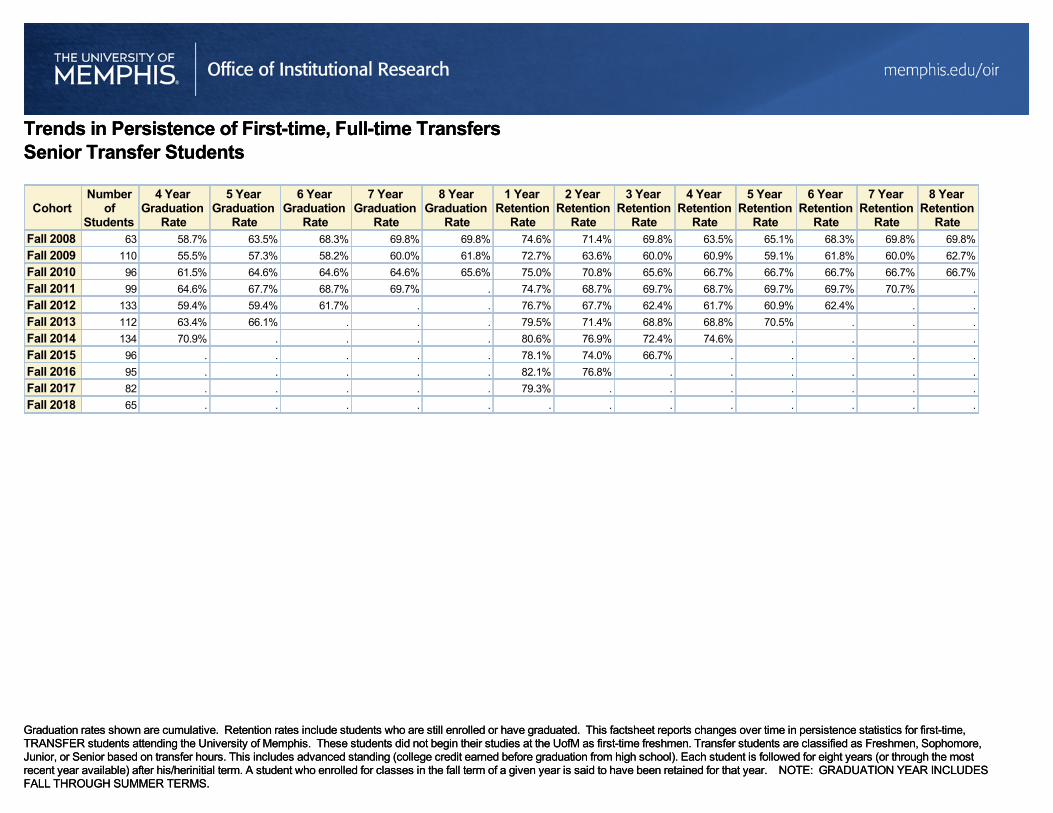
Trends in Persistence of First-time, Full-time TransfersSenior Transfer Students
Graduation rates shown are cumulative. Retention rates include students who are still enrolled or have graduated. This factsheet reports changes over time in persistence statistics for first-time,TRANSFER students attending the University of Memphis. These students did not begin their studies at the UofM as first-time freshmen. Transfer students are classified as Freshmen, Sophomore,Junior, or Senior based on transfer hours. This includes advanced standing (college credit earned before graduation from high school). Each student is followed for eight years (or through the mostrecent year available) after his/herinitial term. A student who enrolled for classes in the fall term of a given year is said to have been retained for that year. NOTE: GRADUATION YEAR INCLUDESFALL THROUGH SUMMER TERMS.
Trends in Persistence of First-time, Full-time TransfersSenior Transfer Students
CohortNumber
ofStudents
4 YearGraduation
Rate
5 YearGraduation
Rate
6 YearGraduation
Rate
7 YearGraduation
Rate
8 YearGraduation
Rate
1 YearRetention
Rate
2 YearRetention
Rate
3 YearRetention
Rate
4 YearRetention
Rate
5 YearRetention
Rate
6 YearRetention
Rate
7 YearRetention
Rate
8 YearRetention
RateFall 2008 63 58.7% 63.5% 68.3% 69.8% 69.8% 74.6% 71.4% 69.8% 63.5% 65.1% 68.3% 69.8% 69.8%
Fall 2009 110 55.5% 57.3% 58.2% 60.0% 61.8% 72.7% 63.6% 60.0% 60.9% 59.1% 61.8% 60.0% 62.7%
Fall 2010 96 61.5% 64.6% 64.6% 64.6% 65.6% 75.0% 70.8% 65.6% 66.7% 66.7% 66.7% 66.7% 66.7%
Fall 2011 99 64.6% 67.7% 68.7% 69.7% . 74.7% 68.7% 69.7% 68.7% 69.7% 69.7% 70.7% .
Fall 2012 133 59.4% 59.4% 61.7% . . 76.7% 67.7% 62.4% 61.7% 60.9% 62.4% . .
Fall 2013 112 63.4% 66.1% . . . 79.5% 71.4% 68.8% 68.8% 70.5% . . .
Fall 2014 134 70.9% . . . . 80.6% 76.9% 72.4% 74.6% . . . .
Fall 2015 96 . . . . . 78.1% 74.0% 66.7% . . . . .
Fall 2016 95 . . . . . 82.1% 76.8% . . . . . .
Fall 2017 82 . . . . . 79.3% . . . . . . .
Fall 2018 65 . . . . . . . . . . . . .
Graduation rates shown are cumulative. Retention rates include students who are still enrolled or have graduated. This factsheet reports changes over time in persistence statistics for first-time,full-time freshmen attending the University of Memphis. Students who initially matriculated in a fall term or began their studies in the summer are considered first-time freshmen. This includes studentswho entered with advanced standing (college credit earned before graduation from high school). Each student is followed for eight years (or through the most recent year available) after his/herinitialterm. A student who enrolled for classes in the fall term of a given year is said to have been retained for that year. NOTE: GRADUATION YEAR INCLUDES FALL THROUGH SUMMER TERMS.
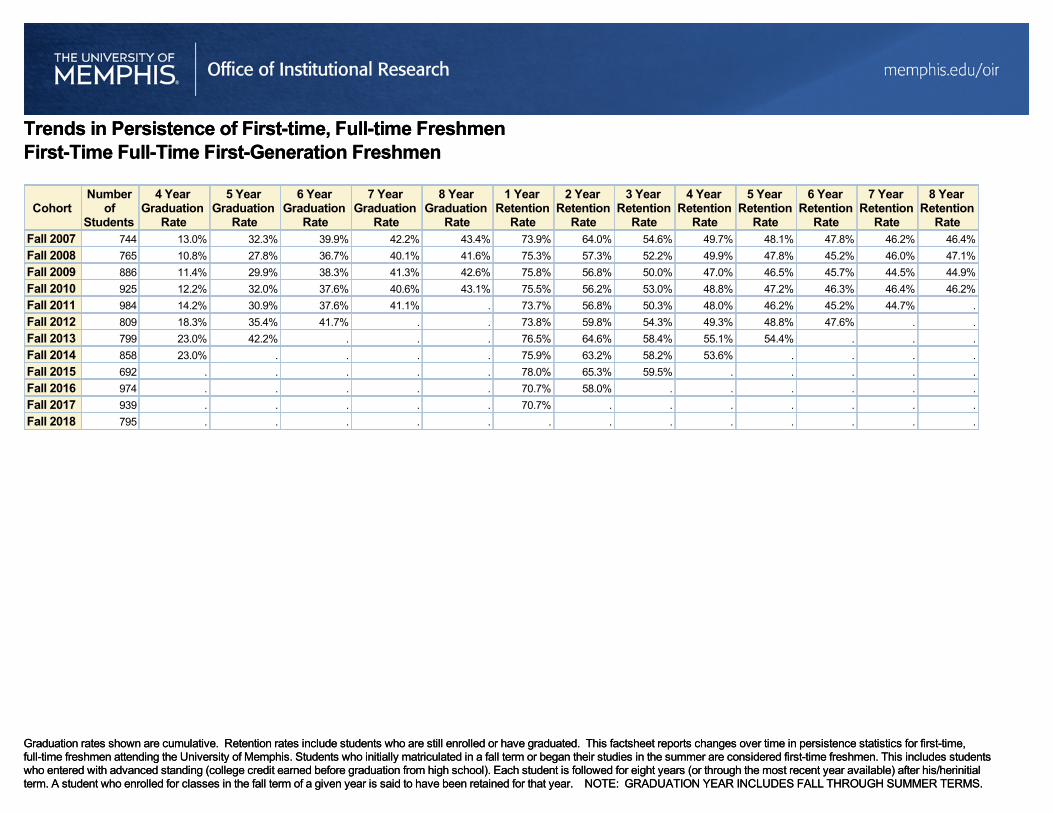
Trends in Persistence of First-time, Full-time FreshmenFirst-Time Full-Time First-Generation Freshmen
Graduation rates shown are cumulative. Retention rates include students who are still enrolled or have graduated. This factsheet reports changes over time in persistence statistics for first-time,full-time freshmen attending the University of Memphis. Students who initially matriculated in a fall term or began their studies in the summer are considered first-time freshmen. This includes studentswho entered with advanced standing (college credit earned before graduation from high school). Each student is followed for eight years (or through the most recent year available) after his/herinitialterm. A student who enrolled for classes in the fall term of a given year is said to have been retained for that year. NOTE: GRADUATION YEAR INCLUDES FALL THROUGH SUMMER TERMS.
Trends in Persistence of First-time, Full-time FreshmenFirst-Time Full-Time First-Generation Freshmen
CohortNumber
ofStudents
4 YearGraduation
Rate
5 YearGraduation
Rate
6 YearGraduation
Rate
7 YearGraduation
Rate
8 YearGraduation
Rate
1 YearRetention
Rate
2 YearRetention
Rate
3 YearRetention
Rate
4 YearRetention
Rate
5 YearRetention
Rate
6 YearRetention
Rate
7 YearRetention
Rate
8 YearRetention
RateFall 2007 744 13.0% 32.3% 39.9% 42.2% 43.4% 73.9% 64.0% 54.6% 49.7% 48.1% 47.8% 46.2% 46.4%
Fall 2008 765 10.8% 27.8% 36.7% 40.1% 41.6% 75.3% 57.3% 52.2% 49.9% 47.8% 45.2% 46.0% 47.1%
Fall 2009 886 11.4% 29.9% 38.3% 41.3% 42.6% 75.8% 56.8% 50.0% 47.0% 46.5% 45.7% 44.5% 44.9%
Fall 2010 925 12.2% 32.0% 37.6% 40.6% 43.1% 75.5% 56.2% 53.0% 48.8% 47.2% 46.3% 46.4% 46.2%
Fall 2011 984 14.2% 30.9% 37.6% 41.1% . 73.7% 56.8% 50.3% 48.0% 46.2% 45.2% 44.7% .
Fall 2012 809 18.3% 35.4% 41.7% . . 73.8% 59.8% 54.3% 49.3% 48.8% 47.6% . .
Fall 2013 799 23.0% 42.2% . . . 76.5% 64.6% 58.4% 55.1% 54.4% . . .
Fall 2014 858 23.0% . . . . 75.9% 63.2% 58.2% 53.6% . . . .
Fall 2015 692 . . . . . 78.0% 65.3% 59.5% . . . . .
Fall 2016 974 . . . . . 70.7% 58.0% . . . . . .
Fall 2017 939 . . . . . 70.7% . . . . . . .
Fall 2018 795 . . . . . . . . . . . . .
Graduation rates shown are cumulative. Retention rates include students who are still enrolled or have graduated. This factsheet reports changes over time in persistence statistics for first-time,full-time freshmen attending the University of Memphis. Students who initially matriculated in a fall term or began their studies in the summer are considered first-time freshmen. This includes studentswho entered with advanced standing (college credit earned before graduation from high school). Each student is followed for eight years (or through the most recent year available) after his/herinitialterm. A student who enrolled for classes in the fall term of a given year is said to have been retained for that year. NOTE: GRADUATION YEAR INCLUDES FALL THROUGH SUMMER TERMS.
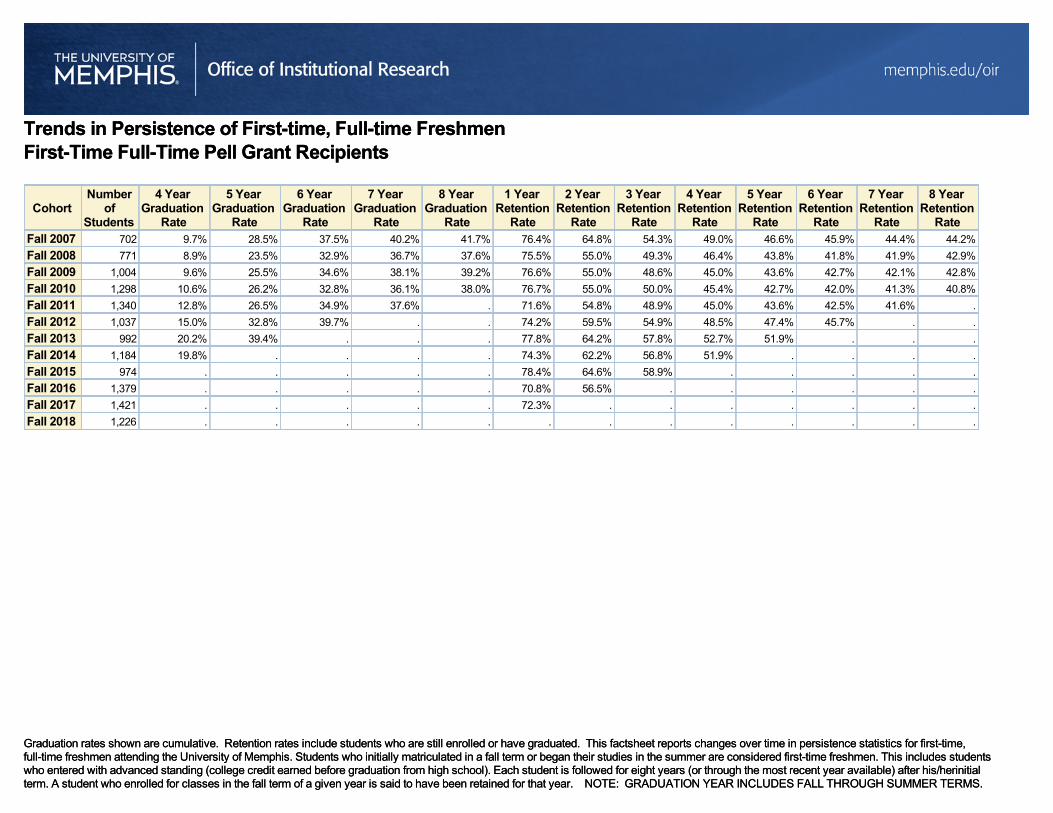
Trends in Persistence of First-time, Full-time FreshmenFirst-Time Full-Time Pell Grant Recipients
Graduation rates shown are cumulative. Retention rates include students who are still enrolled or have graduated. This factsheet reports changes over time in persistence statistics for first-time,full-time freshmen attending the University of Memphis. Students who initially matriculated in a fall term or began their studies in the summer are considered first-time freshmen. This includes studentswho entered with advanced standing (college credit earned before graduation from high school). Each student is followed for eight years (or through the most recent year available) after his/herinitialterm. A student who enrolled for classes in the fall term of a given year is said to have been retained for that year. NOTE: GRADUATION YEAR INCLUDES FALL THROUGH SUMMER TERMS.
Trends in Persistence of First-time, Full-time FreshmenFirst-Time Full-Time Pell Grant Recipients
CohortNumber
ofStudents
4 YearGraduation
Rate
5 YearGraduation
Rate
6 YearGraduation
Rate
7 YearGraduation
Rate
8 YearGraduation
Rate
1 YearRetention
Rate
2 YearRetention
Rate
3 YearRetention
Rate
4 YearRetention
Rate
5 YearRetention
Rate
6 YearRetention
Rate
7 YearRetention
Rate
8 YearRetention
RateFall 2007 702 9.7% 28.5% 37.5% 40.2% 41.7% 76.4% 64.8% 54.3% 49.0% 46.6% 45.9% 44.4% 44.2%
Fall 2008 771 8.9% 23.5% 32.9% 36.7% 37.6% 75.5% 55.0% 49.3% 46.4% 43.8% 41.8% 41.9% 42.9%
Fall 2009 1,004 9.6% 25.5% 34.6% 38.1% 39.2% 76.6% 55.0% 48.6% 45.0% 43.6% 42.7% 42.1% 42.8%
Fall 2010 1,298 10.6% 26.2% 32.8% 36.1% 38.0% 76.7% 55.0% 50.0% 45.4% 42.7% 42.0% 41.3% 40.8%
Fall 2011 1,340 12.8% 26.5% 34.9% 37.6% . 71.6% 54.8% 48.9% 45.0% 43.6% 42.5% 41.6% .
Fall 2012 1,037 15.0% 32.8% 39.7% . . 74.2% 59.5% 54.9% 48.5% 47.4% 45.7% . .
Fall 2013 992 20.2% 39.4% . . . 77.8% 64.2% 57.8% 52.7% 51.9% . . .
Fall 2014 1,184 19.8% . . . . 74.3% 62.2% 56.8% 51.9% . . . .
Fall 2015 974 . . . . . 78.4% 64.6% 58.9% . . . . .
Fall 2016 1,379 . . . . . 70.8% 56.5% . . . . . .
Fall 2017 1,421 . . . . . 72.3% . . . . . . .
Fall 2018 1,226 . . . . . . . . . . . . .

Graduation rates shown are cumulative. Retention rates include students who are still enrolled or have graduated. This factsheet reports changes over time in persistence statistics for first-time,full-time freshmen attending the University of Memphis. Students who initially matriculated in a fall term or began their studies in the summer are considered first-time freshmen. This includes studentswho entered with advanced standing (college credit earned before graduation from high school). Each student is followed for eight years (or through the most recent year available) after his/herinitialterm. A student who enrolled for classes in the fall term of a given year is said to have been retained for that year. NOTE: GRADUATION YEAR INCLUDES FALL THROUGH SUMMER TERMS.
Trends in Persistence of First-time, Full-time FreshmenFormer Dual Enrolled Students in the FTFT cohort
CohortNumber ofStudents
4 YearGraduation
Rate
5 YearGraduation
Rate
6 YearGraduation
Rate
7 YearGraduation
Rate
8 YearGraduation
Rate
1 YearRetention
Rate
2 YearRetention
Rate
3 YearRetention
Rate
4 YearRetention
Rate
5 YearRetention
Rate
6 YearRetention
Rate
7 YearRetention
Rate
8 YearRetention
RateFall 2008 62 29.0% 45.2% 56.5% 61.3% 62.9% 82.3% 75.8% 67.7% 72.6% 62.9% 66.1% 66.1% 66.1%
Fall 2009 90 31.1% 55.6% 66.7% 72.2% 73.3% 84.4% 80.0% 76.7% 72.2% 73.3% 73.3% 74.4% 76.7%
Fall 2010 122 37.7% 56.6% 62.3% 64.8% 66.4% 85.2% 75.4% 71.3% 70.5% 67.2% 68.9% 68.0% 68.0%
Fall 2011 128 25.0% 43.0% 55.5% 58.6% . 81.3% 65.6% 63.3% 63.3% 64.8% 63.3% 63.3% .
Fall 2012 145 30.3% 56.6% 61.4% . . 86.2% 73.1% 70.3% 66.2% 66.9% 64.8% . .
Fall 2013 174 42.0% 63.2% . . . 86.2% 81.6% 78.7% 75.9% 74.7% . . .
Fall 2014 199 40.7% . . . . 88.9% 82.4% 76.9% 76.9% . . . .
Fall 2015 216 . . . . . 92.6% 86.6% 81.5% . . . . .
Fall 2016 263 . . . . . 88.6% 83.7% . . . . . .
Fall 2017 328 . . . . . 86.9% . . . . . . .
Fall 2018 436 . . . . . . . . . . . . .

Graduation rates shown are cumulative. Retention rates include students who are still enrolled or have graduated. This factsheet reports changes over time in persistence statistics for first-time,full-time freshmen attending the University of Memphis. Students who initially matriculated in a fall term or began their studies in the summer are considered first-time freshmen. This includes studentswho entered with advanced standing (college credit earned before graduation from high school). Each student is followed for eight years (or through the most recent year available) after his/herinitialterm. A student who enrolled for classes in the fall term of a given year is said to have been retained for that year. NOTE: GRADUATION YEAR INCLUDES FALL THROUGH SUMMER TERMS.
Trends in Persistence of First-time, Full-time FreshmenFirst-Time Full-Time Hope Scholarship Recipients
CohortNumber
ofStudents
4 YearGraduation
Rate
5 YearGraduation
Rate
6 YearGraduation
Rate
7 YearGraduation
Rate
8 YearGraduation
Rate
1 YearRetention
Rate
2 YearRetention
Rate
3 YearRetention
Rate
4 YearRetention
Rate
5 YearRetention
Rate
6 YearRetention
Rate
7 YearRetention
Rate
8 YearRetention
RateFall 2007 1,310 18.3% 42.1% 49.8% 52.9% 54.5% 77.6% 68.8% 63.4% 60.0% 57.7% 57.6% 57.5% 57.8%
Fall 2008 1,388 16.9% 39.5% 48.6% 51.7% 53.0% 79.4% 66.2% 60.9% 58.9% 56.9% 56.1% 56.5% 56.9%
Fall 2009 1,554 18.5% 41.8% 50.0% 53.4% 54.8% 81.3% 67.6% 61.9% 58.6% 57.5% 57.7% 57.7% 58.2%
Fall 2010 1,648 20.6% 41.1% 48.4% 51.6% 53.5% 80.6% 66.6% 62.1% 58.4% 56.9% 56.9% 56.4% 56.3%
Fall 2011 1,781 21.8% 40.9% 49.1% 51.8% . 78.6% 65.5% 60.9% 57.7% 57.0% 56.4% 55.9% .
Fall 2012 1,619 24.5% 45.2% 52.1% . . 78.6% 66.7% 63.1% 59.2% 59.4% 58.0% . .
Fall 2013 1,544 31.3% 52.4% . . . 81.0% 72.3% 67.8% 64.8% 64.0% . . .
Fall 2014 1,663 30.8% . . . . 80.4% 71.0% 65.3% 62.0% . . . .
Fall 2015 1,376 . . . . . 85.5% 76.4% 71.3% . . . . .
Fall 2016 1,664 . . . . . 81.1% 71.0% . . . . . .
Fall 2017 1,739 . . . . . 81.6% . . . . . . .
Fall 2018 1,669 . . . . . . . . . . . . .

Graduation rates shown are cumulative. Retention rates include students who are still enrolled or have graduated. This factsheet reports changes over time in persistence statistics for first-time,full-time freshmen attending the University of Memphis. Students who initially matriculated in a fall term or began their studies in the summer are considered first-time freshmen. This includes studentswho entered with advanced standing (college credit earned before graduation from high school). Each student is followed for eight years (or through the most recent year available) after his/herinitialterm. A student who enrolled for classes in the fall term of a given year is said to have been retained for that year. NOTE: GRADUATION YEAR INCLUDES FALL THROUGH SUMMER TERMS.
Trends in Persistence of First-time, Full-time FreshmenFirst-Time Full-Time Presidential Scholarship Recipients
CohortNumber
ofStudents
4 YearGraduation
Rate
5 YearGraduation
Rate
6 YearGraduation
Rate
7 YearGraduation
Rate
8 YearGraduation
Rate
1 YearRetention
Rate
2 YearRetention
Rate
3 YearRetention
Rate
4 YearRetention
Rate
5 YearRetention
Rate
6 YearRetention
Rate
7 YearRetention
Rate
8 YearRetention
RateFall 2007 40 50.0% 77.5% 77.5% 80.0% 80.0% 92.5% 82.5% 80.0% 85.0% 80.0% 80.0% 80.0% 80.0%
Fall 2008 50 50.0% 66.0% 74.0% 74.0% 74.0% 94.0% 82.0% 82.0% 74.0% 76.0% 76.0% 76.0% 76.0%
Fall 2009 90 47.8% 66.7% 67.8% 68.9% 68.9% 86.7% 81.1% 76.7% 72.2% 70.0% 70.0% 68.9% 70.0%
Fall 2010 58 60.3% 77.6% 84.5% 84.5% 84.5% 86.2% 86.2% 86.2% 82.8% 86.2% 84.5% 84.5% 84.5%
Fall 2011 82 47.6% 63.4% 70.7% 76.8% . 91.5% 85.4% 82.9% 81.7% 78.0% 79.3% 78.0% .
Fall 2012 77 63.6% 70.1% 74.0% . . 93.5% 85.7% 84.4% 79.2% 79.2% 76.6% . .
Fall 2013 91 64.8% 73.6% . . . 89.0% 85.7% 81.3% 79.1% 80.2% . . .
Fall 2014 105 68.6% . . . . 93.3% 89.5% 87.6% 85.7% . . . .
Fall 2015 109 . . . . . 91.7% 85.3% 80.7% . . . . .
Fall 2016 127 . . . . . 94.5% 90.6% . . . . . .
Fall 2017 145 . . . . . 91.0% . . . . . . .
Fall 2018 164 . . . . . . . . . . . . .
Graduation rates shown are cumulative. Retention rates include students who are still enrolled or have graduated. This factsheet reports changes over time in persistence statistics for first-time,full-time freshmen attending the University of Memphis. Students who initially matriculated in a fall term or began their studies in the summer are considered first-time freshmen. This includes studentswho entered with advanced standing (college credit earned before graduation from high school). Each student is followed for eight years (or through the most recent year available) after his/herinitialterm. A student who enrolled for classes in the fall term of a given year is said to have been retained for that year. NOTE: GRADUATION YEAR INCLUDES FALL THROUGH SUMMER TERMS.
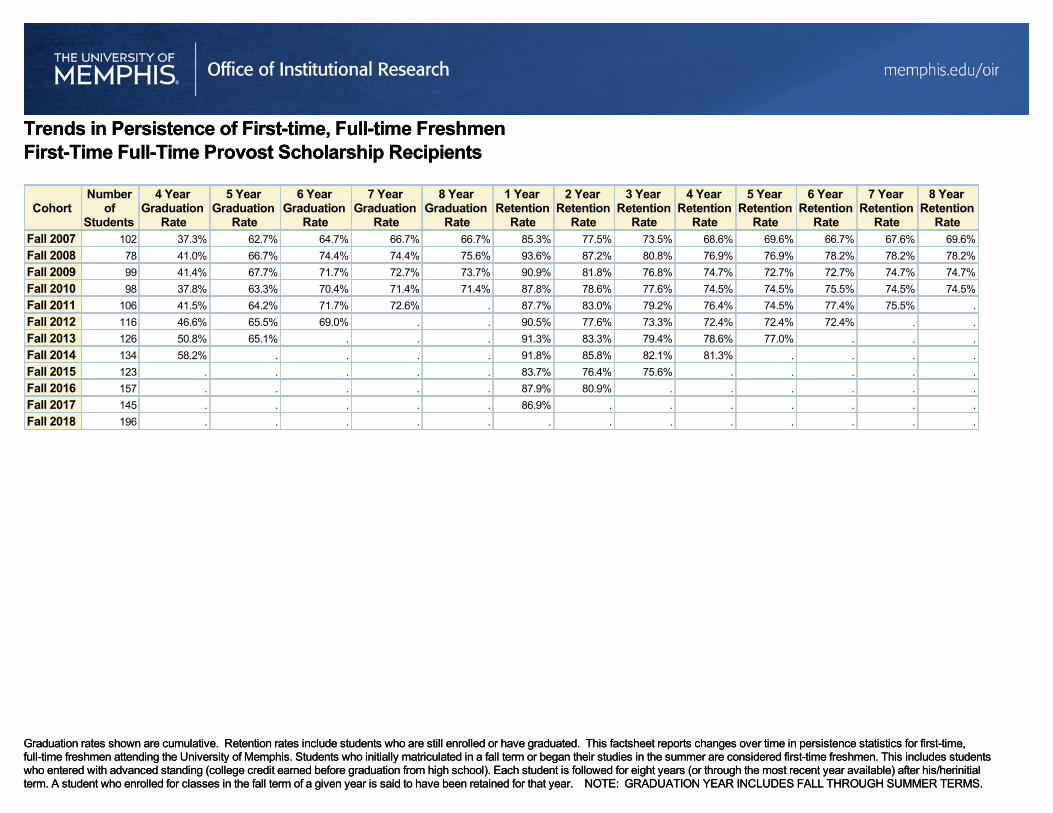
Trends in Persistence of First-time, Full-time FreshmenFirst-Time Full-Time Provost Scholarship Recipients
Graduation rates shown are cumulative. Retention rates include students who are still enrolled or have graduated. This factsheet reports changes over time in persistence statistics for first-time,full-time freshmen attending the University of Memphis. Students who initially matriculated in a fall term or began their studies in the summer are considered first-time freshmen. This includes studentswho entered with advanced standing (college credit earned before graduation from high school). Each student is followed for eight years (or through the most recent year available) after his/herinitialterm. A student who enrolled for classes in the fall term of a given year is said to have been retained for that year. NOTE: GRADUATION YEAR INCLUDES FALL THROUGH SUMMER TERMS.
Trends in Persistence of First-time, Full-time FreshmenFirst-Time Full-Time Provost Scholarship Recipients
CohortNumber
ofStudents
4 YearGraduation
Rate
5 YearGraduation
Rate
6 YearGraduation
Rate
7 YearGraduation
Rate
8 YearGraduation
Rate
1 YearRetention
Rate
2 YearRetention
Rate
3 YearRetention
Rate
4 YearRetention
Rate
5 YearRetention
Rate
6 YearRetention
Rate
7 YearRetention
Rate
8 YearRetention
RateFall 2007 102 37.3% 62.7% 64.7% 66.7% 66.7% 85.3% 77.5% 73.5% 68.6% 69.6% 66.7% 67.6% 69.6%
Fall 2008 78 41.0% 66.7% 74.4% 74.4% 75.6% 93.6% 87.2% 80.8% 76.9% 76.9% 78.2% 78.2% 78.2%
Fall 2009 99 41.4% 67.7% 71.7% 72.7% 73.7% 90.9% 81.8% 76.8% 74.7% 72.7% 72.7% 74.7% 74.7%
Fall 2010 98 37.8% 63.3% 70.4% 71.4% 71.4% 87.8% 78.6% 77.6% 74.5% 74.5% 75.5% 74.5% 74.5%
Fall 2011 106 41.5% 64.2% 71.7% 72.6% . 87.7% 83.0% 79.2% 76.4% 74.5% 77.4% 75.5% .
Fall 2012 116 46.6% 65.5% 69.0% . . 90.5% 77.6% 73.3% 72.4% 72.4% 72.4% . .
Fall 2013 126 50.8% 65.1% . . . 91.3% 83.3% 79.4% 78.6% 77.0% . . .
Fall 2014 134 58.2% . . . . 91.8% 85.8% 82.1% 81.3% . . . .
Fall 2015 123 . . . . . 83.7% 76.4% 75.6% . . . . .
Fall 2016 157 . . . . . 87.9% 80.9% . . . . . .
Fall 2017 145 . . . . . 86.9% . . . . . . .
Fall 2018 196 . . . . . . . . . . . . .

Graduation rates shown are cumulative. Retention rates include students who are still enrolled or have graduated. This factsheet reports changes over time in persistence statistics for first-time,full-time freshmen attending the University of Memphis. Students who initially matriculated in a fall term or began their studies in the summer are considered first-time freshmen. This includes studentswho entered with advanced standing (college credit earned before graduation from high school). Each student is followed for eight years (or through the most recent year available) after his/herinitialterm. A student who enrolled for classes in the fall term of a given year is said to have been retained for that year. NOTE: GRADUATION YEAR INCLUDES FALL THROUGH SUMMER TERMS.
Trends in Persistence of First-time, Full-time FreshmenFirst-Time Full-Time Deans Scholarship Recipients
CohortNumber
ofStudents
4 YearGraduation
Rate
5 YearGraduation
Rate
6 YearGraduation
Rate
7 YearGraduation
Rate
8 YearGraduation
Rate
1 YearRetention
Rate
2 YearRetention
Rate
3 YearRetention
Rate
4 YearRetention
Rate
5 YearRetention
Rate
6 YearRetention
Rate
7 YearRetention
Rate
8 YearRetention
RateFall 2007 233 24.9% 51.1% 59.2% 61.8% 62.2% 80.3% 72.1% 68.7% 68.2% 63.5% 64.8% 64.4% 65.2%
Fall 2008 186 29.6% 55.4% 62.9% 65.1% 65.6% 80.6% 69.9% 67.2% 67.2% 66.7% 67.2% 67.7% 67.2%
Fall 2009 234 26.1% 51.3% 56.0% 59.8% 61.1% 83.3% 73.9% 65.0% 62.4% 64.1% 62.8% 63.2% 63.2%
Fall 2010 260 37.3% 61.5% 66.5% 68.8% 69.6% 84.6% 79.6% 75.8% 71.5% 72.3% 71.9% 71.9% 71.9%
Fall 2011 218 43.1% 63.8% 72.0% 72.5% . 89.4% 79.8% 79.4% 75.7% 75.7% 75.2% 77.1% .
Fall 2012 254 34.3% 55.9% 61.4% . . 84.6% 74.0% 68.9% 65.4% 66.1% 66.1% . .
Fall 2013 326 42.0% 63.2% . . . 83.1% 78.8% 74.5% 71.8% 71.5% . . .
Fall 2014 289 45.0% . . . . 85.5% 76.5% 69.9% 68.2% . . . .
Fall 2015 324 . . . . . 88.9% 81.5% 76.5% . . . . .
Fall 2016 368 . . . . . 82.6% 75.5% . . . . . .
Fall 2017 343 . . . . . 85.4% . . . . . . .
Fall 2018 389 . . . . . . . . . . . . .
Graduation rates shown are cumulative. Retention rates include students who are still enrolled or have graduated. This factsheet reports changes over time in persistence statistics for first-time,full-time freshmen attending the University of Memphis. Students who initially matriculated in a fall term or began their studies in the summer are considered first-time freshmen. This includes studentswho entered with advanced standing (college credit earned before graduation from high school). Each student is followed for eight years (or through the most recent year available) after his/herinitialterm. A student who enrolled for classes in the fall term of a given year is said to have been retained for that year. NOTE: GRADUATION YEAR INCLUDES FALL THROUGH SUMMER TERMS.
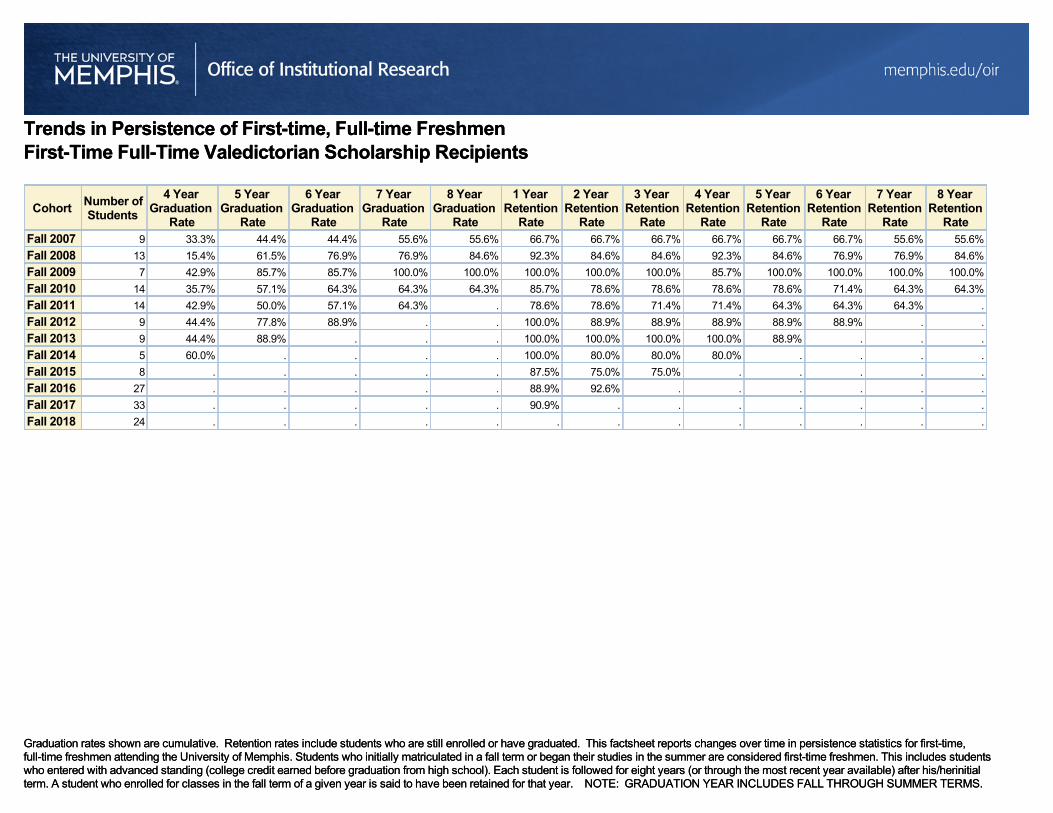
Trends in Persistence of First-time, Full-time FreshmenFirst-Time Full-Time Valedictorian Scholarship Recipients
Graduation rates shown are cumulative. Retention rates include students who are still enrolled or have graduated. This factsheet reports changes over time in persistence statistics for first-time,full-time freshmen attending the University of Memphis. Students who initially matriculated in a fall term or began their studies in the summer are considered first-time freshmen. This includes studentswho entered with advanced standing (college credit earned before graduation from high school). Each student is followed for eight years (or through the most recent year available) after his/herinitialterm. A student who enrolled for classes in the fall term of a given year is said to have been retained for that year. NOTE: GRADUATION YEAR INCLUDES FALL THROUGH SUMMER TERMS.
Trends in Persistence of First-time, Full-time FreshmenFirst-Time Full-Time Valedictorian Scholarship Recipients
CohortNumber ofStudents
4 YearGraduation
Rate
5 YearGraduation
Rate
6 YearGraduation
Rate
7 YearGraduation
Rate
8 YearGraduation
Rate
1 YearRetention
Rate
2 YearRetention
Rate
3 YearRetention
Rate
4 YearRetention
Rate
5 YearRetention
Rate
6 YearRetention
Rate
7 YearRetention
Rate
8 YearRetention
RateFall 2007 9 33.3% 44.4% 44.4% 55.6% 55.6% 66.7% 66.7% 66.7% 66.7% 66.7% 66.7% 55.6% 55.6%
Fall 2008 13 15.4% 61.5% 76.9% 76.9% 84.6% 92.3% 84.6% 84.6% 92.3% 84.6% 76.9% 76.9% 84.6%
Fall 2009 7 42.9% 85.7% 85.7% 100.0% 100.0% 100.0% 100.0% 100.0% 85.7% 100.0% 100.0% 100.0% 100.0%
Fall 2010 14 35.7% 57.1% 64.3% 64.3% 64.3% 85.7% 78.6% 78.6% 78.6% 78.6% 71.4% 64.3% 64.3%
Fall 2011 14 42.9% 50.0% 57.1% 64.3% . 78.6% 78.6% 71.4% 71.4% 64.3% 64.3% 64.3% .
Fall 2012 9 44.4% 77.8% 88.9% . . 100.0% 88.9% 88.9% 88.9% 88.9% 88.9% . .
Fall 2013 9 44.4% 88.9% . . . 100.0% 100.0% 100.0% 100.0% 88.9% . . .
Fall 2014 5 60.0% . . . . 100.0% 80.0% 80.0% 80.0% . . . .
Fall 2015 8 . . . . . 87.5% 75.0% 75.0% . . . . .
Fall 2016 27 . . . . . 88.9% 92.6% . . . . . .
Fall 2017 33 . . . . . 90.9% . . . . . . .
Fall 2018 24 . . . . . . . . . . . . .
Graduation rates shown are cumulative. Retention rates include students who are still enrolled or have graduated. This factsheet reports changes over time in persistence statistics for first-time,full-time freshmen attending the University of Memphis. Students who initially matriculated in a fall term or began their studies in the summer are considered first-time freshmen. This includes studentswho entered with advanced standing (college credit earned before graduation from high school). Each student is followed for eight years (or through the most recent year available) after his/herinitialterm. A student who enrolled for classes in the fall term of a given year is said to have been retained for that year. NOTE: GRADUATION YEAR INCLUDES FALL THROUGH SUMMER TERMS.
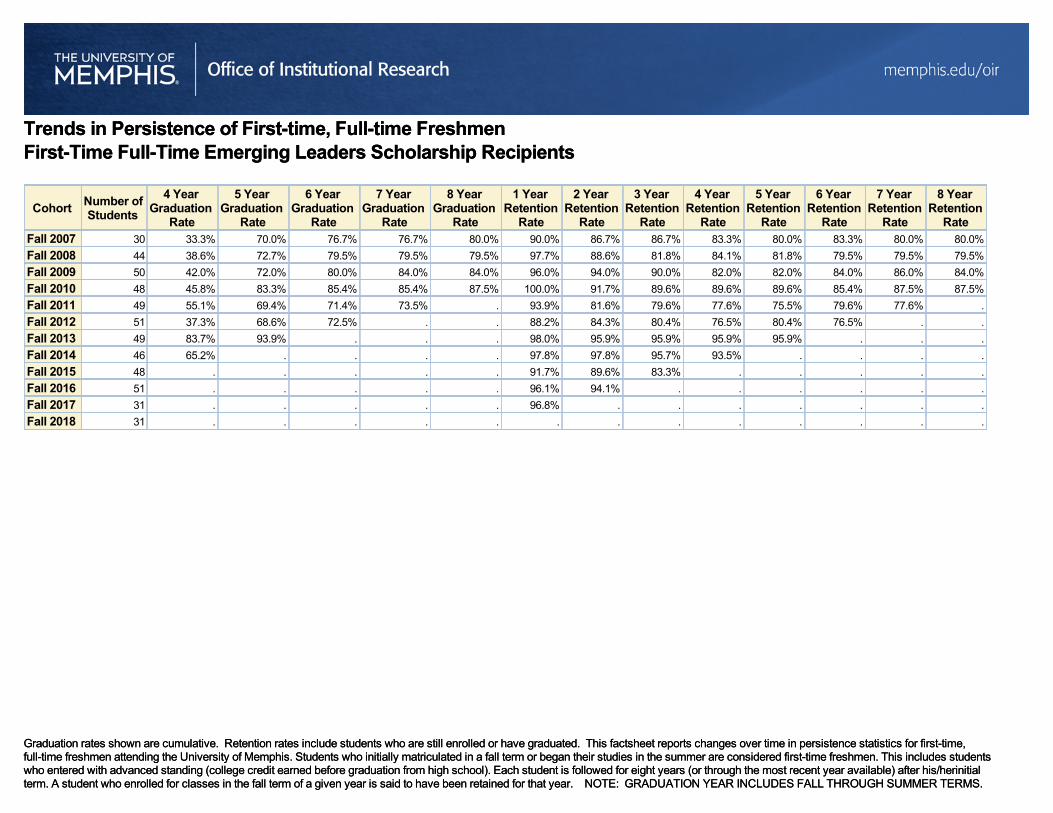
Trends in Persistence of First-time, Full-time FreshmenFirst-Time Full-Time Emerging Leaders Scholarship Recipients
Graduation rates shown are cumulative. Retention rates include students who are still enrolled or have graduated. This factsheet reports changes over time in persistence statistics for first-time,full-time freshmen attending the University of Memphis. Students who initially matriculated in a fall term or began their studies in the summer are considered first-time freshmen. This includes studentswho entered with advanced standing (college credit earned before graduation from high school). Each student is followed for eight years (or through the most recent year available) after his/herinitialterm. A student who enrolled for classes in the fall term of a given year is said to have been retained for that year. NOTE: GRADUATION YEAR INCLUDES FALL THROUGH SUMMER TERMS.
Trends in Persistence of First-time, Full-time FreshmenFirst-Time Full-Time Emerging Leaders Scholarship Recipients
CohortNumber ofStudents
4 YearGraduation
Rate
5 YearGraduation
Rate
6 YearGraduation
Rate
7 YearGraduation
Rate
8 YearGraduation
Rate
1 YearRetention
Rate
2 YearRetention
Rate
3 YearRetention
Rate
4 YearRetention
Rate
5 YearRetention
Rate
6 YearRetention
Rate
7 YearRetention
Rate
8 YearRetention
RateFall 2007 30 33.3% 70.0% 76.7% 76.7% 80.0% 90.0% 86.7% 86.7% 83.3% 80.0% 83.3% 80.0% 80.0%
Fall 2008 44 38.6% 72.7% 79.5% 79.5% 79.5% 97.7% 88.6% 81.8% 84.1% 81.8% 79.5% 79.5% 79.5%
Fall 2009 50 42.0% 72.0% 80.0% 84.0% 84.0% 96.0% 94.0% 90.0% 82.0% 82.0% 84.0% 86.0% 84.0%
Fall 2010 48 45.8% 83.3% 85.4% 85.4% 87.5% 100.0% 91.7% 89.6% 89.6% 89.6% 85.4% 87.5% 87.5%
Fall 2011 49 55.1% 69.4% 71.4% 73.5% . 93.9% 81.6% 79.6% 77.6% 75.5% 79.6% 77.6% .
Fall 2012 51 37.3% 68.6% 72.5% . . 88.2% 84.3% 80.4% 76.5% 80.4% 76.5% . .
Fall 2013 49 83.7% 93.9% . . . 98.0% 95.9% 95.9% 95.9% 95.9% . . .
Fall 2014 46 65.2% . . . . 97.8% 97.8% 95.7% 93.5% . . . .
Fall 2015 48 . . . . . 91.7% 89.6% 83.3% . . . . .
Fall 2016 51 . . . . . 96.1% 94.1% . . . . . .
Fall 2017 31 . . . . . 96.8% . . . . . . .
Fall 2018 31 . . . . . . . . . . . . .
Graduation rates shown are cumulative. Retention rates include students who are still enrolled or have graduated. This factsheet reports changes over time in persistence statistics for first-time,full-time freshmen attending the University of Memphis. Students who initially matriculated in a fall term or began their studies in the summer are considered first-time freshmen. This includes studentswho entered with advanced standing (college credit earned before graduation from high school). Each student is followed for eight years (or through the most recent year available) after his/herinitialterm. A student who enrolled for classes in the fall term of a given year is said to have been retained for that year. NOTE: GRADUATION YEAR INCLUDES FALL THROUGH SUMMER TERMS.
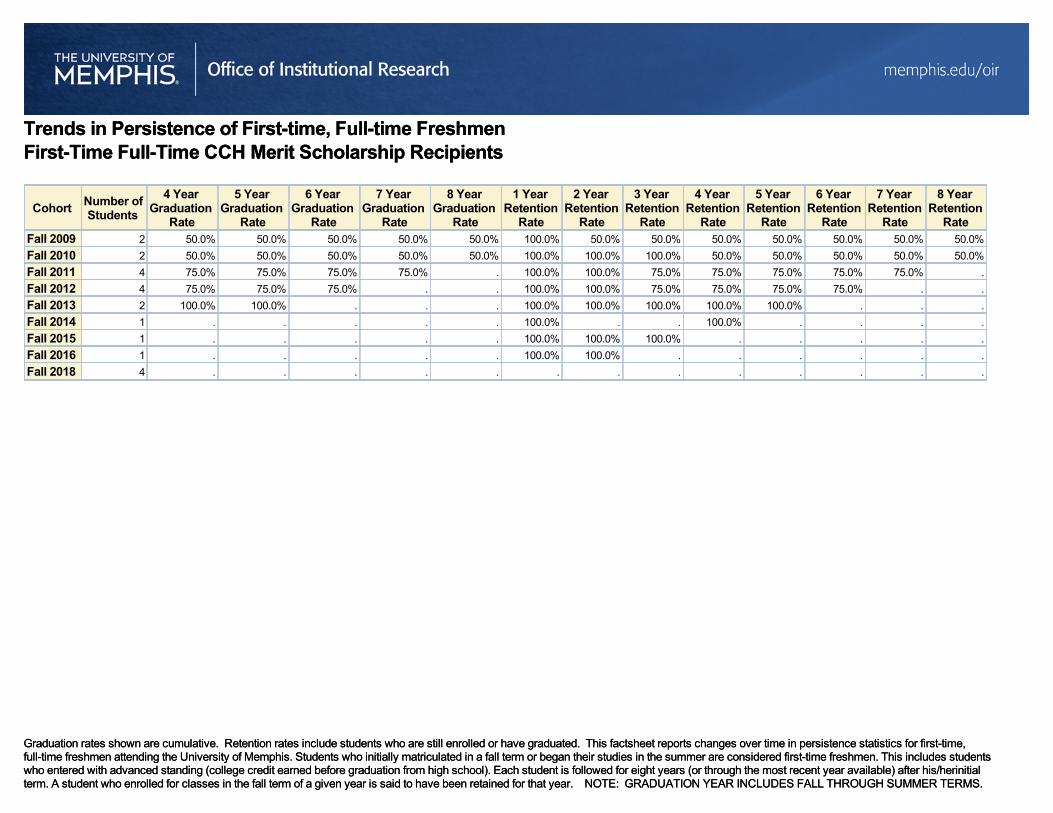
Trends in Persistence of First-time, Full-time FreshmenFirst-Time Full-Time CCH Merit Scholarship Recipients
Graduation rates shown are cumulative. Retention rates include students who are still enrolled or have graduated. This factsheet reports changes over time in persistence statistics for first-time,full-time freshmen attending the University of Memphis. Students who initially matriculated in a fall term or began their studies in the summer are considered first-time freshmen. This includes studentswho entered with advanced standing (college credit earned before graduation from high school). Each student is followed for eight years (or through the most recent year available) after his/herinitialterm. A student who enrolled for classes in the fall term of a given year is said to have been retained for that year. NOTE: GRADUATION YEAR INCLUDES FALL THROUGH SUMMER TERMS.
Trends in Persistence of First-time, Full-time FreshmenFirst-Time Full-Time CCH Merit Scholarship Recipients
CohortNumber ofStudents
4 YearGraduation
Rate
5 YearGraduation
Rate
6 YearGraduation
Rate
7 YearGraduation
Rate
8 YearGraduation
Rate
1 YearRetention
Rate
2 YearRetention
Rate
3 YearRetention
Rate
4 YearRetention
Rate
5 YearRetention
Rate
6 YearRetention
Rate
7 YearRetention
Rate
8 YearRetention
RateFall 2009 2 50.0% 50.0% 50.0% 50.0% 50.0% 100.0% 50.0% 50.0% 50.0% 50.0% 50.0% 50.0% 50.0%
Fall 2010 2 50.0% 50.0% 50.0% 50.0% 50.0% 100.0% 100.0% 100.0% 50.0% 50.0% 50.0% 50.0% 50.0%
Fall 2011 4 75.0% 75.0% 75.0% 75.0% . 100.0% 100.0% 75.0% 75.0% 75.0% 75.0% 75.0% .
Fall 2012 4 75.0% 75.0% 75.0% . . 100.0% 100.0% 75.0% 75.0% 75.0% 75.0% . .
Fall 2013 2 100.0% 100.0% . . . 100.0% 100.0% 100.0% 100.0% 100.0% . . .
Fall 2014 1 . . . . . 100.0% . . 100.0% . . . .
Fall 2015 1 . . . . . 100.0% 100.0% 100.0% . . . . .
Fall 2016 1 . . . . . 100.0% 100.0% . . . . . .
Fall 2018 4 . . . . . . . . . . . . .