Embed Size (px)
Citation preview
O*NET or NOT?
1
O*NET or NOT?
Adequacy of the O*NET system’s rater and format choices
Eran Hollander
Thesis submitted to the Faculty of the Virginia Polytechnic Institute and State
University in partial fulfillment of the requirements for the degree of
Master of Science
In
Industrial & Organizational Psychology
R.J. Harvey, Chair
John Donovan
Morrie Mullins
October 19, 2001
Blacksburg, Virginia
Keywords: rating scale, NBADS, O*NET, rating bias, accuracy, self appraisal
Copyright 2001, Eran Hollander
O*NET or NOT?
2
O*NET or NOT?
Adequacy of the O*NET system’s rater and format choices
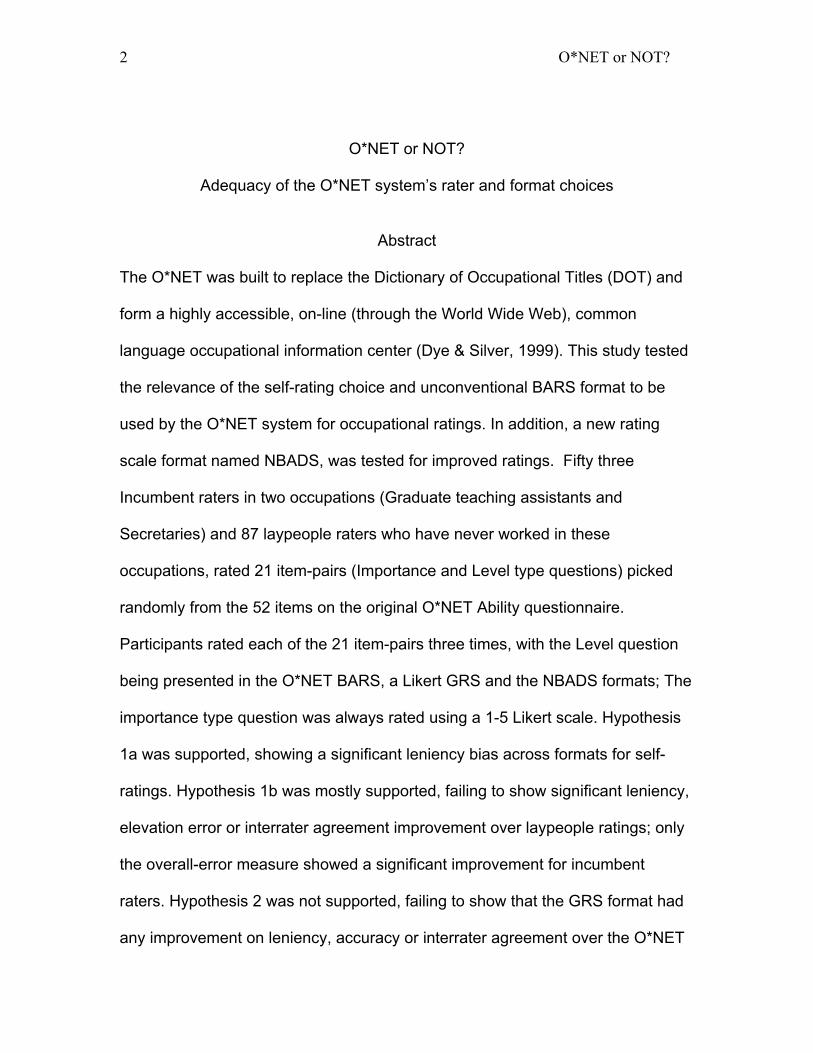
Abstract
The O*NET was built to replace the Dictionary of Occupational Titles (DOT) and
form a highly accessible, on-line (through the World Wide Web), common
language occupational information center (Dye & Silver, 1999). This study tested
the relevance of the self-rating choice and unconventional BARS format to be
used by the O*NET system for occupational ratings. In addition, a new rating
scale format named NBADS, was tested for improved ratings. Fifty three
Incumbent raters in two occupations (Graduate teaching assistants and
Secretaries) and 87 laypeople raters who have never worked in these
occupations, rated 21 item-pairs (Importance and Level type questions) picked
randomly from the 52 items on the original O*NET Ability questionnaire.
Participants rated each of the 21 item-pairs three times, with the Level question
being presented in the O*NET BARS, a Likert GRS and the NBADS formats; The
importance type question was always rated using a 1-5 Likert scale. Hypothesis
1a was supported, showing a significant leniency bias across formats for self-
ratings. Hypothesis 1b was mostly supported, failing to show significant leniency,
elevation error or interrater agreement improvement over laypeople ratings; only
the overall-error measure showed a significant improvement for incumbent
raters. Hypothesis 2 was not supported, failing to show that the GRS format had
any improvement on leniency, accuracy or interrater agreement over the O*NET
O*NET or NOT?
3
BARS format. Hypothesis 3a was supported, showing significant leniency
reduction, accuracy error reduction and higher interrater agreement using the
NBADS format over the GRS format. In a similar sense, hypothesis 3b was
partially supported, showing reduction in leniency effect and higher agreement
using the NBADS format over the O*NET BARS format. Finally, hypothesis 4
was mostly supported, showing hardly any significant differences in the ratings of
the Importance type question across the three format sessions, strengthening the
idea that no other interfering variables have caused the format sessions’
differences. Implications of the results are discussed.
O*NET or NOT?
4
Abstract ................................................................................................................ 2
List of Tables and Figures .................................................................................... 6
Acknowledgment.................................................................................................. 8
Introduction .......................................................................................................... 9
The O*NET .................................................................................................................. 10 Developing and field-testing the content model. ................................................... 12 Limitations of past O*NET research. ....................................................................... 19 Self-Appraisal .............................................................................................................. 20 Rating Biases, Accuracy and Interrater Agreement.............................................. 26 Rwg- Interrater Agreement. ...................................................................................... 31 Rating Scales .............................................................................................................. 33
Method ............................................................................................................... 46
Participants .................................................................................................................. 46 Independent Variables ............................................................................................... 47 Dependent Variables ................................................................................................. 47 Procedures .................................................................................................................. 47 Statistical Configurations ........................................................................................... 49
Results ............................................................................................................... 51
Leniency Effect ........................................................................................................... 55 Incumbents’ Expertise Added Value ....................................................................... 56 Scale Formats Comparisons .................................................................................... 60 Individual Items ........................................................................................................... 64 Homogeneity of Variance .......................................................................................... 70
Discussion.......................................................................................................... 71
Self-Rating Relevancy ............................................................................................... 71 Scale Formats ............................................................................................................. 75 Research limitations ................................................................................................... 80 Future Research ......................................................................................................... 80
Bibliography ....................................................................................................... 83
Appendix A: O*NET BARS’ Level type question examples................................ 92
Appendix B: The Three Rating Scale Formats ................................................... 93
Appendix C: Rating Format Instructions For Participants................................... 94
O*NET or NOT?
5
Appendix D: Introduction Pages......................................................................... 98
Appendix E. The Ability Questionnaire Items Used By The O*NET System, and
The 21 Randomly Picked Items For The Study................................................ 101
Appendix F: Instructions between two scale format sessions .......................... 107
Appendix G. Individual Item Leniency Effects for O*NET BARS, GRS, NBADS
and Their Average, Arranged in Ascending Order By Average. ....................... 108
Appendix H. Individual Item Interrater Agreements for O*NET BARS, GRS,
NBADS and Their Average, Arranged in Ascending Order by Average. .......... 111
Vita................................................................................................................... 114
O*NET or NOT?
6
List of Tables and Figures
Figure 1: Normal distribution curve.............................................................................. 42
Figure 2: The NBADS Format ...................................................................................... 45
Figure B1. The O*NET BARS Format......................................................................... 93
Figure B2. The Discrete GRS Format. ........................................................................ 93
Figure B3. The NBADS Format.................................................................................... 93
Figure C1. The O*NET BARS Format Instruction Page. ......................................... 94
Figure C2. GRS Format Instruction Page. ................................................................. 95
Figure C3. The NBADS format Instruction Page....................................................... 96
Figure D1. General Instructions ................................................................................... 98
Figure D2. Importance of Study explanation and Occupation Identification ......... 99
Figure D3. Background Information questionnaire ................................................. 100
Figure F: Instructions between two scale format sessions .................................... 107
Table 1:Global ANOVA for Rater type, Items, Occupations and Formats for The
Level Type Question ................................................................................... 53
Table 2:General ANOVA for Rater type, Items, Occupations and Formats For
The Importance Type Question................................................................... 54
Table 3:Leniency/Severity Effect of Incumbent Ratings for the Different Formats
and Question Types. ................................................................................... 56
Table 4:Convergent Validity Differencesa, Interrater Agreement and Leniency
Effects Between Incumbents and Laypeople Ratings by Scale Formats .... 58
O*NET or NOT?
7
Table 5:Leniency, Accuracy, Interrater Agreement Differences Between The
O*NET BARS, GRS and NBADS Formats for Ability Importance. .............. 62
Table 6:Leniency, Accuracy and Interrater Agreement Differences Between The
O*NET BARS, GRS and NBADS Formats for Ability Level......................... 63
Table 7: Effect Sizes of Leniency, Accuracy and Interrater Agreement Between
The O*NET BARS, GRS And NBADS Formats For Both Question Types.. 64
Table 8:Number of Significantly Lenient Items and Minimum and Maximum
leniency effects for Each Rating Scale Format for Both Question Types. ... 66
Table 9:Correlations Between Formats for The Leniency Effect of Items for Level
and Importance type questions. .................................................................. 67
Table 10:Interrater Agreement Indices for The Three Scale Formatsa ............... 69
Correlations Between Formats for The Interrater Agreement Coefficients of
Items. .......................................................................................................... 70
Table A: O*NET BARS’ Level type question examples...................................... 92
Table E: The Ability Questionnaire Items Used By The O*NET System, and The
21 Randomly Picked Items For The Study................................................ 101
Table E: Individual Item Leniency Effects for O*NET BARS, GRS, NBADS and
Their Average, Arranged in Ascending Order By Average........................ 108

O*NET or NOT?
8
Acknowledgment
I would like to thank my parents, Rachel and Dr. Ze’ev Hollander, for supporting
and encouraging me since day one to set, pursue and achieve the goals in my
life. Without them, this thesis would have never been written.
O*NET or NOT?
9
Introduction
The Occupational Information Network (O*NET) is presented both as a
“…database that uses a common language for collecting, describing and
presenting valid, reliable occupational information about work and…worker” and
“…a network of organizations improving, enhancing and disseminating the
information database.” (Dye & Silver, 1999). Whether it is considered a product
or a system, the O*NET was built to replace the Dictionary of Occupational Titles
(DOT) and form a highly accessible, on-line (through the World Wide Web),
common language occupational information center to every employee, employer,
consultant, student and others interested, from the comfort of the office, home,
school, library and career centers (Dye & Silver, 1999). Although still in the
developmental, research stage, it’s importance in helping Americans make
informed employment decisions is recognized and receives support by many,
such as union members, educators, entrepreneurs and human resource
professionals (Dye & Silver, 1999).
The purpose of this research was threefold. The first was to test the
relevance of rater choice used by the O*NET system by comparing measures of
accuracy and leniency bias to layperson measures. The second, to test the
unconventional BARS format used by the O*NET system by comparing it to a
more conventional scale format. Finally, a new rating scale format, called
NBADS, was tested to improve overall accuracy measures and reduce leniency
biases present in today’s appraisal scale formats.
O*NET or NOT?
10
Because the O*NET system is a new method of occupational information
apparatus, still under development, very few papers, none of which address the
new method of data collection, existed at the time of writing this paper. The data
collection method in the O*NET resembles job analysis somewhat, but is more
similar to performance appraisal and self appraisal of ability traits (e.g. DeNisi &
Shaw, 1977) in particular. Therefore, the literature pertaining to performance
appraisal, self-appraisal and its rating scale formats was used as the conceptual
framework for studying the new system.
The O*NET
History.
The Dictionary of Occupational Titles (DOT) was first published in 1939
and provided a framework for classifying jobs according to work performed, job
content and skill levels. Since the first publication, occupational information has
continued to be gathered and upgraded, and improved classification methods
developed. The last version of the DOT was published in 1991, providing
descriptive information for approximately 13,000 occupations (Dunnette, 1999).
The most common approach to collecting such data has relied on job analysts
who typically interview and observe incumbents in the work area in different ways
(e.g., critical incidents, behavior diary keeping) at the work site, and then analyze
the job to describe the relevant tasks, duties, work activities and knowledge,
skills, abilities and other characteristics (KSAO) (Dunnette, 1999). The DOT has
O*NET or NOT?
11
been used to aid in job analysis, vocational and career counseling and
organization planning (Dunnette, 1999).
Through the years, the DOT was supplemented by two additional
information systems: the Standard Occupational Classification (SOC) and the
Occupational Employment Statistic program (OES). Unfortunately, these systems
were conceptually and technically incompatible for the most part, making
information matching between them very difficult (Dunnette, 1999).
In the late 1980’s, the Department of Labor started realizing that changes in the
labor market and the workplace were putting a strain on the labor exchange
process (Dye & Silver, 1999). Because of global competition, rapid advancement
of technology and subsequent breath of numerous new occupations, it soon
became apparent that the inflation of occupation growth and change was far too
fast for the old method (DOT) to handle. The Secretary of Labor, appointed in
1990 an Advisory Panel for the Dictionary of Occupational Titles (APDOT) whose
task was to identify limitations of the DOT and specify the need for a new
comprehensive occupational information system (Dunnette, 1999).
The panel identified three main problems with the DOT-SOC-OES system.
The first was that the DOT is based on analysts’ description of job tasks, defined
at different levels of generality and on occupation specific information, thus
making it practically impossible to make cross job comparisons. The second
problem is the fact that the DOT is based mainly on the tasks workers perform,
containing only a number of items that measure interests, knowledge, skills and
other abilities needed to perform job tasks (KSAO). The third problem is the
O*NET or NOT?
12
inability of the tool to analyze job activities that are required at a reasonable
amount of time, relative to the rapid changes in technology and employment
patterns (Dunnette, 1999).
The new system to be built was to be capable of providing accurate
description of work characteristics and worker attributes, remain up-to-date in a
rapid, cost effective data collection method, and collect information in a way
allowing cross occupation comparison between occupations and occupation
families (Dunnette, 1999). This was meant to be accomplished by implementing
a fundamental change in the type of information collected and philosophy of
rating jobs (i.e. toward highly abstract, holistic ratings, and away from detailed,
task-based description of work).
Developing and field-testing the content model.
This fundamental change in philosophy and rating technology is manifest in
the content model of the O*NET, which was built according to the APDOT
recommendations and the desires of the DOL (e.g., Dye & Silver, 1999). This
model is organized into six major dimensions designed to make it possible to
meaningfully compare across jobs by defining and describing them in terms of
similarities and differences they display (Mumford & Peterson, 1999). The
dimensions are:
1. Worker characteristics- the enduring characteristics that might affect
performance and ability to acquire knowledge and skills required for an
effective work performance. It includes abilities, occupational values and
interests and work styles (O*NET site, 2000; Mumford & Peterson, 1999).
O*NET or NOT?
13
2. Worker requirements- a category of descriptors referring to work-related
attributes acquired/developed through experience and education. This
dimension includes the basic skills, cross-functional skills, knowledge and
educations necessary (O*NET site, 2000; Mumford & Peterson, 1999).
3. Experience requirements- these are the requirements related to previous
activities linked to certain types of work activities and includes training,
experience and licensure of the incumbent (O*NET site, 2000; Mumford &
Peterson, 1999).
4. Occupational characteristics- variables that define and describe the
general characteristics of occupations that may influence occupational
requirements. This dimension includes generalized work activities, work
context and organizational context (O*NET site, 2000; Mumford &
Peterson, 1999).
5. Occupational requirements- a comprehensive set of variables or detailed
elements that describe what various occupations require. It includes
occupational knowledge, occupational skills, tasks, duties and
machines/tools/equipment needed (O*NET site, 2000; Mumford &
Peterson, 1999).
6. Occupation specific information- the last dimension reflects variables or
other content model elements in terms of selected or specific occupations
and includes labor market information, occupational outlook and wages
(O*NET site, 2000; Mumford & Peterson, 1999).
O*NET or NOT?
14
As Messick (1995) pointed out, selecting a particular rating scale should be
based on the nature of the variables used and types of inferences drawn.
Selection of rating scales in the O*NET was based upon “…(a) the key
manifestation of the variable on people’s jobs, (b) the feasibility of applying the
scale across occupations, (c) the usefulness of the descriptive information
provided, (d) the appropriateness of the scale for observational ratings, and (e)
the available evidence bearing on the reliability and validity of the resulting
descriptive information (Friedman & Harvey, 1986; Harvey & Lozada-Larsen,
1988).” (Peterson et al., 1999).
Of particular interest to the present study, the O*NET’s developers
decided to use untrained, volunteer job incumbents as the raters to be used in
the final “operational” stage of O*NET development and deployment. This
decision stands in sharp contrast to the approach historically taken by the DOT,
which relied entirely on data collection and ratings being performed by highly
trained, professional occupational analysts in the employ of the DOL. In support
of this decision, the O*NET developers have argued that the O*NET does not
provide any overt motive for faking, hence incumbents should be able to provide
accurate job ratings, and at much less cost than that required to collect and
maintain the DOT. Studies performed by Fleishman and Mumford (1988) and
Peterson et al. (1999) claimed to have found no significant differences between
job ratings provided by occupational analysts, supervisors or incumbents when
no overt motive for faking was present, a finding that presumably supports the
operational use of actual incumbents to collect the O*NET database. In addition,
O*NET or NOT?
15
the authors have suggested that occupational descriptions provided by the
incumbents themselves provide the best information across all descriptor
domains (Peterson et al., 1999). For example, employees sometimes possess
job information that is unknown to their supervisor due to situations where the
supervisor is not present when they are performed. In other times, the supervisor
is not aware of important aspects of the processes taking place, or the range of
experience and skills an incumbent has to, because the job is loosely structured
and highly interactive with external contacts, demonstrate (Primoff, 1980).
During the process of field-testing the content model, the initial database
used to identify potential incumbents who could provide ratings of their jobs
consisted of 2160 establishments in the United States, supplied by Dun and
Bradstreet. After the removal of establishments according to specific
characteristics such as size, establishments not having the tested occupations,
and other characteristics, incumbents were picked randomly for participation
(Peterson et al., 1999). Even though the goal was to collect field-test data from
30 incumbents for each of 70 occupational titles tested, a very low response rate
(27%) was obtained. In reality, only 29 occupations were pilot tested, from 138
establishments, having four respondents or more (a sample size considered
adequate to perform statistical calculations on [Peterson et al. 1999, p. 46;
Mumford et al, 1999, p. 58]). Most respondents had six or more years of
experience on their current jobs (Mumford et al., 1999).
In developing the rating scales, a number of steps were taken to help
ensure reliability and validity of the information: (a) scales constructed used
O*NET or NOT?
16
operational, not technical, definitions, (b) the definitions along with the scales
were administered to 250 incumbents, (c) experienced occupational analysts
reviewed the rating instructions, labels, definitions and anchors for clarity,
readability and appropriateness in describing people’s jobs, and (d) each skill
was defined in simple English (Peterson et al., 1999). Level ratings (i.e. amount
of item needed to perform job tasks) were obtained, using a 7-point behaviorally
anchored rating scale (BARS). Finally, Ratings on a 5-point Likert scale indicated
the importance of each to job performance (Mumford et al., 1999).
A critical assumption underlying the O*NET is that incumbents can
accurately appraise jobs on abstract dimensions, provided they are defined in a
straightforward fashion and that concrete examples are given (Mumford et al,
1999). During the field test, the median interrater agreement coefficient obtained
was 0.84, and level vs. importance ratings displayed a very high correlation of
0.95, meaning that a highly required skill was generally regarded as important to
performance (Mumford et al., 1999). Unfortunately, indices of simple interrater
agreement or “reliability” gives a potentially misleading view of accuracy
(Chronbach, 1955). A side from an aggregated bias, which can show high
agreement but low accuracy, the range of the rating scale, if too wide for relevant
use (has anchors that are outside the useable bounds), can greatly inflate an
interrater agreement coefficient. In my view, it would be highly preferable to
examine the specific components of accuracy, rather than focus entirely on
global agreement statistics. Validity wise, the O*NET field-test study authors

O*NET or NOT?
17
claim to have found discriminant validity between the different skills and skill
families (Mumford et al, 1999).
In contrast, I contended that a more important index of validity or ratings
quality in the context of the current discussion would involve a comparison
between the analysts’ and incumbents’ ratings, both across and within
occupations, that focuses on level based comparisons (not simply correlational
indices that are sensitive to only relative profile shape, and not profile variability
or level). That is, such analyses would indicate whether the use of incumbents to
collect the operational database contained in the O*NET was a sound choice (i.e.
if incumbents cannot consistently produce ratings that have both the same
pattern and level as seen among trained analysts, they cannot be considered to
be effective substitutes for trained analysts.) Although such a comparison
obviously does not answer the more general question of the validity of the ratings
made by the job analysts (an issue that clearly is deserving of study as well), it
follows that if incumbent raters are to be used in the “operational” O*NET then
one must first be able to demonstrate that they produce ratings that are
functionally interchangeable with those provided by analysts. If this can be
demonstrated, then the subsequent, and perhaps even more important, question
of whether or not the analyst ratings are actually job-related and valid predictors
of job performance can be addressed. However, if analysts and incumbents
cannot be shown to be functionally interchangeable, there is little point in
pursuing the validity question with incumbent ratings (unless one wishes to
postulate that untrained, questionably-motivated incumbents are more likely to be
O*NET or NOT?
18
able to produce accurate and valid ratings than professional, trained, job
analysts, which does not seem to be an especially plausible proposition).
For some reason, most likely low sample sizes, in the description of the field-test
results, no within-occupational comparisons were reported, and only
comparisons across occupations (through basic and cross functional skills) were
considered. Specifically, t and F tests were conducted between the two-rater
groups (i.e., incumbents versus analysts) in order to measure the differences in
the level of skill ratings. Results indicated that analysts’ ratings were on average
a full-scale point lower than incumbents’ ratings (Mumford et al., 1999). The
authors explained these differences by noting that “analysts indirectly make
ratings on a comparative basis, whereas incumbents are likely to focus on what
they know-their own job,…[and that]…analysts may see the job in the context of
other more demanding jobs, resulting in lower ratings. Incumbents… may focus
on the more salient and demanding parts of their jobs, resulting in somewhat
higher ratings.” (Mumford et al., 1999). Curiously, despite the existence of a full
scale-point absolute difference in ratings level between groups, the authors
concluded that the two groups’ ratings “…were not widely divergent….”, and that
the comparison appears “…to provide evidence for the convergent validity of the
descriptive information provided by our measures of job … requirements.”
(Mumfort et al, 1999). The O*NET authors are leaning on these conclusions in
their intention to switch expert raters to incubmbent raters.

O*NET or NOT?
19
Limitations of past O*NET research.
Although at first glance the field study results may look promising, and the
O*NET authors certainly gave the impression that the field-test was a success
(and that operational implementation could proceed), there are still some
important issues that I believe have been largely ignored, misinterpreted, or not
thoroughly examined in past O*NET research. These issues focus on the
validity and accuracy measures used in the field-test to evaluate the O*NET. Two
general problems will be discussed.
The first limitation is rater choice. Although supposedly, “convergent
validity” was found (i.e., when comparing the profiles of ratings provided by
incumbents versus analysts), and the authors claimed that the incumbent and
analyst groups were not very different from one another, the results suggest
otherwise. For example, the authors failed to mention that the smallest difference
between the groups in the “skills” section was 0.05 points out of eight (0.6%
difference from the analysts’ ‘true’ score), whereas the biggest difference was a
1.55 point difference out of eight (i.e., a 19.4% difference). These differences
point to both group rating asymmetry between skills, and a surprisingly large
magnitude of the differences when disagreement between the two groups was
seen. In the “knowledge” section, the smallest difference between the groups
was 0.08 points out of eight (1.1% difference), while the biggest difference was
2.51 points out of eight (35.9% difference). The authors attempted to explain the
global difference (1 point out of 8 on average, or 12.5% difference) using the
“objective” explanation of different points of view, etc., discussed above.
O*NET or NOT?
20
However, an extensive literature regarding the problems and usage of self-
appraisal scales exists, and the results of such studies generally lead to the
conclusion that caution should be used in most circumstances in which self-
ratings are employed.
A second limitation concerns the rating scale format that was picked for
the KSAO ratings. Although its developers have claimed to use a 7 point BARS
format for the O*NET KSAO rating scales, in my analysis, the O*NET scale
cannot be considered to be a traditional BARS scale. In particular, its behavior
anchors were not constructed according to typical BARS characteristics or
objectives, as originally proposed by Smith and Kendall (1963), and during the
field test, the O*NET BARS was not tested extensively for rating errors or
examined via accuracy-component measures that would be sensitive to level-
and variability-based disagreement between rater groups. In the following
sections, a more detailed examination of the self-appraisal and rating-format
research literature is presented.
Self-Appraisal
Self-appraisal involves the rating of one’s self for a particular purpose, be
it ability evaluation of performance, personnel selection, therapy outcome
research, or feedback. Although having some advantages over other sources of
rating information (e.g., supervisors, peers), self-appraisal can be an unreliable
tool in many cases, and affected greatly by many types of moderator variables.
Self-appraisal, according to Campbell and Lee (1988), can be viewed as a
four-step process, where one begins with beliefs and ideas concerning job
O*NET or NOT?
21
requirements and duties. These cognitions regulate one’s behavior on the job
and allow one, at some point, to judge how well the behavior had achieved the
desired results, and give oneself feedback (self-evaluation). There are three
types of constraints to this process, causing discrepancies between self and
supervisor. The first is “informational constraints,” where discrepancies result
from different cognitions about job requirements. The second is “cognitive
constraint,” where human information processing processes differ between the
two raters. The third is “affective constraints,” also called self-enhancement,
which suggests that some discrepancies are caused by psychological defense
mechanisms triggered to protect one’s self-concept (Campbell & Lee, 1988).
A big advantage to self appraisal is the unique information that can be
provided by the incumbent, due to direct experience over a long period of time,
making one quite knowledgeable about one’s abilities and performance level in
various situations (Levine, 1980). Often, employees possess job information that
is unknown to their supervisor due to situations where the supervisor is not
present when certain activities are performed. In other situations, the job is
loosely structured and highly interactive with external contacts, such that the
supervisor is not aware of important aspects of the processes taking place, or the
range of experience and skills an incumbent has to demonstrate (Primoff, 1980).
In addition, because employees have experience with themselves on all, or most,
of the performance dimensions used, their ratings may exhibit lower levels of
between-scale correlation and be less subject to the halo bias than other raters
(Thornton, 1980; for a counter argument see Hozbach, 1978).
O*NET or NOT?
22
The above are examples of the “informational constraints” discussed by
Campbell and Lee (1988). In contrast, self-verification is the motivation of people
to be consistent between their self-conceptions and new self-relevant
information. This consistent view of the self helps one feel control in the world.
The self-verification mechanism works regardless of positive or negative self-
concept (Sedikides & Strube, 1997). Following the rationale of this social-
cognitive mechanism, any comparison appraisal process should elicit self-
verification, thus being accurate and bias free. And indeed, a very effective use
of self-appraisal is as a feedback tool, where the rater, after self-evaluating,
discusses evaluations with a supervisor, as part of a feedback process, and/or
compares evaluations to a criterion. Farh et al. (1988), for example, found, that in
a self-appraisal based feedback process, ratings were highly congruent with
supervisor ratings. Leniency was similar on all dimensions and the convergent
validity obtained was significant. Mabe and West (1982) have conducted a meta-
analysis on the validity of self-evaluation of ability and discovered that two of the
most prominent variables which affect valid self-ratings are the rater’s
expectation that self-evaluation would be compared with criterion measures, and
instructions guaranteeing anonymity of the self-evaluation. Farh and Werbel
(1986) have found that under conditions with high expectation of validation, self-
appraisal is less lenient than under conditions of low expectation of validation.
Although useful as part of a feedback process, self-appraisal has many
potential faults when considered in the context of a system such as the O*NET;
these result mainly from the subjective, self-assessment that is taking place, the
O*NET or NOT?
23
potentially low perceived accountability, and similar factors. For example, the
rater could have conscious needs for faking an assessment (e.g., in order to get
a promotion or have the job ranked higher in a compensation system) as well as
unconscious, more basic needs of self-enhancement (e.g., to aggrandize the
activities of an otherwise unchallenging or mundane job). Along these lines, self-
enhancement is a defense mechanism whereby people are motivated to elevate
the positive view of their self-conceptualization, and protect self-concepts from
negative information. Control and sense of progress are important to individuals
because they are crucial to the basic desire for self-enhancement and self-
esteem (Sedikides & Strube, 1997). By increasing the good and decreasing the
bad, self-esteem would be expected to go up. In Thornton’s experiment (1968),
executives whose performance was lower had higher leniency (i.e., self-
enhanced more).
The leniency bias is derived from self-enhancement as well, and was
found to be very high, under certain conditions, in self-appraisal. Farh and Webel
(1986) have shown that self-appraisals conducted for administrative purposes
(e.g., grading) are likely to be more lenient than those used for non-
administrative purposes (e.g., research). Meyer (1980) showed that the average
self-appraisal of participants was at the 78th percentile. In other words, most
participants viewed their performance as above ¾ of the population. Thornton
(1968) found that executives of a large firm rated themselves higher than their
superiors did. Finally, Hozbach (1978), Thornton (1980) and Harris and
Scaubroeck (1988) have found self-appraisals tend to exhibit higher leniency
O*NET or NOT?
24
effects than both peer and supervisor evaluations. These studies illustrate the
“affective constraints” discussed previously.
Another potential determinant of accurate self-evaluation is job type.
Harris and Schaubroeck (1988) have found that self vs. supervisor and self vs.
peer evaluation correlations were lower among managerial/professional
employees than for blue-collar/service employees. They suggested that self-
enhancement is more likely to occur in ambiguous context (e.g., the
managerial/professional jobs) than in a well defined one (the blue-collar/service
jobs).
In summary, self-appraisal is a potentially very fragile and risky method of
getting performance information. In general terms, if the rater has expectations of
having the appraisal verified, compared, viewed by others, or any other way of
revealing the rater’s identity, the self-verification effect might well be dominant,
and the self-appraisal may tend to be more accurate and less lenient. However,
when there are no such expectations, self-enhancement may well take place,
thus rendering self-appraisal very problematic for performance accuracy ratings.
In order to understand the quality of self-evaluation information gathered by the
O*NET, one should focus on the extent to which conditions that would lead to a
situation of self-verification or self-enhancement cognitive process are likely to be
present. At present, the O*NET proposes to collect data from randomly assigned
incumbents, taken from random institutions, without collecting any type of
personal identification (name, social security number etc.) - In other words, a
situation of anonymity, with little or no comparison-expectation present.
O*NET or NOT?
25
According to Mabe and West’s meta-analysis (1982), validity of self-appraisal in
these cases would be expected to be low.
According to Peterson et al. (1999), “…the most powerful incentive of all
will be a highly useful O*NET system with multiple, tailored applications making
use of the O*NET database. These applications provide tangible evidence to
users of the ‘fruits of labor’ stemming from their cooperation in data collection.” In
other words, the importance of evaluation and the effect it will have on one’s own
occupation would be emphasized to create an incentive to participate in the
study. As mentioned, self-appraisals conducted for administrative purposes are
likely to be more lenient than those used for non-administrative purposes (Farh &
Werbel, 1986). However, such an incentive might very well increase the
likelihood that the participation becomes effectively administrative, and thus,
prone to faking, even though Peterson et al. (1999) hint there should not be a
covert need for faking.
Based on the above literature on self-ratings and the kind of conditions
that would likely be operative in the operational use of incumbents to collect
O*NET data, I advance the following hypothesis with respect to incumbent
versus analyst ratings on the O*NET scales:
Hypothesis 1a:
Self-evaluation ratings of an occupations’ item use and importance levels will be
significantly higher than the occupational ratings produced by expert analysts.
Common sense predicts that even if self raters are biased, they nevertheless
have some advantage, due to experience on the job, than laypeople who have
O*NET or NOT?
26
never worked in these occupations. However, it is my view that the subjectivity of
incumbents’ self-rating would bias results enough as to overrule any advantage
these raters may have had:
Hypothesis 1b:
Convergent validity, leniency effect and interrater agreement of self-evaluation
ratings of an occupation’s item use and importance level with experts’ ratings will
not be significantly higher than convergent validity of laypeople with experts’
ratings.
Rating Biases, Accuracy and Interrater Agreement
In addition to expected difficulties that might emerge if the O*NET were to
rely on unaccountable volunteers to self-rate their occupations, issues of format-
related effects and rating biases also need to be considered. The biases, or
effects, that have received the most research attention are typically the halo and
leniency/severity effect. Lack of accuracy, though not a “rating bias” per se, is
definitely also an issue in need of consideration.
Biases.
The halo effect can be defined as a tendency of raters to give similar
scores to a ratee across dimensions that are clearly distinct (Newcomb, 1931)
because of a pronounced characteristic (e.g., a salient behavior, a distinct
physical characteristic) that colors the ratings of each of the dimensions. Cooper
(1981) suggested that this bias is present in virtually every type of rating
instrument. The halo effect tends to eliminate the distinctive variance between
the measurements of different performance dimensions; in extreme cases, it is
O*NET or NOT?
27
as though the ratee had been measured on only one dimension. This was once
thought to hinder organizations from making an educated decision about workers
and their job performance (Cleveland, Murphy &, Williams, 1989) because there
was no way of examining the ratees across the desired dimensions. Today, a
distinction exists between valid (true) and invalid (illusory) halo effect (Murphy
and Cleveland, 1995). A valid halo is seen to occur when the behaviors being
rated, although distinct, are nevertheless correlated in reality. The illusory halo
effect is caused by a cognitive distortion on the part of the rater, and combines
with the true halo to create the observed degree of cross-dimension correlation
(Murphy & Cleveland, 1995).
The leniency/severity bias is typically viewed as the tendency of a rater to
be generous or severe in the evaluation of a ratee’s performance across all
dimensions (Cascio, 1998). The leniency/severity effect limits the range of the
evaluation scale, thus reducing the ability to discriminate between employees,
and making it difficult to make decisions based upon evaluation scores.
Unfortunately, one criticism of the typical conceptualization of the leniency bias is
that the true distribution of performance is almost always unknown, a fact that
makes it highly problematic to assess the degree to which a rater is consistently
rating higher or lower than the correct level.
Accuracy was erroneously thought of in the past to be highly correlated
with leniency and halo effects (Borman, 1979). In this context, “accuracy” was
implied by examining other statistical measures such as reliability, variance
among employee ratings and rating errors (Barrett et al, 1958; Borman &
O*NET or NOT?
28
Dunnette, 1975). Over time, it was realized that the average correlation between
rating errors and measures of accuracy was near zero (Murphy & Balzer, 1989),
and if at all, the mean correlation shown is small and negative (-0.09).
Accuracy.
The accuracy of a measurement describes the strength and kind of
relation between a set of measures and the “true” measures (Sulsky & Balzer,
1988). Reliability is presumed to be a necessary but not sufficient condition for
accuracy to occur (Sulsky & Balzer, 1988). Two distinct types of accuracy
measures, behavior and judgmental based, have been seen in the rating
literature (Murphy & Cleveland, 1995). Behavior based measures are simpler and
rely on a rater’s accurate recognition and description of specific behavior
incidents (Cardy & Krzystofiak, 1988). This type is limited in its application,
however, in that it relies on a rater’s recognition of a short list of incidents, and
does not incorporate any explicit evaluation of the behavior or cover the entire
performance domain. Although valuable in a more traditional job-analytic setting,
this view of accuracy is not especially useful in the context of a highly abstract,
judgment-laden rating task like the one that characterizes the O*NET. Therefore,
measures of accuracy in judgment have been more widely used. (Murphy &
Cleveland, 1995).
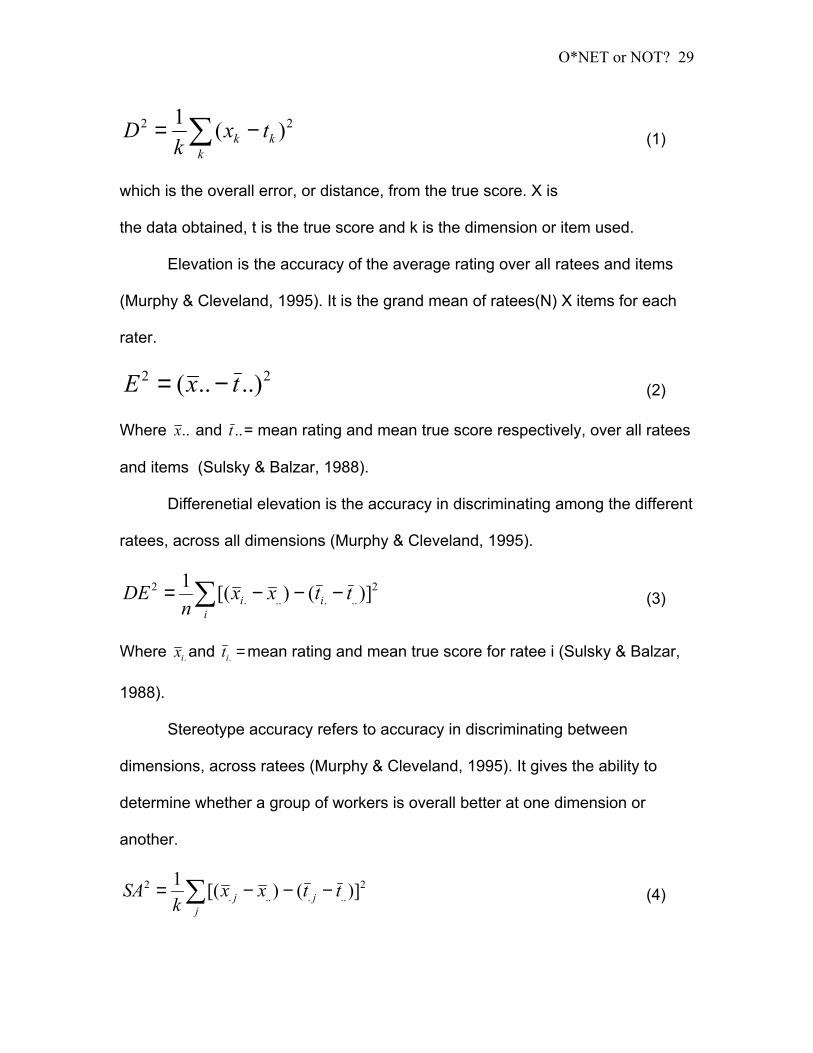
Chronbach (1955) recommended describing accuracy in four separate
components: (a) elevation, (b) differential elevation, (c) stereotype accuracy, and
(d) differential accuracy. He developed these measures from a more global
component of accuracy:
O*NET or NOT?
29
∑ −=k
kk txk
D 22 )(1 (1)
which is the overall error, or distance, from the true score. X is
the data obtained, t is the true score and k is the dimension or item used.
Elevation is the accuracy of the average rating over all ratees and items
(Murphy & Cleveland, 1995). It is the grand mean of ratees(N) X items for each
rater.
22 ..)..( txE −= (2)
Where ..x and ..t = mean rating and mean true score respectively, over all ratees
and items (Sulsky & Balzar, 1988).
Differenetial elevation is the accuracy in discriminating among the different
ratees, across all dimensions (Murphy & Cleveland, 1995).
∑ −−−=i
ii ttxxn
DE 2......
2 )]()[(1 (3)
Where .ix and =.it mean rating and mean true score for ratee i (Sulsky & Balzar,
1988).
Stereotype accuracy refers to accuracy in discriminating between
dimensions, across ratees (Murphy & Cleveland, 1995). It gives the ability to
determine whether a group of workers is overall better at one dimension or
another.
∑ −−−=j
jj ttxxk
SA 2......
2 )]()[(1 (4)
O*NET or NOT?
30
Where k= dimensions, jx. and jt. = mean rating and mean true score for item j
respectively (Sulsky & Balzer, 1988).
Differential accuracy refers to accuracy in detecting ratee differences in
dimensions of performance (Murphy & Cleveland, 1995). It is a comparison
between individual ratees and the individual dimensions.
∑∑ +−−−+−−=ij
jiijjiij ttttxxxxkn
DA 2........
2 )]()[(1 (5)
where tij = rating and true score for ratee i on item j. xi. and ti.= mean rating and
mean true score for ratee i. x.j and t.j= mean rating and mean true score for item j,
and x.. and t..=mean rating and mean true score, over all ratees and items.
(Sulsky & Balzer, 1988).
Accuracy has always been a problematic measure, in that its standard
against which it is conceptually defined (the “true” measure) cannot be easily
derived in a field study. One strategy is to define true scores as the expected
values of observations obtained from a particular population (Cronbach et al.,
1972; Lord & Novick, 1968); for example, by averaging the scores across raters
to form one score, which would be regarded as the true score for a given
dimension. This approach, however, suffers from practical difficulties in field
research, given that one usually does not have more than a few raters to be
evaluated by. The second, most widely used procedure for obtaining the “true”
scores was popularized by Borman in 1977 (Murphy & Cleveland, 1995). The
procedure uses multiple expert raters who evaluate the performance under the
best conditions possible. The more expertise the raters have in evaluation, being
O*NET or NOT?
31
aware of possible biases (e.g., I/O psychologists, graduate students), and the
more opportunity to observe the ratee in action (e.g., video, tape, written
documentation of conversation) the better. This method has shown convergent
and discriminant validity and high correlations with intended true scores (Murphy
& Cleveland, 1995).
Rwg- Interrater Agreement.
Interrater agreement (Rwg) is another measure which could help
determine accuracy, though one which does not involve the true rating score of
the target. It is defined as “the extent to which the different judges tend to make
exactly the same judgments about the rated subject.” (Lindell et al., 1999).
Initially and based on conceptions of reliability and validity, low agreement
between multi raters thought to have indicated unreliability (Bozeman, 1997).
Today, it is understood that raters from different status (such as supervisor, peer,
subordinate) are found to view a target’s performance differently from one
another (e.g., Zalesny & Kirsch, 1989). Thus, even though an agreement
coefficient may not be high, it is nevertheless valid and does not involve
reliability. As far as the ratings of the O*NET go, occupations are being rated by
the same level raters and the targets are occupations, not performance, thus an
expectation exists for a high agreement coefficient between raters.
The formula for Rwg is:
)/(1 22exwg Sr δ−= (6)
where Sx2 is the variance of judges’ ratings, and δ e
2 is the uniform distribution
(random) variance. Theoretically, the range of agreement is 0-1, where 0
O*NET or NOT?
32
meaning that the judges’ variance is no different than that of random ratings, and
1, meaning that there is 0 variance between judges. In reality, it is possible for
judges ratings to have an even higher variance than random ratings, thus having
a reality agreement range of –1 to +1 (Lindell et al., 1999). This would show, of
course, an undesirable agreement result, showing that random ratings provided a
better agreement than judges’ did, defeating the purpose of the rating.
One major problem with Rwg is a bias (such as halo or leniency), which
may affect all raters the same way, thus giving a high agreement coefficient, but
still lack accuracy. Therefore, only two meaningful information in the O*NET case
could be used from the Rwg; If relatively low Rwg is found, it would be possible
to conclude that incumbent raters are not expert raters of their own occupation.
High agreement combined with high Chronbach’s accuracy measures, could
support the notion that raters have rated in a more accurate, more informative
way. By itself, a high Rwg is meaningless, not giving enough information to
distinguish between a uniform bias among raters or an accurate depiction of
occupations.
Another problem, which has not been resolved among Rwg researchers,
is the influence of the range of the scale on the agreement, which can over-
inflate the interrater agreement coefficient. Using a scale range, where part of the
scale is never used (i.e. irrelevant, thus never rated), would create a high random
variance coefficient (the denominator in equation 6), which would create artificial
agreement.
O*NET or NOT?
33
Rating Scales
As noted, rating measures fall in two general categories: an objective and
a subjective one (Cascio, 1998). Objective measures are easily quantifiable, but
do not focus on the employee’s behavior, and therefore are not fit for many
evaluation purposes (Heneman, 1986). They may include production data (units
produced, errors committed), sales in dollars or some other form of an objective
measure. However, different variables that can affect this data beyond the
employee’s control and are usually not mentioned or even observed (e.g.,
competition, slow season, economic depression etc.) can shed positive or
negative light without justification during performance appraisal. Subjective
measures on the other hand, may attempt to measure a behavior, but because
they are dependent upon human judgments are vulnerable to biases, and
typically, to the extent that a behavior is rated at all, it tends to be much more
abstract than would be seen in the typical “observational accuracy” design. The
O*NET must collect data to indicate both required level and degree of importance
for each of the KSAO on which occupations are rated, which is clearly a
subjective rating task. The two prominent subjective rating formats used to date
are graphic rating scales (GRS) and behaviorally anchored rating scales (BARS).
Graphic rating scales (GRS).
The base of this method is a bar, with low and high absolute points at
either end. For rating, the bar can be continuous, having the rater put a check
mark on the line where desired (a distance check of the mark from an end point
is the configuration score). Alternatively, the bar can also be dissected into value
O*NET or NOT?
34
anchor points along the continuum. The value on the anchors can be numerical,
adjectival or behavioral in nature. It is claimed that the number of anchors on a
scale (bar) should be based on the objectives and purpose of the evaluation.
But, generally speaking, it is suggested that increases in reliability begin to level
off after five anchors, and that seven points are optimal for a scale (Lissitz and
Green, 1975).
The graphic rating scale method has been popular for over 75 years
despite the fact that the bias and accuracy issues discussed earlier may
represent a major concern. This scale format is very simple to understand, easily
constructed and implemented (Friedman & Cornelius, 1976), and relatively
inexpensive. The results from such a scale are standardized, thus susceptible to
comparisons between ratees, and are appealing to the rater (Friedman &
Cornelius, 1976). Today, many such scales are being presented on computers,
instead of a paper and pencil medium. The O*NET uses the GRS with five point
Likert anchors for its importance measure for each item, starting at 1-not
important, ending at 5-extremely important.
Behaviorally anchored rating scales (BARS).
In an attempt to reduce biases associated with the GRS, a new method of
appraising performance was devised by Smith & Kendall (1963). Although
perceived as a superior format over GRS format for some time, it is undecided,
today, which format is better (Parrill, 1998). In the BARS format, the bar is
typically arranged in a vertical manner. The anchors are a series of specific
behavioral descriptions that can potentially be observed in a particular job (critical
O*NET or NOT?
35
incidents both positive and negative), positioned at various heights on a graphical
scale, according to their effectiveness (Campbell et al, 1971). The whole
premise behind their method was to make a common frame of reference so that
raters would look for the same behaviors and interpret them in the same way
(Bernardin & Smith, 1981).
Thinking it could do away with biases in GRS, the BARS method became
very popular. Some studies did find it to suffer less halo (Keaveny & McGann,
1975; Tziner, 1984), less leniency, and higher inter-rater agreement (Tziner,
1984). However, Kingstrom and Bass (1981), in a critical analysis of studies
comparing BARS to other rating scales, have concluded that “…BARS and other
formats appear to differ relatively little (if at all) with regard to psychometric
characteristics (leniency, halo, inter-rater agreement, ratee discriminability,
validity and ‘accuracy’)”. Moreover, there were very small preference differences
for different rating scale formats. Other studies and meta-analysis support
Kingstrom and Bass’s notion (e.g., Gomez-Mejia, 1988; Landy & Farr, 1980).
The BARS approach, while apparently not improving the problems of biases
(although this is far from a firm conclusion, given the questionable means by
which rating “error” were operationalized in many of the earlier studies),
potentially adds some unique biases of its own. Difficulty in detecting similarities
between ratees’ observed performance and behavioral anchors (Borman, 1979),
which can cause a large amount of inference, makes it more likely that errors will
occur (Cascio, 1998). There is evidence indicating that anchors that are more
specific can actually serve to bias the rater to respond in a certain manner
O*NET or NOT?
36
(French-Lazovik & Gibson, 1984). Murphy and Constants (1987) suggest that
behavioral anchors can be a source of bias in ratings that may lead to biased
recall. Perhaps the most serious problems are the large amounts of time
required to develop the scales, as each scale needs to be built according to very
specific behaviors (Borman & Dunnette, 1975; Campbell et al, 1971; Landy &
Farr, 1980).
The O*NET system uses a BARS-type format for its rating scales to
collect KSAO and similar data on occupations and occupational requirements.
However, this choice is somewhat odd for the task. That is, the premise behind
the O*NET is to define a uniform, common language for occupational information
that will allow meaningful comparisons between dissimilar occupations. However,
the dimensions that are used, and their associated anchors, are drawn from a
wide range of occupations, which, by definition, will tend to make the anchors not
describe the specific behaviors that would characterize any given occupation.
Jacobs (1986) claimed that highly specific behavioral anchors (i.e., ones relevant
to the job in question being rated), perform more effectively than less specific
anchors. And indeed, a major strength of the original BARS concept was its
common frame of reference (i.e. the specific behaviors), which is clearly lacking
in the O*NET implementation of the BARS format (for O*NET BARS examples,
see Appendix A)
If the O*NET BARS scale is not adequate to the task at hand (e.g., as was
noted above, the use of non-job-relevant anchors to define the scales raises
serious questions regarding its likely effectiveness, especially in the hands of
O*NET or NOT?
37
untrained, questionably motivated incumbent raters), the question remains as to
which rating format might be more appropriate? Should some form of a GRS be
used? Alternatively, perhaps, another less popular rating scale may be desired.
In the rating format arsenal one can choose from, there are some less
known rating scales. The most popular alternative to the BARS or GRS formats
is the “forced choice system” which forces the rater to choose from a set of
alternative descriptors, which are most or least descriptive of the ratee (Sisson,
1984). Another alternative, “Critical incidents” of an occupation, are critical
behaviors reported by expert observers, which make a crucial difference between
effectively or ineffectively behavior on the job (Cascio, 1978). In the “mixed
standard scale” format (Blanz & Ghiselli, 1972), raters respond to each statement
by indicating whether a ratee is better, equal or worse than a standard. For each
dimension, responses across the three standards are used to generate a 7-point
scale (Benson et al., 1988). All of these alternatives, however, are of
questionable utility in the context of the O*NET system, due to behavioral
characteristics, impracticality, or irrelevance (e.g., a need for ratee’s, not an
occupation’s, evaluation in the case of the mixed- standard scale format, or the
high labor and lack of cross-job comparability seen in the critical-incidents
approach).
Looking for an alternative rating scale to be used in the O*NET system, it
seems there isn’t much of a practical alternative to using the plain old graphic
rating scale, given that a system such as the O*NET requires that the rating-
scale content be both constant across jobs, and relatively labor-effective to
O*NET or NOT?
38
collect. Based on past research, where the BARS and GRS were seen as
performing comparably well, and taking into account that the non specific
behaviors in the O*NET BARS, I’d expect the GRS format to potentially be
superior to the O*NET BARS, due to the fact that the potentially highly confusing
lack of job-relatedness seen in the O*NET BARS anchors (i.e., each scale is
anchored using illustrative behaviors that will likely not be part of the job being
rated) would not be present in a GRS-based approach. Therefore, the second
hypothesis is:
Hypothesis 2: A GRS format will demonstrate higher levels of rating accuracy
(defined in terms of convergence with the ratings “standard” for each job
provided by trained analysts), higher levels of interrater agreement and less
leniency (defined in terms of the absolute elevation of the ratings, vis a vis those
provided by a criterion panel of experts) than the O*NET BARS format.
So far, it has been hypothesized that most likely, the GRS format will be
superior to the O*NET BARS. Nevertheless, we are familiar with the GRS’s
limitations. Accordingly, the next section presents a new GRS format that is
conceptually different from the 1-5 anchored Likert GRS format. This format
(named NBADS for “Normative Background Assist Distribution Scale”), may offer
the potential for improving some of the psychometric measures of rating
performance that would be seen when used as part of the O*NET system.
NBADS – An alternative rating format.

O*NET or NOT?
39
There are two dimensions, which may improve on the GRS Likert format.
One improves the psychometric accuracy ability of the scale itself, while the other
may enhance appropriate rater use of the scale.
In light of the information regarding the lack or relationship between the
rater biases and accuracy measures, one should contemplate on the best
method of allowing a rater to rate as accurately as their cognitive ability allows.
Albaum et al. (1981) argued that although the five anchored scale is popular, it is
a more ordinal scale than one having more anchors, and their results brought
them to conclude that there is a considerable advantage in using a continuous
ratings scale rather than a discrete one. Hake and Garner (1951) and others
have argued that the larger the number of anchors, the greater the recovery of
information (even though there is a diminishing effect after a certain number). For
example, a ratee having a true (deserved) score of 3.51 would get the same
evaluation on a dimension as a ratee having a true score of 4.49 if appraised on
a five point Likert scale. Both would theoretically get the evaluation of four. By
having a continuous scale, the 3.51 ratee will be evaluated as such, or at least
would be lower than the 4.49 ratee, in case biases, such as leniency or halo,
come into effect. Finally, McKelvie (1978) shows that raters prefer a continuous,
rather than a discrete, scale and that they felt they had performed more
consistently using a continuous one.
Murphy & Constants (1987) found support for the idea that anchors can
actually bias and misdirect recall of a ratee’s behavior, regardless of the type of
anchor (numerical, adjectival or behavioral). They concluded that a rating scale
O*NET or NOT?
40
might not benefit always from anchors, and particularly a behavioral one (BARS).
Theodore Kunin (1955), referring to evaluative scales, proposed that a certain
amount of distortion is an imminent result of the translation of one’s affect into
another’s words (Kunin was referring to phrase/word anchors). He claimed that
“… error ‘creeps’ in… (Kunin, 1955), both in the interpretation of the meaning of
the anchors by the respondent, and in the selection of the anchor, which is
supposed to indicate the exact affect of the respondent on the topic in question.
Parrill (1998) showed that rating evaluations conducted using a graphic rating
scale with subtle anchors (notches “|”) and a “high” and “low” at the extremes,
demonstrated higher levels of rating accuracy, than rating evaluations conducted
using a graphic rating scale containing 1-9 numerical anchors.
Based on this information, two options arise for a better GRS format for
the O*NET. The first, relying on the accuracy criteria, is the continuous scale
which would potentially produce more accurate (i.e., convergent with those made
by a criterion panel of experts) measures than five- or seven-point Likert
anchored scales. The second, removal of interfering anchors and their
replacement by more subtle ones, may also reduce bias. A combination of the
two (i.e., a continuous scale, using subtle anchors) would be thought to present
ratings that have the potential to be even more accurate.
Parill’s results (1998) supported the points made by Kunin (1955) and Murphy &
Constants (1987), in that certain types of anchors were found to have biased the
raters. It seems feasible that other elements of the format may exert some effect
(whether a biasing or facilitating one) over the rater. By eliminating a biasing
O*NET or NOT?
41
element, Parill (1998) arguably increased accuracy via the subtly anchored
format.
The next step is to find scale format elements that would enhance a rater’s
scoring accuracy. In fact, this process is no different than any company’s, trying
to improve its product’s user friendliness; removing confusing instructions,
buttons and icons; adding more coherent, less tedious processes to allow the
user to operate the product more easily and get the desired results.
One potentially user friendly element that may be added to improve accuracy and
reduce leniency bias could be some form of figure that would have the effect of
hinting, or reminding, the user with respect to the proper way to view the
characteristics of the bar line or rating points. A graphic figure that many of us
are familiar with that conveys these characteristics in a relatively simple fashion
is the Gaussian Normal distribution curve (see Figure 1).
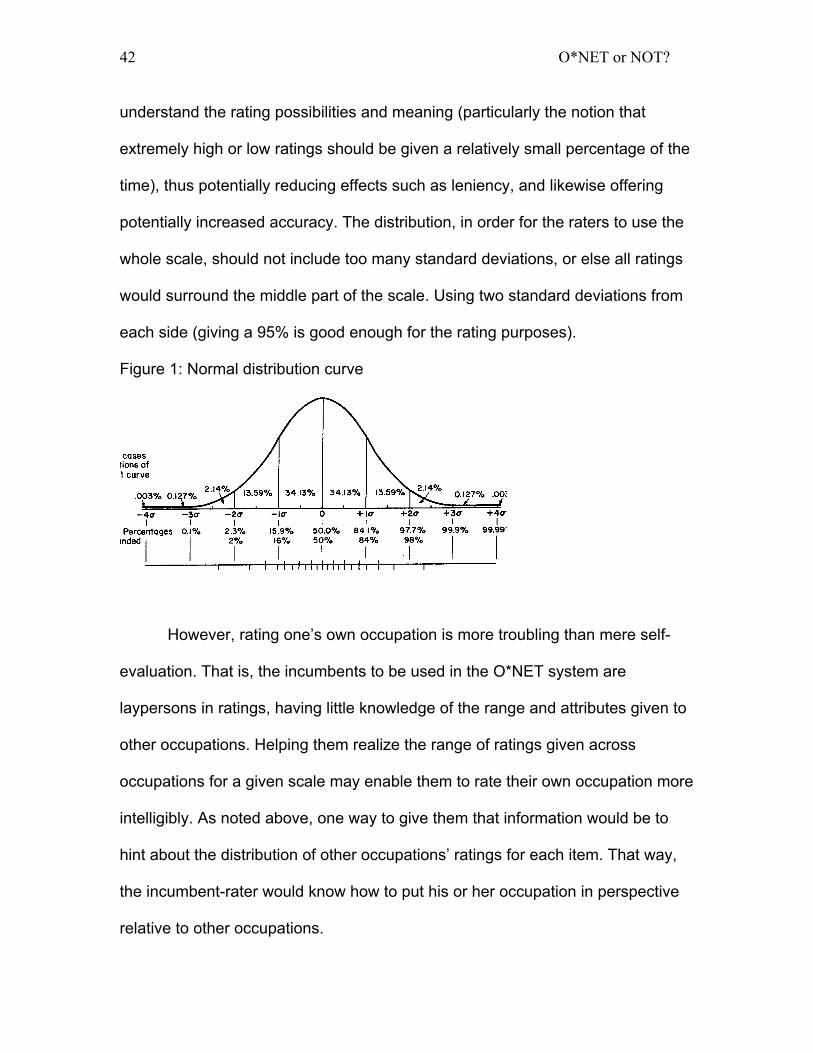
The normal distribution curve is symmetric and has a single point where
the mean, median and mode meeting the middle of the distribution. In theory, its
tails would never quite intersect the baseline. As can be seen in Figure 1, the
majority part of the curve (also called a bell-curve because of its shape) is
consumed by two standard deviations on each side of the middle point making
up approximately 95% of the area under the curve. One standard deviation to
each side of the middle point would give an area of approximately 68% (Hopkins,
1998). It is a universally known, well-presented figure, addressing the middle and
the outliers of a characteristic in the population. Therefore, I believe it can be
used as a facilitating element in a scale format, helping the rater cognitively
O*NET or NOT?
42
understand the rating possibilities and meaning (particularly the notion that
extremely high or low ratings should be given a relatively small percentage of the
time), thus potentially reducing effects such as leniency, and likewise offering
potentially increased accuracy. The distribution, in order for the raters to use the
whole scale, should not include too many standard deviations, or else all ratings
would surround the middle part of the scale. Using two standard deviations from
each side (giving a 95% is good enough for the rating purposes).
Figure 1: Normal distribution curve
However, rating one’s own occupation is more troubling than mere self-
evaluation. That is, the incumbents to be used in the O*NET system are
laypersons in ratings, having little knowledge of the range and attributes given to
other occupations. Helping them realize the range of ratings given across
occupations for a given scale may enable them to rate their own occupation more
intelligibly. As noted above, one way to give them that information would be to
hint about the distribution of other occupations’ ratings for each item. That way,
the incumbent-rater would know how to put his or her occupation in perspective
relative to other occupations.

O*NET or NOT?
43
In addition to using a distribution to provide such hinting, it could be
improved by providing an adjusted (i.e., skewed) distribution representing the
distribution of all occupations (or a relevant subset of occupations, if desired) on
each rating dimension. This new scale will be denoted NBADS, for “Normative
Background Assist Distributional Scale.” Of course, the incumbent would be
allowed to rate the item as desired, but would have a criterion to compare to.
Thus, when used in the context of the O*NET, it might be helpful to provide raters
with the actual rating distributions, across occupations, that have been obtained
for each O*NET item pair, as a vehicle for prompting the rater to consider the
relative degree to which each point along the scale represents a relatively
plausible rating, or an unusual one. The use of a realistic normative prompt
should have the effect of reducing the potential of raters to award unrealistically
high or low scores (and hence, improve rating performance in terms of indices
such as overall elevation or leniency). In addition, it is likely that due to the
directive given, raters would rate more similarly, giving up their own subjective
knowledge, to a more uniform information, thus getting a higher interrater
agreement.
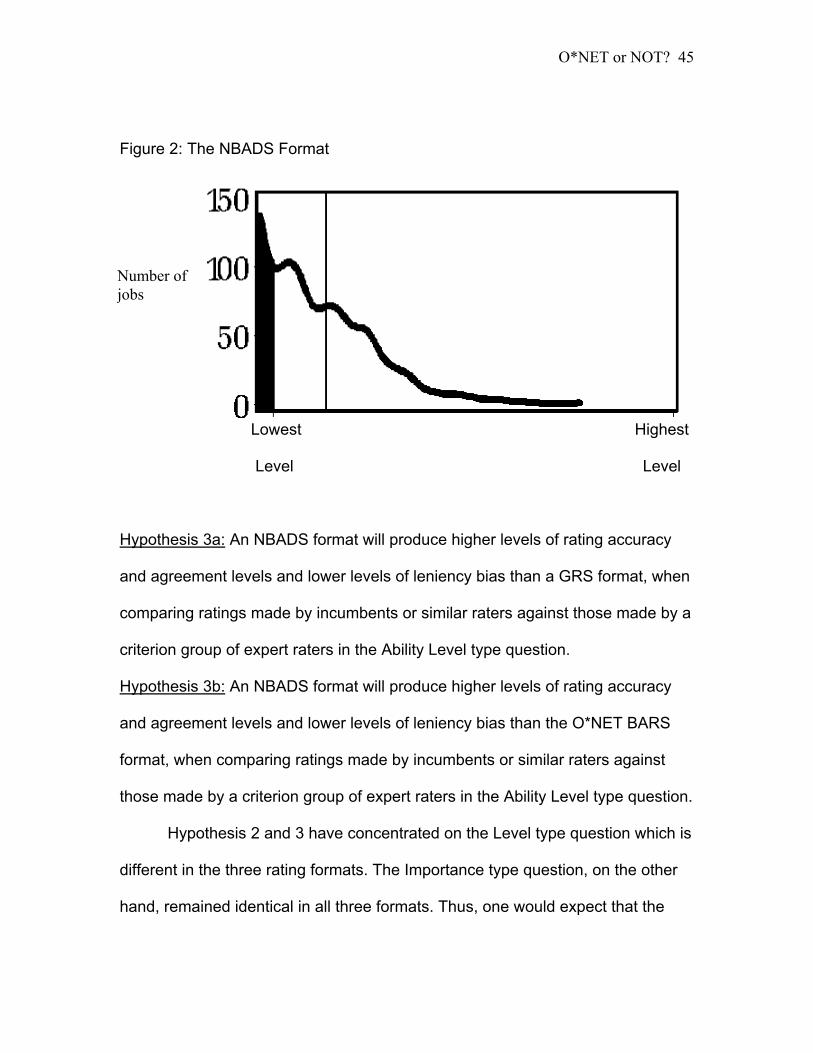
The new scale used has had the following characteristics for its purpose (see
Figure 2):
1. It was a graphic rating scale.
2. It had subtle anchors, supporting the distribution (Extremely low level- left
side of the distribution, and Extremely high level- right side of the
distribution).
O*NET or NOT?
44
3. The horizontal line bar was not connected to the background normal
distribution curve at both extremities.
4. The background distribution figure had the distribution per item, as rated
by the expert raters for all occupations.
5. The extreme left side of the distribution, representing the “does not apply”
ratings (i.e. 0) was filled black from the curve to the horizontal line to
represent its value (0) that is not part of the choosing options. Raters
could not rate in that area.
6. The format was presented on a computer.
7. When choosing a point of reference, a vertical line appeared, covering the
area from the top of the distribution to the bottom, touching the bar line,
thus implying that there is but one dimension (horizontal) to pick from.
O*NET or NOT?
45
Figure 2: The NBADS Format
Number of jobs
Lowest Highest
Level Level
Hypothesis 3a: An NBADS format will produce higher levels of rating accuracy
and agreement levels and lower levels of leniency bias than a GRS format, when
comparing ratings made by incumbents or similar raters against those made by a
criterion group of expert raters in the Ability Level type question.
Hypothesis 3b: An NBADS format will produce higher levels of rating accuracy
and agreement levels and lower levels of leniency bias than the O*NET BARS
format, when comparing ratings made by incumbents or similar raters against
those made by a criterion group of expert raters in the Ability Level type question.
Hypothesis 2 and 3 have concentrated on the Level type question which is
different in the three rating formats. The Importance type question, on the other
hand, remained identical in all three formats. Thus, one would expect that the
O*NET or NOT?
46
accuracy, leniency and agreement levels of this question type would not be
significantly different across the three rating format sessions.
Hypothesis 4: No significant leniency, accuracy and agreement differences will
be found between the three rating scales (O*NET BARS, GRS and NBADS) for
the Importance type question.
Method
Participants
Two sets of participants were used. The first set was incumbents who held
occupations that have been rated by the O*NET system’s analysts at the time of
participation, and for which criterion ratings could be obtained from the current
O*NET database (i.e., collected by analysts). These incumbents were drawn
from employees at Virginia Tech University. An attempt was made to obtain at
least 30 incumbents for each of the four occupations; however, only two
occupation type incumbents were attainable (Secretaries and Graduate Teaching
Assistants) and the combined data of only 51 participants for the two occupations
for the O*NET BARS and NBADS format, and 53 for the GRS format, were valid
for use for each of the scales. A $100 raffle incentive was added to get
secretaries’ participation when it was realized that very few would volunteer for
no immediate personal gain.
The second set of participants consisted of undergraduate students, not
ever employed in the occupation they were asked to rate, who participated in the
experiment for extra credit points for their “Introduction to Psychology” class.
Overall, about 40 undergraduate participants for each of the four occupations

O*NET or NOT?
47
were collected. For the two occupations’ ratings also collected by incumbents, 85
undergraduate participants for the O*NET BARS, 87 for the GRS and 84 for the
NBADS format were valid for use. Like the incumbents, they each rated one
occupation.
Independent Variables
The study was a 3(formats) X 2(rating-types) X 2(rater type) X
2(occupations) experimental design. The independent variables were (a) the
rating formats, (b) the type of rater (incumbents and undergraduates), (c) the two
rating-type questions tested (item importance level and item use level) and (d)
the different occupations.
The formats were (see Appendix C for graphic depiction):
1. The O*NET BARS.
2. A discrete GRS having numerical anchors (1-7).
3. The NBADS.
The occupations data was collected from were:
1. OUCODE: 31117 Graduate Assistants, Teaching.
2. OUCODE: 55108 Secretaries, Except Legal and Medical.
Dependent Variables
The dependent variables were the participants’ ratings of 21 randomly
picked items from the original Ability Questionnaire from the O*NET system (see
Appendix E).
Procedures
General.
O*NET or NOT?
48
The entire study was conducted over the Internet, at
http://www.psychelp.vt.edu/hollander. The study tried to resemble the O*NET
procedures as close as possible. However, to receive participants’ full
participation, only 21 randomly picked items of the Ability questionnaire were
used, instead of the 239 items provided in all five dimensions that were obtained
from the O*NET website at http://www.onet.org. Each participant rated an
occupation using all three scale formats, therefore answering 63 item pairs (2
questions per item: importance and level use). The rating information of the
O*NET analyst experts was obtained by requesting the raw data via e-mail from
the O*NET producers.
All participants logged on from an independent computer to the web site to
use the program. Undergraduate participants picked the option “undergraduate
student,” and the computer first asked users whether they were ever employed
by any of the evaluated occupations. It then generated a random occupation of
the ones left (i.e., never employed) to be evaluated. In cases where
undergraduates worked in more than two occupations presented, they were not
allowed to rate, because a random assignment could not be made. The
incumbents participating evaluated their own occupation.
The program.
Because the O*NET was not operational at the time this research was
conducted, the use of the exact same procedure was impossible. However, using
the items and instructions used for the original pilot study, along with future
directions and suggestions in trying to explain the importance of their
O*NET or NOT?
49
participation to their occupation and the O*NET (Peterson et al, 1999), it was
possible to generate the O*NET system that will most likely be used. For the
introduction and initial questionnaire page, see Appendix D.
The rating scale formats.
Participants rated the occupations assigned (either their own for
incumbents, or randomly chosen for students), using all three scale formats. The
computer generated a random format order for the participants to use. Before
each format rating, participants were given a quick explanation regarding the
meaning of the scale including an example. They were also asked to completely
ignore and disregard the formats they have already used (see Appendix F).
Overall, each participant rated all 21 ability item pairs three times, once for each
format. For the NBADS scale, the computer generated a score for the rating
ranging from one to seven, in 0.01 increments. In all formats, if a rater rated 1 on
the Importance type question (first question), the Level type question received an
automatic value of zero. As can be seen in Appendix D, the Importance question
has a 1-5 Likert scale on all three formats, while the Level question has one of
the three formats, all having a scale of 1-7.
Statistical Configurations
For Hy1a, the rater’s raw score was used to compute the unsquared
elevation measure (E), to understand whether a severity or leniency effect took
place (in other words, the sign of the elevation formula was of importance). Then,
a one-sample t-test was conducted for both rating-types (item use level and
importance level) to look for a positive, significant difference from the experts’
O*NET or NOT?
50
ratings (i.e.H0: E=0). The comparisons were across occupations and scale
formats. In addition, in order to be able to isolate the O*NET format ratings for
feasibility discussion, the same computations were done for each rating scale
format independently. The ‘true’ scores were calculated by taking the ratings for
each item from the expert analysts’ raw data.
For Hy1b, the raters’ raw scores were used to compute the leniency effect
using the unsquared Elevation measure and the Elevation accuracy measure
(E2) of Cronbach’s (1955), for each participant, for each scale format, for the two
rating-type questions. Thus, each rater has had three E2 scores per rating-type
(use level and importance level), one for each format. The overall error measure
(D2) was obtained between the rater and the criterion data for all items (raw
expert analysts’ O*NET data), which produced an error measure for each format
evaluated by each rater (thus having three D2 measures per rater for each rating-
type). The Interrater agreement coefficients (Rwg) were computed for both
participant groups and question types. The data was used to compare, using
ANOVA, the two rater-types’ accuracy (of incumbents and undergraduates),
leniency and interrater agreement. The comparisons were across occupations.
For hypotheses 2-4, the Elevation accuracy measure, the unsquared elevation
measure, the overall error measure and the Interrater agreement coefficients
were used to compare, using ANOVA, the leniency and error effect differences
between the different scale formats for each rating-type. The comparisons were
conducted for each rating-type question, across occupations.
O*NET or NOT?
51
For all Rwg computations, the random variance used was computed using
the relevant scale range used by the O*NET experts across all occupations. The
1-99 percentiles of expert raters’ ratings for each item were used to come up with
the relevant scale ranges. This was done to decrease over inflation of the
agreement coefficients due to the arbitrary range and for both rating type
questions.
Results
The overall ANOVAs of the main effects and interactions are presented in
Tables 1 and 2. The ANOVAs were divided into Importance and Level type
questions, as their formats do not coincide, thus distorting the data for other
independent variables. The contribution of the explained variance of the main
effects is also noted. This was possible due to a zero correlation among the main
effects. Table 1, Level type ANOVA, showed significant main effects of all the
independent variables: rater type, items, jobs and scale formats (P<0.0001).
Most interactions were significant, showing affecting relationships between the
different variables. The important interaction that was not significant, jobXformat,
showed that the two significantly different jobs were affected similarly by the
different formats. Upon partialing out laypeople ratings, to see an effect on the
incumbents alone, the interaction remained non-significant. Table 2, Importance
type ANOVA, showed similar results for rater type, items and jobs, but did not
find significant difference between the three formats. In reality, there was only
one format in the Importance question for the three sessions. The non-significant

O*NET or NOT?
52
finding supported hypothesis 4, predicting no rating difference in the Importance
question between formats, due to it being the same format.
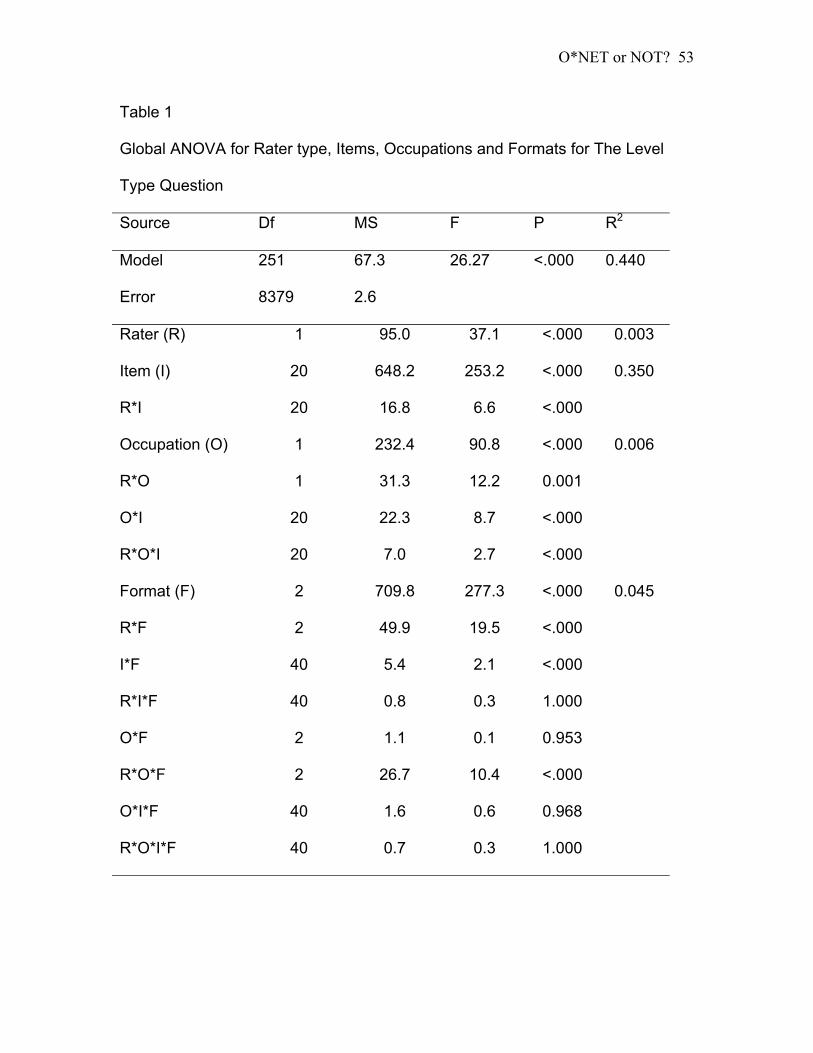
O*NET or NOT?
53
Table 1
Global ANOVA for Rater type, Items, Occupations and Formats for The Level
Type Question
Source Df MS F P R2
Model 251 67.3 26.27 <.000 0.440
Error 8379 2.6
Rater (R) 1 95.0 37.1 <.000 0.003
Item (I) 20 648.2 253.2 <.000 0.350
R*I 20 16.8 6.6 <.000
Occupation (O) 1 232.4 90.8 <.000 0.006
R*O 1 31.3 12.2 0.001
O*I 20 22.3 8.7 <.000
R*O*I 20 7.0 2.7 <.000
Format (F) 2 709.8 277.3 <.000 0.045
R*F 2 49.9 19.5 <.000
I*F 40 5.4 2.1 <.000
R*I*F 40 0.8 0.3 1.000
O*F 2 1.1 0.1 0.953
R*O*F 2 26.7 10.4 <.000
O*I*F 40 1.6 0.6 0.968
R*O*I*F 40 0.7 0.3 1.000
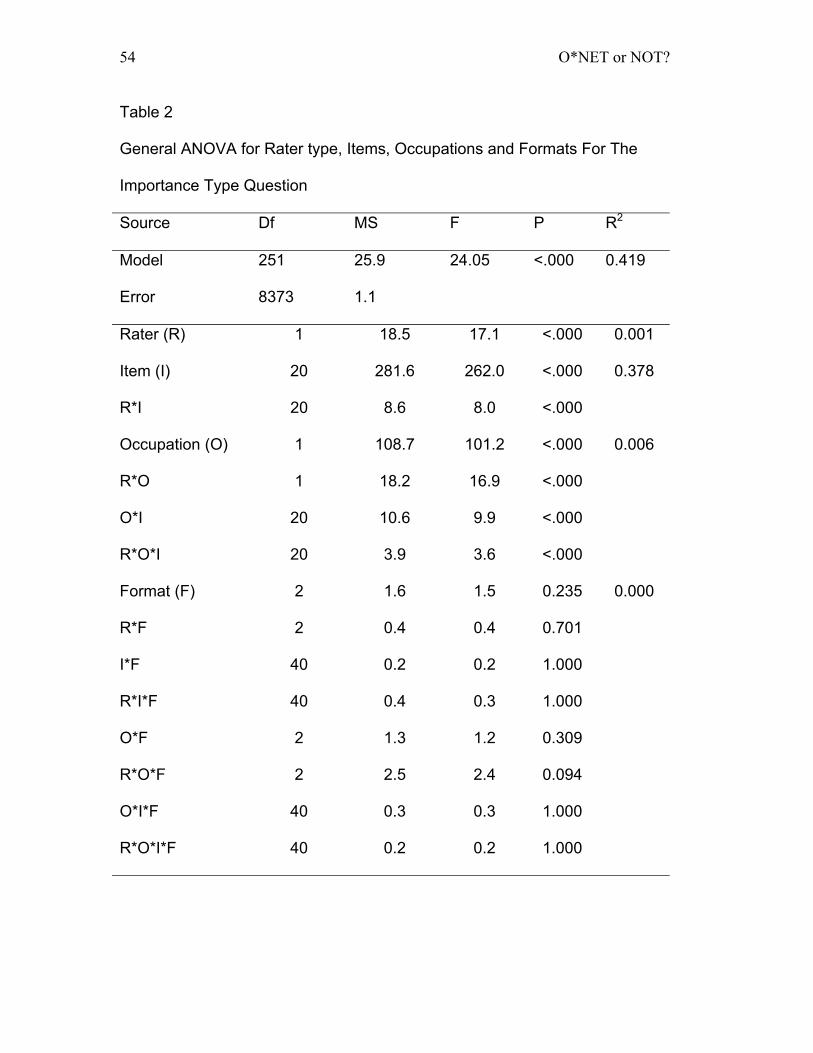
O*NET or NOT?
54
Table 2
General ANOVA for Rater type, Items, Occupations and Formats For The
Importance Type Question
Source Df MS F P R2
Model 251 25.9 24.05 <.000 0.419
Error 8373 1.1
Rater (R) 1 18.5 17.1 <.000 0.001
Item (I) 20 281.6 262.0 <.000 0.378
R*I 20 8.6 8.0 <.000
Occupation (O) 1 108.7 101.2 <.000 0.006
R*O 1 18.2 16.9 <.000
O*I 20 10.6 9.9 <.000
R*O*I 20 3.9 3.6 <.000
Format (F) 2 1.6 1.5 0.235 0.000
R*F 2 0.4 0.4 0.701
I*F 40 0.2 0.2 1.000
R*I*F 40 0.4 0.3 1.000
O*F 2 1.3 1.2 0.309
R*O*F 2 2.5 2.4 0.094
O*I*F 40 0.3 0.3 1.000
R*O*I*F 40 0.2 0.2 1.000

O*NET or NOT?
55
Leniency Effect
The first hypothesis (1a), claiming an overall leniency effect in the
incumbent group is supported by the results as seen in Table 3. Overall,
significant (p<.001) leniency effects of 0.827 points for Ability Level (out of 8
possible ratings points) and 0.396 points for Ability Importance (out of five
possible rating points) (i.e., 10.3% and 8.1% difference from ‘true’ ratings
respectively) were observed. Individual format computations revealed that
although the formats themselves act as moderators to leniency, they do not
reduce the bias completely. In other words, regardless of format, each scale still
exhibited a significant leniency effect, with the O*NET BARS format showing an
11.6% and 8.4% leniency effects for Ability Level and Importance respectively.
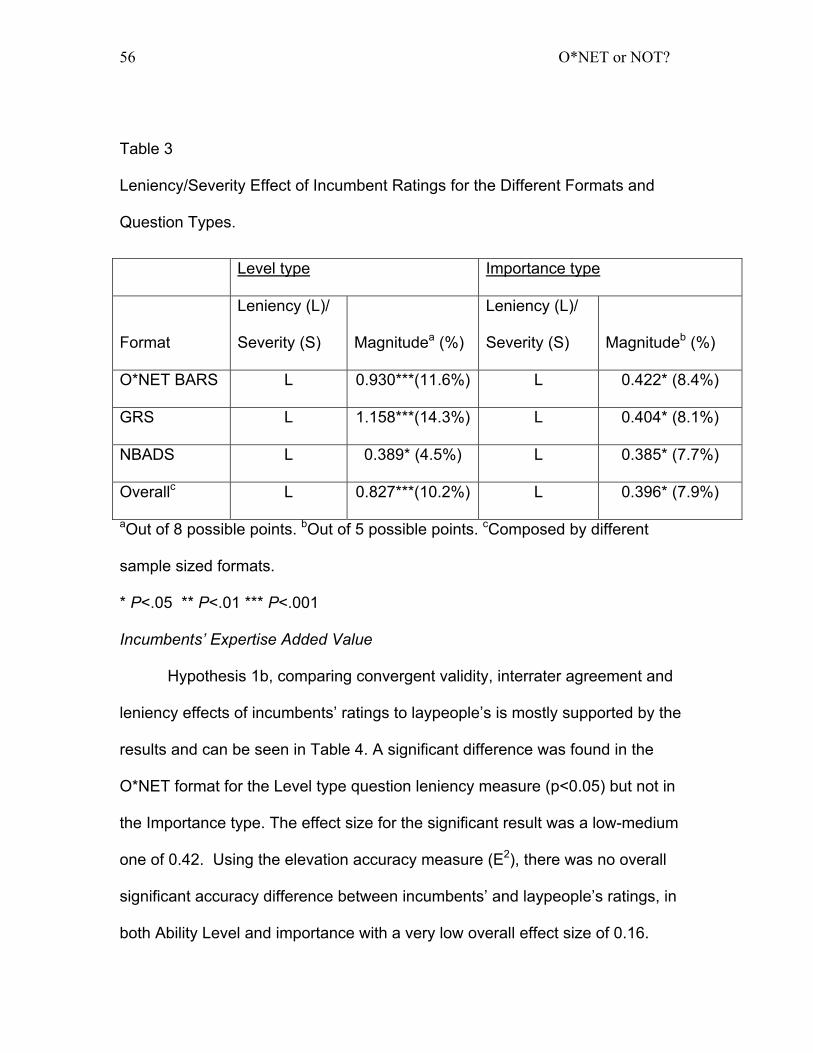
O*NET or NOT?
56
Table 3
Leniency/Severity Effect of Incumbent Ratings for the Different Formats and
Question Types.
aOut of 8 possible points. bOut of 5 possible points. cComposed by different
sample sized formats.
* P<.05 ** P<.01 *** P<.001
Incumbents’ Expertise Added Value
Hypothesis 1b, comparing convergent validity, interrater agreement and
leniency effects of incumbents’ ratings to laypeople’s is mostly supported by the
results and can be seen in Table 4. A significant difference was found in the
O*NET format for the Level type question leniency measure (p<0.05) but not in
the Importance type. The effect size for the significant result was a low-medium
one of 0.42. Using the elevation accuracy measure (E2), there was no overall
significant accuracy difference between incumbents’ and laypeople’s ratings, in
both Ability Level and importance with a very low overall effect size of 0.16.
Level type Importance type
Format
Leniency (L)/
Severity (S)
Magnitudea (%)
Leniency (L)/
Severity (S)
Magnitudeb (%)
O*NET BARS L 0.930***(11.6%) L 0.422* (8.4%)
GRS L 1.158***(14.3%) L 0.404* (8.1%)
NBADS L 0.389* (4.5%) L 0.385* (7.7%)
Overallc L 0.827***(10.2%) L 0.396* (7.9%)
O*NET or NOT?
57
Within the individual format computations, however, the O*NET BARS format
showed marginally significant difference (p=0.053) in the Ability Level question
(effect size of 0.35). The overall-error measure (D2), which takes into
consideration individual item differences, has found marginal convergent validity
difference (p=0.053) in the overall Ability Level measure, and a significant
(P<0.05) difference in the overall Ability Importance measure between the two
populations. Again, only the O*NET BARS format showed significant differences
in the Ability Level question (p=0.01) with a medium effect size of 0.46. Note that
most comparisons between the pairs (incumbents and laypeople) in the different
formats showed no significant differences. The overall Overall-error Importance
difference has been found significant due to a sample size three times bigger
(n=105) than the individual formats, and is small in itself.
The Interrater Agreement coefficients showed no significant differences
between the two groups in both Importance and Level type questions. Both
incumbents and laypeople showed a medium agreement in the Level type
question (Rwg~0.6) and low-medium agreement in the Importance type one
(Rwg~0.4). These agreement coefficients were computed using the relevant
scale range. This was computed for each item and for each scale format by
truncating the scale into its 1%-99% percentiles of actual usage by the expert
raters, covering more than 1100 occupations’ ratings. Had we used the arbitrary
full 0-7 and 1-5 scale ranges for Level and Importance, respectively, we would
have gotten much higher agreement coefficients (i.e. inflated coefficients).
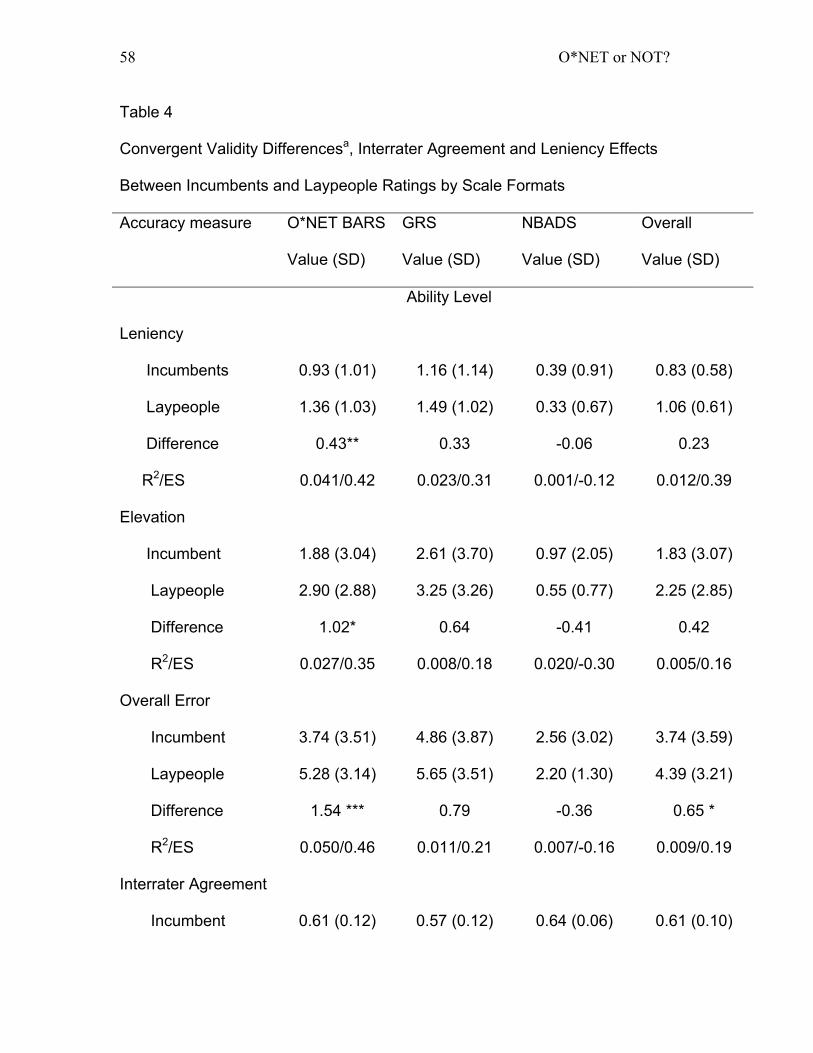
O*NET or NOT?
58
Table 4
Convergent Validity Differencesa, Interrater Agreement and Leniency Effects
Between Incumbents and Laypeople Ratings by Scale Formats
Accuracy measure O*NET BARS
Value (SD)
GRS
Value (SD)
NBADS
Value (SD)
Overall
Value (SD)
Ability Level
Leniency
Incumbents
0.93 (1.01)
1.16 (1.14)
0.39 (0.91)
0.83 (0.58)
Laypeople 1.36 (1.03) 1.49 (1.02) 0.33 (0.67) 1.06 (0.61)
Difference 0.43** 0.33 -0.06 0.23
R2/ES 0.041/0.42 0.023/0.31 0.001/-0.12 0.012/0.39
Elevation
Incumbent
1.88 (3.04)
2.61 (3.70)
0.97 (2.05)
1.83 (3.07)
Laypeople 2.90 (2.88) 3.25 (3.26) 0.55 (0.77) 2.25 (2.85)
Difference 1.02* 0.64 -0.41 0.42
R2/ES 0.027/0.35 0.008/0.18 0.020/-0.30 0.005/0.16
Overall Error
Incumbent
3.74 (3.51)
4.86 (3.87)
2.56 (3.02)
3.74 (3.59)
Laypeople 5.28 (3.14) 5.65 (3.51) 2.20 (1.30) 4.39 (3.21)
Difference 1.54 *** 0.79 -0.36 0.65 *
R2/ES 0.050/0.46 0.011/0.21 0.007/-0.16 0.009/0.19
Interrater Agreement
Incumbent
0.61 (0.12)
0.57 (0.12)
0.64 (0.06)
0.61 (0.10)
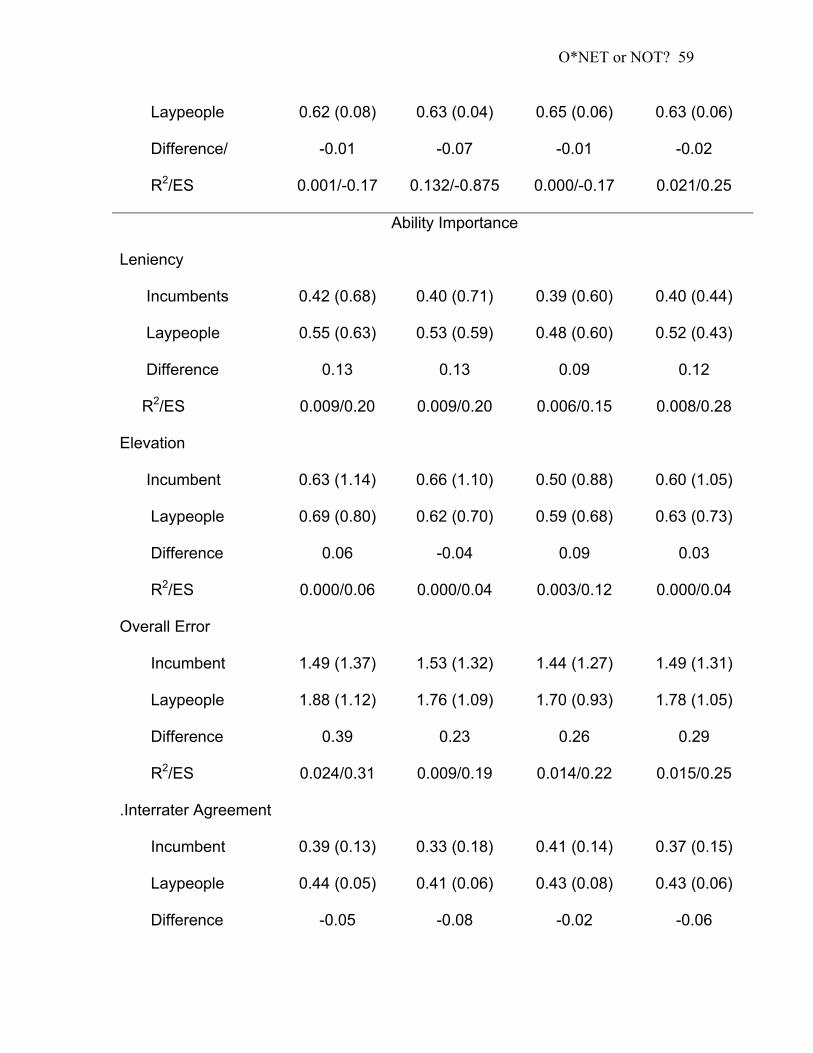
O*NET or NOT?
59
Laypeople 0.62 (0.08) 0.63 (0.04) 0.65 (0.06) 0.63 (0.06)
Difference/ -0.01 -0.07 -0.01 -0.02
R2/ES 0.001/-0.17 0.132/-0.875 0.000/-0.17 0.021/0.25
Ability Importance
Leniency
Incumbents
0.42 (0.68)
0.40 (0.71)
0.39 (0.60)
0.40 (0.44)
Laypeople 0.55 (0.63) 0.53 (0.59) 0.48 (0.60) 0.52 (0.43)
Difference 0.13 0.13 0.09 0.12
R2/ES 0.009/0.20 0.009/0.20 0.006/0.15 0.008/0.28
Elevation
Incumbent
0.63 (1.14)
0.66 (1.10)
0.50 (0.88)
0.60 (1.05)
Laypeople 0.69 (0.80) 0.62 (0.70) 0.59 (0.68) 0.63 (0.73)
Difference 0.06 -0.04 0.09 0.03
R2/ES 0.000/0.06 0.000/0.04 0.003/0.12 0.000/0.04
Overall Error
Incumbent
1.49 (1.37)
1.53 (1.32)
1.44 (1.27)
1.49 (1.31)
Laypeople 1.88 (1.12) 1.76 (1.09) 1.70 (0.93) 1.78 (1.05)
Difference 0.39 0.23 0.26 0.29
R2/ES 0.024/0.31 0.009/0.19 0.014/0.22 0.015/0.25
.Interrater Agreement
Incumbent
0.39 (0.13)
0.33 (0.18)
0.41 (0.14)
0.37 (0.15)
Laypeople 0.44 (0.05) 0.41 (0.06) 0.43 (0.08) 0.43 (0.06)
Difference -0.05 -0.08 -0.02 -0.06
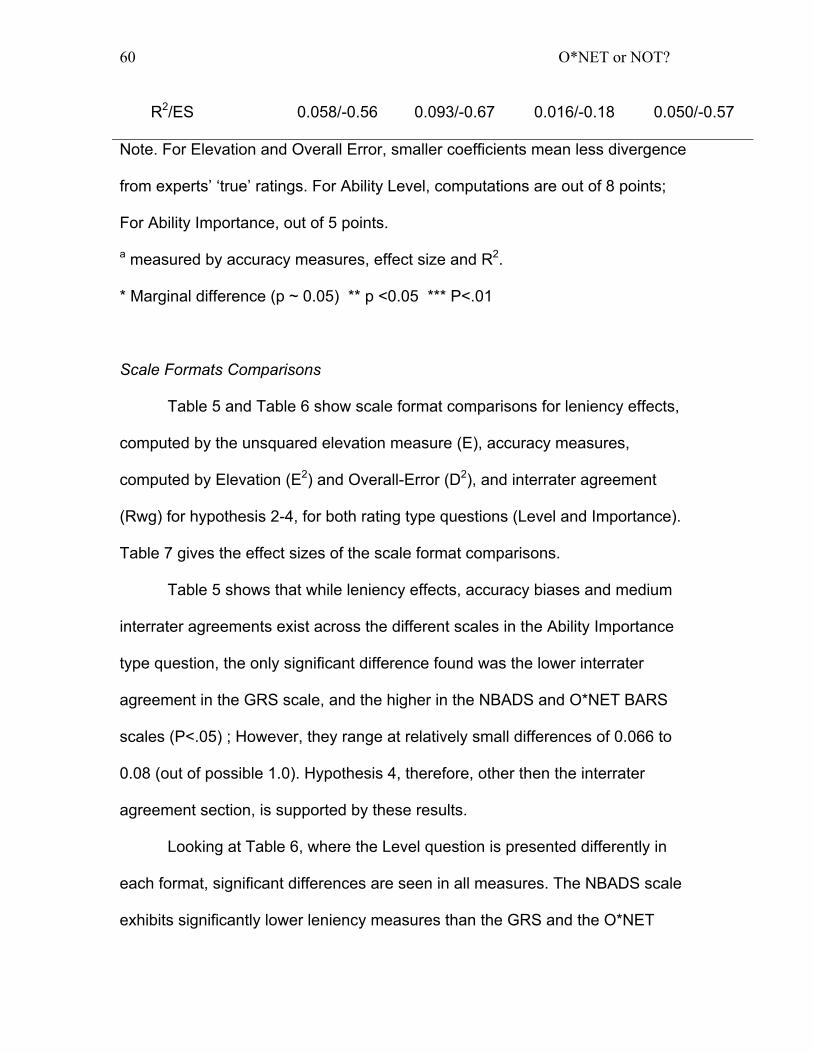
O*NET or NOT?
60
R2/ES 0.058/-0.56 0.093/-0.67 0.016/-0.18 0.050/-0.57
Note. For Elevation and Overall Error, smaller coefficients mean less divergence
from experts’ ‘true’ ratings. For Ability Level, computations are out of 8 points;
For Ability Importance, out of 5 points.
a measured by accuracy measures, effect size and R2.
* Marginal difference (p ~ 0.05) ** p <0.05 *** P<.01
Scale Formats Comparisons
Table 5 and Table 6 show scale format comparisons for leniency effects,
computed by the unsquared elevation measure (E), accuracy measures,
computed by Elevation (E2) and Overall-Error (D2), and interrater agreement
(Rwg) for hypothesis 2-4, for both rating type questions (Level and Importance).
Table 7 gives the effect sizes of the scale format comparisons.
Table 5 shows that while leniency effects, accuracy biases and medium
interrater agreements exist across the different scales in the Ability Importance
type question, the only significant difference found was the lower interrater
agreement in the GRS scale, and the higher in the NBADS and O*NET BARS
scales (P<.05) ; However, they range at relatively small differences of 0.066 to
0.08 (out of possible 1.0). Hypothesis 4, therefore, other then the interrater
agreement section, is supported by these results.
Looking at Table 6, where the Level question is presented differently in
each format, significant differences are seen in all measures. The NBADS scale
exhibits significantly lower leniency measures than the GRS and the O*NET
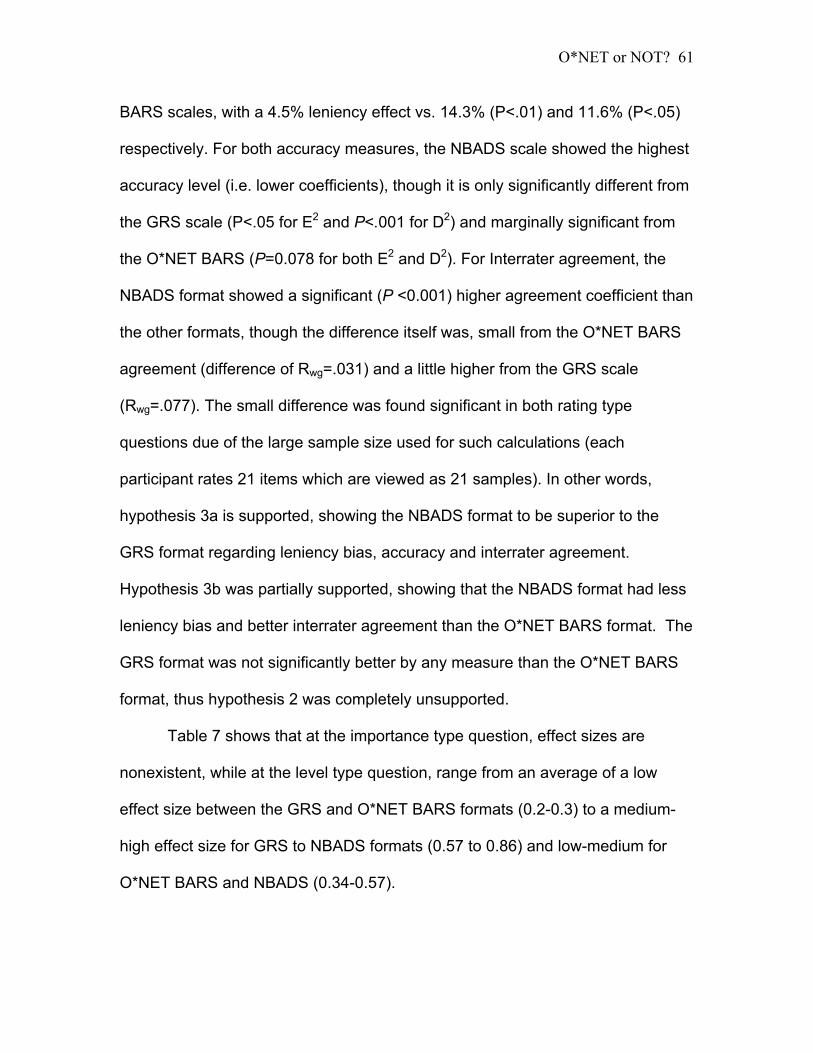
O*NET or NOT?
61
BARS scales, with a 4.5% leniency effect vs. 14.3% (P<.01) and 11.6% (P<.05)
respectively. For both accuracy measures, the NBADS scale showed the highest
accuracy level (i.e. lower coefficients), though it is only significantly different from
the GRS scale (P<.05 for E2 and P<.001 for D2) and marginally significant from
the O*NET BARS (P=0.078 for both E2 and D2). For Interrater agreement, the
NBADS format showed a significant (P <0.001) higher agreement coefficient than
the other formats, though the difference itself was, small from the O*NET BARS
agreement (difference of Rwg=.031) and a little higher from the GRS scale
(Rwg=.077). The small difference was found significant in both rating type
questions due of the large sample size used for such calculations (each
participant rates 21 items which are viewed as 21 samples). In other words,
hypothesis 3a is supported, showing the NBADS format to be superior to the
GRS format regarding leniency bias, accuracy and interrater agreement.
Hypothesis 3b was partially supported, showing that the NBADS format had less
leniency bias and better interrater agreement than the O*NET BARS format. The
GRS format was not significantly better by any measure than the O*NET BARS
format, thus hypothesis 2 was completely unsupported.
Table 7 shows that at the importance type question, effect sizes are
nonexistent, while at the level type question, range from an average of a low
effect size between the GRS and O*NET BARS formats (0.2-0.3) to a medium-
high effect size for GRS to NBADS formats (0.57 to 0.86) and low-medium for
O*NET BARS and NBADS (0.34-0.57).
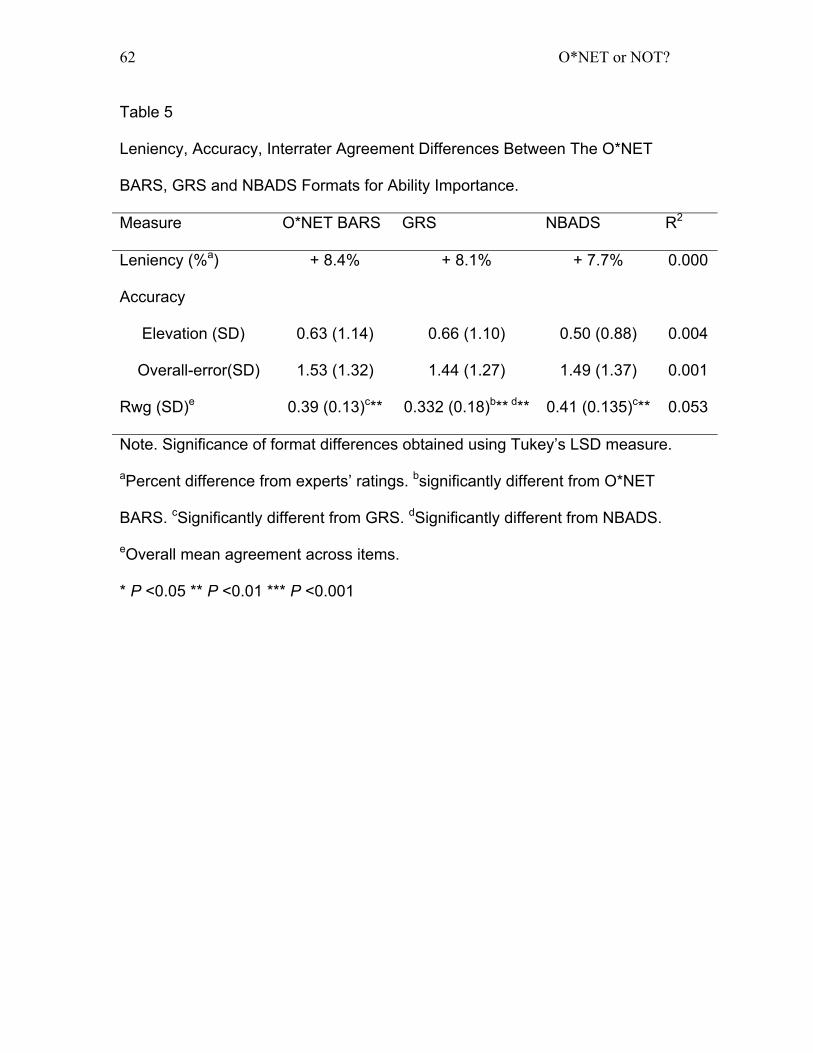
O*NET or NOT?
62
Table 5
Leniency, Accuracy, Interrater Agreement Differences Between The O*NET
BARS, GRS and NBADS Formats for Ability Importance.
Measure O*NET BARS GRS NBADS R2
Leniency (%a) + 8.4% + 8.1% + 7.7% 0.000
Accuracy
Elevation (SD)
0.63 (1.14)
0.66 (1.10)
0.50 (0.88)
0.004
Overall-error(SD) 1.53 (1.32) 1.44 (1.27) 1.49 (1.37) 0.001
Rwg (SD)e 0.39 (0.13)c** 0.332 (0.18)b** d** 0.41 (0.135)c** 0.053
Note. Significance of format differences obtained using Tukey’s LSD measure.
aPercent difference from experts’ ratings. bsignificantly different from O*NET
BARS. cSignificantly different from GRS. dSignificantly different from NBADS.
eOverall mean agreement across items.
* P <0.05 ** P <0.01 *** P <0.001
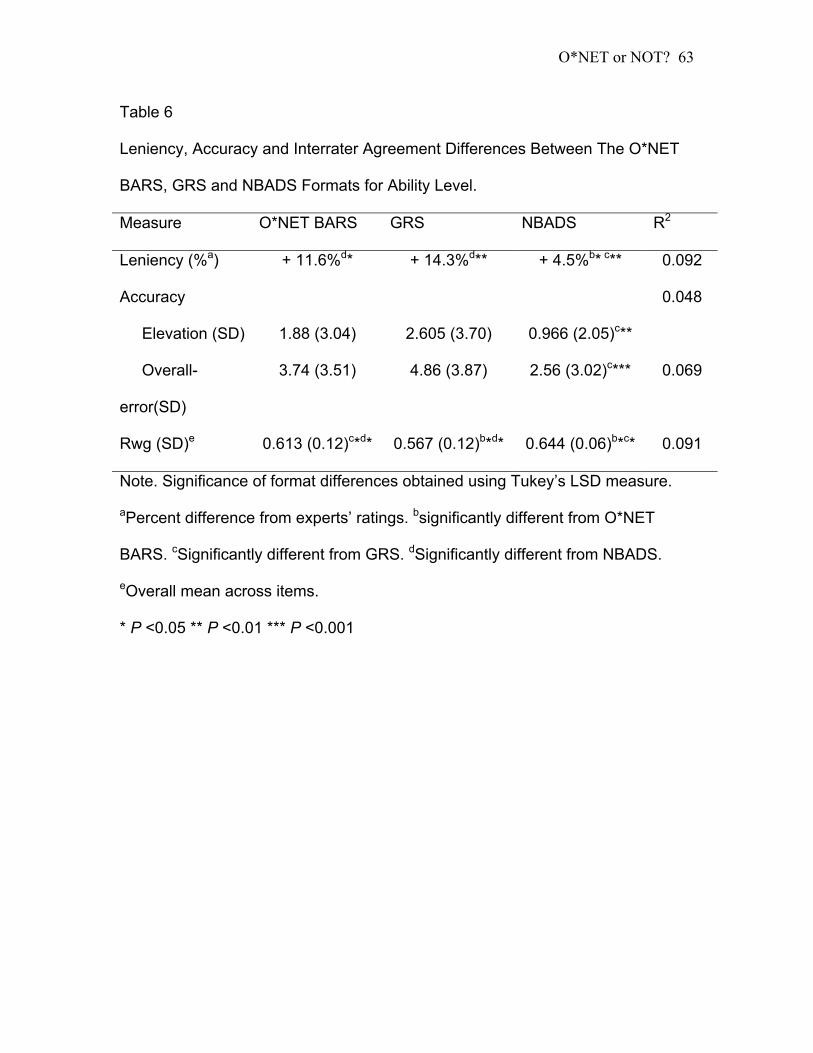
O*NET or NOT?
63
Table 6
Leniency, Accuracy and Interrater Agreement Differences Between The O*NET
BARS, GRS and NBADS Formats for Ability Level.
Measure O*NET BARS GRS NBADS R2
Leniency (%a) + 11.6%d* + 14.3%d** + 4.5%b* c** 0.092
Accuracy
Elevation (SD)
1.88 (3.04)
2.605 (3.70)
0.966 (2.05)c**
0.048
Overall-
error(SD)
3.74 (3.51) 4.86 (3.87) 2.56 (3.02)c*** 0.069
Rwg (SD)e 0.613 (0.12)c*d* 0.567 (0.12)b*d* 0.644 (0.06)b*c* 0.091
Note. Significance of format differences obtained using Tukey’s LSD measure.
aPercent difference from experts’ ratings. bsignificantly different from O*NET
BARS. cSignificantly different from GRS. dSignificantly different from NBADS.
eOverall mean across items.
* P <0.05 ** P <0.01 *** P <0.001
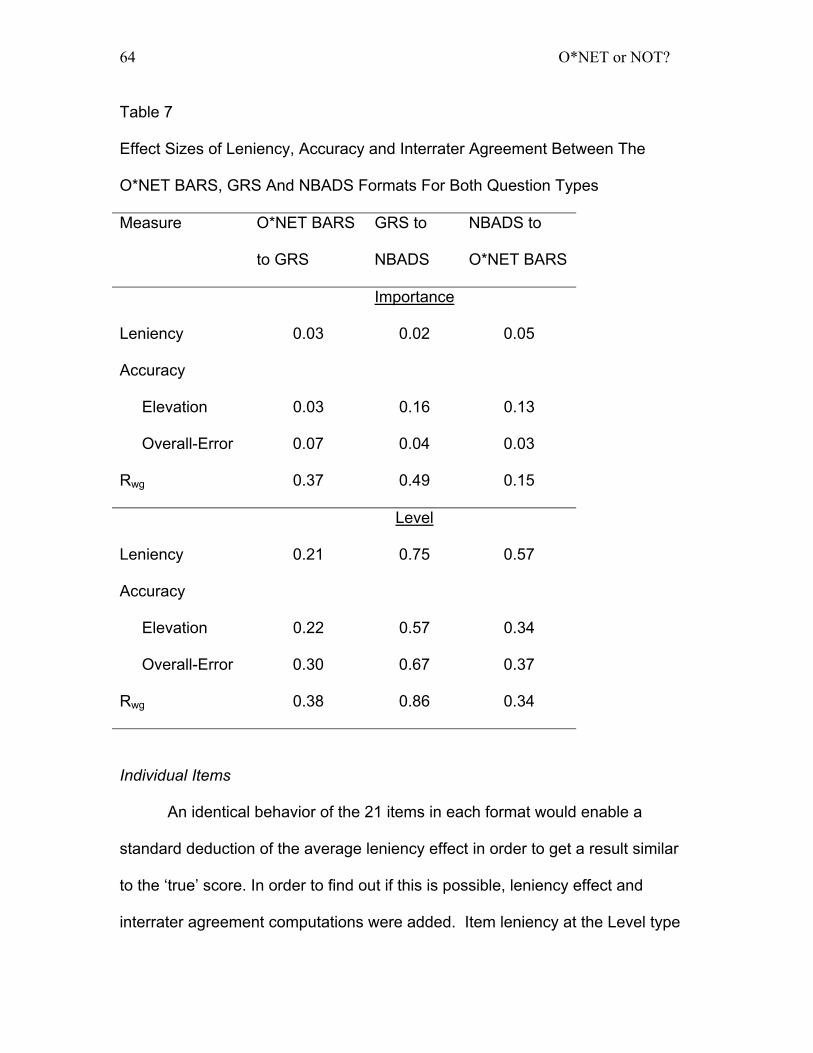
O*NET or NOT?
64
Table 7
Effect Sizes of Leniency, Accuracy and Interrater Agreement Between The
O*NET BARS, GRS And NBADS Formats For Both Question Types
Measure O*NET BARS
to GRS
GRS to
NBADS
NBADS to
O*NET BARS
Importance
Leniency
Accuracy
0.03 0.02 0.05
Elevation 0.03 0.16 0.13
Overall-Error 0.07 0.04 0.03
Rwg 0.37 0.49 0.15
Level
Leniency
Accuracy
0.21 0.75 0.57
Elevation 0.22 0.57 0.34
Overall-Error 0.30 0.67 0.37
Rwg 0.38 0.86 0.34
Individual Items
An identical behavior of the 21 items in each format would enable a
standard deduction of the average leniency effect in order to get a result similar
to the ‘true’ score. In order to find out if this is possible, leniency effect and
interrater agreement computations were added. Item leniency at the Level type
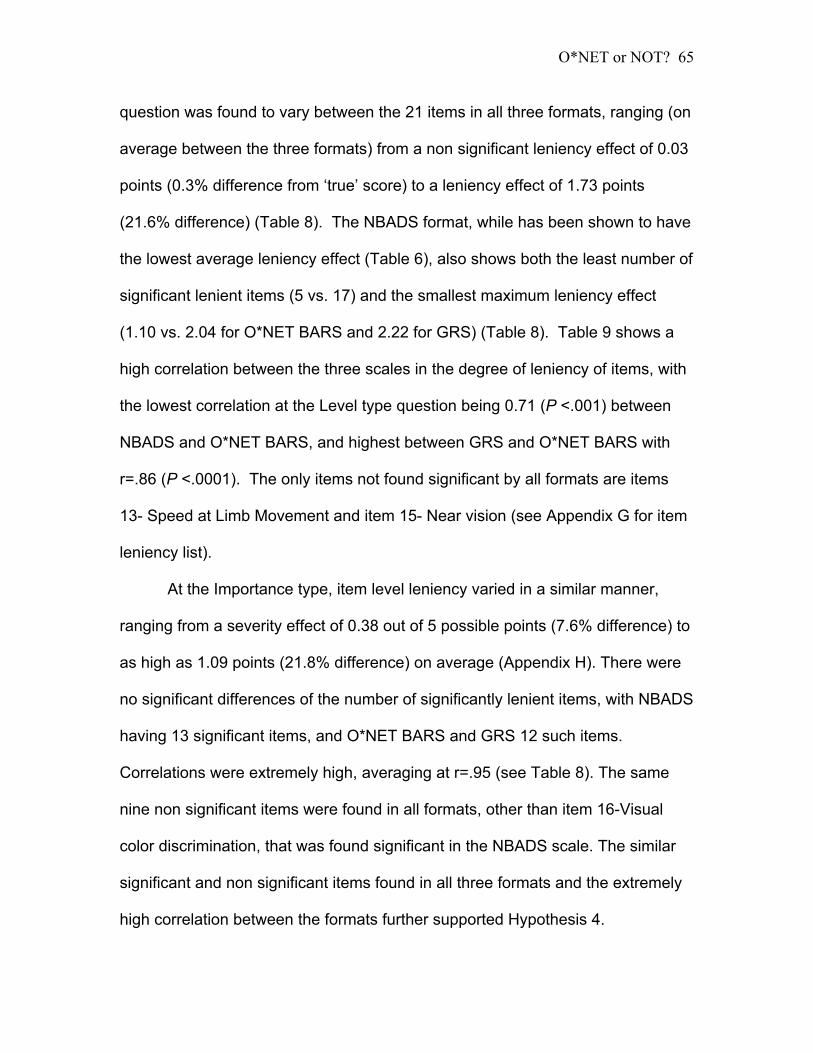
O*NET or NOT?
65
question was found to vary between the 21 items in all three formats, ranging (on
average between the three formats) from a non significant leniency effect of 0.03
points (0.3% difference from ‘true’ score) to a leniency effect of 1.73 points
(21.6% difference) (Table 8). The NBADS format, while has been shown to have
the lowest average leniency effect (Table 6), also shows both the least number of
significant lenient items (5 vs. 17) and the smallest maximum leniency effect
(1.10 vs. 2.04 for O*NET BARS and 2.22 for GRS) (Table 8). Table 9 shows a
high correlation between the three scales in the degree of leniency of items, with
the lowest correlation at the Level type question being 0.71 (P <.001) between
NBADS and O*NET BARS, and highest between GRS and O*NET BARS with
r=.86 (P <.0001). The only items not found significant by all formats are items
13- Speed at Limb Movement and item 15- Near vision (see Appendix G for item
leniency list).
At the Importance type, item level leniency varied in a similar manner,
ranging from a severity effect of 0.38 out of 5 possible points (7.6% difference) to
as high as 1.09 points (21.8% difference) on average (Appendix H). There were
no significant differences of the number of significantly lenient items, with NBADS
having 13 significant items, and O*NET BARS and GRS 12 such items.
Correlations were extremely high, averaging at r=.95 (see Table 8). The same
nine non significant items were found in all formats, other than item 16-Visual
color discrimination, that was found significant in the NBADS scale. The similar
significant and non significant items found in all three formats and the extremely
high correlation between the formats further supported Hypothesis 4.

O*NET or NOT?
66
Table 8
Number of Significantly Lenient Items and Minimum and Maximum leniency
effects for Each Rating Scale Format for Both Question Types.
Leniency Measure O*NET BARS GRS NBADS
Level Type
No. of itemsa 17 17 5 b**c**
Minimum Leniencyd (%) 0.05 (0.6%) 0.10 (1.3%) -0.25 (-3.1%)
Maximum Leniencyd (%) 2.04 (25.5%) 2.22 (27.8%) 1.10 (13.8%)
Importance Type
No. of itemsa 12 12 13
Minimum Leniencye (%) -0.30 (-6.0%) -0.32 (-4.0%) -0.52 (-6.5%)
Maximum Leniencye (%) 1.03 (20.6%) 0.98 (12.3%) 1.08 (13.5%)
aOut of 21 items. bsignificantly different from O*NET BARS. cSignificantly different
from GRS. dOut of 8 possible points. eOut of 5 possible points
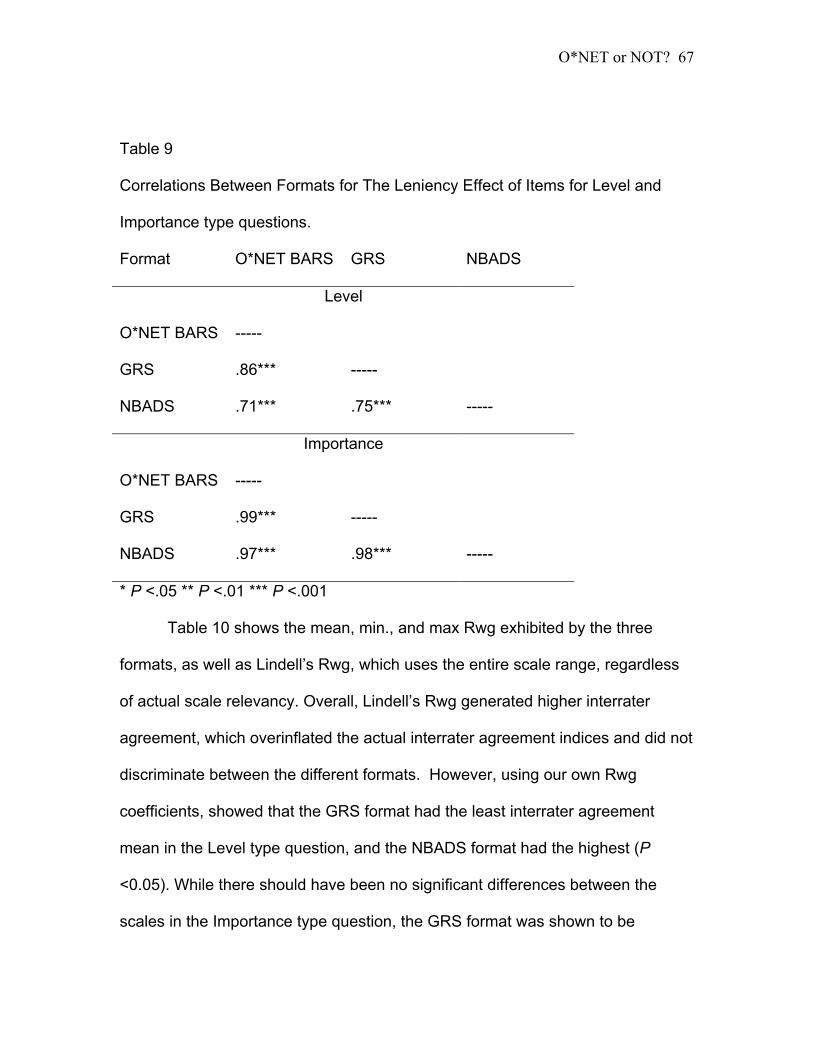
O*NET or NOT?
67
Table 9
Correlations Between Formats for The Leniency Effect of Items for Level and
Importance type questions.
Format O*NET BARS GRS NBADS
Level
O*NET BARS -----
GRS .86*** -----
NBADS .71*** .75*** -----
Importance
O*NET BARS -----
GRS .99*** -----
NBADS .97*** .98*** -----
* P <.05 ** P <.01 *** P <.001
Table 10 shows the mean, min., and max Rwg exhibited by the three
formats, as well as Lindell’s Rwg, which uses the entire scale range, regardless
of actual scale relevancy. Overall, Lindell’s Rwg generated higher interrater
agreement, which overinflated the actual interrater agreement indices and did not
discriminate between the different formats. However, using our own Rwg
coefficients, showed that the GRS format had the least interrater agreement
mean in the Level type question, and the NBADS format had the highest (P
<0.05). While there should have been no significant differences between the
scales in the Importance type question, the GRS format was shown to be
O*NET or NOT?
68
significantly lower than the two other formats. It is important to note, though, that
the actual difference in both question types, though significant, is relatively small.
Overall, Rwg indices for the Level type question showed a medium level of
agreement (Rwg=0.6 on average), with a wide range of agreements between the
items (see Appendix G). The agreement for the Importance Type question is
considered low-medium and has an even bigger range of agreements between
the items. The item order correlations of Rwg between the three formats are
presented in Table 11. In the Level type question, correlations are very low and
non significant. The lowest correlation, r=.015, was seen between the GRS and
O*NET BARS formats and the highest one, r=.34, was seen between GRS and
NBADS formats. The Importance type question, on the other hand, exhibits
higher correlations; The lowest correlation was between the GRS and NBADS
formats of r=.29 (P =.20) and the highest correlation was r=.77 (P <.001)
between the O*NET BARS and GRS formats.
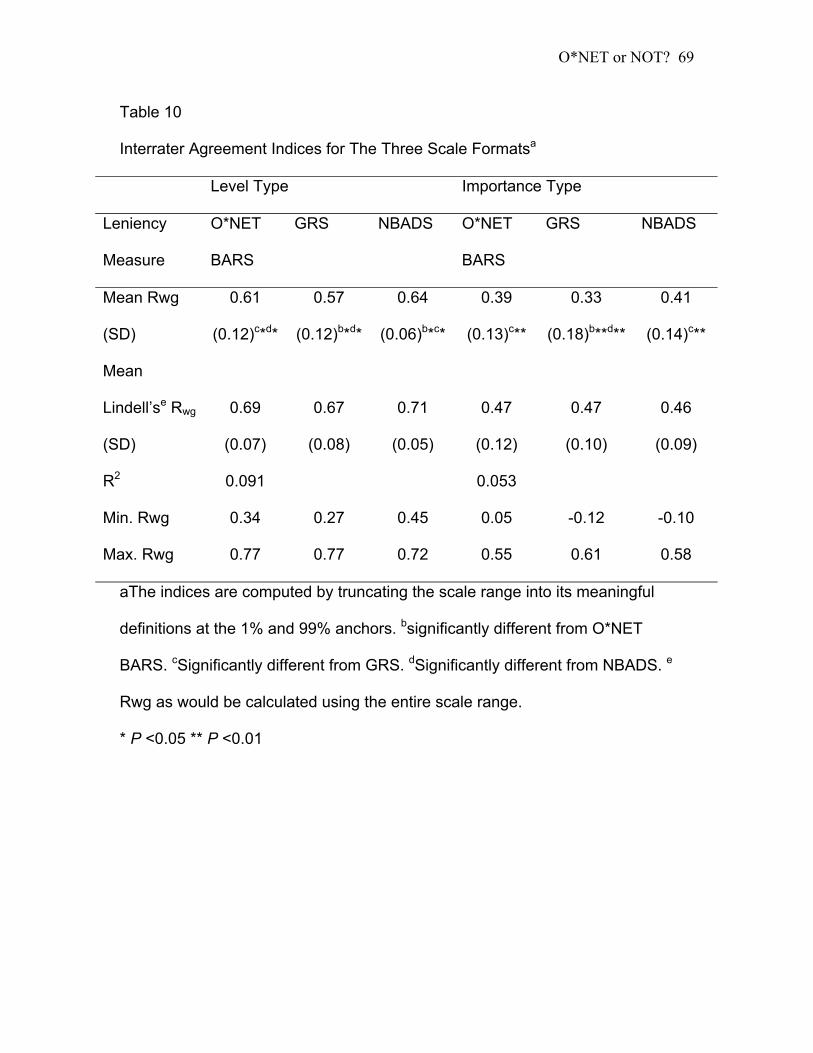
O*NET or NOT?
69
Table 10
Interrater Agreement Indices for The Three Scale Formatsa
Level Type Importance Type
Leniency
Measure
O*NET
BARS
GRS NBADS O*NET
BARS
GRS NBADS
Mean Rwg
(SD)
0.61
(0.12)c*d*
0.57
(0.12)b*d*
0.64
(0.06)b*c*
0.39
(0.13)c**
0.33
(0.18)b**d**
0.41
(0.14)c**
Mean
Lindell’se Rwg
(SD)
0.69
(0.07)
0.67
(0.08)
0.71
(0.05)
0.47
(0.12)
0.47
(0.10)
0.46
(0.09)
R2 0.091 0.053
Min. Rwg 0.34 0.27 0.45 0.05 -0.12 -0.10
Max. Rwg 0.77 0.77 0.72 0.55 0.61 0.58
aThe indices are computed by truncating the scale range into its meaningful
definitions at the 1% and 99% anchors. bsignificantly different from O*NET
BARS. cSignificantly different from GRS. dSignificantly different from NBADS. e
Rwg as would be calculated using the entire scale range.
* P <0.05 ** P <0.01
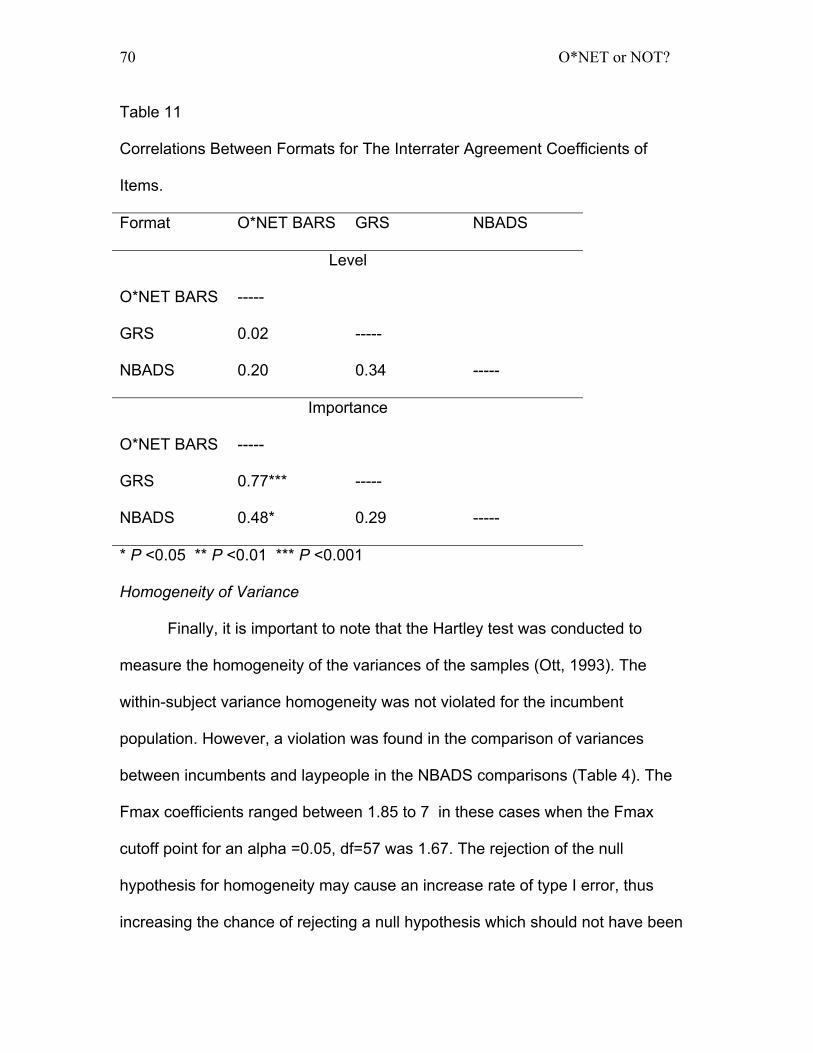
O*NET or NOT?
70
Table 11
Correlations Between Formats for The Interrater Agreement Coefficients of
Items.
Format O*NET BARS GRS NBADS
Level
O*NET BARS -----
GRS 0.02 -----
NBADS 0.20 0.34 -----
Importance
O*NET BARS -----
GRS 0.77*** -----
NBADS 0.48* 0.29 -----
* P <0.05 ** P <0.01 *** P <0.001
Homogeneity of Variance
Finally, it is important to note that the Hartley test was conducted to
measure the homogeneity of the variances of the samples (Ott, 1993). The
within-subject variance homogeneity was not violated for the incumbent
population. However, a violation was found in the comparison of variances
between incumbents and laypeople in the NBADS comparisons (Table 4). The
Fmax coefficients ranged between 1.85 to 7 in these cases when the Fmax
cutoff point for an alpha =0.05, df=57 was 1.67. The rejection of the null
hypothesis for homogeneity may cause an increase rate of type I error, thus
increasing the chance of rejecting a null hypothesis which should not have been
O*NET or NOT?
71
rejected. However, in the cases mentioned in this study violating the
homogeneity assumption, non of the null hypotheses were rejected, thus, if at all,
emphasizing the lack of difference between the two groups.
Discussion
Self-Rating Relevancy
The O*NET system, as conceptualized by its producers, gave theoretically
adequate resolutions to the problems with the DOT, as was conceived by the
APDOT. In reality, however, several limitations exist in the system, which hinder
its ability to replace the DOT as the occupational dictionary of the 21st century. In
fact, it is the author’s notion that, using the O*NET system as it is, not only would
give misleading, biased information, but would be difficult to exercise due to
incumbents’ lack of motivation to reply to these questionnaires. Even with
Peterson et al.’s (1999) suggestion, that “…the most powerful incentive of all will
be … evidence to users of the ‘fruits of labor’ stemming from their cooperation in
data collection” and giving them a $10 pre-participation incentive, was not
enough for getting more than about 30% response rate from non managerial
occupations (Research Triangle Institute, 2001). Managerial occupations that do
not see the $10 incentive as meaningful and have less time on their hands would
probably respond even less. This study, using Peterson’s advise and adding a
$100 raffle (the $10 per person approached was too costly to implement), failed
to get the 30 participants per occupation and four occupations originally intended,
though strenuous attempts have been made.
O*NET or NOT?
72
The supporting results for hypothesis 1a clearly showed that self-evaluation
ratings suffer from a leniency bias, as was found numerous times by other
studies in various occasions and conditions. Regardless of the format moderation
effect, there was a large effect present in both Level and Importance type
questions. Unfortunately, these biases were not uniform across the different
items, and ranged from no leniency to high leniency. Such a large range does not
permit a constant deduction, which would have adjusted the ratings to be similar
to experts’.
Looking at the O*NET BARS format alone, to closely imitate the results
the O*NET system would get if exercised, showed a strong bias of 0.93 scale
points at the level type question, similar to that reported by the O*NET producers
(Mumford et al., 1999) of one point. This both strengthens the notion that the
participants in this study were behaving similarly to the one used by the O*NET
producers, and verifies that indeed a strong bias exists, strongly hindering the
use of incumbents as raters of their own occupations, at least from a leniency
bias perspective.
The Elevation accuracy and Overall-error measures found were large,
showing lack of accuracy in the incumbents’ ratings of their own occupations. In
order to get a rough estimate of accuracy bias that would adhere to the scale,
square root the accuracy measure result by 8, for the Level type or 5, for the
Importance type questions. For example, the O*NET BARS Elevation error for
the Level question of 1.88 can be viewed as an average bias of 1.37 points out of
possible 8 points. As observed, few of the items have exhibited a severity effect,
O*NET or NOT?
73
which lowered the overall leniency effect but increased overall-error and
Elevation measures. The interrater agreement that was found was low-medium,
showing lack of adequate agreement within the participants themselves.
Regardless of the interrater agreement limitation, these findings are not high
enough to speculate whether conformity is superficial or real.
To emphasize the inadequacy of incumbent raters for this purpose, this study
showed that even when comparing the rating ability of incumbents, who are
supposed to provide the best information across all descriptor domains according
to Peterson et al. (1999), to laypeople’s ratings, having only lay knowledge of the
occupations, hardly any differences were noted and mostly low overall effect
sizes were found. The two significant differences found with the O*NET BARS
may have shown the use of knowledge and experience of professionals
regarding their profession, as participants were somewhat confused by the odd
item anchors the O*NET BARS format consists of. Thus, the group that was less
affected by the distraction was the professional, more knowledgeable one. This
assumption is supported by the lack of significant differences in the Importance
type question, which is more conventional and simple in the opinion of many
participants unofficially talked to after participation. In fact, some registered
nurses, managing approximately 40 nurses, have refused, after looking at the
questionnaire, to participate or let their employees participate in the study; They
claimed the O*NET Level type question was very confusing, looked misleading
and unprofessional.
O*NET or NOT?
74
A final finding, which hinders lay raters’ ratings using the O*NET itself is
the not so understood difference between the questions. Many participants,
again, by informal conversation after participation, have told me that the
difference between the Level and Importance questions was not clear enough.
Looking at the correlations between the two questions, across the three scales,
reveals a very high correlation of r=.91. This shows a correlation too high, in my
opinion, to be measuring two discrete constructs. While some correlation should
exist between the two constructs, as in many times, an important item is also
highly used, the found correlation does not distinguish between the two
constructs and is showing high concurrent validity. In other words, it seems the
incumbents were having a hard time understanding the subtle difference
between the two question types, which caused them to rate both questions in
the same manner (i.e., as one construct).
In conclusion, this study confirmed the hypotheses that using incumbents
as rating participants of their own professions is problematic. First, incumbents
exhibited a strong leniency effect. Second, this effect was dramatically different
among the items themselves, making ratings impossible to adjust. Third,
interrater agreement indices were only low-medium for the Importance type
question and medium for the Level type question, showing lack of consensus.
Fifth, an accuracy problem existed which further distorted the results. Finally, the
results were not significantly better than layperson’s ratings. Thus, a different
sample population is needed to rate the occupations in order to get accurate and
less biased ratings.
O*NET or NOT?
75
Scale Formats
The second part of the study tested the adequacy of the new O*NET
BARS format in comparison to a conventional GRS scale and to a new
conceptually different scale called the NBADS.
Hypothesis 4, a validation measure that no other unexpected variables
affected the ratings, was mostly supported. The hypothesis claimed that because
the Importance type question found was identical in all formats, there should
have been no significant differences between formats in the accuracy, agreement
and leniency measures. The only significant difference that was found and was
small, was between the GRS format and the two others in the interrater
agreement, showing that the GRS format agreement was significantly lower than
the other formats’ agreements (n=1071 made it easy to find significance even
with the smallest of differences). These results were sufficient to conclude that
there is a high probability that no significant, uncontrolled variables interfered
with the study’s results. Looking at the effect sizes between formats (Table 7)
verifies that indeed there was no difference between the two groups (i.e. effect
sizes range between 0.02 to 0.13 in the accuracy measures other than Rwg,
showing low-medium effects.
Unlike hypothesized in hypothesis 2, the GRS format, though perceived as
less cumbersome, less confusing and more professional, both by the researcher
and some of the participants, did not show any significant advantages over the
new O*NET BARS. In fact, interrater agreement coefficients had a significant,
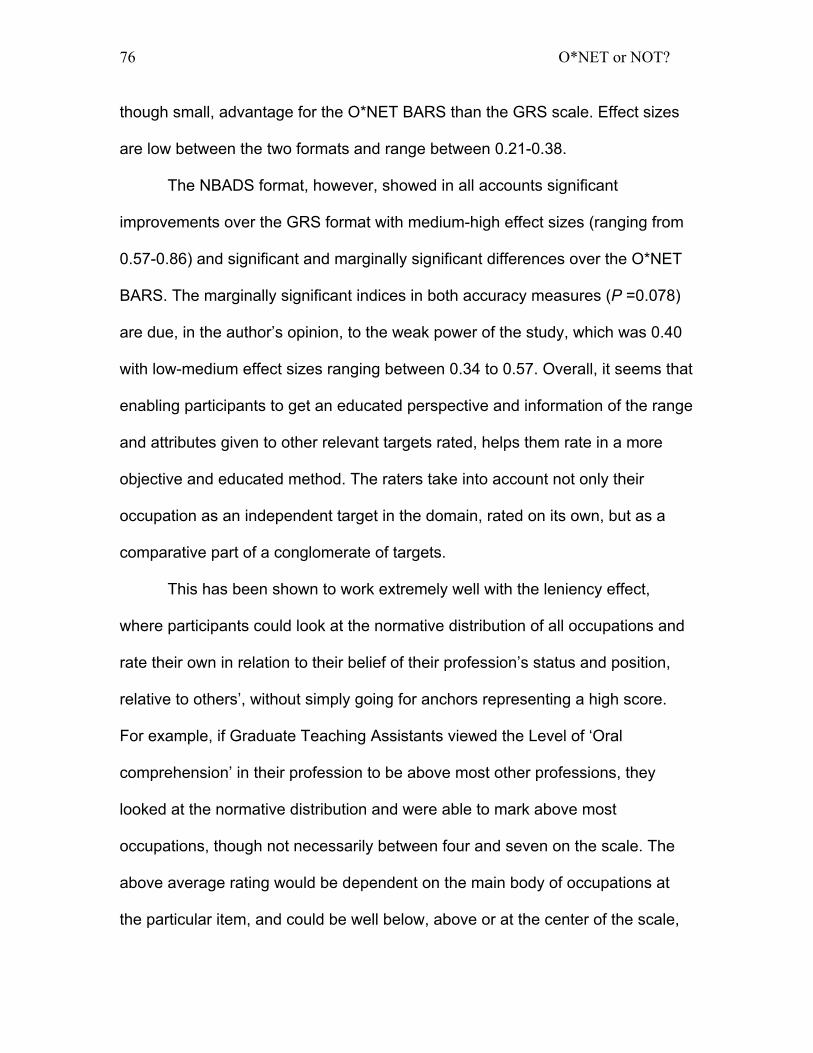
O*NET or NOT?
76
though small, advantage for the O*NET BARS than the GRS scale. Effect sizes
are low between the two formats and range between 0.21-0.38.
The NBADS format, however, showed in all accounts significant
improvements over the GRS format with medium-high effect sizes (ranging from
0.57-0.86) and significant and marginally significant differences over the O*NET
BARS. The marginally significant indices in both accuracy measures (P =0.078)
are due, in the author’s opinion, to the weak power of the study, which was 0.40
with low-medium effect sizes ranging between 0.34 to 0.57. Overall, it seems that
enabling participants to get an educated perspective and information of the range
and attributes given to other relevant targets rated, helps them rate in a more
objective and educated method. The raters take into account not only their
occupation as an independent target in the domain, rated on its own, but as a
comparative part of a conglomerate of targets.
This has been shown to work extremely well with the leniency effect,
where participants could look at the normative distribution of all occupations and
rate their own in relation to their belief of their profession’s status and position,
relative to others’, without simply going for anchors representing a high score.
For example, if Graduate Teaching Assistants viewed the Level of ‘Oral
comprehension’ in their profession to be above most other professions, they
looked at the normative distribution and were able to mark above most
occupations, though not necessarily between four and seven on the scale. The
above average rating would be dependent on the main body of occupations at
the particular item, and could be well below, above or at the center of the scale,
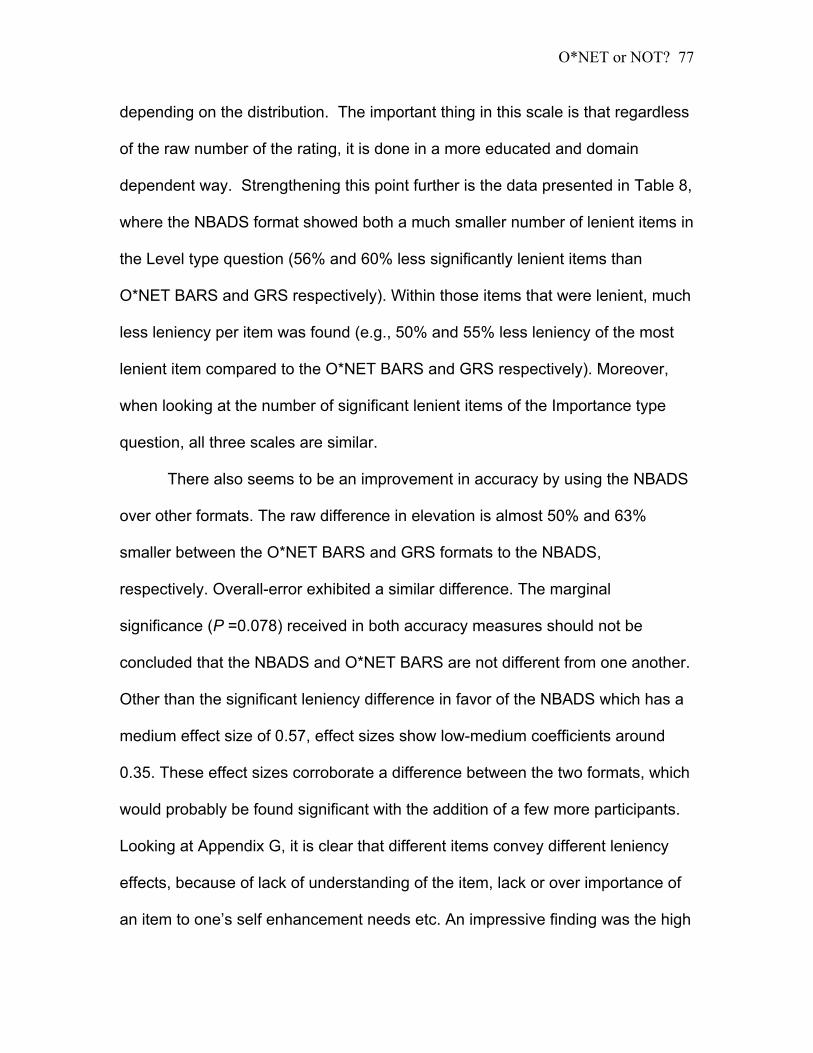
O*NET or NOT?
77
depending on the distribution. The important thing in this scale is that regardless
of the raw number of the rating, it is done in a more educated and domain
dependent way. Strengthening this point further is the data presented in Table 8,
where the NBADS format showed both a much smaller number of lenient items in
the Level type question (56% and 60% less significantly lenient items than
O*NET BARS and GRS respectively). Within those items that were lenient, much
less leniency per item was found (e.g., 50% and 55% less leniency of the most
lenient item compared to the O*NET BARS and GRS respectively). Moreover,
when looking at the number of significant lenient items of the Importance type
question, all three scales are similar.
There also seems to be an improvement in accuracy by using the NBADS
over other formats. The raw difference in elevation is almost 50% and 63%
smaller between the O*NET BARS and GRS formats to the NBADS,
respectively. Overall-error exhibited a similar difference. The marginal
significance (P =0.078) received in both accuracy measures should not be
concluded that the NBADS and O*NET BARS are not different from one another.
Other than the significant leniency difference in favor of the NBADS which has a
medium effect size of 0.57, effect sizes show low-medium coefficients around
0.35. These effect sizes corroborate a difference between the two formats, which
would probably be found significant with the addition of a few more participants.
Looking at Appendix G, it is clear that different items convey different leniency
effects, because of lack of understanding of the item, lack or over importance of
an item to one’s self enhancement needs etc. An impressive finding was the high
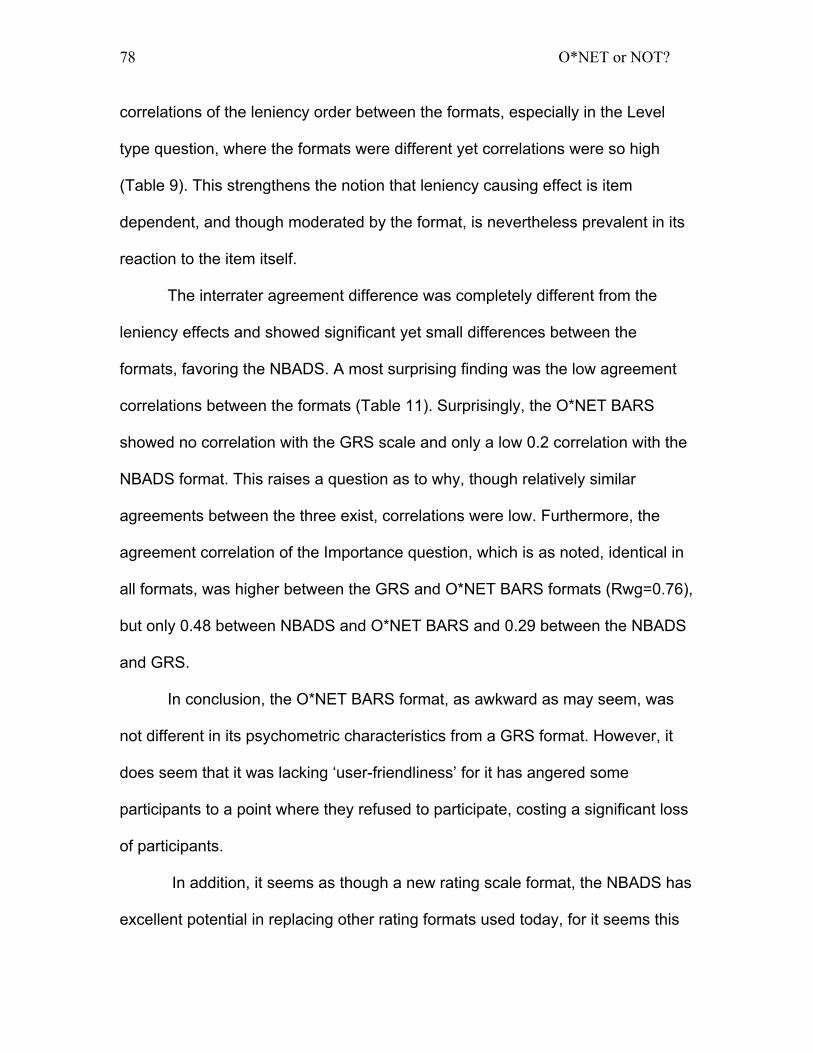
O*NET or NOT?
78
correlations of the leniency order between the formats, especially in the Level
type question, where the formats were different yet correlations were so high
(Table 9). This strengthens the notion that leniency causing effect is item
dependent, and though moderated by the format, is nevertheless prevalent in its
reaction to the item itself.
The interrater agreement difference was completely different from the
leniency effects and showed significant yet small differences between the
formats, favoring the NBADS. A most surprising finding was the low agreement
correlations between the formats (Table 11). Surprisingly, the O*NET BARS
showed no correlation with the GRS scale and only a low 0.2 correlation with the
NBADS format. This raises a question as to why, though relatively similar
agreements between the three exist, correlations were low. Furthermore, the
agreement correlation of the Importance question, which is as noted, identical in
all formats, was higher between the GRS and O*NET BARS formats (Rwg=0.76),
but only 0.48 between NBADS and O*NET BARS and 0.29 between the NBADS
and GRS.
In conclusion, the O*NET BARS format, as awkward as may seem, was
not different in its psychometric characteristics from a GRS format. However, it
does seem that it was lacking ‘user-friendliness’ for it has angered some
participants to a point where they refused to participate, costing a significant loss
of participants.
In addition, it seems as though a new rating scale format, the NBADS has
excellent potential in replacing other rating formats used today, for it seems this
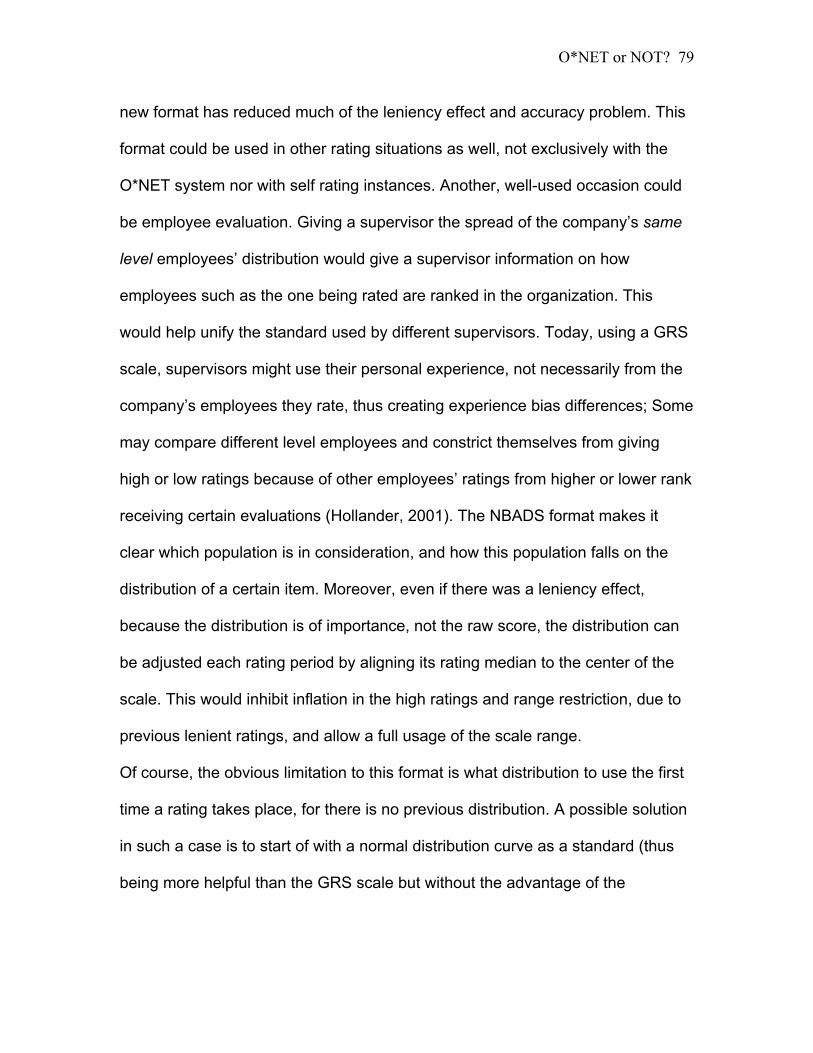
O*NET or NOT?
79
new format has reduced much of the leniency effect and accuracy problem. This
format could be used in other rating situations as well, not exclusively with the
O*NET system nor with self rating instances. Another, well-used occasion could
be employee evaluation. Giving a supervisor the spread of the company’s same
level employees’ distribution would give a supervisor information on how
employees such as the one being rated are ranked in the organization. This
would help unify the standard used by different supervisors. Today, using a GRS
scale, supervisors might use their personal experience, not necessarily from the
company’s employees they rate, thus creating experience bias differences; Some
may compare different level employees and constrict themselves from giving
high or low ratings because of other employees’ ratings from higher or lower rank
receiving certain evaluations (Hollander, 2001). The NBADS format makes it
clear which population is in consideration, and how this population falls on the
distribution of a certain item. Moreover, even if there was a leniency effect,
because the distribution is of importance, not the raw score, the distribution can
be adjusted each rating period by aligning its rating median to the center of the
scale. This would inhibit inflation in the high ratings and range restriction, due to
previous lenient ratings, and allow a full usage of the scale range.
Of course, the obvious limitation to this format is what distribution to use the first
time a rating takes place, for there is no previous distribution. A possible solution
in such a case is to start of with a normal distribution curve as a standard (thus
being more helpful than the GRS scale but without the advantage of the
O*NET or NOT?
80
normative information), and adjust it each rating period using the information that
was collected previously.
Research limitations
This research has a few limitations, which hinder findings to be more
conclusive, and sample size is perhaps the biggest one. Both the goals of getting
at least 30 subjects per occupation and at least four occupations were not met.
Medium effect sizes found show that more significant findings would have been
found had these goals been reached. For example, exhibiting a low-medium
effect sizes, it is reasonable to conclude that the NBADS format would have been
found significantly more accurate than the O*NET BARS format with a bigger
sample size.
Another limitation is the lack of different occupational types in the sample.
An interesting question would be whether a difference in leniency and accuracy
measures between occupations exhibiting different prestige or coming from a
blue vs. white collar background, exist.
Future Research
O*NET system.
This study has shown that the O*NET BARS, although never discussed in
the literature, and deviant from a regular BARS format, was nevertheless no
different than a common GRS format, at least for leniency, accuracy and
interrater agreement measures. Its drawback was its anchors, which caused
some discomfort and confusion with some prospective participants. In order to
use the O*NET BARS, more research is in order, which would test the different
O*NET or NOT?
81
verbal anchors, which may be either too far fetched for some participants to
relate and understand, as well as language level, which may be too complex for
some participants. Furthermore, now that it is clear that incumbents cannot be
relied upon to give accurate, lenient free results, more research is needed to look
for other adequate participant populations who would rate more adequately.
Perhaps the small leniency effect and accuracy measures the NBADS exhibited
is good enough (though not perfect) for use and would compensate for self-rating
biases, if better rating participants (other than experts) cannot be found.
The different items, especially those with the highest leniency bias, should be
studied to reveal the reason(s) for their high bias, and changed, if possible,
accordingly. Of course, this would have to be done to all O*NET system items,
which consist of several dimensions, each having a few dozen items, and not
only the 21 items used in this study. Finally, because of the impressive
consistency of leniency order (i.e. high correlations) between the different
formats, maybe a constant could be found for each item that would be deducted
or added to incumbents’ ratings in order to cause their ratings to be closer to
experts’. This would, of course, have to be followed by an examination of the
effects of different occupation incumbents to the items.
NBADS format.
Due to its originality, there are no other studies on the NBADS format.
This study is promising but more studies are needed in order to conclude
whether this conceptually different format is indeed superior to the common

O*NET or NOT?
82
formats used today. A good idea would be to test this format in other situations,
such as the one mentioned (i.e. employee evaluation).

O*NET or NOT?
83
Bibliography
Albaum, G., Best R. & Hawkins D. (1981). Continuous VS Discrete
Semantic Differential Rating Scales. Psychological Reports, 49, 83-86.
Barrett, R.S., Taylor, E.K., Parker, J.W., & Martens, L. (1958). Ratings
scale content: Scale information and supervisory ratings. Personnel Psychology,
11, 333-346.
Benson, P.G., Buckley, Ronald M. & Hall, S. (1988). The impact of rating
scale format on rater accuracy: An evaluation of the Mixed standard scale.
Journal of Management, 14(3), 415-423.
Bernardin, J.H. & Smith, P.C. (1981). A clarification of some issues
regarding the development and use of behaviorally anchored rating scales
(BARS). Journal of Applied Psychology, 66(4), 458-463.
Blanz, F. & Ghiselli, E. E. (1972). The mixed standard scale: A new rating
system. Personnel Psychology, 25, 185-199.
Borman, W. C. (1979). Format and training effects on rating accuracy and
rater errors. Journal of Applied Psychology, 64 (4), 410-421.
Borman, W. C., & Dunnette, M. D. (1975). Behavior-based traits versus
trait-oriented performance ratings: An empirical study. Journal of Applied
Psychology, 60 (5), 561-565.
Bozeman, D.P. (1997). Interrater agreement inmulti-source performance
appraisal: A commentary. Journal of Organizational Behavior, 18, 313-316.
O*NET or NOT?
84
Campbell, D.J. & Lee, C. (1988). Self-Appraisal in Performance
Evaluation: Development Versus Evaluation. Academy of Management Review,
13(2), 302-314.
Campbell, M.D., Arvey, R.D. & Hellervik, L.V. (1971). The development
and evaluation of behaviorally based rating scales. Journal of Applied
Psychology, 57(1), 15-22.
Cardy, R.L. & Krzystofiak, F.J. (1988). Observation and rating accuracy :
WYSIWYG ? Paper preseneted at the annual convention of the Society for
Industrial/Organizational Psychology, Dallas.
Cascio, W. F. (1998). Applied Psychology in Human Resource
Management. Upper Saddle River, NJ: Prentice Hall.
Cascio, W. (1998). Applied Psychology in Personnel Management.
Reston, Virginia: Reston Publishing Company, Inc, a Prentice Hall Company. P.
317-336.
Cleveland, J. N., Murphy, K. R., & Williams, R. E. (1989). Multiple uses of
performance appraisal and correlates. Journal of Applied Psychology, 74 (1),
130-135.
Cooper, W. (1981). Conceptual similarity as a source of illusory halo in job
performance ratings. Journal of Applied Psychology, 66, 302-307.
Cronbach, L. J., (1955). Processes affecting scores on “understanding of
others” and “assumed similarity.” Psychological Bulletin, 52, 177-193.
O*NET or NOT?
85
Cronbach, L.J., Gleser, G.C., Nanda, H., & Rajaratnam, N. (1972). The
dependability of behavioral measurements : theory of gernealizability for scores
and profiles. New-York : John Wiley.
DeNisi, A.S., Shaw, J.B. (1977). Investigation of the uses of self-reports of
abilities. Journal of Applied Psychology. Vol 62(5) Oct 1977, 641-644
Dunnette, M.D. Introduction. [chapter] In Peterson, N.G., Mumford, M.D.,
Borman, W.C., Jeanneret, P.R & Fleishman, E.A. (Eds.) (1999). An Occupational
informational system for the 21st century: The development of O*NET. 3-7.
Dye, D. & Silver, M. The Origins of O*NET. [chapter] In Peterson, Norman
G., Mumford, M.D., Borman, W.C., Jeanneret, P.R & Fleishman, E.A. (Eds.)
(1999). An Occupational informational system for the 21st century: The
development of O*NET. 9-19.
Farh J. & Werbel, J.D. (1986). The effects of purpose of the appraisal and
expectation of validation on self-appraisal leniency. Journal of Applied
Psychology, 71(3), 527-529.
Farh J., Webel, J.D. & Bedeian A.G. (1988). An empirical investigation of
self-appraisal-based performance evaluation. Personnel Psychology. 41(1), 141-
156.
Fleishman, E.A. & Mumford, M.D. (1988). The ability requirements scales.
In S. Gael (Ed.), The job analysis handbook for business, industry and
government. pp. 917-935. New York: Wiley.

O*NET or NOT?
86
French-Lazovik, G., & Gibson, C. L. (1984) effects of verbally labeled
anchor points on the distributional parameters of rating measures. Applied
Psychological Measurement, 8 (1), 49-57
Friedman, B.A., & Cornelius, E.T. (1976). Effect of rater participation in
scale construction on the psychometric characteristics of two rating scale
formats. Journal of Applied Psychology 61(2), pp. 210-216.
Friedman, L., & Harvey, R.J. (1986). Can raters with reuced job
descriptive information provide accurate position analysis questionnaire (PAQ)
ratings? Personnel Psychology, 39, 779-790.
Gomez-Mejia, L.R. (1988). Evaluating employee performance: Does the
appraisal instrument make a difference? Journal of organizational behavior
management, 9(2), 155-172.
Hake, H.W., & Garner, W.R (1951). The effect of presenting various
number of discrete steps on scale reading accuracy. Journal of experimental
psychology, 51, 358-366
Harvey R.J. & Lozada-Larsen, S.R. (1988). Influence of amount of job
descriptive information on jhob analysis rating accuracy. Journal of Applied
Psychology, 73, 457-461.
Harris, M.M. & Schaubroeck, J. (1988). A meta-analysis of self-supervisor,
self-peer, and peer-supervisor ratings. Personnel Psychology, 41, 43-62.
Heneman, R L. (1986). The relationship between supervisory ratings and results-
Oriented measures of performance: A meta analysis. Personnel Psychology, 39,
811-826.
O*NET or NOT?
87
Hollander, R. (2001, June). Bank Leumi’s employee evaluation report
2001: Progress, limitation and suggested solutions. Unpublished manuscript.
Hopkins, K.D. Educational and Psychological Measurement and
Evaluation (8th Edition). Allyn & Bacon:Viacom, Needham Heights, MA. 1998.
Hozbach, R.L. (1978). Rater Bias in Performance Ratings: Superior, Self-,
and Performance Ratings. Journal of Applied Psychology, 63(5), 579-588.
Jacobs, R. R. (1986). Numerical rating scales. In R. A. Berk (ed.),
Performance Assessment: Methods and Applications. Baltimore, MD: Johns
Hopkins University Press. pp. 82-99.
Keaveny, T.J. & McGann, Anthony F. (1975). A comparison of behavioral
expectation scales and graphic rating scales. Journal of Applied Psychology,
60(6), 695-703.
Kingstrom, P.O. (1981). A critical analysis of studies comparing
behaviorally anchored rating scales (BARS) and other rating formats. Personnel
Psychology, 34(2), 263-289.
Kingstrom, P.O. & Bass, A.R. (1981). Critical analysis of studies
comparing behaviorally anchored rating scales (BARS) and other rating formats.
Personnel Psychology. 34(2), 263-289.
Kunin, T. (1955). The Construction of a New Type of Attitude Measure.
Personnel Psychology, 8, 65-77.
Landy, F.J. & Farr, J.L. (1980) Performance Rating. Psychological
Bulletin, 87(1), 72-107.
O*NET or NOT?
88
Levine, E, L. (1980). Introductory remarks for the symposium
“Organizational applications of self appraisal and self assessment: another look.”
Personnel psychology, 33, 259-262.
Lindell, M.K., Brandt, C.J., & Whitney, D.J. (1999). A revised index of
interrater agreement for multi-item ratings of a single target. Applied
Psychological Measurement, 23 127-135.
Lissitz, R.W. & Green, S.B. (1975). Effect of the number of scale points on
reliability: A Monte Carlo Approach. Journal of applied psychology, 60, 10-13.
Lord, F. M., & Novick, M.R. (1968). Statistical theories of mental test
scores. Reading, MA: Addison-Wesley.
Mabe, P.A. III & West, S.G. (1982). Validity of Self-Evaluation of Ability: A
Review and Meta-Analysis. Journal of Applied Psychology, 67(3), 280-297.
Matell M.S. & Jacoby J. (1971) Is there an optimal number of alternatives
for Likert-scale items? Study1: Reliability and Validity. Educational psychological
Measurement, 31, 657-674
McKelvie, S.J. (1978). Graphic rating scales- How many categories?
British Journal of Psychology, 69, 185-202.
Messick, S. (1995). Validity of psychological assessment: validation of
inferences from personal responses and performances as scientific inquiry into
score meaning. American Psychologist, 50, 741-749.
Meyer H. (1980). Self-appraisal of job performance. Personnel
Psychology, 33, 291-295.
O*NET or NOT?
89
Mumford, M.D. & Peterson, N.G. The O*NET Content Model: Structural
Considerations in Describing Jobs. [chapter] In Peterson, N.G., Mumford, M.D.,
Borman, W.C., Jeanneret, P.R & Fleishman, E.A. (Eds.) (1999). An Occupational
informational system for the 21st century: The development of O*NET. 21-30.
Mumford, M.D., Peterson, N.G. & Childs R.A. Basic and cross functional
skills. [chapter] In Peterson, Norman G., Mumford, M.D., Borman, W.C.,
Jeanneret, P.R & Fleishman, E.A. (Eds.) (1999). An Occupational informational
system for the 21st century: The development of O*NET. 49-69.
Murphy, K.R., & Balzer, W.K. (1989). Rater errors and rating accuracy.
Journal of Applied Psychology, 74, 619-624
Murphy, K. R; Cleveland, J.N. Understanding performance appraisal:
Social, organizational, and goal-based perspectives. Thousand Oaks, CA, USA:
Sage Publications, Inc. 1995, xvii, 267-298.
Murphy, K. R., & Constans, J. I. (1987). Behavioral anchors as a source of
bias in rating. Journal of Applied Psychology, 72 (4), 573-577.
Newcomb, T. (1931). A design to test the validity of a rating technique.
Journal of Educational Psychology. 22, 279-289
O*NET Ability Questionnaire. Retrived October 15th, 2000, from
http://www.onetcenter.org
Ott, R.L. (1993). An Introduction To Statistical Methods And Data
Analysis. Belmont, CA: Wadsworth Publishing Company. Pp785-787, A-35.
Parrill, S. (1998). Revisiting Rating Format Research: Computer-Based
Rating Formats and Components of Accuracy. Thesis- Virginia Tech University.
O*NET or NOT?
90
Peterson, N.G., Mumford, M.D., Levin, K.Y, Green, J & Waksberg, J.
Research Method: Development and Field Testing of the Content Model.
[chapter] In Peterson, N. G., Mumford, M.D., Borman, W.C., Jeanneret, P.R &
Fleishman, E.A. (Eds.) (1999). An Occupational informational system for the 21st
century: The development of O*NET. 31-47.
Primoff, E.S. (1980). The use of self-assessments in examining.
Personnel psychology, 33, 283-289.
Research Triangle Institute, Statistics Research Division (2000).
RESULTS OF STATISTICAL ANALYSIS OF PRETEST. Retrived October 10,
2001, from http://www.onetcenter.org.
Sedikides, C. & Strube, M (1997). Self Evaluation: TO thine own self be
good, to thine own self be sure, to thine own self be true, and to thine own self be
better. In M.P. Zanna (Ed.), Advances in experimental social psychology, 29,
209-269. New-York: Academic Press.
Sisson, E.D. (1984). Forced-Choice: The new army rating. Personnel
Psychology, 1, 365-381.
Smith, P. C., & Kendall, L. M. (1963). Retranslation of expectations: An
approach to the construction of unambiguous anchors for rating scales. Journal
of Applied Psychology, 47 (2), 149-155.
Sulsky L.M. and Balzer W.K. (1988). Meaning and Measurement of
Performance Rating Accuracy: Some Methodological and Theoretical Concerns.
Journal of Applied Psychology 73(3), 497-506.
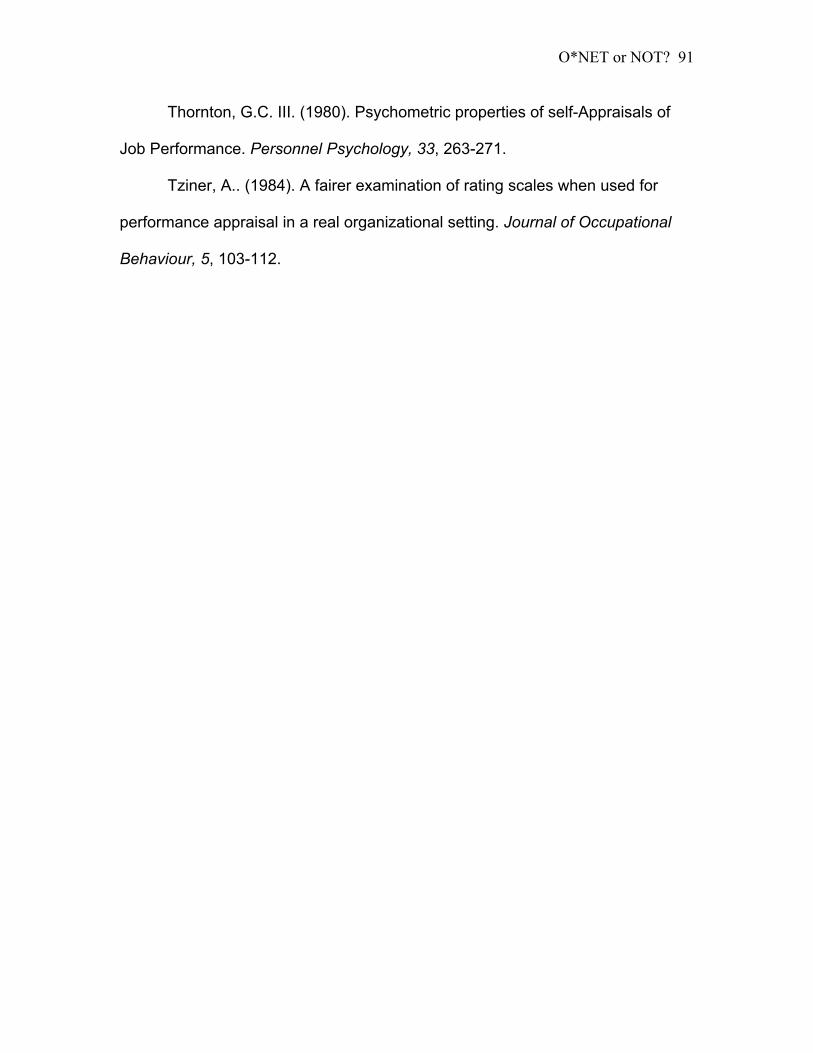
O*NET or NOT?
91
Thornton, G.C. III. (1980). Psychometric properties of self-Appraisals of
Job Performance. Personnel Psychology, 33, 263-271.
Tziner, A.. (1984). A fairer examination of rating scales when used for
performance appraisal in a real organizational setting. Journal of Occupational
Behaviour, 5, 103-112.
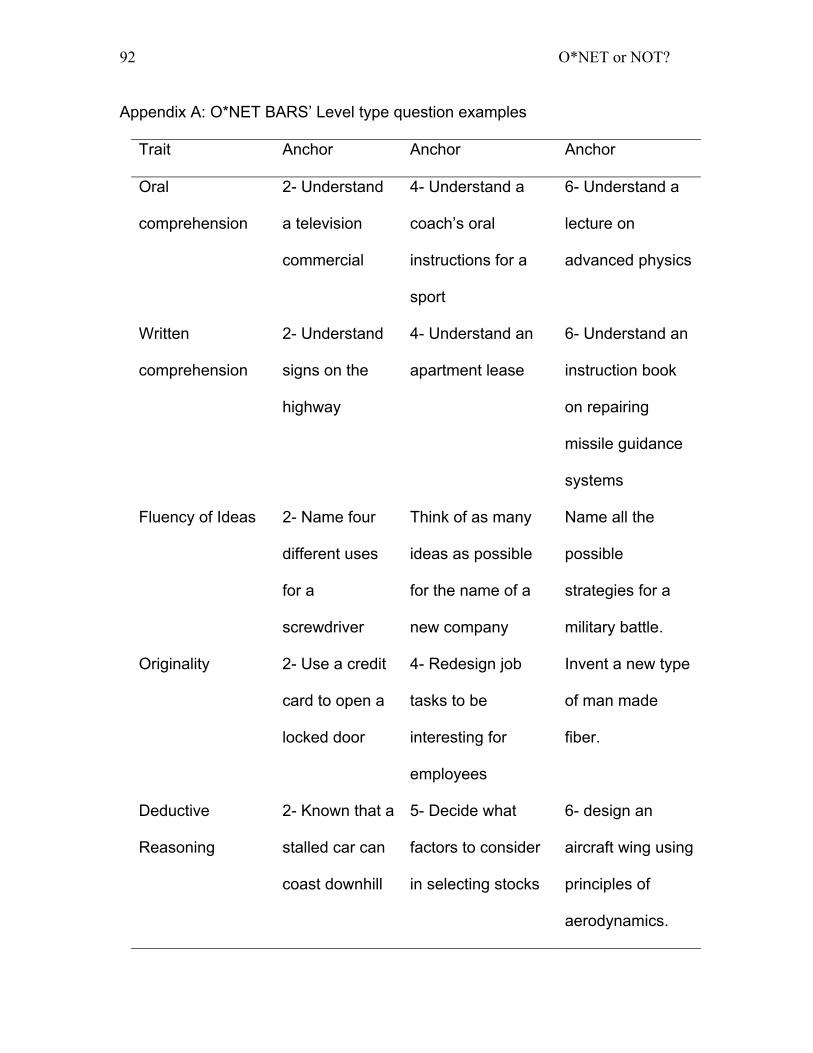
O*NET or NOT?
92
Appendix A: O*NET BARS’ Level type question examples Table A: O*NET BARS’ Level type question examples
Trait Anchor Anchor Anchor
Oral
comprehension
2- Understand
a television
commercial
4- Understand a
coach’s oral
instructions for a
sport
6- Understand a
lecture on
advanced physics
Written
comprehension
2- Understand
signs on the
highway
4- Understand an
apartment lease
6- Understand an
instruction book
on repairing
missile guidance
systems
Fluency of Ideas 2- Name four
different uses
for a
screwdriver
Think of as many
ideas as possible
for the name of a
new company
Name all the
possible
strategies for a
military battle.
Originality 2- Use a credit
card to open a
locked door
4- Redesign job
tasks to be
interesting for
employees
Invent a new type
of man made
fiber.
Deductive
Reasoning
2- Known that a
stalled car can
coast downhill
5- Decide what
factors to consider
in selecting stocks
6- design an
aircraft wing using
principles of
aerodynamics.
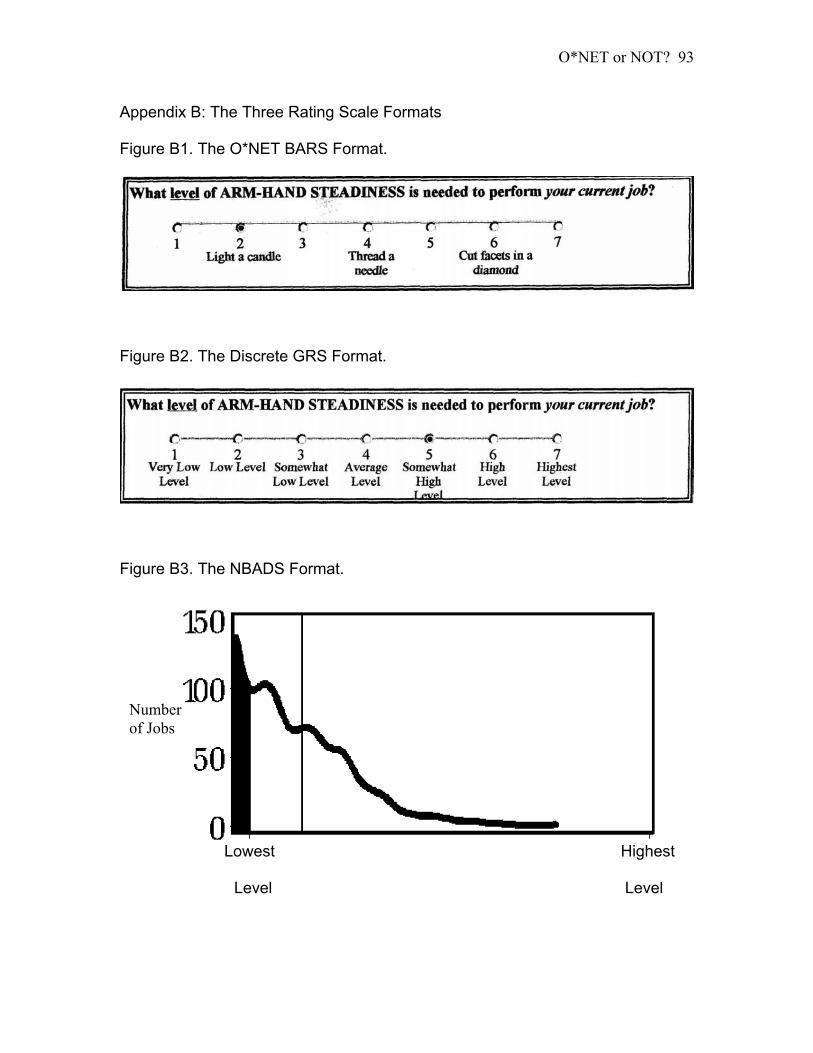
O*NET or NOT?
93
Appendix B: The Three Rating Scale Formats
Figure B1. The O*NET BARS Format.
Figure B2. The Discrete GRS Format.
Figure B3. The NBADS Format.
Number of Jobs
Lowest Highest
Level Level
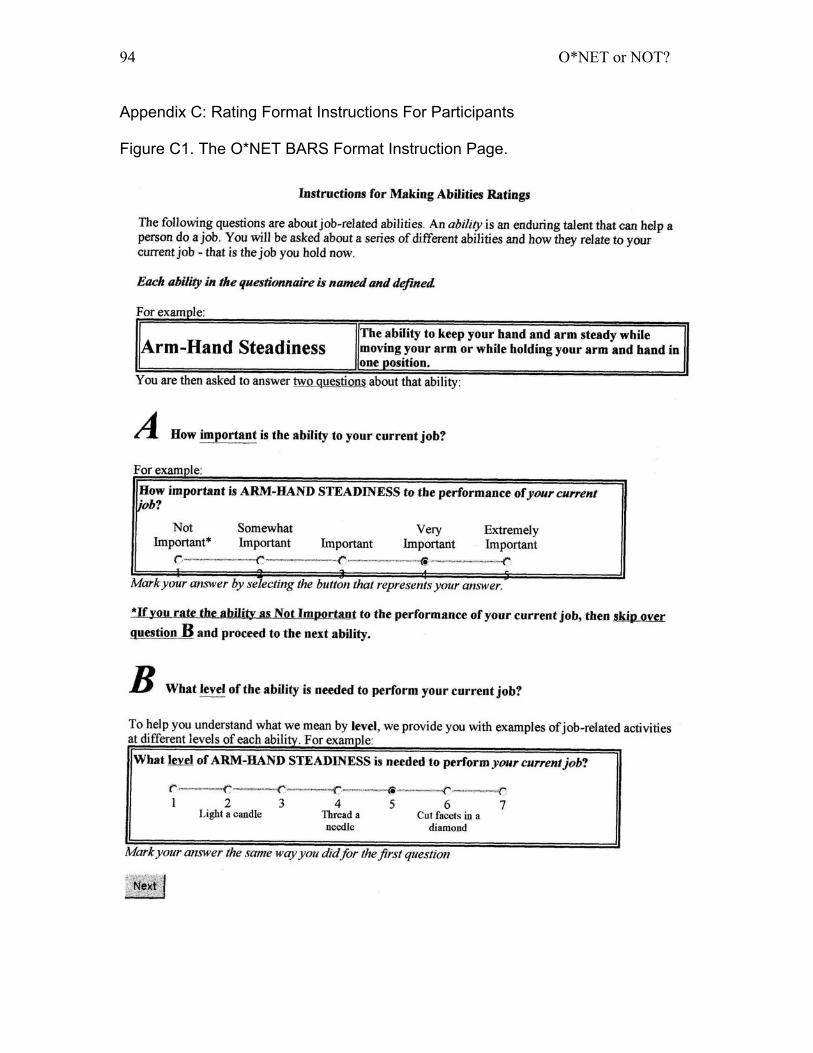
O*NET or NOT?
94
Appendix C: Rating Format Instructions For Participants
Figure C1. The O*NET BARS Format Instruction Page.
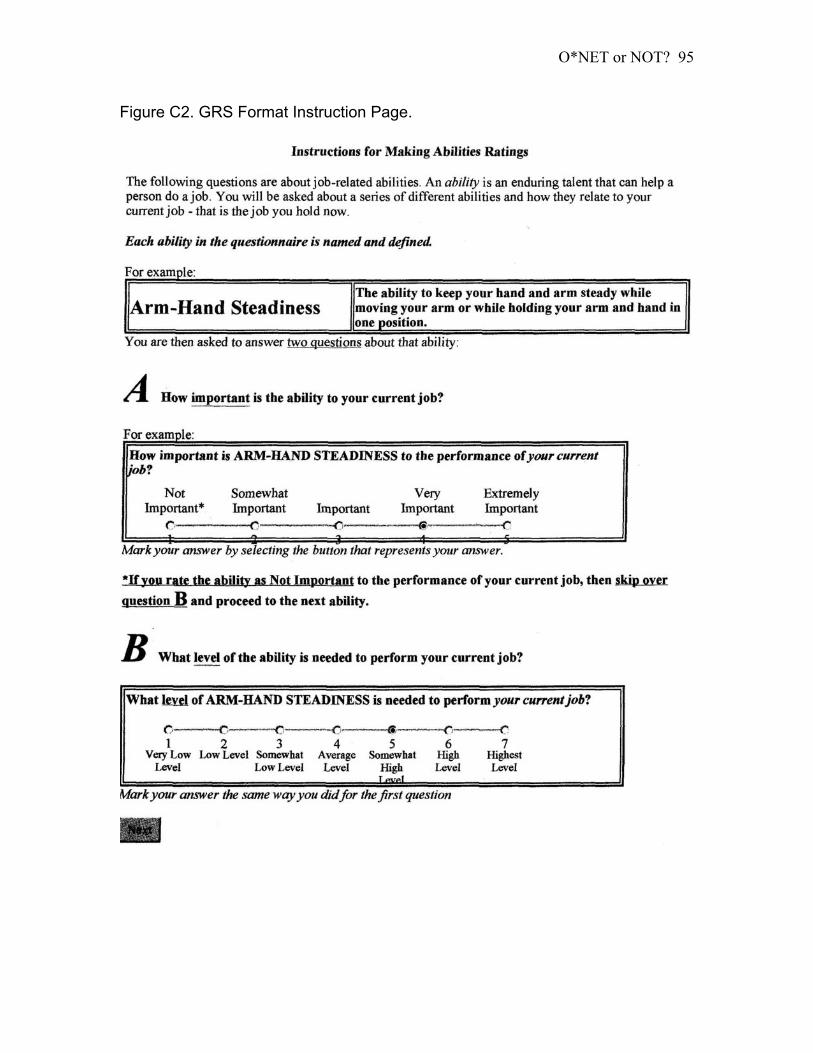
O*NET or NOT?
95
Figure C2. GRS Format Instruction Page.
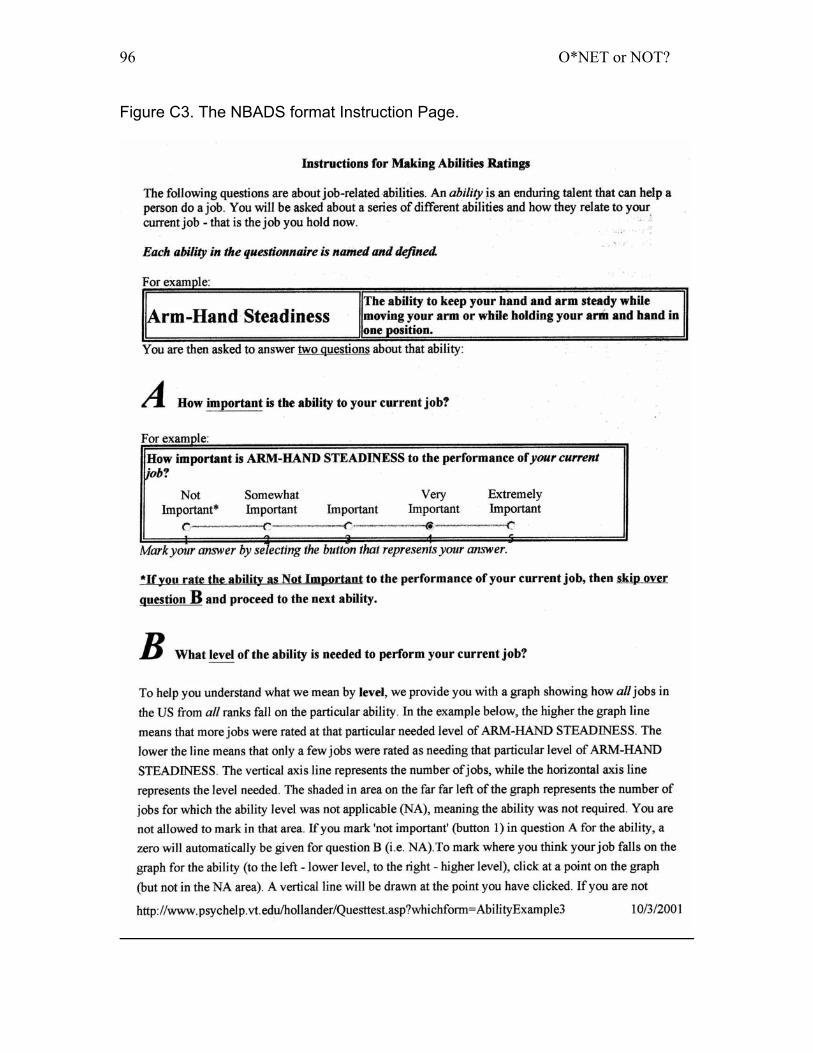
O*NET or NOT?
96
Figure C3. The NBADS format Instruction Page.
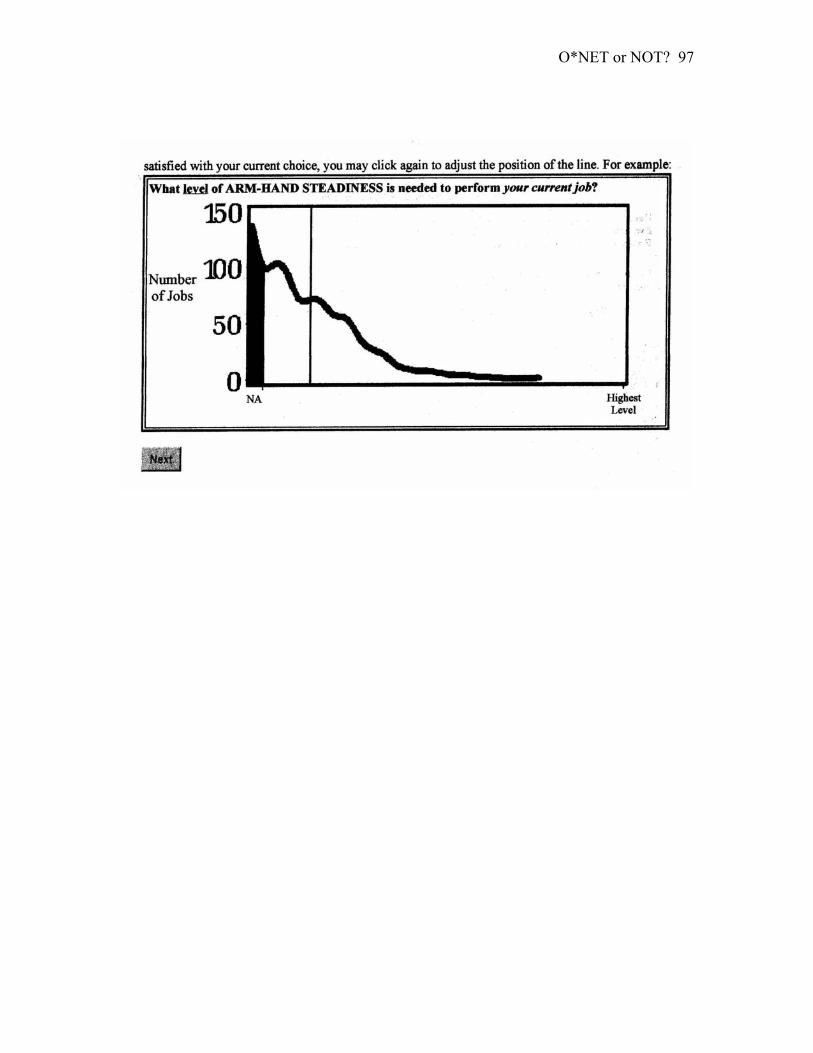
O*NET or NOT?
97
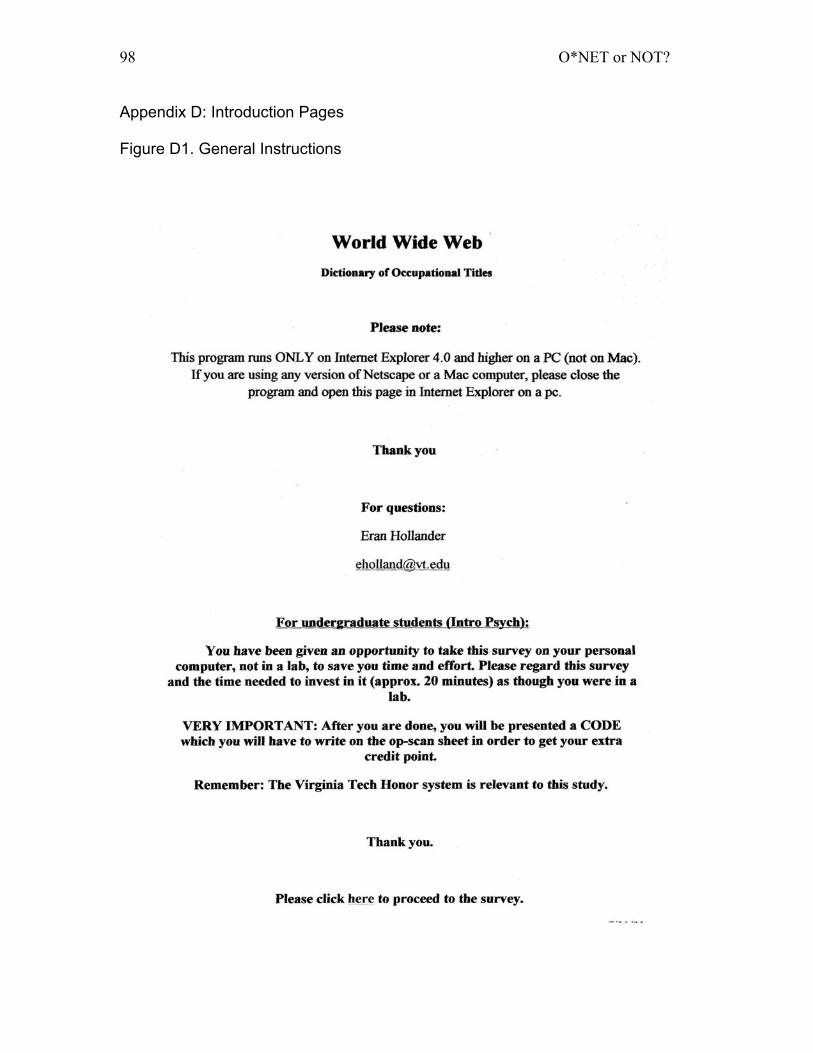
O*NET or NOT?
98
Appendix D: Introduction Pages
Figure D1. General Instructions
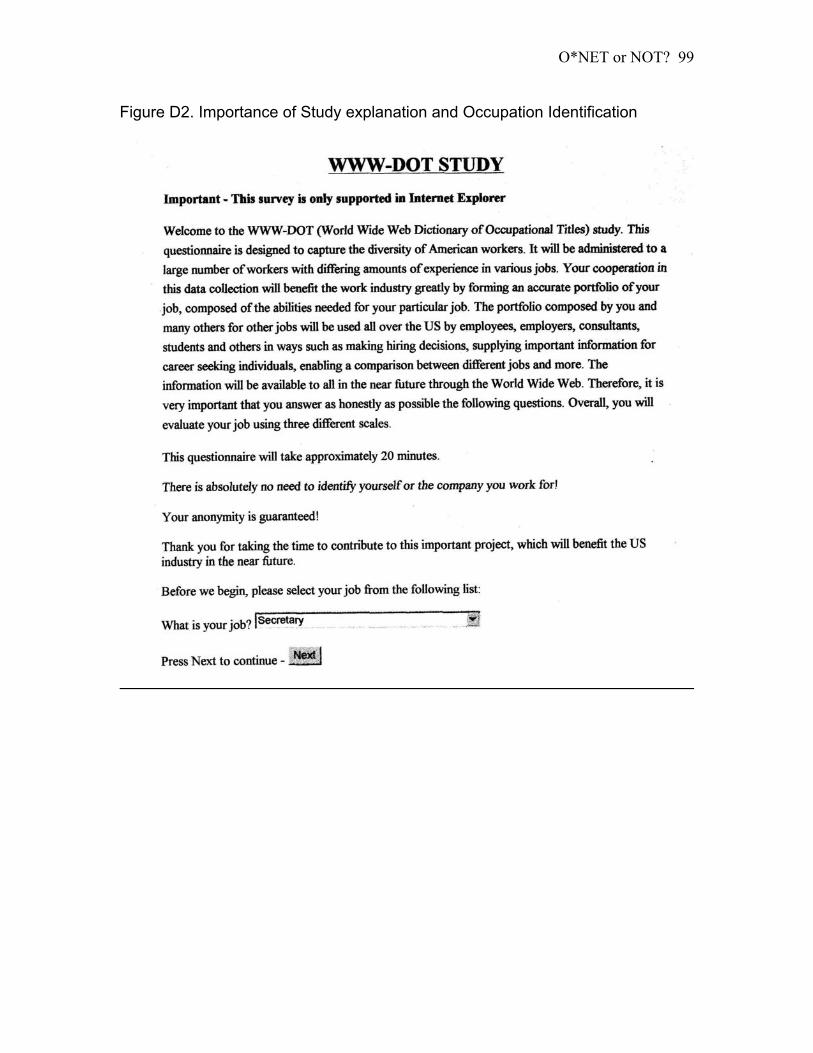
O*NET or NOT?
99
Figure D2. Importance of Study explanation and Occupation Identification
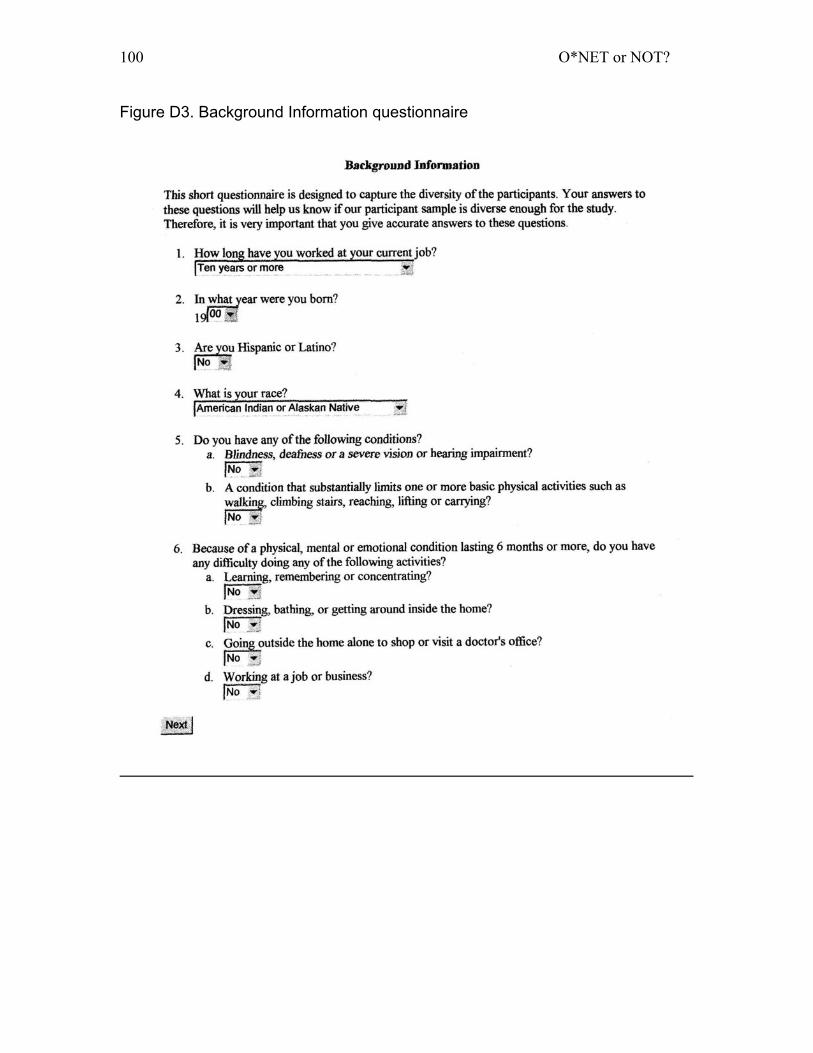
O*NET or NOT?
100
Figure D3. Background Information questionnaire
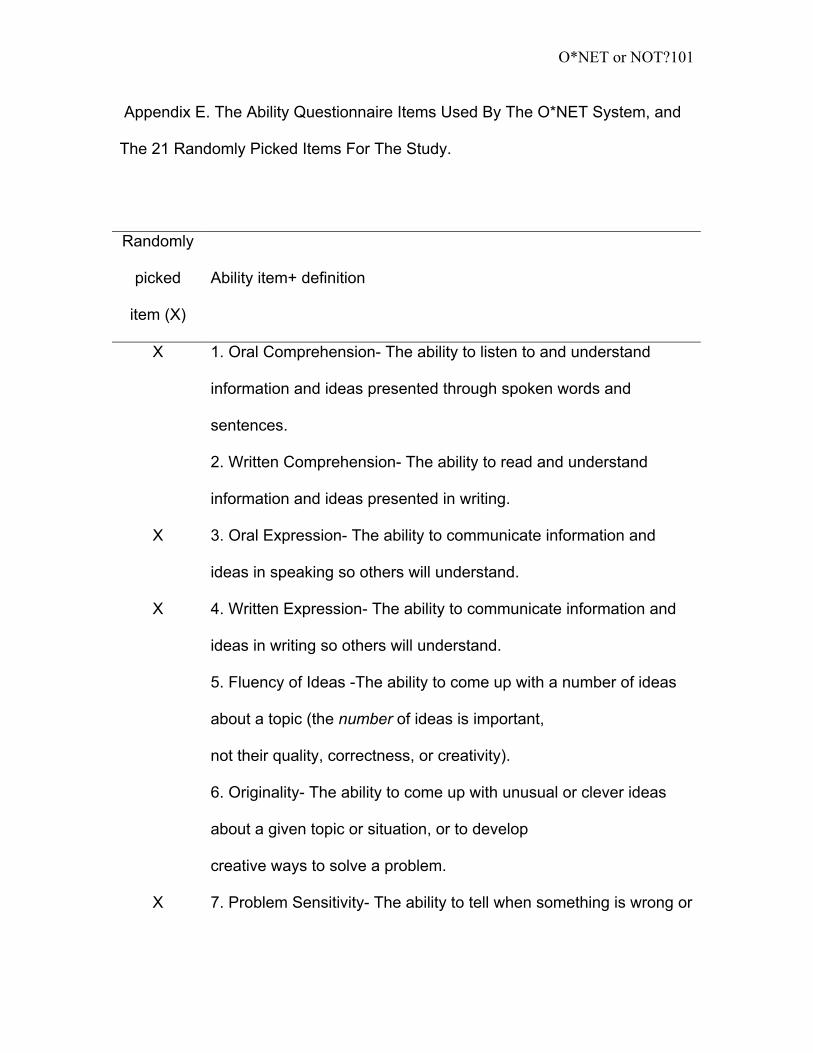
O*NET or NOT?
101
Appendix E. The Ability Questionnaire Items Used By The O*NET System, and
The 21 Randomly Picked Items For The Study.
Table E: The Ability Questionnaire Items Used By The O*NET System, and The 21 Randomly Picked Items For The Study. Randomly
picked
item (X)
Ability item+ definition
X 1. Oral Comprehension- The ability to listen to and understand
information and ideas presented through spoken words and
sentences.
2. Written Comprehension- The ability to read and understand
information and ideas presented in writing.
X 3. Oral Expression- The ability to communicate information and
ideas in speaking so others will understand.
X 4. Written Expression- The ability to communicate information and
ideas in writing so others will understand.
5. Fluency of Ideas -The ability to come up with a number of ideas
about a topic (the number of ideas is important,
not their quality, correctness, or creativity).
6. Originality- The ability to come up with unusual or clever ideas
about a given topic or situation, or to develop
creative ways to solve a problem.
X 7. Problem Sensitivity- The ability to tell when something is wrong or

O*NET or NOT?
102
is likely to go wrong. It does not involve solving the problem, only
recognizing that there is a problem.
8. Deductive Reasoning- The ability to apply general rules to
specific problems to produce answers that make sense.
9. Inductive Reasoning- The ability to combine pieces of information
to form general rules or conclusions (includes finding a relationship
among seemingly unrelated events).
10. Information Ordering -The ability to arrange things or actions in a
certain order or pattern according to a specific rule or set of rules
(e.g., patterns of numbers, letters, words, pictures, mathematical
operations).
11. Category Flexibility- The ability to generate or use different sets
of rules for combining or grouping things in different ways.
12. Mathematical Reasoning- The ability to choose the right
mathematical methods or formulas to solve a problem.
13. Number Facility- The ability to add, subtract, multiply, or divide
quickly and correctly.
X 14. Memorization- The ability to remember information such as
words, numbers, pictures, and procedures.
15. Speed of Closure- The ability to quickly make sense of,
combine, and organize information into meaningful patterns.
X 16. Flexibility of Closure- The ability to identify or detect a known
pattern (a figure, object, word, or sound) that is hidden in other

O*NET or NOT?
103
distracting material.
X 17. Perceptual Speed -The ability to quickly and accurately compare
similarities and differences among sets of letters, numbers, objects,
pictures, or patterns. The things to be compared may be presented
at the same time or one after the other. This ability also includes
comparing a presented object with a remembered object.
18. Spatial Orientation- The ability to know your location in relation
to the environment or to know where other objects are in relation to
you.
19. Visualization- The ability to imagine how something will look
after it is moved around or when its parts are moved or rearranged.
20. Selective Attention -The ability to concentrate on a task over a
period of time without being distracted.
21. Time Sharing- The ability to shift back and forth between two or
more activities or sources of information (such as speech, sounds,
touch, or other sources).
X 22. Arm-Hand Steadiness -The ability to keep your hand and arm
steady while moving your arm or while holding your arm and hand in
one position.
23. Manual Dexterity- The ability to quickly move your hand, your
hand together with your arm, or your two hands to grasp,
manipulate, or assemble objects.
24. Finger Dexterity- The ability to make precisely coordinated
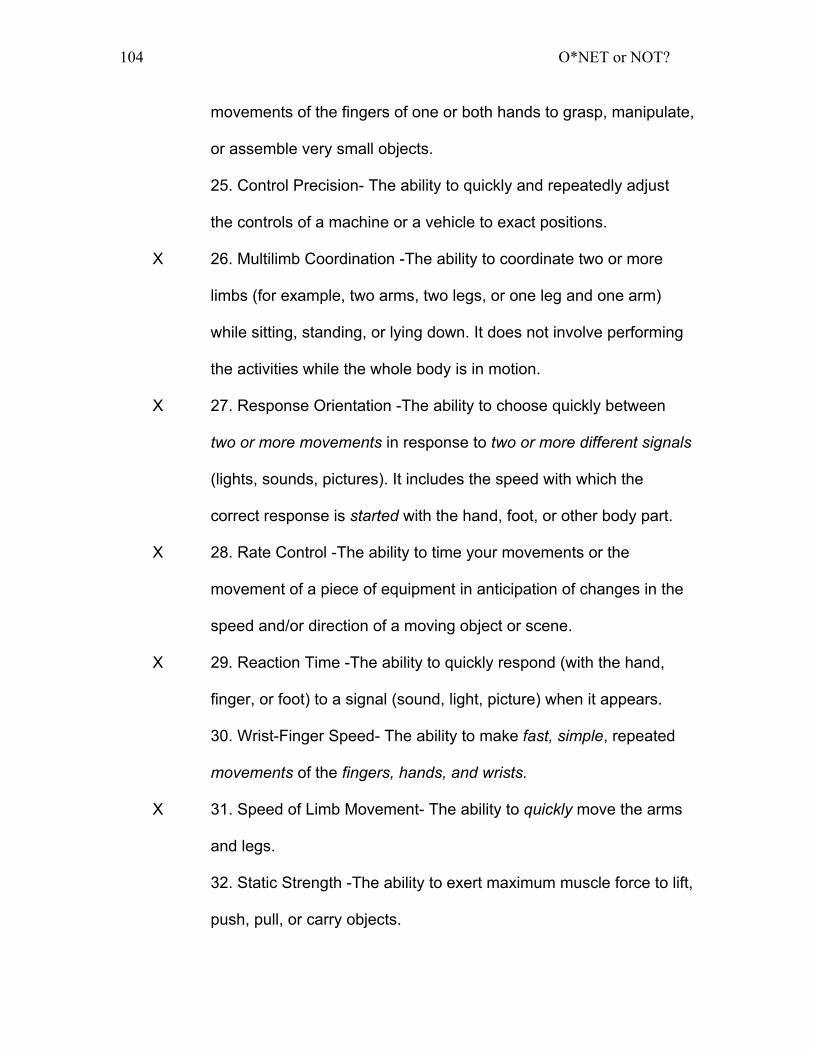
O*NET or NOT?
104
movements of the fingers of one or both hands to grasp, manipulate,
or assemble very small objects.
25. Control Precision- The ability to quickly and repeatedly adjust
the controls of a machine or a vehicle to exact positions.
X 26. Multilimb Coordination -The ability to coordinate two or more
limbs (for example, two arms, two legs, or one leg and one arm)
while sitting, standing, or lying down. It does not involve performing
the activities while the whole body is in motion.
X 27. Response Orientation -The ability to choose quickly between
two or more movements in response to two or more different signals
(lights, sounds, pictures). It includes the speed with which the
correct response is started with the hand, foot, or other body part.
X 28. Rate Control -The ability to time your movements or the
movement of a piece of equipment in anticipation of changes in the
speed and/or direction of a moving object or scene.
X 29. Reaction Time -The ability to quickly respond (with the hand,
finger, or foot) to a signal (sound, light, picture) when it appears.
30. Wrist-Finger Speed- The ability to make fast, simple, repeated
movements of the fingers, hands, and wrists.
X 31. Speed of Limb Movement- The ability to quickly move the arms
and legs.
32. Static Strength -The ability to exert maximum muscle force to lift,
push, pull, or carry objects.

O*NET or NOT?
105
X 33. Explosive Strength The ability to use short bursts of muscle
force to propel oneself (as in jumping or sprinting) or to throw an
object.
34. Dynamic Strength- The ability to exert muscle force repeatedly
or continuously over time. This involves muscular endurance and
resistance to muscle fatigue.
35. Trunk Strength- The ability to use your abdominal and lower
back muscles to support part of the body repeatedly or continuously
over time without “giving out” or fatiguing.
36. Stamina- The ability to exert yourself physically over long
periods of time without getting winded or out of breath.
37. Extent Flexibility- The ability to bend, stretch, twist, or reach with
your body, arms, and/or legs.
38. Dynamic Flexibility -The ability to quickly and repeatedly, bend,
stretch, twist, or reach out with your body, arms, and/or legs.
39. Gross Body Coordination- The ability to coordinate the
movement of your arms, legs, and torso together when the whole
body is in motion.
40. Gross Body Equilibrium -The ability to keep or regain your body
balance or stay upright when in an unstable position.
X 41. Near Vision -The ability to see details at close range (within a
few feet of the observer).
42. Far Vision- The ability to see details at a distance.
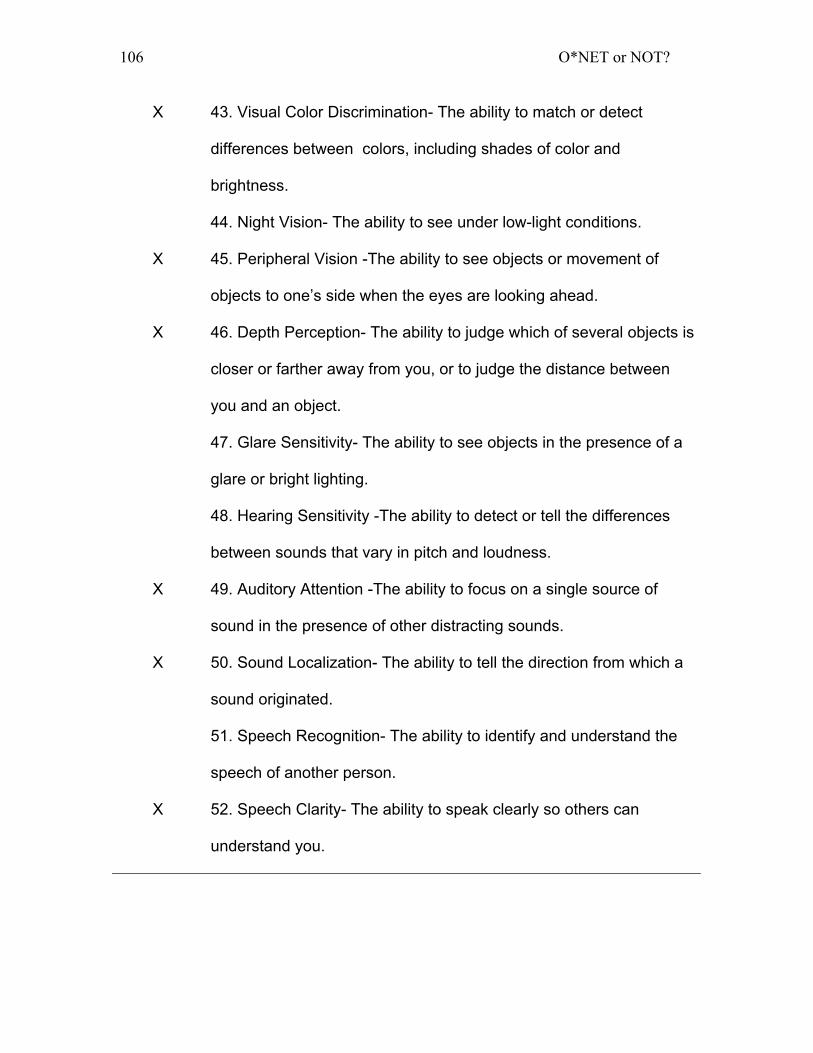
O*NET or NOT?
106
X 43. Visual Color Discrimination- The ability to match or detect
differences between colors, including shades of color and
brightness.
44. Night Vision- The ability to see under low-light conditions.
X 45. Peripheral Vision -The ability to see objects or movement of
objects to one’s side when the eyes are looking ahead.
X 46. Depth Perception- The ability to judge which of several objects is
closer or farther away from you, or to judge the distance between
you and an object.
47. Glare Sensitivity- The ability to see objects in the presence of a
glare or bright lighting.
48. Hearing Sensitivity -The ability to detect or tell the differences
between sounds that vary in pitch and loudness.
X 49. Auditory Attention -The ability to focus on a single source of
sound in the presence of other distracting sounds.
X 50. Sound Localization- The ability to tell the direction from which a
sound originated.
51. Speech Recognition- The ability to identify and understand the
speech of another person.
X 52. Speech Clarity- The ability to speak clearly so others can
understand you.
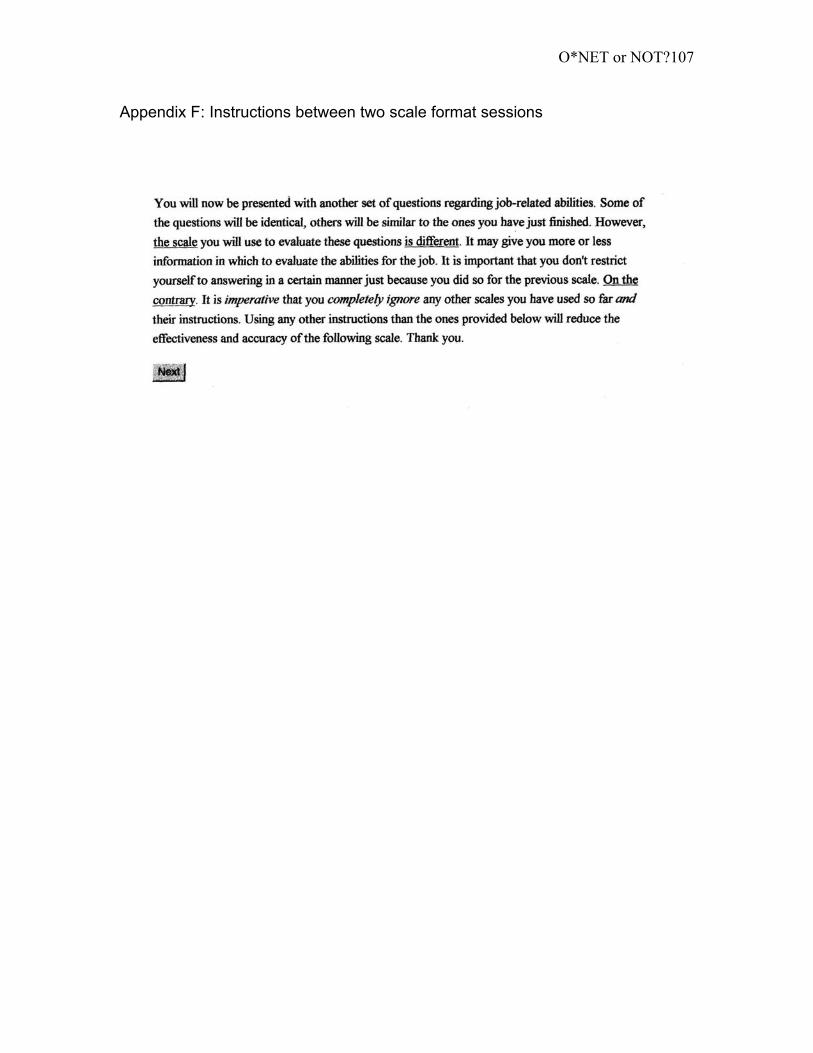
O*NET or NOT?
107
Appendix F: Instructions between two scale format sessions
Figure F: Instructions between two scale format sessions
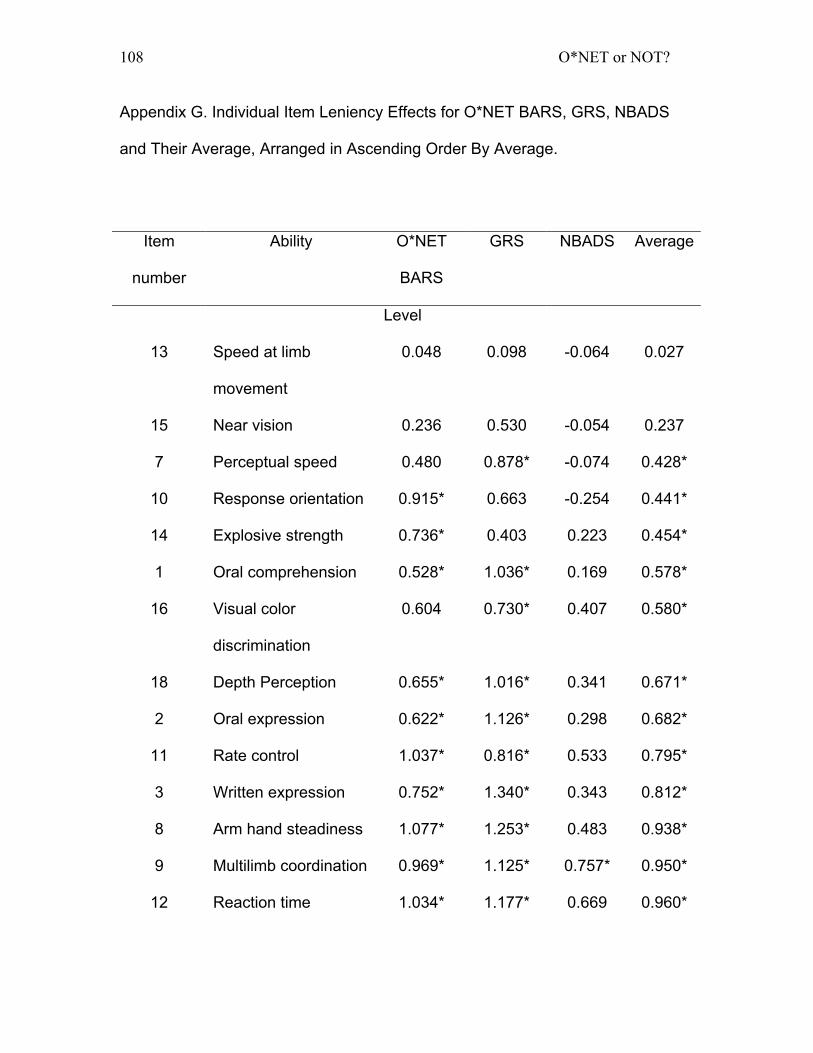
O*NET or NOT?
108
Appendix G. Individual Item Leniency Effects for O*NET BARS, GRS, NBADS
and Their Average, Arranged in Ascending Order By Average.
Table E: Individual Item Leniency Effects for O*NET BARS, GRS, NBADS and
Their Average, Arranged in Ascending Order By Average.
Item
number
Ability O*NET
BARS
GRS NBADS Average
Level
13 Speed at limb
movement
0.048 0.098 -0.064 0.027
15 Near vision 0.236 0.530 -0.054 0.237
7 Perceptual speed 0.480 0.878* -0.074 0.428*
10 Response orientation 0.915* 0.663 -0.254 0.441*
14 Explosive strength 0.736* 0.403 0.223 0.454*
1 Oral comprehension 0.528* 1.036* 0.169 0.578*
16 Visual color
discrimination
0.604 0.730* 0.407 0.580*
18 Depth Perception 0.655* 1.016* 0.341 0.671*
2 Oral expression 0.622* 1.126* 0.298 0.682*
11 Rate control 1.037* 0.816* 0.533 0.795*
3 Written expression 0.752* 1.340* 0.343 0.812*
8 Arm hand steadiness 1.077* 1.253* 0.483 0.938*
9 Multilimb coordination 0.969* 1.125* 0.757* 0.950*
12 Reaction time 1.034* 1.177* 0.669 0.960*

O*NET or NOT?
109
21 Speech clarity 1.210* 1.500* 0.216 0.976*
17 Peripheral vision 1.012* 1.344* 0.644* 1.000*
6 Flexibility of closure 1.145* 1.400* 0.649* 1.065*
5 Memorization 1.534* 1.579* 0.373 1.162*
20 Sound localization 1.318* 1.701* 0.524 1.181*
4 Problem sensitivity 1.479* 2.166* 1.108* 1.584*
19 Auditory attention 2.041* 2.215* 0.933* 1.730*
Importance
2 Oral expression -0.300 -0.322 -0.521 -0.381
15 Near vision -0.170 -0.203 -0.202 -0.192
3 Written
comprehension
0.030 -0.068 -0.135 -0.058
1 Oral comprehension -0.021 0.000 -0.114 -0.045
7 Perceptual Speed 0.023 0.059 0.039 0.041
21 Speech clarity 0.112 0.014 0.024 0.050
13 Speed at limb
movement
0.090 0.079 0.231 0.133
10 Response Orientation 0.363 0.279 0.121 0.254
16 Visual color
discrimination
0.356 0.361 0.376* 0.364
14 Explosive strength 0.465* 0.332* 0.354* 0.384*
18 Depth Perception 0.479* 0.532* 0.443* 0.475*
8 Arm hand steadiness 0.532* 0.587* 0.482* 0.534*
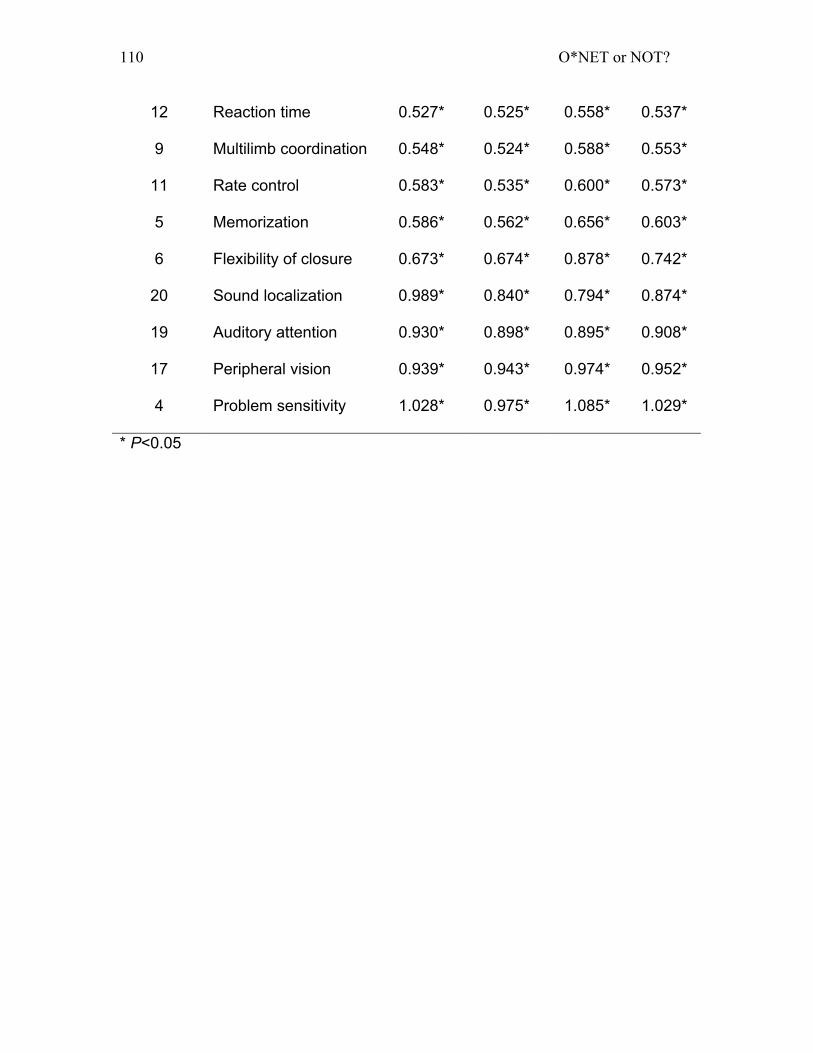
O*NET or NOT?
110
12 Reaction time 0.527* 0.525* 0.558* 0.537*
9 Multilimb coordination 0.548* 0.524* 0.588* 0.553*
11 Rate control 0.583* 0.535* 0.600* 0.573*
5 Memorization 0.586* 0.562* 0.656* 0.603*
6 Flexibility of closure 0.673* 0.674* 0.878* 0.742*
20 Sound localization 0.989* 0.840* 0.794* 0.874*
19 Auditory attention 0.930* 0.898* 0.895* 0.908*
17 Peripheral vision 0.939* 0.943* 0.974* 0.952*
4 Problem sensitivity 1.028* 0.975* 1.085* 1.029*
* P<0.05
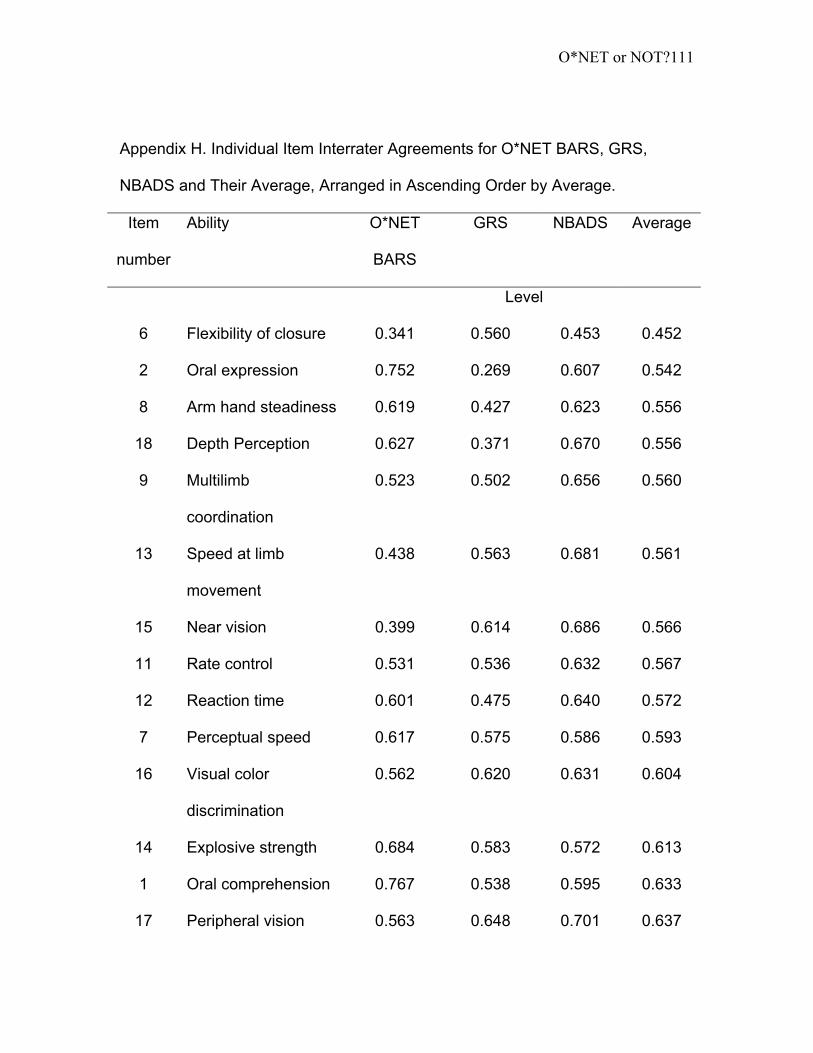
O*NET or NOT?
111
Appendix H. Individual Item Interrater Agreements for O*NET BARS, GRS,
NBADS and Their Average, Arranged in Ascending Order by Average.
Item
number
Ability O*NET
BARS
GRS NBADS Average
Level
6 Flexibility of closure 0.341 0.560 0.453 0.452
2 Oral expression 0.752 0.269 0.607 0.542
8 Arm hand steadiness 0.619 0.427 0.623 0.556
18 Depth Perception 0.627 0.371 0.670 0.556
9 Multilimb
coordination
0.523 0.502 0.656 0.560
13 Speed at limb
movement
0.438 0.563 0.681 0.561
15 Near vision 0.399 0.614 0.686 0.566
11 Rate control 0.531 0.536 0.632 0.567
12 Reaction time 0.601 0.475 0.640 0.572
7 Perceptual speed 0.617 0.575 0.586 0.593
16 Visual color
discrimination
0.562 0.620 0.631 0.604
14 Explosive strength 0.684 0.583 0.572 0.613
1 Oral comprehension 0.767 0.538 0.595 0.633
17 Peripheral vision 0.563 0.648 0.701 0.637
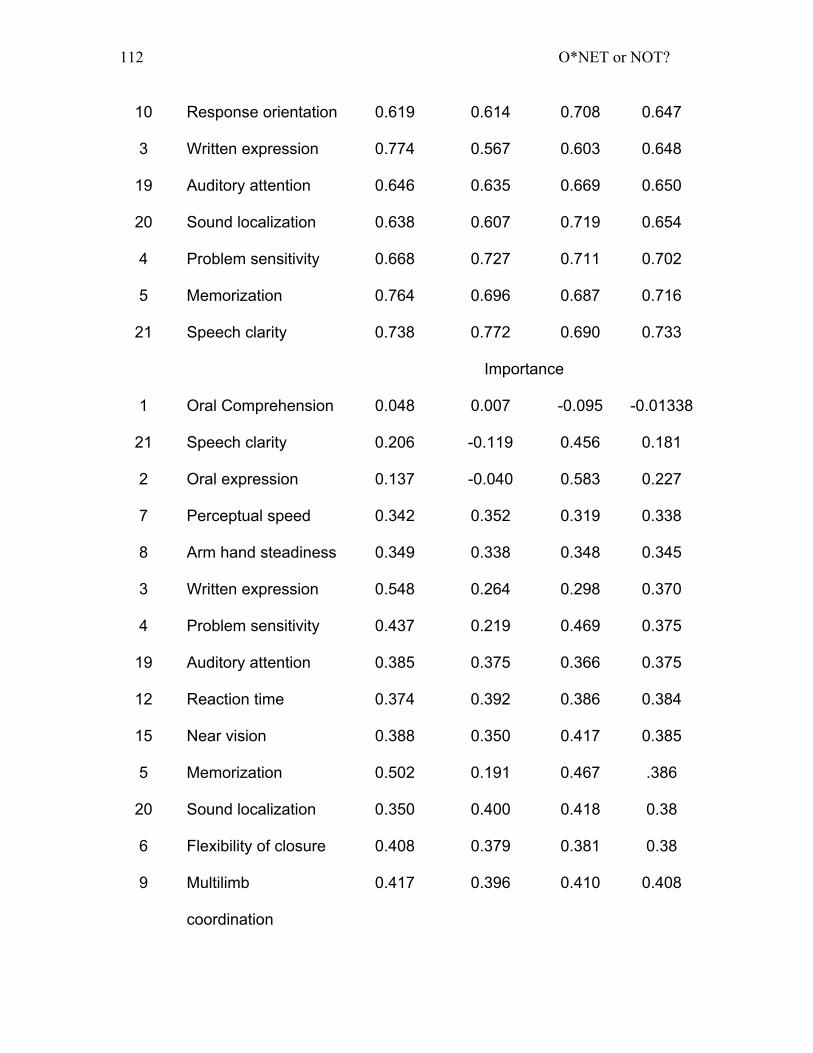
O*NET or NOT?
112
10 Response orientation 0.619 0.614 0.708 0.647
3 Written expression 0.774 0.567 0.603 0.648
19 Auditory attention 0.646 0.635 0.669 0.650
20 Sound localization 0.638 0.607 0.719 0.654
4 Problem sensitivity 0.668 0.727 0.711 0.702
5 Memorization 0.764 0.696 0.687 0.716
21 Speech clarity 0.738 0.772 0.690 0.733
Importance
1 Oral Comprehension 0.048 0.007 -0.095 -0.01338
21 Speech clarity 0.206 -0.119 0.456 0.181
2 Oral expression 0.137 -0.040 0.583 0.227
7 Perceptual speed 0.342 0.352 0.319 0.338
8 Arm hand steadiness 0.349 0.338 0.348 0.345
3 Written expression 0.548 0.264 0.298 0.370
4 Problem sensitivity 0.437 0.219 0.469 0.375
19 Auditory attention 0.385 0.375 0.366 0.375
12 Reaction time 0.374 0.392 0.386 0.384
15 Near vision 0.388 0.350 0.417 0.385
5 Memorization 0.502 0.191 0.467 .386
20 Sound localization 0.350 0.400 0.418 0.38
6 Flexibility of closure 0.408 0.379 0.381 0.38
9 Multilimb
coordination
0.417 0.396 0.410 0.408
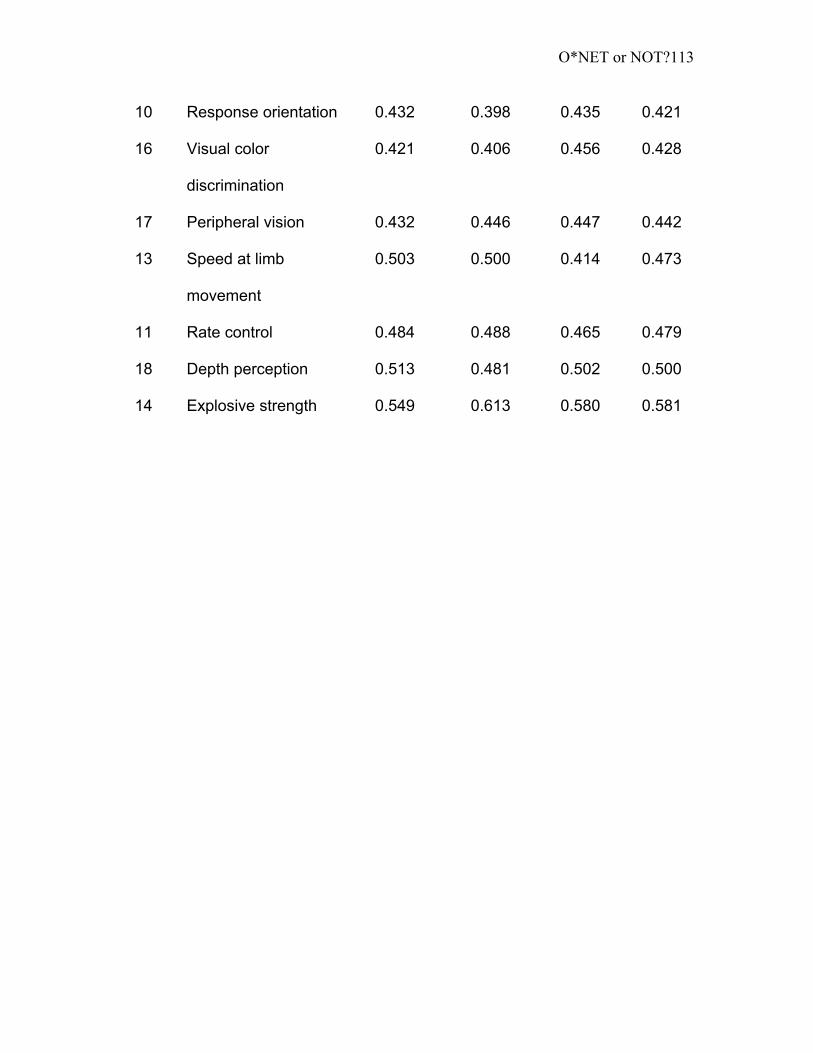
O*NET or NOT?
113
10 Response orientation 0.432 0.398 0.435 0.421
16 Visual color
discrimination
0.421 0.406 0.456 0.428
17 Peripheral vision 0.432 0.446 0.447 0.442
13 Speed at limb
movement
0.503 0.500 0.414 0.473
11 Rate control 0.484 0.488 0.465 0.479
18 Depth perception 0.513 0.481 0.502 0.500
14 Explosive strength 0.549 0.613 0.580 0.581
O*NET or NOT?
114
VITA
Eran Hollander 1220 University City Blvd. Apt A-12
Blacksburg, VA 24060 [email protected]
EDUCATION
MS in I/O Psychology, Virginia Tech, November, 2001 BA in Psychology, Tel-Aviv University, Israel, October 1994 BA in Educational Counseling, Tel-Aviv University, Israel, October 1994 I/O Psychology workshops, MAMDA, I.D.F., Israel, March 1995-August 1999
WORK HISTORY WITHIN EDUCATIONAL SETTINGS
October 2000- present Consultant to VT ACM competition teams.
• Implementing quality control processes in the individual teams. • Improving the selection process of team members. • Improving team member’s coping methods during competition.
August 2001- November 2001 VT Site Director and Assistant to
Mid-Atlantic Director for the ACM Regional competition • Responsible for all administration tasks for the competition. • Coordinated the regional competition on Nov. 10th
December 2000- Present Data Analyst – VT IRPA office
• Analyzing University student data. • Helping maintain adequate quality assessment. • Working on the “Writing Assessment” project for SCHEV.
August, 1999-December, 2000 Introduction to Psychology Recitation Instructor • Taught fundamentals of psychology in a small classroom setting • Graded over 100 quizzes or essays each week • Responsible for all lectures, quizzes, and essay questions.
O*NET or NOT?
115
ADDITIONAL RELEVANT WORK EXPERIENCES
July 1997 - August 1999 Internal Organizational Psychologist at Nahal Center, I.D.F.,
Israel. Rank: Captain Nahal Dec’ 1995 – July 1997 Internal Organizational Psychologist at Xth Division, I.D.F, Israel
Rank: Lieutenant/Captain
Jan’ 1995 – Dec’ 1995 Assistant Organizational Psychologist, Infantry HQ, I.D.F., Israel
Rank: Lieutenant
PUBLICATIONS AND PRESENTATIONS
• Hollander, Eran (In press). Scenarios and Software
Development Teams. In Carroll, John [name not given yet]
• Hollander, Eran & Harvey, R.J. (2001). NBADS- Evaluation of a
new rating scale – Will be presented at SIOP 2002.
• Hollander, Eran (2001). Comparison of O*NET Holistic versus
Graphic Rating Formats- Will be presented at SIOP 2002.
• Harvey R.J. & Hollander, Eran. (2001). Assessing Interrater
Agreement in the O*NET. – Will be presented at SIOP 2002.
• Hollander, Eran & Harvey R.J., Generalizability Theory Analysis
of Item-Level O*NET Database Ratings – Will be presented at
SIOP 2002.