Embed Size (px)
DESCRIPTION
ongc
Citation preview
A PROJECT REPORT ON
“WORKING CAPITAL MANAGEMENT
IN
OIL AND NATURAL GAS CORPORATION (ONGC)”
PROJECT REPORT SUMBITTED IN PARTIAL FULFILLMENT OF THE
REQUIRMENT FOR THE AWARD OF THE DEGREE OF
MASTER OF BUSINESS ADMINISTRATION
JAI NARAIN VYAS UNIVERSITY
JODHPUR (RAJ.)
Submitted By
Chandra Prakash
(MBA-Finance)
JAI NARAIN VYAS UNIVERSITY
MohanpuraOverbridge, Ratanada, Jodhpur (Raj.)
Page | 1
Contents
Student’s declaration 3
Acknowledgement 4
Executive Summary 5
Company profile 6
Methodology used 8
Concept of working capital 9
Factors Determining Working Capital Requirements 12
Working Capital Policy 15
Current Assets & Current Liabilities 18
Inventory Management 19
Cash Management 22
Receivables Management 25
Ratio Analysis 26
Suggestion 32
Bibliography 33
Page | 2
STUDENTS DECLARATION
I hereby declare that the project report entitles:
“WORKING CAPITAL MANAGEMENT IN ONGC”
Conducted at
ONGC office, KDM Complex, Mandore Road, Jodhpur submitted in partial fulfilmentof the
requirements for the degree of Master of Business Administration (M.B.A.) to Jai
NarainVyas University Jodhpur is my original work and not submitted for the award of any
other degree, diploma, fellowship or similar title or prize.
Date:
Place:
Page | 3
ACKNOWLEDGEMENT
With warm regards, I would like to thanks Mr. Anil KumarSaxena, Manager (Finance&
Accounts) ONGC, for the encouragement and guidance continuously provided by him to
undergo my vocational training in this esteemed organization. The present project work; a
study of working capital management in ONGC deals with the problem faced in financial
management and gives the solution of the same which is basic for organization whether
Govt. Public or Private sector.
(Chandra Prakash)
Page | 4
EXECUTIVE SUMMARY
Working Capital is the lifeblood and controlling nerve of an organization. ONGC being a
large organization, dealing in exploration and exploitation of hydrocarbons requires a large
amount of funds. The complexity and risks involved in exploration business like whole
procedure of search of oil, geographical and physical conditions, day to day reduction in oil
reserves and many other things tend to maintain a substantial amount of working capital.
Hence there is a need for proper management of working capital, so that day to day
operations do not hamper; at the same time there would not be any idle investment in
working capital.
In the project, a modest attempt has been made to analyse the trend in working capital of
ONGC during last five year i.e. from 2007-08 to 2011-12.
Page | 5
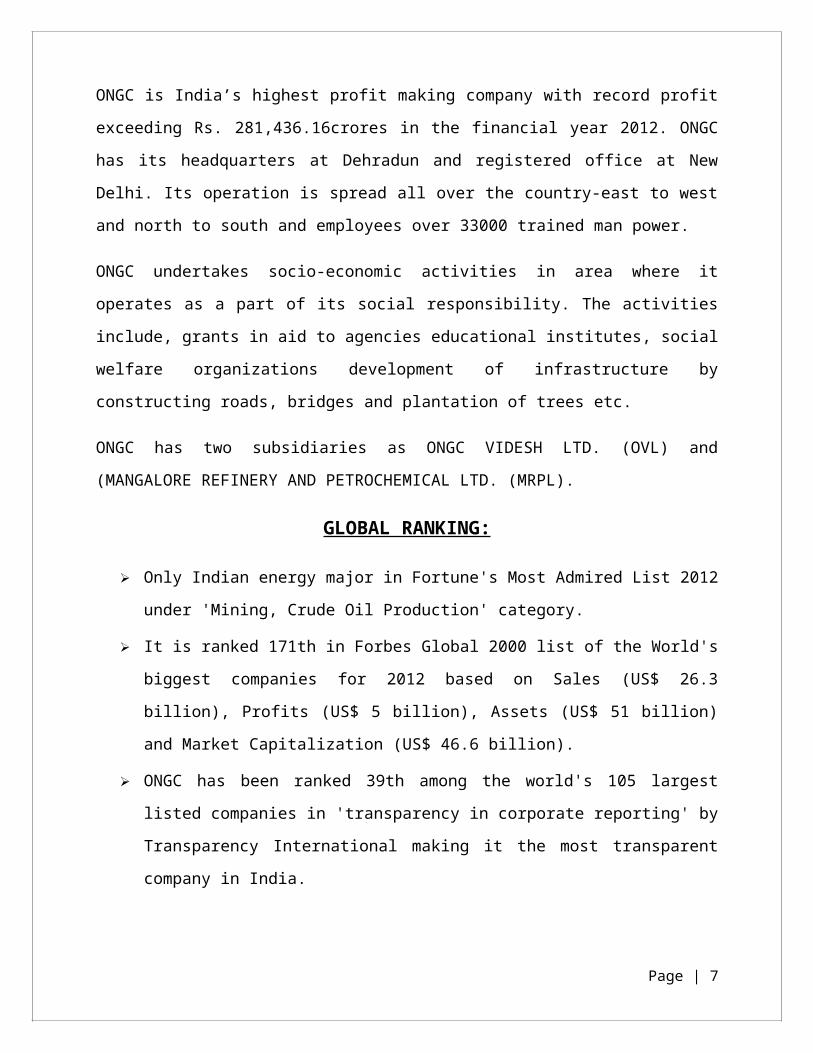
COMPANY PROFILE
Oil and natural gas corporation ltd., a “Maharatana” public sector enterprise is one of the
leading enterprises in the country with significant contributors to industrial and economic
growth.
ONGC is in the business of exploration and production (E&P) of hydrocarbons.
ONGC is India’s highest profit making company with record profit exceeding Rs.
281,436.16crores in the financial year 2012. ONGC has its headquarters at Dehradun and
registered office at New Delhi. Its operation is spread all over the country-east to west and
north to south and employees over 33000 trained man power.
ONGC undertakes socio-economic activities in area where it operates as a part of its social
responsibility. The activities include, grants in aid to agencies educational institutes, social
welfare organizations development of infrastructure by constructing roads, bridges and
plantation of trees etc.
ONGC has two subsidiaries as ONGC VIDESH LTD. (OVL) and (MANGALORE REFINERY AND
PETROCHEMICAL LTD. (MRPL).
GLOBAL RANKING:
Only Indian energy major in Fortune's Most Admired List 2012 under 'Mining,
Crude Oil Production' category.
It is ranked 171th in Forbes Global 2000 list of the World's biggest companies for
2012 based on Sales (US$ 26.3 billion), Profits (US$ 5 billion), Assets (US$ 51
billion) and Market Capitalization (US$ 46.6 billion).
ONGC has been ranked 39th among the world's 105 largest listed companies in
'transparency in corporate reporting' by Transparency International making it the
most transparent company in India.
Page | 6
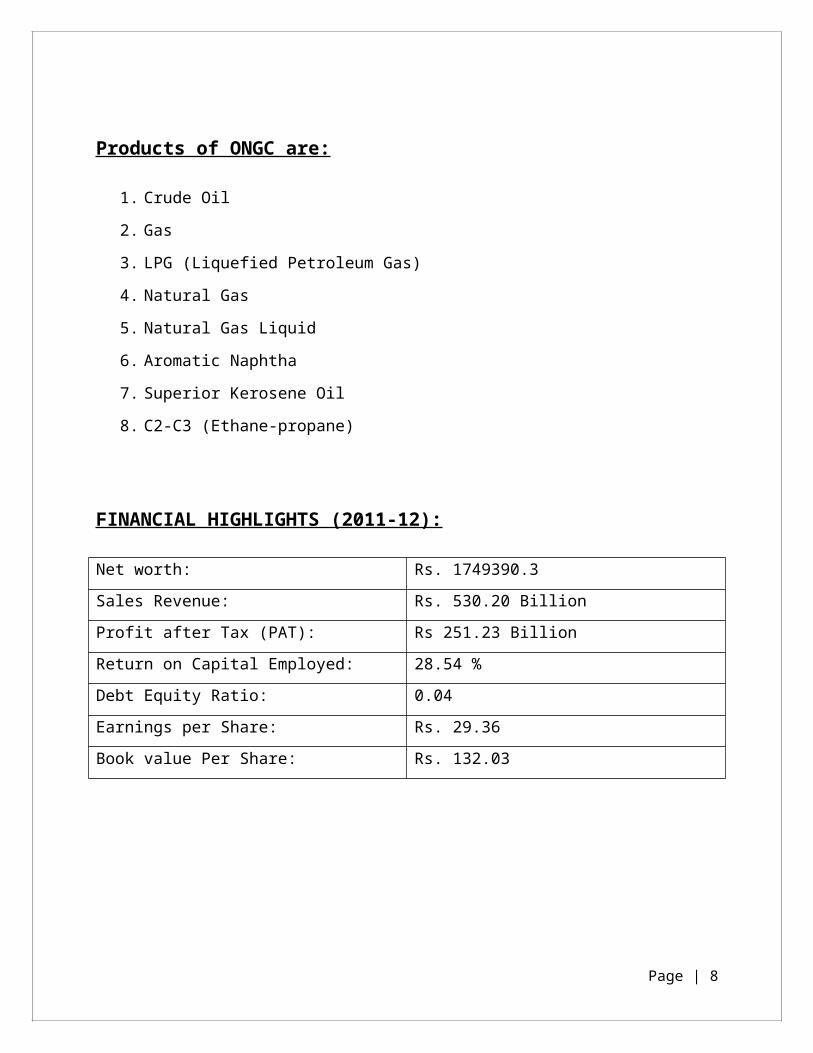
Products of ONGC are:
1. Crude Oil
2. Gas
3. LPG (Liquefied Petroleum Gas)
4. Natural Gas
5. Natural Gas Liquid
6. Aromatic Naphtha
7. Superior Kerosene Oil
8. C2-C3 (Ethane-propane)
FINANCIAL HIGHLIGHTS (2011-12):
Net worth: Rs. 1749390.3
Sales Revenue: Rs. 530.20 Billion
Profit after Tax (PAT): Rs 251.23 Billion
Return on Capital Employed: 28.54 %
Debt Equity Ratio: 0.04
Earnings per Share: Rs. 29.36
Book value Per Share: Rs. 132.03
Page | 7
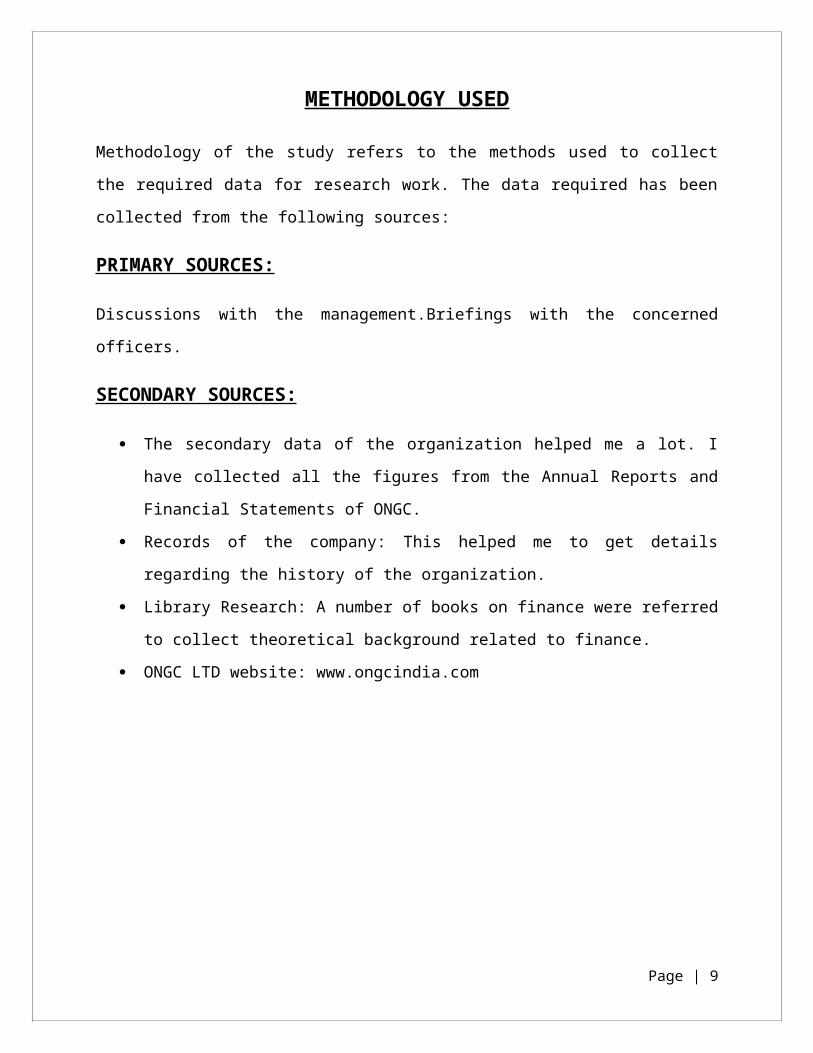
METHODOLOGY USED
Methodology of the study refers to the methods used to collect the required data for
research work. The data required has been collected from the following sources:
PRIMARY SOURCES:
Discussions with the management.Briefings with the concerned officers.
SECONDARY SOURCES:
The secondary data of the organization helped me a lot. I have collected all the
figures from the Annual Reports and Financial Statements of ONGC.
Records of the company: This helped me to get details regarding the history of the
organization.
Library Research: A number of books on finance were referred to collect theoretical
background related to finance.
ONGC LTD website: www.ongcindia.com
Page | 8
CONCEPTS OF WORKING CAPITAL
There are two concepts of working capital namely, Gross concepts and Net concept.
GROSS WORKING CAPITAL
According to this concept, working capital refers to the firm’s investment in current assets.
The amount of current liabilities is not deducted from the total of current assets.
This concept views Working Capital and aggregate of Current Assets as two inter-
changeable terms. This concept is also referred to as ‘Current Capital’ or ‘Circulating
Capital’.
Gross Working Capital = Total Current Assets
NET WORKING CAPITAL
The Net Working Capital refers to the difference between Current Assets and Current
Liabilities or the excess of Current Assets over Current Liabilities.
Net Working Capital = Current Assets - Current Liabilities
CURRENT ASSETS are assets, which are reasonably expected to be realized in cash or sold
or consumed during the normal operating cycle.
Page | 9
The Current Assets are acquired with the intention of sale or conversion into cash. They
include:
Cash
Inventories
Bills Receivable
Prepaid Expenses
Accrued Income
Marketable Securities
CURRENT LIABILITIES represent the obligations of the business and arise in the
ordinary-course of operating business. They are expected to be payable within one year.
These liabilities are generally said to have claim over Current Assets and must be
discharged out of Current Assets.
They include:
Creditors
Bills Payable
Short term Loans
Advance Payments
Net Working Capital can be positive or negative. A positive Net Working Capital would
arise when Current Assets Exceed Current Liabilities. A negative Net Working Capital
occurs when Current Liabilities are in excess of Current Assets.
Page | 10
‘Net Working Capital’ is a qualitative concept, which indicates the liquidity position of the
firm and the extent to which Working Capital needs may be financed by permanent sources
of funds.
Current Assets should be sufficiently in excess of current liabilities to constitute a margin
or buffer for obligations maturing within the ordinary operating cycle of a business. A weak
liquidity position poses a threat to the solvency of the company and makes it unsafe.
Excessive liquidity is also bad. It may be due to mismanagement of Current Assets.
Therefore, prompt and timely action should be taken by the management to improve and
correct the imbalance in the liquidity of the firm.
Page | 11
FACTORS DETERMINING WORKING CAPITAL REQUIREMENTS
The Working Capital needs of a firm are determined and influenced by various factors.
Following are some of the factors which are relevant in determining the working capital
needs of the firm:
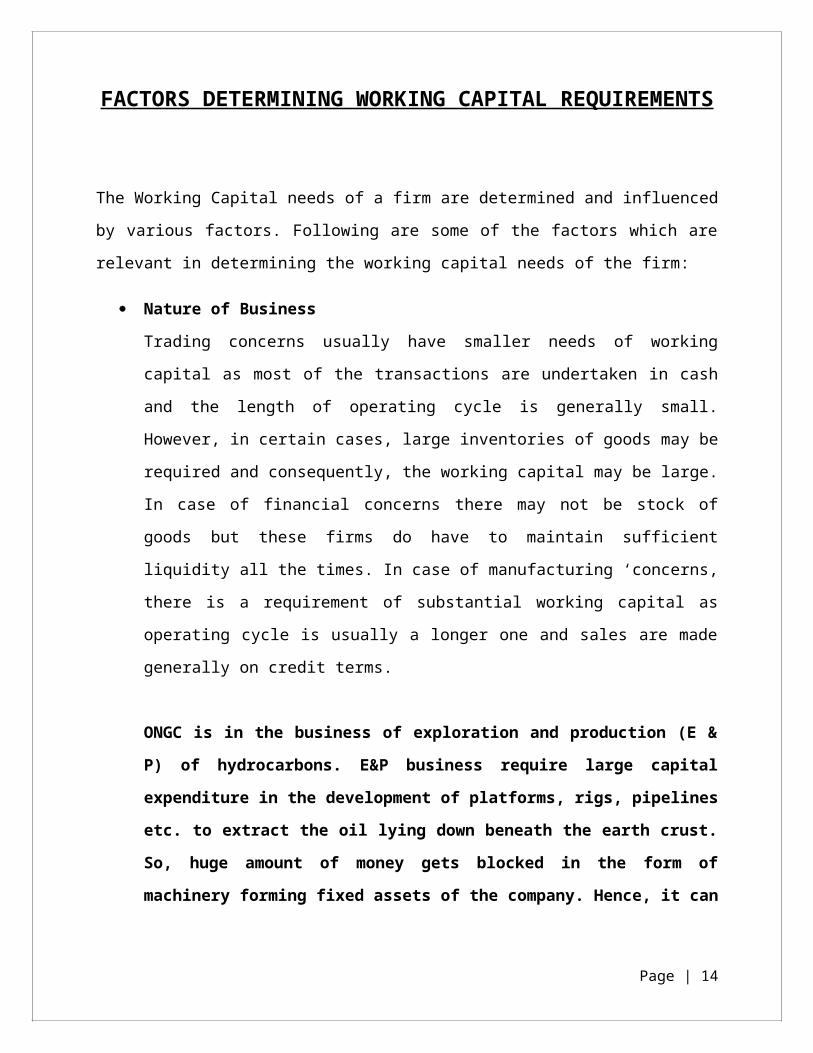
Nature of Business
Trading concerns usually have smaller needs of working capital as most of the
transactions are undertaken in cash and the length of operating cycle is generally
small. However, in certain cases, large inventories of goods may be required and
consequently, the working capital may be large. In case of financial concerns there
may not be stock of goods but these firms do have to maintain sufficient liquidity all
the times. In case of manufacturing ‘concerns, there is a requirement of substantial
working capital as operating cycle is usually a longer one and sales are made
generally on credit terms.
ONGC is in the business of exploration and production (E & P) of
hydrocarbons. E&P business require large capital expenditure in the
development of platforms, rigs, pipelines etc. to extract the oil lying down
beneath the earth crust. So, huge amount of money gets blocked in the form of
machinery forming fixed assets of the company. Hence, it can be said that high
initial investment is required in the business.
Business Cycle Fluctuations
In case of boom conditions, inflationary pressure appears and business activities
expand and working capital requirement is more. In case of recession period, there
is dullness in business activities and working capital requirement is less.
Page | 12
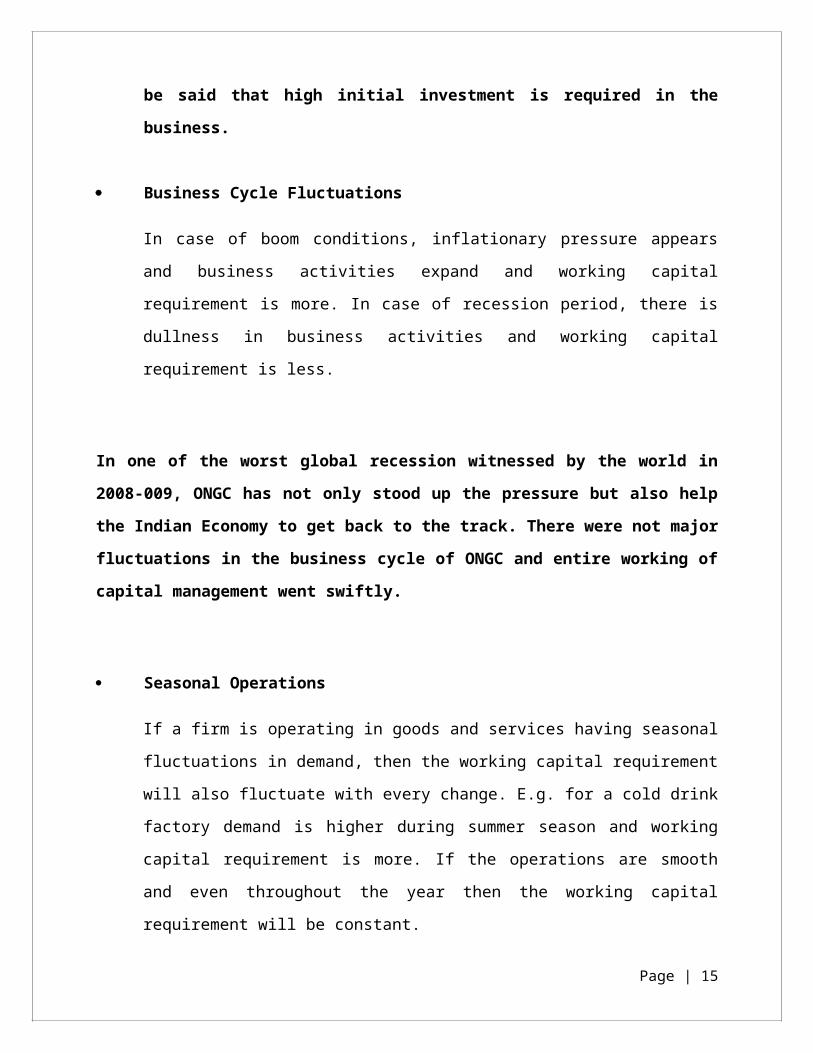
In one of the worst global recession witnessed by the world in 2008-009, ONGC has
not only stood up the pressure but also help the Indian Economy to get back to the
track. There were not major fluctuations in the business cycle of ONGC and entire
working of capital management went swiftly.
Seasonal Operations
If a firm is operating in goods and services having seasonal fluctuations in demand,
then the working capital requirement will also fluctuate with every change. E.g. for a
cold drink factory demand is higher during summer season and working capital
requirement is more. If the operations are smooth and even throughout the year
then the working capital requirement will be constant.
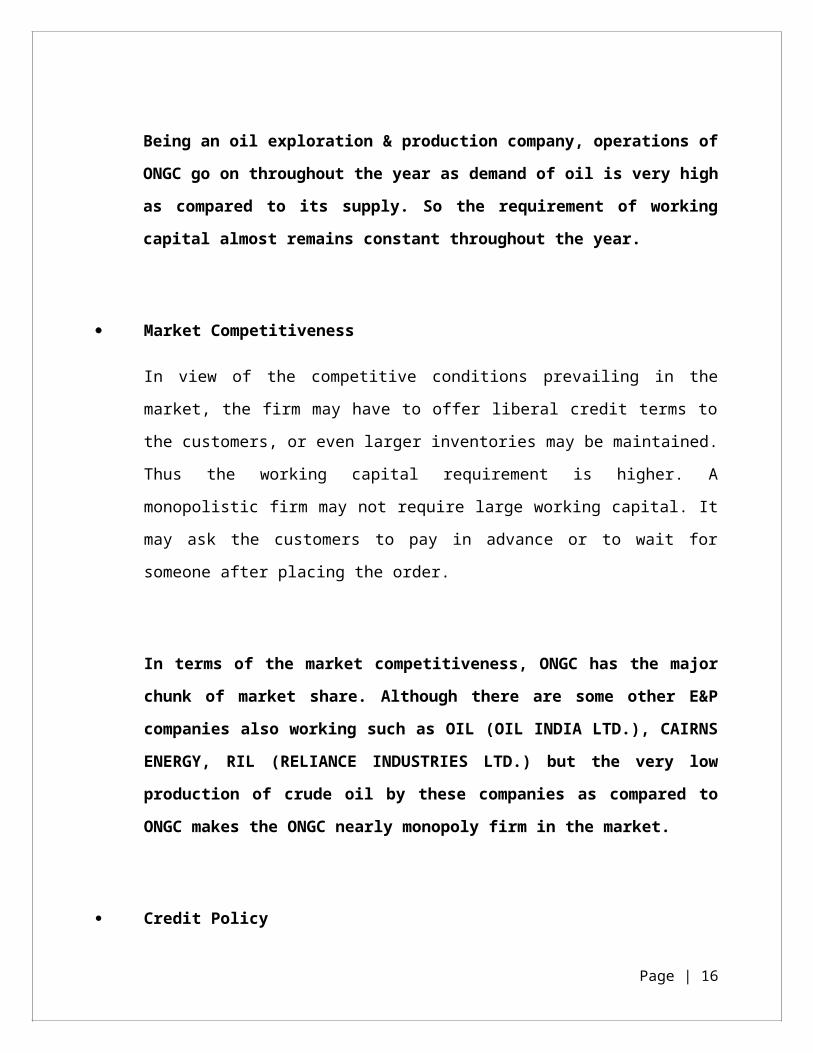
Being an oil exploration & production company, operations of ONGC go on
throughout the year as demand of oil is very high as compared to its supply. So
the requirement of working capital almost remains constant throughout the
year.
Market Competitiveness
In view of the competitive conditions prevailing in the market, the firm may have to
offer liberal credit terms to the customers, or even larger inventories may be
maintained. Thus the working capital requirement is higher. A monopolistic firm
may not require large working capital. It may ask the customers to pay in advance
or to wait for someone after placing the order.
In terms of the market competitiveness, ONGC has the major chunk of market
share. Although there are some other E&P companies also working such as OIL
Page | 13
(OIL INDIA LTD.), CAIRNS ENERGY, RIL (RELIANCE INDUSTRIES LTD.) but the
very low production of crude oil by these companies as compared to ONGC
makes the ONGC nearly monopoly firm in the market.
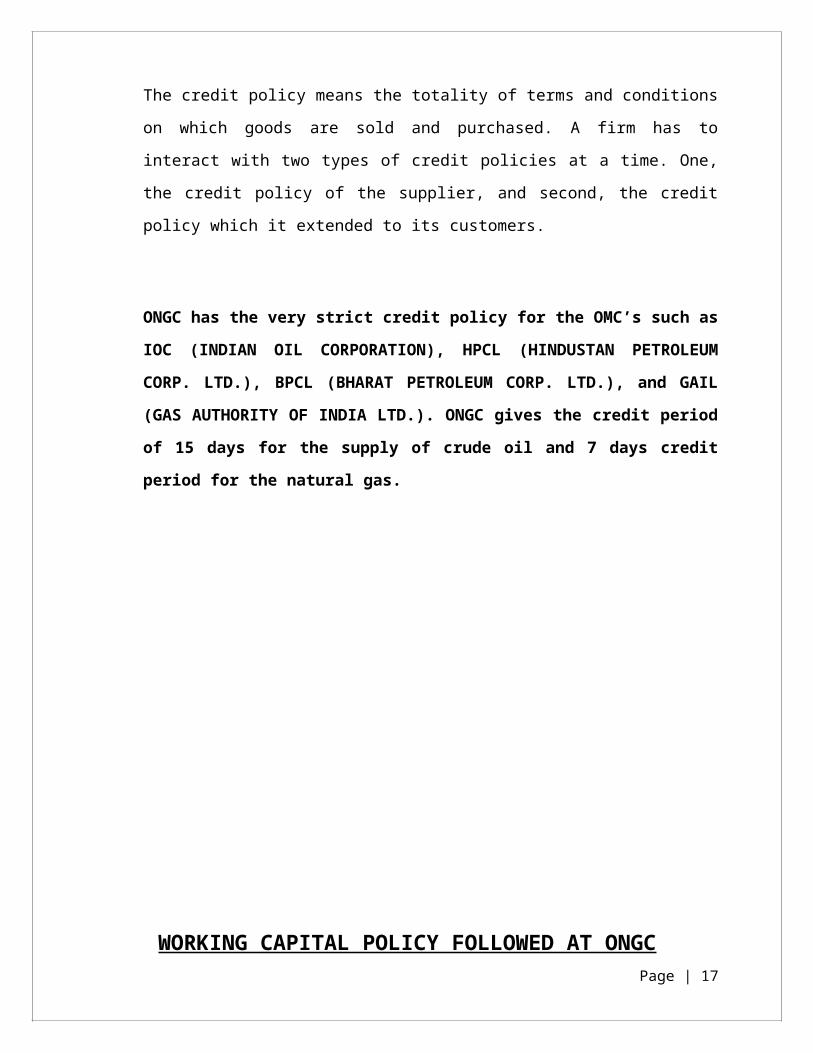
Credit Policy
The credit policy means the totality of terms and conditions on which goods are sold
and purchased. A firm has to interact with two types of credit policies at a time. One,
the credit policy of the supplier, and second, the credit policy which it extended to
its customers.
ONGC has the very strict credit policy for the OMC’s such as IOC (INDIAN OIL
CORPORATION), HPCL (HINDUSTAN PETROLEUM CORP. LTD.), BPCL (BHARAT
PETROLEUM CORP. LTD.), and GAIL (GAS AUTHORITY OF INDIA LTD.). ONGC
gives the credit period of 15 days for the supply of crude oil and 7 days credit
period for the natural gas.
Page | 14
WORKING CAPITAL POLICY FOLLOWED AT ONGC
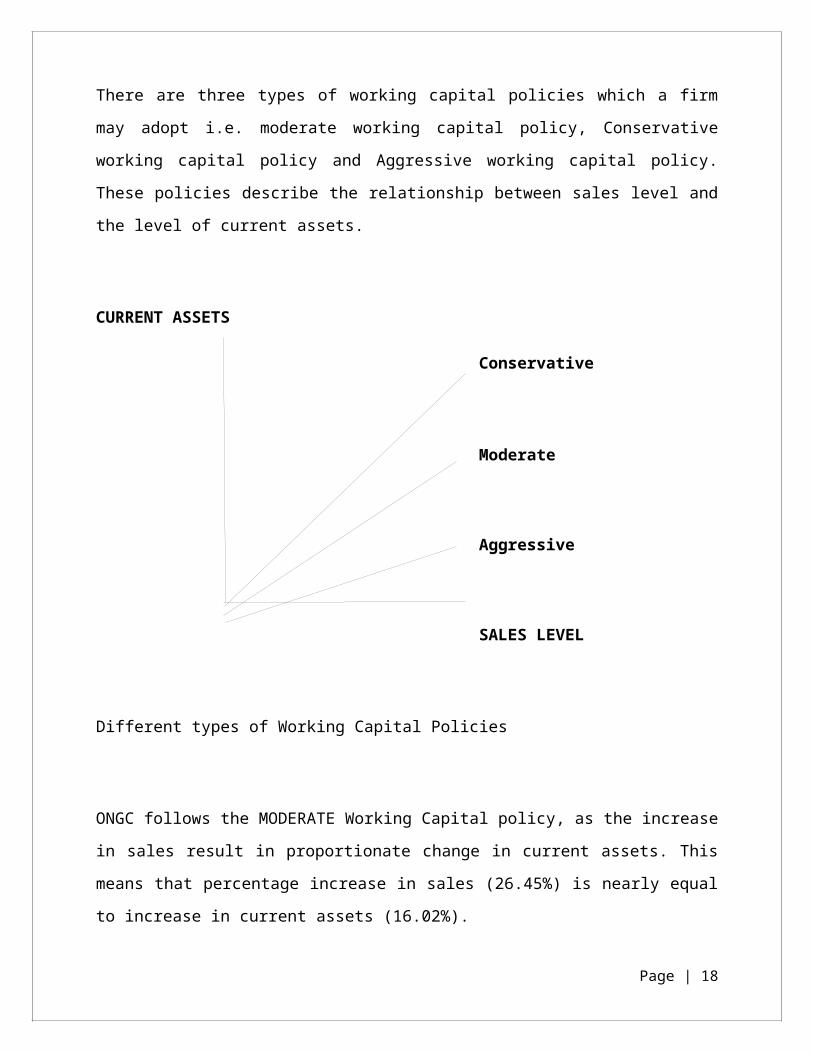
There are three types of working capital policies which a firm may adopt i.e. moderate
working capital policy, Conservative working capital policy and Aggressive working capital
policy. These policies describe the relationship between sales level and the level of current
assets.
CURRENT ASSETS
Conservative
Moderate
Aggressive
SALES LEVEL
Different types of Working Capital Policies
ONGC follows the MODERATE Working Capital policy, as the increase in sales result in
proportionate change in current assets. This means that percentage increase in sales
(26.45%) is nearly equal to increase in current assets (16.02%).
Page | 15
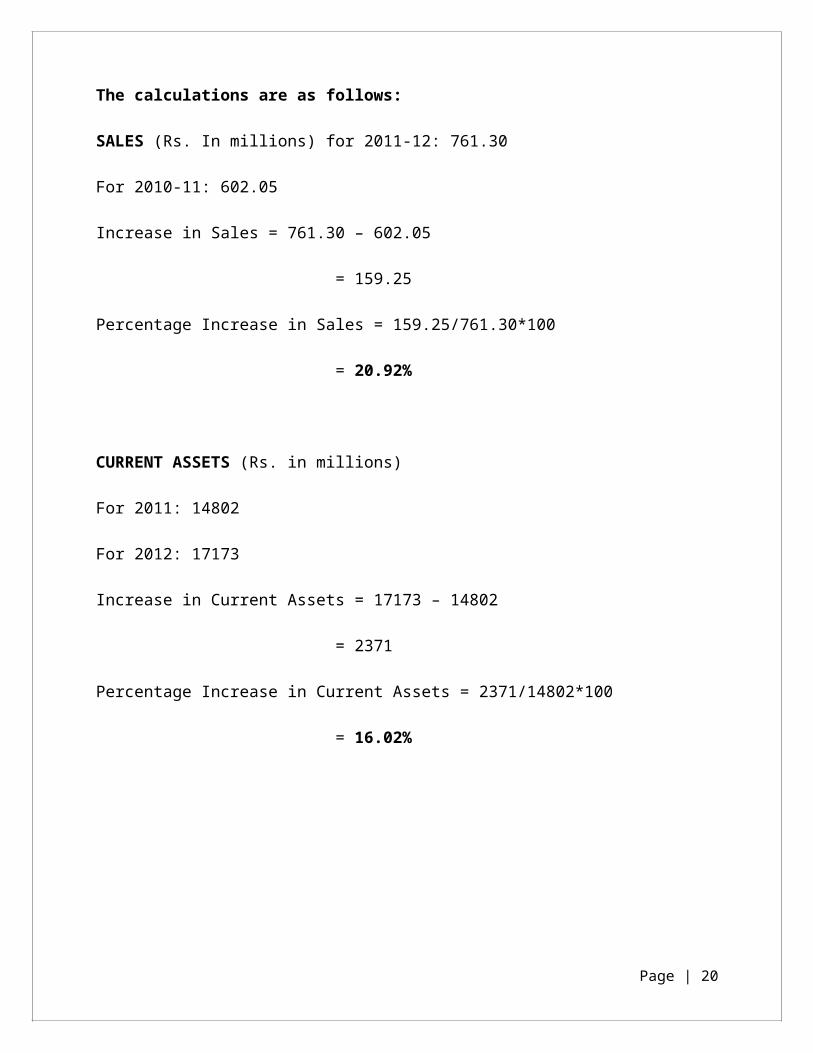
The calculations are as follows:
SALES (Rs. In millions) for 2011-12: 761.30
For 2010-11: 602.05
Increase in Sales = 761.30 – 602.05
= 159.25
Percentage Increase in Sales = 159.25/761.30*100
= 20.92%
CURRENT ASSETS (Rs. in millions)
For 2011: 14802
For 2012: 17173
Increase in Current Assets = 17173 – 14802
= 2371
Percentage Increase in Current Assets = 2371/14802*100
= 16.02%
Page | 16
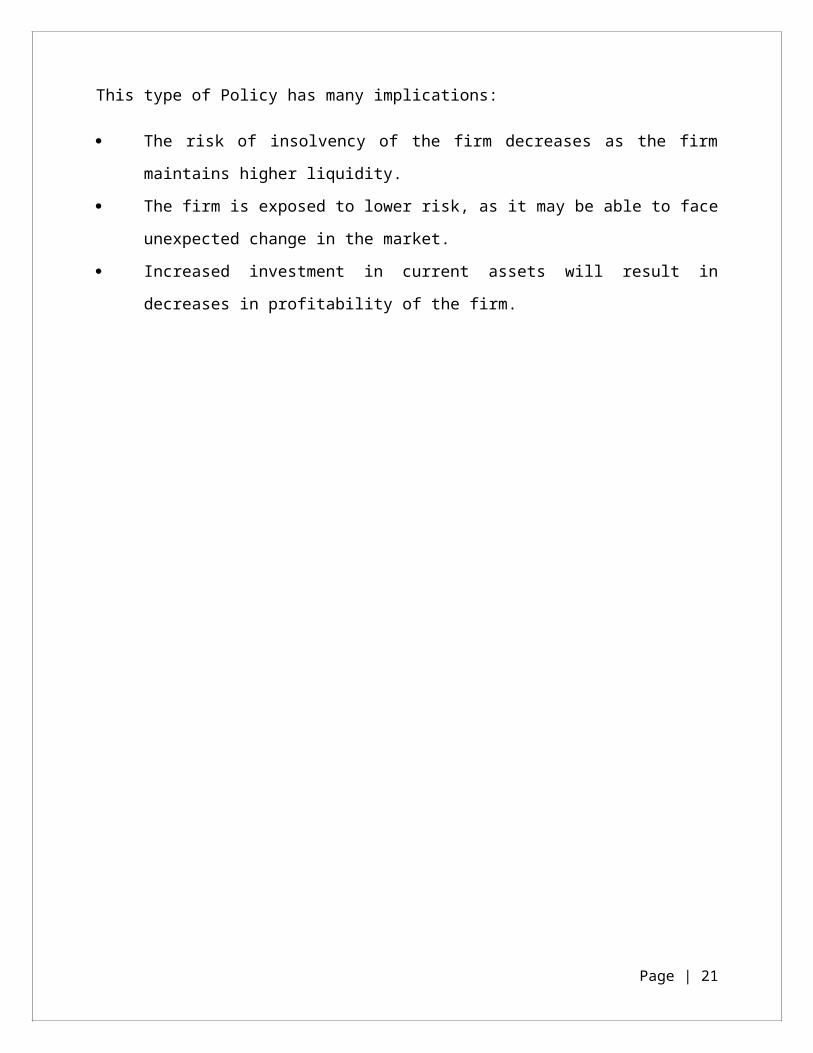
This type of Policy has many implications:
The risk of insolvency of the firm decreases as the firm maintains higher liquidity.
The firm is exposed to lower risk, as it may be able to face unexpected change in the
market.
Increased investment in current assets will result in decreases in profitability of the
firm.
Page | 17
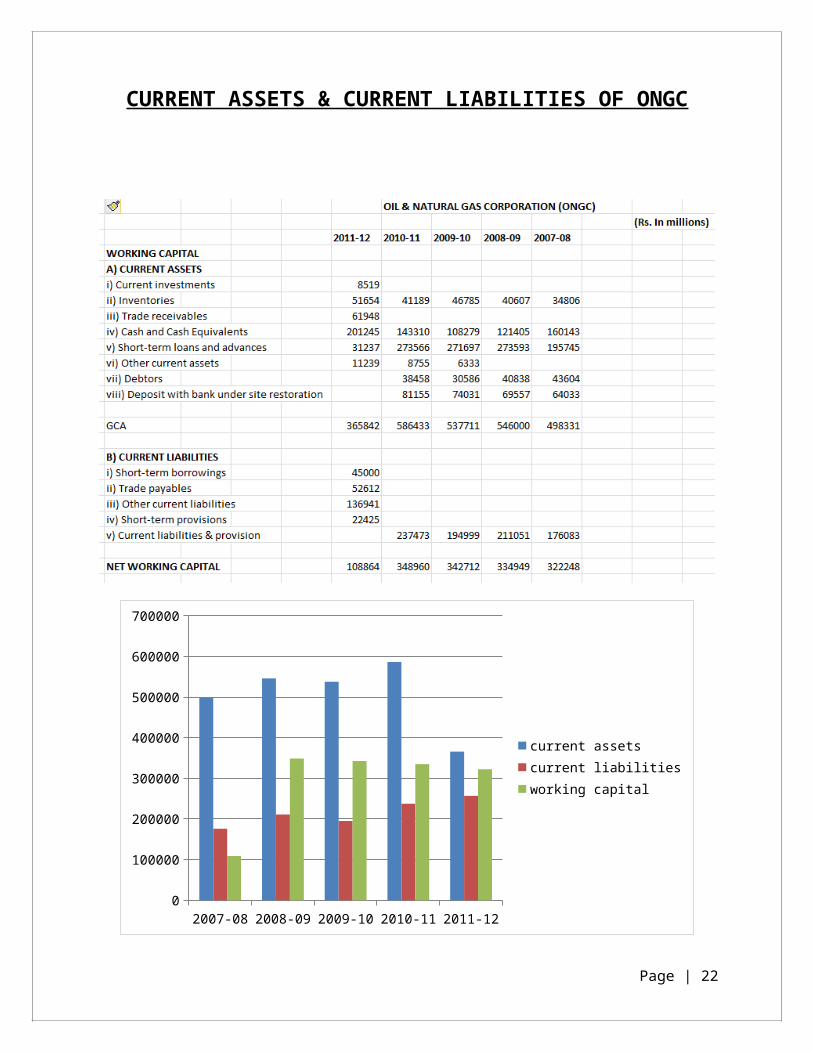
CURRENT ASSETS & CURRENT LIABILITIES OF ONGC
2007-08 2008-09 2009-10 2010-11 2011-120
100000
200000
300000
400000
500000
600000
700000
current assetscurrent liabilitiesworking capital
Page | 18

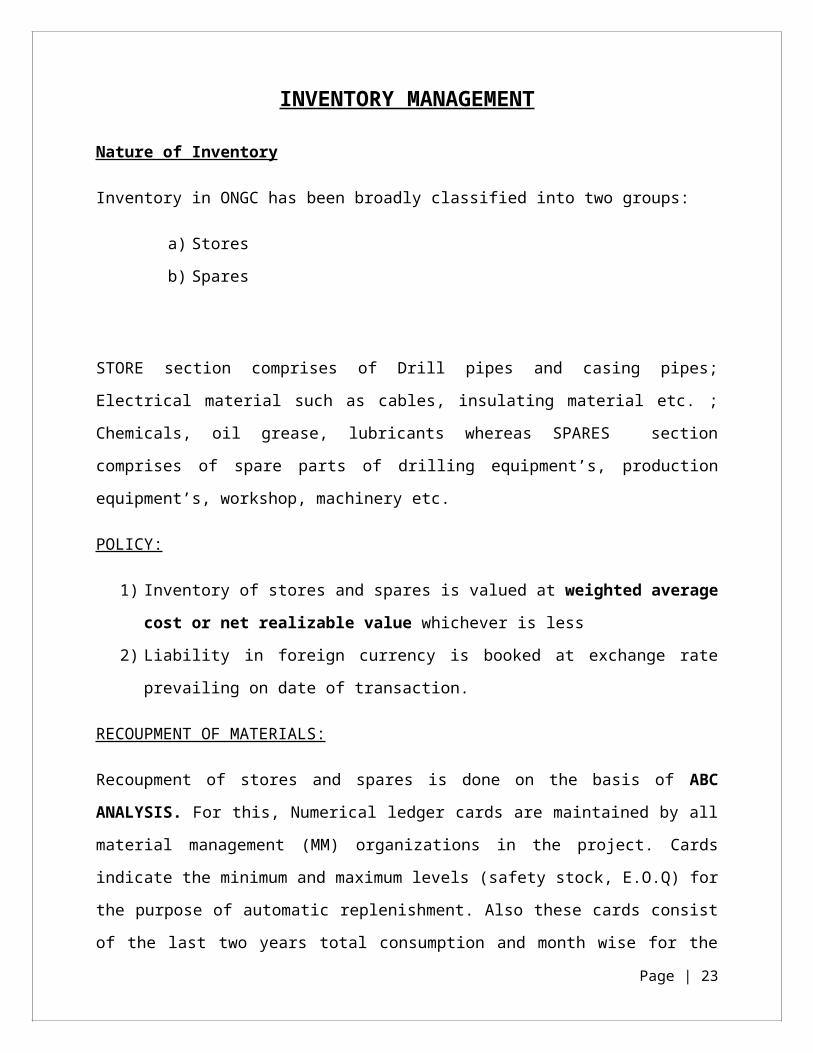
INVENTORY MANAGEMENT
Nature of Inventory
Inventory in ONGC has been broadly classified into two groups:
a) Stores
b) Spares
STORE section comprises of Drill pipes and casing pipes; Electrical material such as cables,
insulating material etc. ; Chemicals, oil grease, lubricants whereas SPARES section
comprises of spare parts of drilling equipment’s, production equipment’s, workshop,
machinery etc.
POLICY:
1) Inventory of stores and spares is valued at weighted average cost or net
realizable value whichever is less
2) Liability in foreign currency is booked at exchange rate prevailing on date of
transaction.
RECOUPMENT OF MATERIALS:
Recoupment of stores and spares is done on the basis of ABC ANALYSIS. For this,
Numerical ledger cards are maintained by all material management (MM) organizations in
the project. Cards indicate the minimum and maximum levels (safety stock, E.O.Q) for the
purpose of automatic replenishment. Also these cards consist of the last two years total
consumption and month wise for the current year so that past and current consumption
figures are readily available.
Review of each card is conducted at the following stages:
1) When the stocks and dues of item reach the minimum level. This is a must.
2) At time when physical stocks reach the safety stock level.
Page | 19
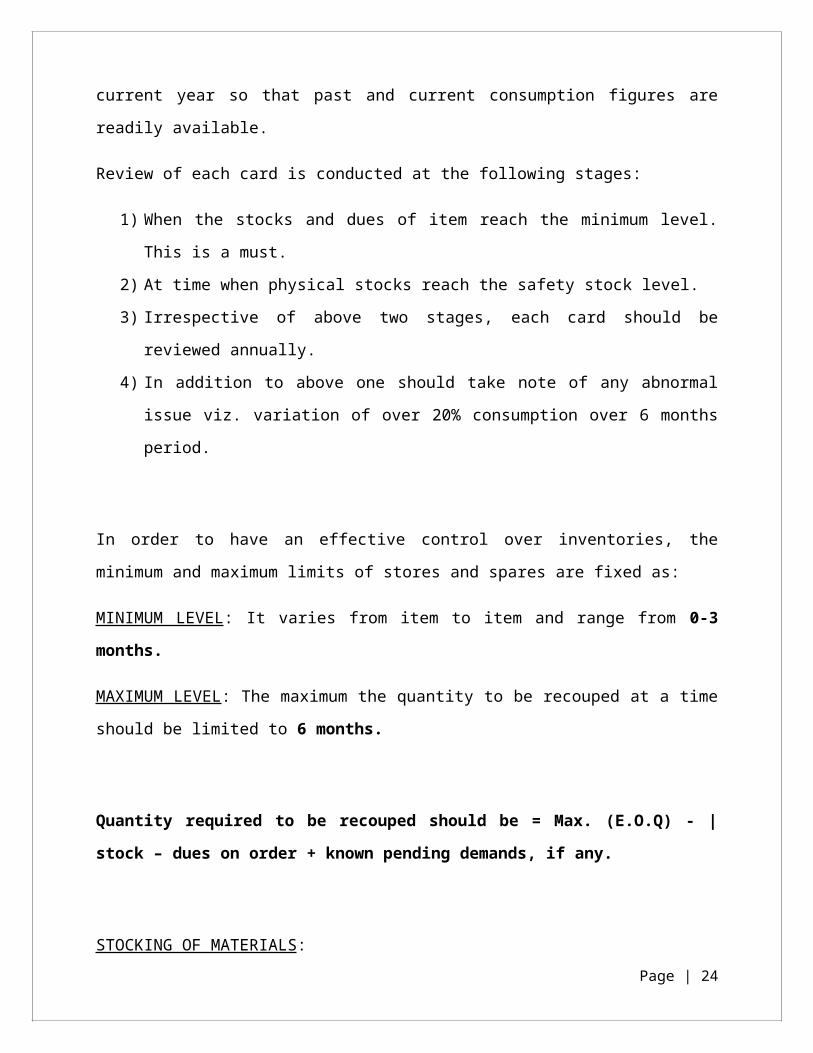
3) Irrespective of above two stages, each card should be reviewed annually.
4) In addition to above one should take note of any abnormal issue viz. variation of
over 20% consumption over 6 months period.
In order to have an effective control over inventories, the minimum and maximum limits of
stores and spares are fixed as:
MINIMUM LEVEL: It varies from item to item and range from 0-3 months.
MAXIMUM LEVEL: The maximum the quantity to be recouped at a time should be limited to
6 months.
Quantity required to be recouped should be = Max. (E.O.Q) - |stock – dues on order +
known pending demands, if any.
STOCKING OF MATERIALS:
1) All materials are kept in racks / bins.
2) All racks / bins are given numbers. Same is to be recorded on cards.
3) While stocking materials, heavier item will be kept at lower rungs of rack and lighter
on higher ones.
4) Fast moving item should be stored at easily accessible place and to nearest point of
issue.
5) Stocking of items follow the principle of “FIRST IN FIRST OUT” (FIFO).
Page | 20
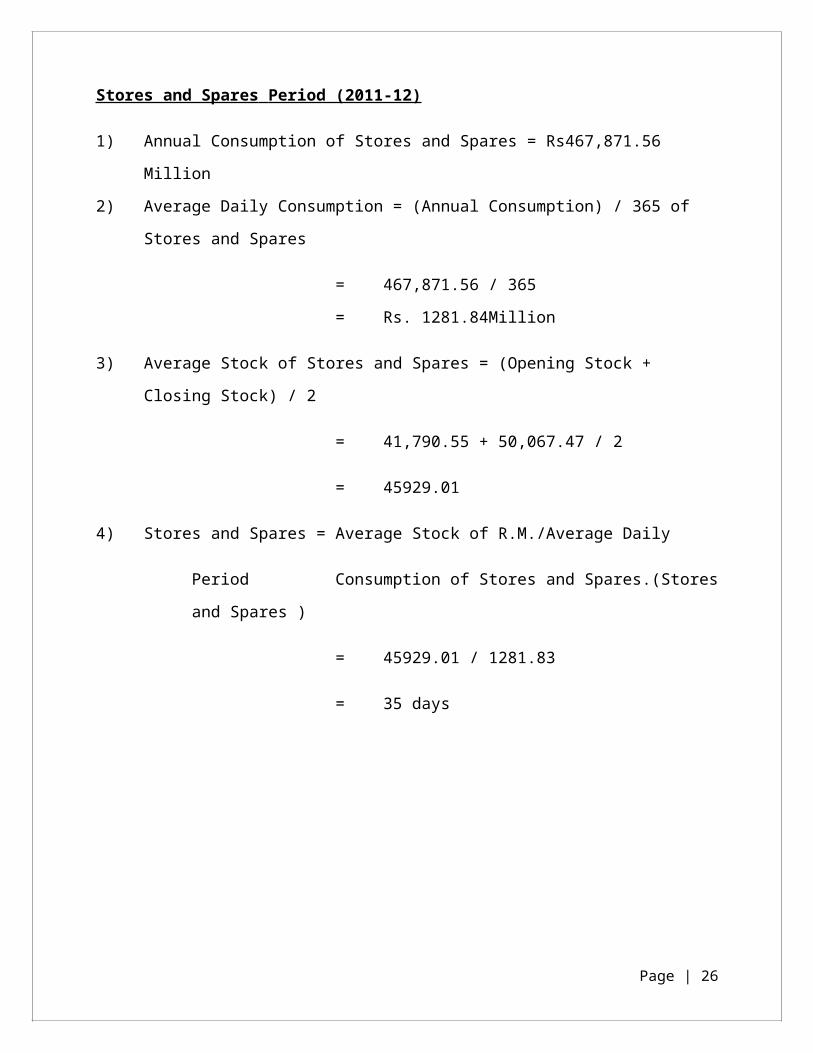
Stores and Spares Period (2011-12)
1) Annual Consumption of Stores and Spares = Rs467,871.56 Million
2) Average Daily Consumption = (Annual Consumption) / 365 of Stores and Spares
= 467,871.56 / 365
= Rs. 1281.84Million
3) Average Stock of Stores and Spares = (Opening Stock + Closing Stock) / 2
= 41,790.55 + 50,067.47 / 2
= 45929.01
4) Stores and Spares = Average Stock of R.M./Average Daily
Period Consumption of Stores and Spares.(Stores and Spares )
= 45929.01 / 1281.83
= 35 days
Page | 21
CASH MANAGEMENT
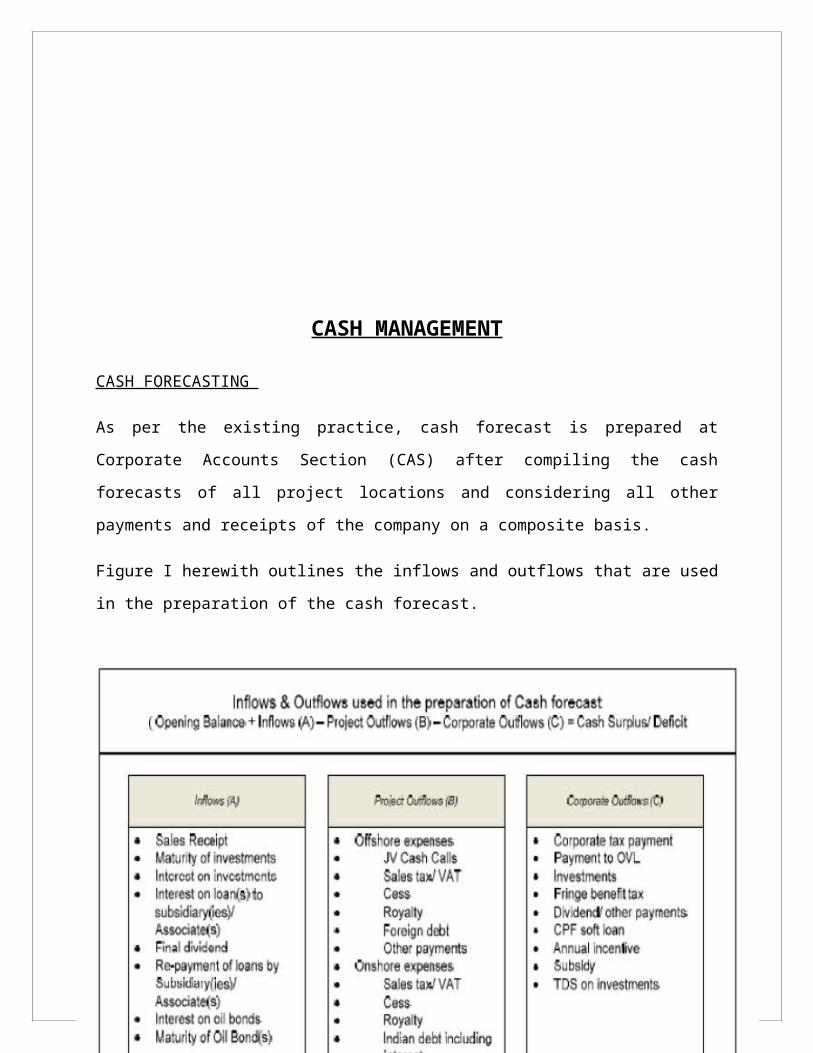
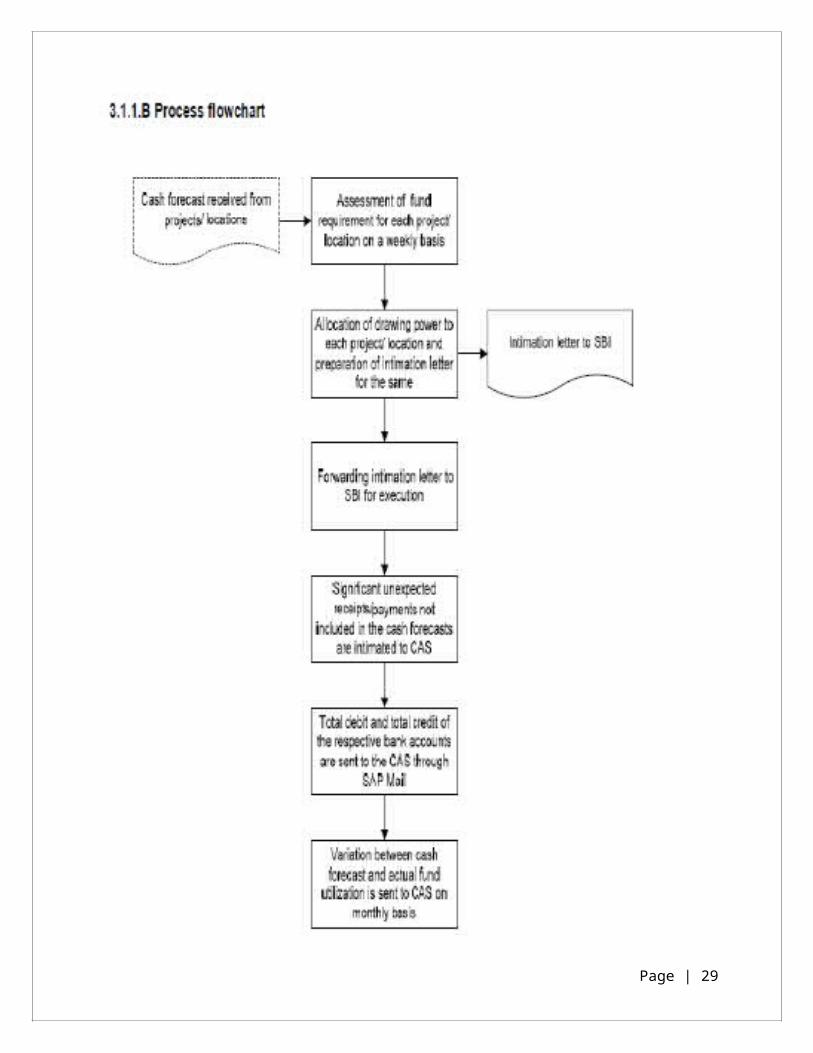
CASH FORECASTING
As per the existing practice, cash forecast is prepared at Corporate Accounts Section (CAS)
after compiling the cash forecasts of all project locations and considering all other
payments and receipts of the company on a composite basis.
Figure I herewith outlines the inflows and outflows that are used in the preparation of the
cash forecast.
Page | 22
Page | 23
Raising of short term funds
The Company raises short term funds as and when required in accordance with the
decisions taken by the Board of Directors (BOD) of the Company. The following
sources/instruments are used for these borrowings:
A) Cash Credit/Over Draft
B) Inter-corporate borrowings;
C) Commercial papers; and
D) Certificate of Deposit.
Inter-corporate borrowing are made using an inter-office memo including details of
amount to be borrowed by the Company, terms and conditions, period and rate of interest.
Subsequently a BOD resolution is passed to approve the borrowing.
Commercial papers are unsecured promissory notes issued by corporations and foreign
governments. These are low cost alternatives to bank loans for large credit issuers such as
the Company. It is usually not used to finance long-term investments but rather for
purchases for inventory or to manage working capital.
Certificate of deposit is a document evidencing a time deposit placed with a depository
institution and contains details of amount of deposit, date of maturity, rate of interest, and
the method under which the interest is calculated.
Average Collection Period (figures in millions)
Sales: Rs. 1,501,814
Average Sundry Debtors: Rs. 61948
Operating Cycle: Sales/Avg. Sundry Debtors
= 1501814/61948
= 24.24
Debtors Turnover Ratio: 360/Operating Cycle
= 360/24.24
= 14 days
Page | 24
RECEIVABLES MANAGEMENT
CREDIT POLICY
The first step for implementing credit policy will be gather credit information about
customers. This information should be adequate enough so that proper analysis about the
financial position of customer is possible. This credit information will certainly help in
improving the quality of receivables. The information should be available form financial
statements, credit rating agencies, Reports firm’s banks, firm’s records etc.
CREDIT PERIOD
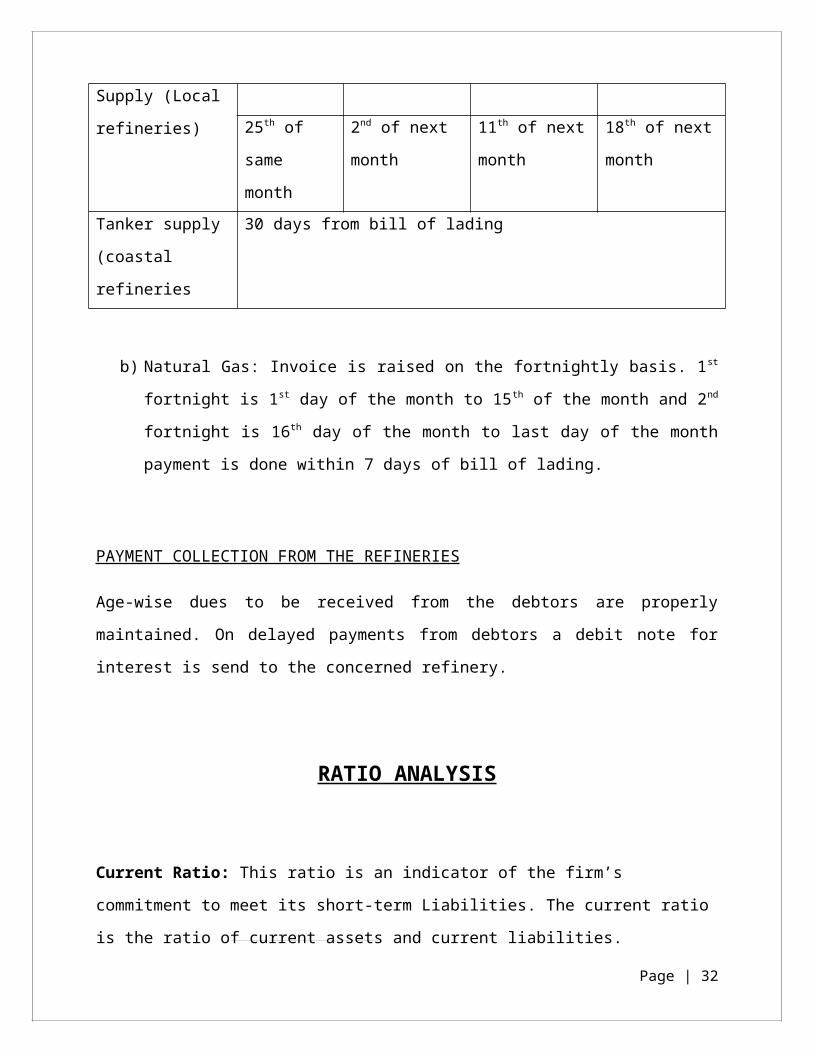
a) Crude Oil: For local refineries i.e. .BPCL & HPCL invoice is raised on the weekly basis.
The billing to coastal refineries is done on the date of bill of lading.
Receipt is received on the following basis:
Pipeline Supply
(Local refineries)
I week II week III week IV week
25th of same
month
2nd of next
month
11th of next
month
18th of next
month
Tanker supply
(coastal refineries
30 days from bill of lading
b) Natural Gas: Invoice is raised on the fortnightly basis. 1st fortnight is 1st day of the
month to 15th of the month and 2nd fortnight is 16th day of the month to last day of
the month payment is done within 7 days of bill of lading.
PAYMENT COLLECTION FROM THE REFINERIES
Age-wise dues to be received from the debtors are properly maintained. On delayed
payments from debtors a debit note for interest is send to the concerned refinery.
Page | 25
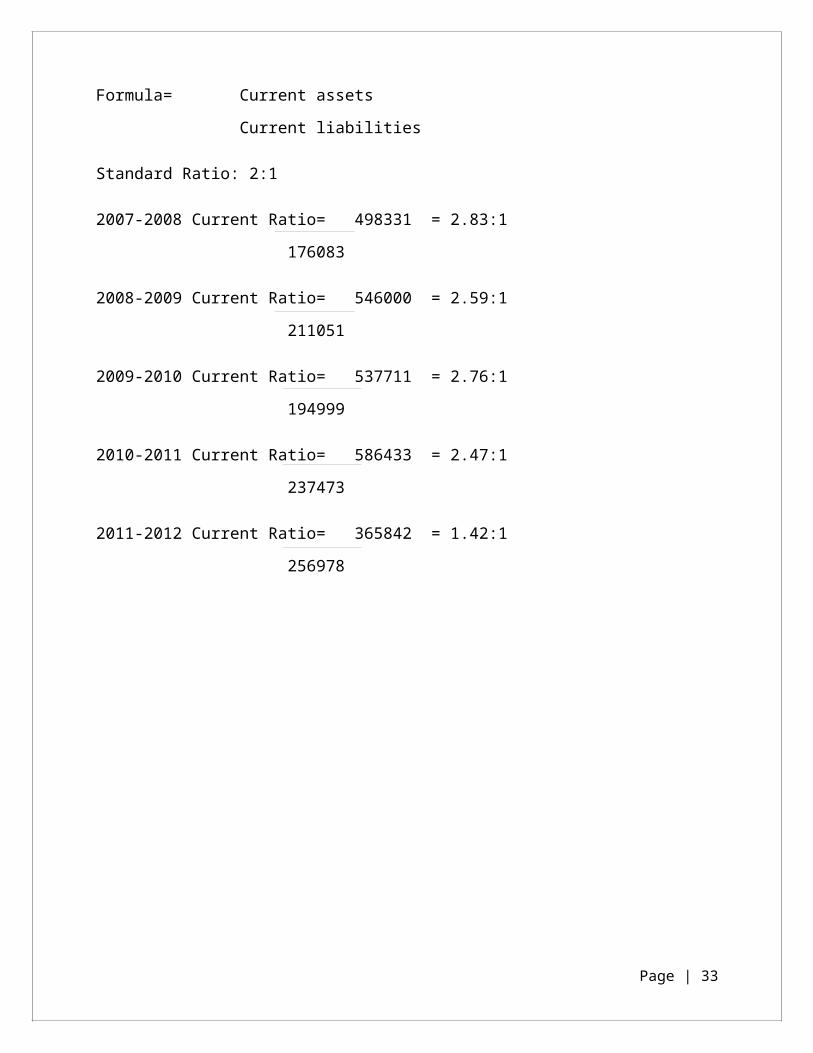
RATIO ANALYSIS
Current Ratio: This ratio is an indicator of the firm’s commitment to meet its short-term
Liabilities. The current ratio is the ratio of current assets and current liabilities.
Formula= Current assets
Current liabilities
Standard Ratio: 2:1
2007-2008 Current Ratio= 498331 = 2.83:1
176083
2008-2009 Current Ratio= 546000 = 2.59:1
211051
2009-2010 Current Ratio= 537711 = 2.76:1
194999
2010-2011 Current Ratio= 586433 = 2.47:1
237473
2011-2012 Current Ratio= 365842 = 1.42:1
256978
Page | 26
2007-08 2008-09 2009-10 2010-11 2011-120
0.5
1
1.5
2
2.5
3
Current ratio
Current ratio
Interpretation:
The financial performance of the company is very sound as the ratio is above 2:1 but still
Company’s current ratio is more than standard ratio so company should control assets as it
is not better for the health of the company. This decreasing trend could be seen from the
graph which is the betterment of the company.
Working capital turnover ratio: This ratio indicates whether working capital has been
effectively utilized in sales or not. So we should know it by calculating following ratio:
Formula= Total sales
Net Working Capital
Here, net working capital= current assets – current liabilities
2007-2008 Current Ratio= 601373 = 1.86:1
322248
2008-2009 Current Ratio= 639493 = 1.91:1
334949
Page | 27

2009-2010 Current Ratio= 619832 = 1.80:1
342712
2010-2011 Current Ratio= 686488 = 1.96:1348960
2011-2012 Current Ratio= 768871 = 7.06:1
108864
2007-08 2008-09 2009-10 2010-11 2011-120
1
2
3
4
5
6
7
8
working capital turnover ratio
working capital turnover ratio
Interpretation:
The company’s working capital position is moderate in last five years. Position of company
has become better and company is able to meet its current obligation whenever it is
required.
Debt Equity ratio: This ratio tells about the position of total debt of the company with
respect to the total equity.
Page | 28
Formula= Debt
Equity Shareholder Fund
2007-2008Debt Equity Ratio = 369 = 0.001:1
699435
2008-2009 Debt Equity Ratio = 267 = 0.0003:1
780848
2009-2010 Debt Equity Ratio = 0
2010-2011 Debt Equity Ratio = 0
2011-2012 Debt Equity Ratio = 0
2007-08 2008-09 2009-10 2010-11 2011-120
0.0002
0.0004
0.0006
0.0008
0.001
0.0012
Debt Equity Ratio
Debt Equity Ratio
Interpretation
Page | 29
The declining trend of the debt equity ratio is favourable for the health of company as it
means that total debt is reducing with every passing year and company is operating on
their own capital. Also the figure is not very high. For the year 2011-12 it is 0 which makes
ONGC nearly DEBT FREE COMPANY.
Return on capital employed: This ratio tell that how effectively a company is making use
of its resources. It gives the return on the total amount of money that is infused in an
organization.
Formula= PBIDT
Total capital employed
2007-2008 Return on Capital Employed =314790 =52%
604844
2008-2009 Return on Capital Employed =319684 = 50%
640583
2009-2010 Return on Capital Employed =396413 = 53.71%
738014
2010-2011 Return on Capital Employed =353181 = 44.31%
796972
2011-2012 Return on Capital Employed =410327 = 45.15%
908848
Page | 30
2007-08 2008-09 2009-10 2010-11 2011-120
10
20
30
40
50
60
Return on Capital Employed
Return on Capital Employed
Interpretation:
Although the profit of company has increased in the last five years but the total return on
the capital employed has come down from 45% in 2010-11 to 36% in 2011-12. ROCE is
continuously decreasing. This is because of the increase in investments in oil producing
properties such as basins and oil fields which has lead to decrease in ROCE despite of
increasing profits.
Page | 31
SUGGESTIONS
1) Return on the capital employed is decreasing continuously over the last 5 years.
This is because of the increase investments in producing properties such as basins
and oil fields leading to decrease in the ROCE. To arrest this decreasing trend the
company may probably explore and adopt more cost effective technology for its
activities.
2) The high current ratio from the standard indicates that additional amount of money
is blocked in the current assets than required. So there are possibilities of using this
blocked money in normal business activities which expected to fetch more return.
3) The portion of inventory needs greater attention. The corporation sometimes face
problem of excess stock of one type of inventory. This is because of the high lead
time of certain casing and drill pipes making the inventory storage period very high.
4) The business of the corporation is such that the working capital of the corporation
tends to go high. Therefore it is important to have a more accurate method of cash
forecasting.
5) ONGC being nearly a debt free company is not utilizing its strength for capturing
fund from market through debt instead using own fund for normal business activity.
In the process it is losing its leveraging capability.
Page | 32
BIBLOIGRAPHY
Khan M. Y. and Jain P.K., Financial Management (Tata McGraw – Hill Publishing
Company Limited, New Delhi)
Prasanna Chandra., Financial Management (Tata McGraw – Hill Publishing Company
Limited, New Delhi)
Annual Reports of the ONGC.
www.ongcreports.net
Page | 33