Embed Size (px)
Citation preview
This is a repository copy of Online abuse of UK MPs from 2015 to 2019: Working paper.
White Rose Research Online URL for this paper:http://eprints.whiterose.ac.uk/145982/
Version: Submitted Version
Article:
Greenwood, M.A. orcid.org/0000-0003-2269-1722, Bakir, M.E., Gorrell, G. et al. (3 more authors) (Submitted: 2019) Online abuse of UK MPs from 2015 to 2019: Working paper. arXiv. (Submitted)
© 2019 The Author(s). For reuse permissions, please contact the Author(s).
[email protected]://eprints.whiterose.ac.uk/
Reuse
Items deposited in White Rose Research Online are protected by copyright, with all rights reserved unless indicated otherwise. They may be downloaded and/or printed for private study, or other acts as permitted by national copyright laws. The publisher or other rights holders may allow further reproduction and re-use of the full text version. This is indicated by the licence information on the White Rose Research Online record for the item.
Takedown
If you consider content in White Rose Research Online to be in breach of UK law, please notify us by emailing [email protected] including the URL of the record and the reason for the withdrawal request.
Online Abuse of UK MPs from 2015 to 2019: Working Paper
Mark A. Greenwood, Mehmet E. Bakir, Genevieve Gorrell,Xingyi Song, Ian Roberts and Kalina Bontcheva
University of Sheffield, UK{m.a.greenwood,m.e.bakir,g.gorrell,
x.song,i.roberts,k.bontcheva}@sheffield.ac.uk
Abstract
We extend previous work about general election-relatedabuse of UK MPs with two new time periods, one in late2018 and the other in early 2019, allowing previous obser-vations to be extended to new data and the impact of keystages in the UK withdrawal from the European Union onpatterns of abuse to be explored. The topics that draw abuseevolve over the four time periods are reviewed, with topicsrelevant to the Brexit debate and campaign tone showing avarying pattern as events unfold, and a suggestion of a “bub-ble” of topics emphasized in the run-up to the highly Brexit-focused 2017 general election. Brexit stance shows a variablerelationship with abuse received. We find, as previously, thatin quantitative terms, Conservatives and male politicians re-ceive more abuse. Gender difference remains significant evenwhen accounting for prominence, as gauged from GoogleTrends data, but prominence, or other factors related to beingin power, as well as gender, likely account for the differenceassociated with party membership. No clear relationship be-tween ethnicity and abuse is found in what remains a verysmall sample (BAME and mixed heritage MPs). Differencesare found in the choice of abuse terms levelled at female vs.male MPs.
Introduction
As social media become an inescapable part our lives, thepotential for harm is increasingly a focus for attention andconcern. Among apparent harms are incivility and threat-ening behaviour, which proliferate in the anonymized andconsequence-free environment of the internet. Where threatsand abuse are levelled at our elected representatives, thereis potential for negative impact on democracy. MPs are in-creasingly raising concerns about the threats and abuse theyare subjected to, and a third of women MPs have consideredquitting as a result of online and verbal abuse received.1
In 2015 a majority Conservative government succeededthe previous Conservative/Liberal Democrat coalition in theUK. One of the promises made by the Conservatives wasthat they would hold a referendum on UK European Unionmembership. This was duly held, and in June 2016, 52% ofvoters said that they wanted the UK to leave the EU. WithTheresa May taking on the role of Prime Minister, a further
1https://www.bbc.co.uk/news/
uk-politics-38736729
general election was held, in which the Conservatives losttheir majority, and the consequences of the referendum interms of a changing relationship with the European Unionare, at the time of writing, unfolding under a minority Con-servative government supported, via a confidence and supplyarrangement, by the 10 MPs of Northern Ireland’s Demo-cratic Unionist party. These events were largely unpredicted,and a climate of division has prevailed throughout.
Against this backdrop, there is a need for a comprehensiveand objective quantification of the extent of the issue. Here,we provide such an analysis in the context of the Twitterplatform, and cover four separate time periods across fiveyears, making it possible to learn more about how currentevents affect abuse sent, any suggestion of trends, and whatfindings remain steady across a range of samples. We focuson tweets using obscene nouns (“cunt”, “twat”, etc.), racistor otherwise bigoted language and milder insults (“you id-iot”, “coward”). In this way, we define “abuse” broadly;“hate speech”, where religious, racial or gender groups aredenigrated, would be included in this.
A note about gender
Quantitative findings such as those in our work donot address the complex culture surrounding what itmeans to be female, male or otherwise in our society.Work from the Pew Research Center (2014), as wellas expanding on similar findings about female vs.male online abuse levels in a random sample, notesthat women were “more likely to be upset” by abusereceived. Indeed, the meaning of threats and abusefor any particular demographic varies a great dealdepending on factors such as history of oppression,physical vulnerability and the security of their socialstanding. As Chemaly comments in her piece for Time,“women take online harassment more seriously notbecause we are hysterics, but because we reasonablyhave to” (Chemaly 2014). This work presents, there-fore, only a part the story. Pew also find that youngerwomen, in the 18-24 age range, are disproportionatelytargeted; a group not represented in our sample ofpoliticians.
arX
iv:1
904.
1123
0v1
[cs
.CY
] 2
5 A
pr 2
019
But we do not limit our analysis to hate speech. We in-cluded all manner of personal attacks and threats, but not ob-scene language (e.g. “fucking”, “bloody”) as it is less likelyto be targeted at the politician personally. In this work, webuild on previous work (Gorrell et al. 2018) by adding twofurther time periods; one from late 2018 and a further periodfrom early 2019. These time periods offer fruitful groundsfor exploration on two counts. Firstly, they provide addi-tional data on the same parliament as was studied in 2017.Data from 2015 and 2017 focus on quite a different set ofprominent politicians. In introducing more data from thesame parliament as the 2017 set, we have more grounds forobserving which effects arise from those particular individ-uals and which transcend them. Furthermore, the late 2018and early 2019 datasets come at a time when the spotlightin on the process of negotiating the terms on which the UKproposes to exit the European Union. So Brexit forms a par-ticular focus for interest in this work.
Our previous work (Gorrell et al. 2018) offered an analy-sis of Twitter users who send abuse; for example, how theycompare to other Twitter users in terms of account age, fol-lowers and so forth. We found important differences sug-gesting different profiles of those who send abuse. This hasnot formed part of the focus here however. Instead of focus-ing on who sends abuse, in this work we introduce a newfocus in a final section analyzing how abuse terms are used.This is partly in response to a need to expand further on gen-der, given that our finding that men receive more abuse inquantitative terms runs contrary to the common perception.Please see the box “A note about gender” on page 1 for moreon this. In this work, we also no longer consider threat terms,but focus just on abusive language.
Related WorkWhilst online fora have attracted much attention as a way ofexploring political dynamics (Nulty et al. 2016; Kaczmireket al. 2013; Colleoni, Rozza, and Arvidsson 2014; We-ber, Garimella, and Borra 2012; Conover et al. 2011;Gonzalez-Bailon, Banchs, and Kaltenbrunner 2010), and theeffect of abuse and incivility in these contexts has been ex-plored (Vargo and Hopp 2017; Rusel 2017; Gervais 2015;Hwang et al. 2008), little work exists regarding the abu-sive and intimidating ways people address politicians on-line; a trend that has worrying implications for democracy.Theocharis et al (2016) collected tweets centred around can-didates for the European Parliament election in 2014 fromSpain, Germany, the United Kingdom and France posted inthe month surrounding the election. They find that the ex-tent of the abuse and harrassment a politician is subject tocorrelates with their engagement with the medium. Wardand McLoughlin 2017 find similar results to ours, for ex-ample regarding the greater abuse received by male MPs,in a two and a half month period running from late 2016to early 2017; we contribute with a more in-depth explo-ration of how prominence relates to abuse received, and bystudying four time periods over five years. They considerhate speech/gendered slurs separately, however, and find thatwomen receive more of these. They find that most Twitterabuse takes the form of a reply.
The subject of online abuse of women politicians andjournalists has also been taken up in a campaign by AmnestyInternational. Stambolieva’s work for Amnesty (Stam-bolieva 2017) studied only women MPs, though has been in-terpreted as indicating that women receive more abuse thanmen.2 It found that Diane Abbott received almost half ofabusive tweets targeted at women MPs in the six weeks pre-ceding the 2017 general election period, far more than anyother woman MP, a finding which was then reported in thepress.34 However we find that Theresa May received almosteight times as many abusive tweets as Diane Abbott in themonth preceding the election, and more abuse as a propor-tion of total tweets received. Recent work in association withAmnesty continues the programme,56 again studying onlywomen. Recently, the programme has crowdsourced a largecorpus of abuse against women MPs and journalists (Delisleet al. 2019).78
A larger body of work has looked at hatred on socialmedia more generally (Perry and Olsson 2009; Coe, Ken-ski, and Rains 2014; Cheng, Danescu-Niculescu-Mizil, andLeskovec 2015). Williams (Williams and Burnap 2015) andBurnap (Burnap and Williams 2015) present work demon-strating the potential of Twitter for evidencing social modelsof online hate crime that could support prediction, as wellas exploring how attitudes co-evolve with events to deter-mine their impact. Silva et al (2016) use natural languageprocessing (NLP) to identify the groups targeted for hatredon Twitter and Whisper. Munger presents intriguing work onautomated (bot) social sanctions, (e.g. Munger 2017).
A surge of recent interest aims to detect abuse, hate speechand toxicity automatically, resulting in increasing availabil-ity of training data and workshops focused on the topic (Bur-nap and Williams 2015; Nobata et al. 2016; Chen et al. 2012;Dinakar et al. 2012; Wulczyn, Thain, and Dixon 2017;Bretschneider and Peters 2017; Nobata et al. 2016; Waseemand Hovy 2016).91011 Schmidt and Wiegand (2017) pro-vide a review of prior work and methods, as do Fortuna andNunes (2018). Reported performances vary widely depend-ing on the specifics of the task. In very recent times attentionhas begun to turn to the issue of bias in abuse classification.Unintended bias, for example being more likely to label atext as abusive if it was penned by a particular demographicbecause that bias was present in the training data, has beenhighlighted as an issue in Google’s “Perspective” toxicityscorer,12 which they have recognized, and the overcoming
2http://tinyurl.com/leaf-blog-wom-harrass;see also correction at http://tinyurl.com/
guardian-abbott-most-ab3http://tinyurl.com/guardian-may-abuse4http://tinyurl.com/guardian-abbott-most-ab5http://tinyurl.com/amnesty-unsocial-media6http://tinyurl.com/amnesty-toxic-place7http://tinyurl.com/amnesty-crowdsourced8http://tinyurl.com/amnesty-troll-findings9http://tinyurl.com/alw-workshop-2017
10http://tinyurl.com/alw-workshop-201811http://tinyurl.com/alw-stack-overflow12http://tinyurl.com/jigsaw-unintend-bias
of which is formulated as an explicit objective in their newcompetition.13 Whilst unintended bias has been the subjectof much research in recent years with regards to making pre-dictive systems that don’t discriminate, it has only just be-gun to be taken up within abuse classification (Park, Shin,and Fung 2018).
In the next section, we describe our data collectionmethodology. We then present our results, beginning withan analysis of who receives the abuse, before moving on tothe topics that are most likely to trigger abusive replies. Wethen discuss some differential patterns in term use, beforeconcluding.
Methods
Data Collection
The corpora were created by downloading tweets in real-time using Twitter’s streaming API. The data collection fo-cused on Twitter accounts of MPs, candidates, and officialparty accounts. We obtained a list of all current MPs14 andall currently known election candidates15 (at that time) whohad Twitter accounts.
We used the API to follow the accounts of all MPsover the period of interest. This means we collected all thetweets sent by each MP, any replies to those tweets, and anyretweets either made by the MP or of the MPs own tweets.Note that this approach does not collect all tweets which anMP would see in their timeline as it does not include those inwhich they are just mentioned. We took this approach as theanalysis results are more reliable due to the fact that repliesare directed at the politician who authored the tweet, andthus, any abusive language is more likely to be directed atthem.
Data were of a low enough volume not to be constrainedby Twitter rate limits. Corpus statistics are given in table 1,and are separated out into all politicians studied and justthose who were then elected as MPs. The following timeperiods define the data used in this work:
• 2015: 7 April 2015 00:00 am - 7 May 2015 22:00 pm. Thisis the month before the 2015 general election, finishing atthe same time as the polls closed; hence the 10pm cutoff;
• 2017: 8 May 2017 00:00 am - 8 June 2017 22:00 pm.This is the month before the 2017 snap general election,finishing at the same time as the polls closed; hence the10pm cutoff;
• 2018: 21 Nov 2018 - 21 Dec 2018. This period includesthe 11th of December when there was planned to be ameaningful vote on Brexit which was pulled at the lastminute on the 10th of December;
• 2019: 7 Jan 2019 - 6 Feb 2019. This period includes themeaningful vote in which the government suffered thelargest ever defeat in the house of commons.
13http://tinyurl.com/jigsaw-kaggle-toxic14From a list made publicly available by BBC News Labs, which
we cleaned and verified15List of candidates obtained from https://yournextmp.
com
Abuse Classification
In order to identify abusive language, the politicians it istargeted at, and the topics in the politician’s original tweetthat tend to trigger abusive replies, we use a set of NLPtools, combined into a semantic analysis pipeline. It in-cludes, among other things, a component for MP and candi-date recognition, which detects mentions of MPs and elec-tion candidates in the tweet and pulls in information aboutthem from DBpedia. Topic detection finds mentions in thetext of political topics (e.g. environment, immigration) andsubtopics (e.g. fossil fuels). The list of topics was derivedfrom the set of topics used to categorise documents on thegov.uk website16, first seeded manually and then extendedsemi-automatically to include related terms and morpholog-ical variants using TermRaider17, resulting in a total of 940terms across 51 topics. This methodology is presented inmore detail in Maynard et al 2017. We also perform hash-tag tokenization, in order to find abuse and threat terms thatotherwise would be missed. In this way, for example, abu-sive language is found in the hashtag “#killthewitch”.
A dictionary-based approach was used to detect abusivelanguage in tweets. An abusive tweet is considered to beone containing one or more abusive terms from the vocabu-lary list.18 This contained 388 abusive terms or short phrasesin British and American English, comprising mostly an ex-tensive collection of insults. Racist and homophobic termsare included as well as various terms that denigrate a per-son’s appearance or intelligence. Short phrases might in-clude “you” to increase precision, for example “you cock”rather than “cock”.
Data from Kaggle’s 2012 challenge, “Detecting Insults inSocial Commentary”19, was used to evaluate the success ofthe approach. The training set was used to tune the termsincluded. On the test set, our approach was shown to havean accuracy of 0.80 (Cohen’s Kappa: 0.41), with a precisionof 0.70, a recall of 0.42 and an F1 of 0.52. In practice, per-formance is likely to be slightly better than this, since theKaggle corpus is American English.
Data-driven approaches have achieved widespread pop-ularity through their typically superior results, but withthe increasing real-world use of prediction systems, con-cerns have recently grown about their tendency to containunwanted bias (Hardt et al. 2016; Bolukbasi et al. 2016;Caliskan, Bryson, and Narayanan 2017). In the case of abusedetection, an example would be a system that learns from thetraining data that men receive more abuse, so on unseen datauses indicators of a male target, such as a male name, to clas-sify a text as abusive. Even a simple data-driven approach,if it has access to all the words in the input as features, islikely to learn more from the training data than strictly per-
16e.g. https://www.gov.uk/government/policies17https://gate.ac.uk/projects/arcomem/
TermRaider.html18Warning; strong language and offensive slurs: http:
//staffwww.dcs.shef.ac.uk/people/G.Gorrell/
publications-materials/abuse-terms.txt19https://www.kaggle.com/c/
detecting-insults-in-social-commentary/data
Date # MPs Tw. sent by MPs Replies to MPs Abusive Repl. % Abusive Retweets of MPs Avg # RTs
2015 474 59,143 267,867 7,960 2.97% 412,520 6.972017 541 49,984 614,691 20,477 3.33% 1,706,102 34.132018 501 37,405 1,013,538 30,871 3.05% 1,795,952 48.012019 504 36,210 939,982 26,854 2.86% 1,735,576 47.93
Table 1: Corpus statistics
tains to the task. In this work, this would be completely un-acceptable, as it would make it impossible for us to knowif men really did receive more abuse in unseen data, or ifthe classifier was biased. Subtler unwanted bias might in-clude stereotyping a particular cultural group as more likelyto be abusive, so labelling texts containing certain slangas abusive even when they aren’t. An abundance of recentwork seeks to address this problem (e.g. (Dixon et al. 2018;Zhao et al. 2018)), but critics say we are still far from hav-ing solved it (Elazar and Goldberg 2018; Pleiss et al. 2017;Gonen and Goldberg 2019). For complete peace of mind, arule-based approach offers much more transparency and lessscope for unwanted bias.
However, in order to give a baseline demonstrating theadequacy of abuse classification performance, we also eval-uated a convolutional neural net (CNN) approach on thesame (Kaggle) data. Our model contains three major parts.We first encode the input words with a pre-trained 100 di-mension Glove twitter embedding (Pennington, Socher, andManning 2014). Then we apply a CNN network (Kim 2014)(kernel size 3, 4, 5, and 100 output dimensions), with batchnormalization (momentum=0.1) to extract the local featuresof the input text. Finally, our output layer applies a sigmoidfunction for binary classification.
We obtained a result somewhat superior to results ob-tained by others on that dataset when the competition ranin 2012,20 with an AUROC of 0.8662. Our rule-based sys-tem cannot easily be compared directly, as AUROC does notmake sense for such an approach. The result was fraction-ally better than the rule-based approach, with an accuracyof 0.8243 and Cohens Kappa of 0.4765. We also measuredthe positive class recall (0.4603), precision (0.7780) and F1-measure (0.5784). Given that this system was trained andtested on data from the same source, which was longer so-cial media posts in American English, the result cannot beexpected to carry over undiminished to our British EnglishTwitter data. We therefore concluded that our gazetteer sys-tem was acceptable in performance and also more suitablethrough its resistance to unwanted bias.
Inspection of errors in the rule-based system revealsthat performance is diminished by coarse language in non-abusive texts and polite language in abusive texts, but noth-ing that raised concerns for the results presented here.
20https://www.kaggle.com/c/
detecting-insults-in-social-commentary/
leaderboard
Topic Identification
Topic analysis of tweets is based on reusing the methodsfrom the Nesta Political Futures Tracker project (PFT). 21
The PFT project focused on real-time analysis of tweets inthe run-up to the May 2015 General Election.
The set of topics we adopted were based around theUK governments high-level “policy areas”,22 such as pub-lic health, immigration, and law, although we have extendedthis list to include other highly relevant topics includingBrexit. For each of these, we then associated sets of key-words (e.g. for public health: NHS, nursing, doctors), whichwere discovered automatically from the party manifestosand UK election tweets, then post-edited and extended man-ually.
Analysis
When we look at the abuse received by MPs there are bothmany ways to subdivide the MPs into groups as well as dif-ferent ways of then analysing the data within the groupings.Many of the remaining sections of this document focus on aspecific partitioning of the MPs into different groups, be thatby party, gender, or a political stance etc. Within each of thefollowing sections the level of abuse can, and often is, re-ported in at least two different ways. One way of analysingthe data for a group of MPs is simply to add together allthe abusive tweets received by MPs in that group and re-port that as a percentage of the total number of replies tothe same MPs. This gives a single headline figure such as“3.8% of replies to Conservative MPs in 2015 were abusive”but completely ignores the possible wide variation amongstmembers of the group. An alternative is to determine theabuse level per MP and then look at the mean value (andstandard deviation) which, for example, shows that a Con-servative MP in 2015 is likely to see 0.775% of their repliesbeing abusive.
Both of these approaches, while giving very differentnumbers, are equally valid ways of looking at the data, butcare needs to be taken when interpreting the results to un-derstand how the analysis was performed.
Findings
Findings are presented under three headings. First, who isreceiving the abuse, in terms of gender, ethnicity and polit-ical position. Secondly, we investigate the topics that arisein abusive tweets particularly. Finally we look at particular
21https://www.nesta.org.uk/blog/
introducing-the-political-futures-tracker/22https://www.gov.uk/government/topics
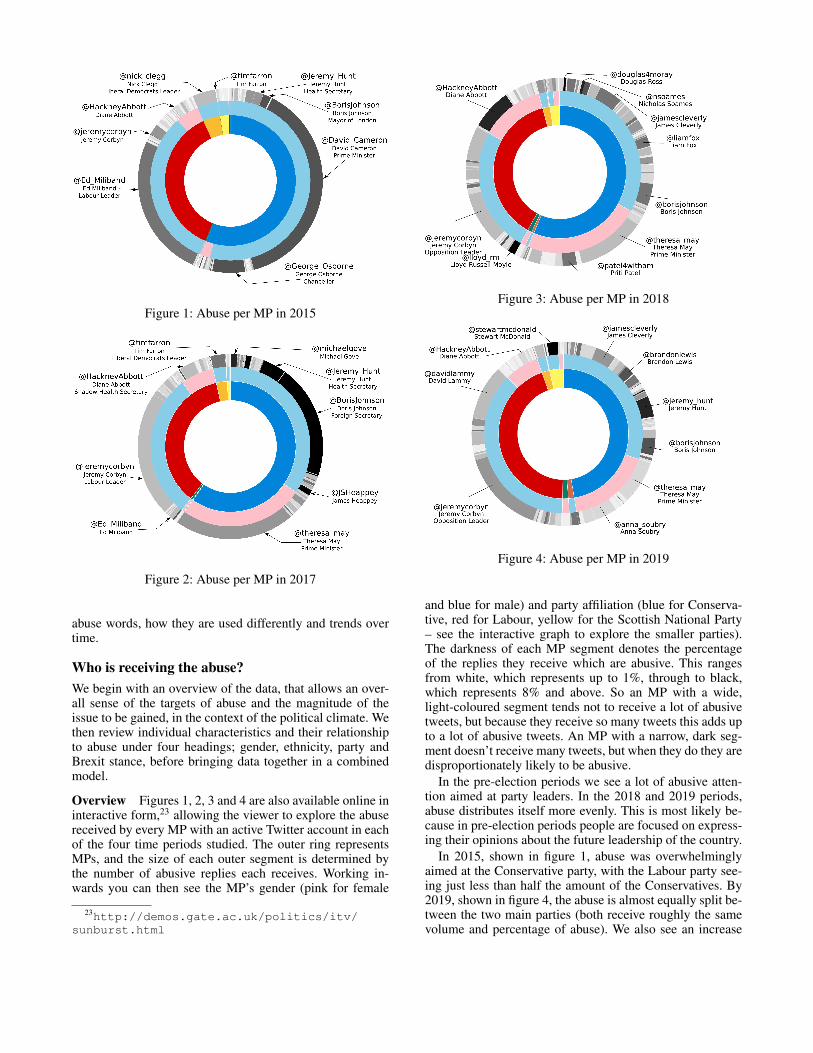
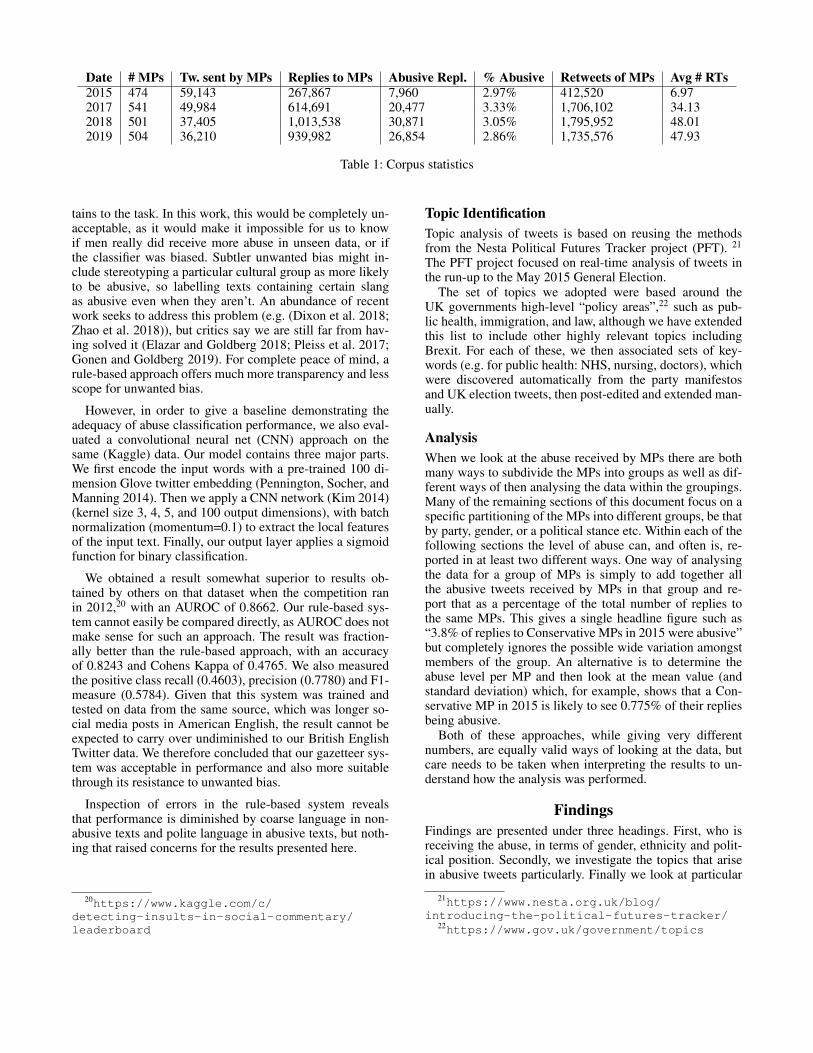
Figure 1: Abuse per MP in 2015
Figure 2: Abuse per MP in 2017
abuse words, how they are used differently and trends overtime.
Who is receiving the abuse?
We begin with an overview of the data, that allows an over-all sense of the targets of abuse and the magnitude of theissue to be gained, in the context of the political climate. Wethen review individual characteristics and their relationshipto abuse under four headings; gender, ethnicity, party andBrexit stance, before bringing data together in a combinedmodel.
Overview Figures 1, 2, 3 and 4 are also available online ininteractive form,23 allowing the viewer to explore the abusereceived by every MP with an active Twitter account in eachof the four time periods studied. The outer ring representsMPs, and the size of each outer segment is determined bythe number of abusive replies each receives. Working in-wards you can then see the MP’s gender (pink for female
23http://demos.gate.ac.uk/politics/itv/
sunburst.html
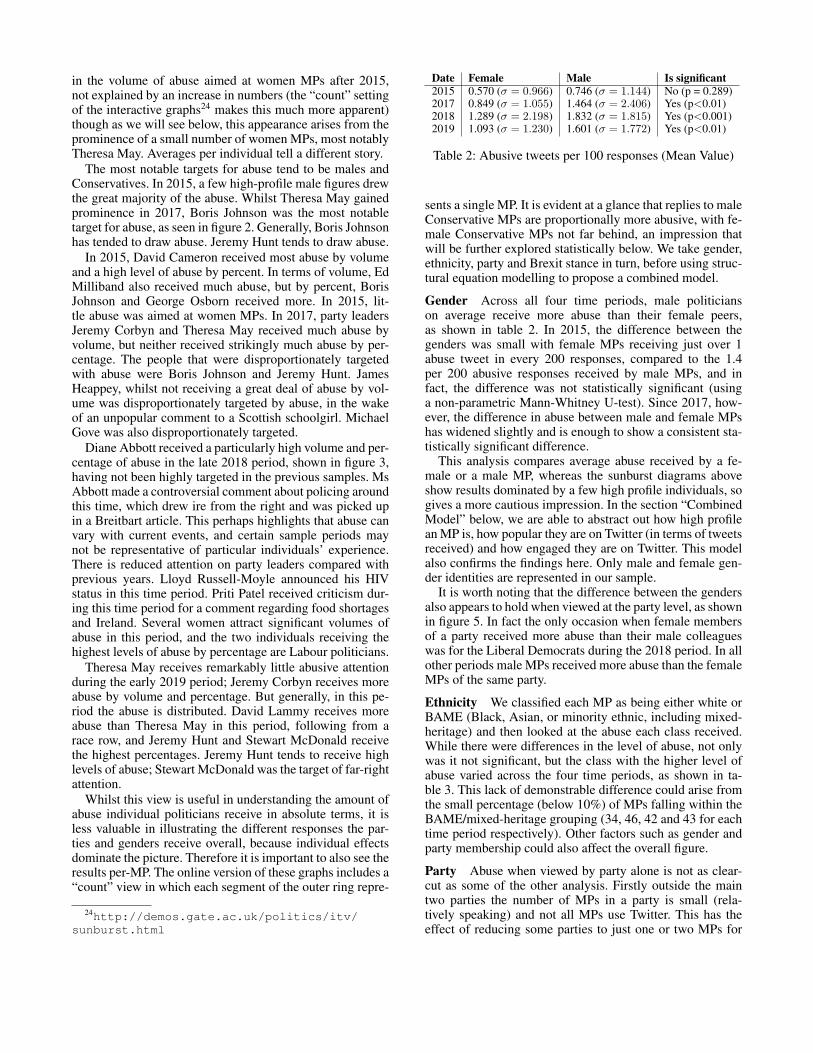
Figure 3: Abuse per MP in 2018
Figure 4: Abuse per MP in 2019
and blue for male) and party affiliation (blue for Conserva-tive, red for Labour, yellow for the Scottish National Party– see the interactive graph to explore the smaller parties).The darkness of each MP segment denotes the percentageof the replies they receive which are abusive. This rangesfrom white, which represents up to 1%, through to black,which represents 8% and above. So an MP with a wide,light-coloured segment tends not to receive a lot of abusivetweets, but because they receive so many tweets this adds upto a lot of abusive tweets. An MP with a narrow, dark seg-ment doesn’t receive many tweets, but when they do they aredisproportionately likely to be abusive.
In the pre-election periods we see a lot of abusive atten-tion aimed at party leaders. In the 2018 and 2019 periods,abuse distributes itself more evenly. This is most likely be-cause in pre-election periods people are focused on express-ing their opinions about the future leadership of the country.
In 2015, shown in figure 1, abuse was overwhelminglyaimed at the Conservative party, with the Labour party see-ing just less than half the amount of the Conservatives. By2019, shown in figure 4, the abuse is almost equally split be-tween the two main parties (both receive roughly the samevolume and percentage of abuse). We also see an increase
in the volume of abuse aimed at women MPs after 2015,not explained by an increase in numbers (the “count” settingof the interactive graphs24 makes this much more apparent)though as we will see below, this appearance arises from theprominence of a small number of women MPs, most notablyTheresa May. Averages per individual tell a different story.
The most notable targets for abuse tend to be males andConservatives. In 2015, a few high-profile male figures drewthe great majority of the abuse. Whilst Theresa May gainedprominence in 2017, Boris Johnson was the most notabletarget for abuse, as seen in figure 2. Generally, Boris Johnsonhas tended to draw abuse. Jeremy Hunt tends to draw abuse.
In 2015, David Cameron received most abuse by volumeand a high level of abuse by percent. In terms of volume, EdMilliband also received much abuse, but by percent, BorisJohnson and George Osborn received more. In 2015, lit-tle abuse was aimed at women MPs. In 2017, party leadersJeremy Corbyn and Theresa May received much abuse byvolume, but neither received strikingly much abuse by per-centage. The people that were disproportionately targetedwith abuse were Boris Johnson and Jeremy Hunt. JamesHeappey, whilst not receiving a great deal of abuse by vol-ume was disproportionately targeted by abuse, in the wakeof an unpopular comment to a Scottish schoolgirl. MichaelGove was also disproportionately targeted.
Diane Abbott received a particularly high volume and per-centage of abuse in the late 2018 period, shown in figure 3,having not been highly targeted in the previous samples. MsAbbott made a controversial comment about policing aroundthis time, which drew ire from the right and was picked upin a Breitbart article. This perhaps highlights that abuse canvary with current events, and certain sample periods maynot be representative of particular individuals’ experience.There is reduced attention on party leaders compared withprevious years. Lloyd Russell-Moyle announced his HIVstatus in this time period. Priti Patel received criticism dur-ing this time period for a comment regarding food shortagesand Ireland. Several women attract significant volumes ofabuse in this period, and the two individuals receiving thehighest levels of abuse by percentage are Labour politicians.
Theresa May receives remarkably little abusive attentionduring the early 2019 period; Jeremy Corbyn receives moreabuse by volume and percentage. But generally, in this pe-riod the abuse is distributed. David Lammy receives moreabuse than Theresa May in this period, following from arace row, and Jeremy Hunt and Stewart McDonald receivethe highest percentages. Jeremy Hunt tends to receive highlevels of abuse; Stewart McDonald was the target of far-rightattention.
Whilst this view is useful in understanding the amount ofabuse individual politicians receive in absolute terms, it isless valuable in illustrating the different responses the par-ties and genders receive overall, because individual effectsdominate the picture. Therefore it is important to also see theresults per-MP. The online version of these graphs includes a“count” view in which each segment of the outer ring repre-
24http://demos.gate.ac.uk/politics/itv/
sunburst.html
Date Female Male Is significant
2015 0.570 (σ = 0.966) 0.746 (σ = 1.144) No (p = 0.289)2017 0.849 (σ = 1.055) 1.464 (σ = 2.406) Yes (p<0.01)2018 1.289 (σ = 2.198) 1.832 (σ = 1.815) Yes (p<0.001)2019 1.093 (σ = 1.230) 1.601 (σ = 1.772) Yes (p<0.01)
Table 2: Abusive tweets per 100 responses (Mean Value)
sents a single MP. It is evident at a glance that replies to maleConservative MPs are proportionally more abusive, with fe-male Conservative MPs not far behind, an impression thatwill be further explored statistically below. We take gender,ethnicity, party and Brexit stance in turn, before using struc-tural equation modelling to propose a combined model.
Gender Across all four time periods, male politicianson average receive more abuse than their female peers,as shown in table 2. In 2015, the difference between thegenders was small with female MPs receiving just over 1abuse tweet in every 200 responses, compared to the 1.4per 200 abusive responses received by male MPs, and infact, the difference was not statistically significant (usinga non-parametric Mann-Whitney U-test). Since 2017, how-ever, the difference in abuse between male and female MPshas widened slightly and is enough to show a consistent sta-tistically significant difference.
This analysis compares average abuse received by a fe-male or a male MP, whereas the sunburst diagrams aboveshow results dominated by a few high profile individuals, sogives a more cautious impression. In the section “CombinedModel” below, we are able to abstract out how high profilean MP is, how popular they are on Twitter (in terms of tweetsreceived) and how engaged they are on Twitter. This modelalso confirms the findings here. Only male and female gen-der identities are represented in our sample.
It is worth noting that the difference between the gendersalso appears to hold when viewed at the party level, as shownin figure 5. In fact the only occasion when female membersof a party received more abuse than their male colleagueswas for the Liberal Democrats during the 2018 period. In allother periods male MPs received more abuse than the femaleMPs of the same party.
Ethnicity We classified each MP as being either white orBAME (Black, Asian, or minority ethnic, including mixed-heritage) and then looked at the abuse each class received.While there were differences in the level of abuse, not onlywas it not significant, but the class with the higher level ofabuse varied across the four time periods, as shown in ta-ble 3. This lack of demonstrable difference could arise fromthe small percentage (below 10%) of MPs falling within theBAME/mixed-heritage grouping (34, 46, 42 and 43 for eachtime period respectively). Other factors such as gender andparty membership could also affect the overall figure.
Party Abuse when viewed by party alone is not as clear-cut as some of the other analysis. Firstly outside the maintwo parties the number of MPs in a party is small (rela-tively speaking) and not all MPs use Twitter. This has theeffect of reducing some parties to just one or two MPs for
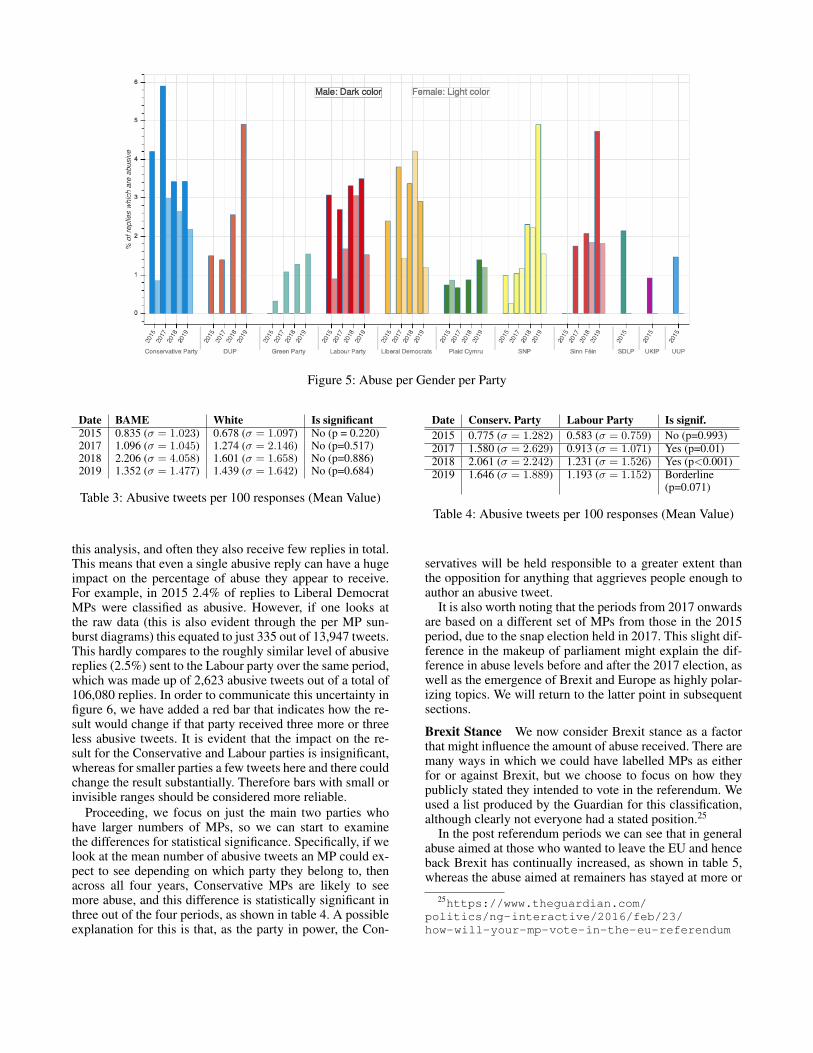
Figure 5: Abuse per Gender per Party
Date BAME White Is significant
2015 0.835 (σ = 1.023) 0.678 (σ = 1.097) No (p = 0.220)2017 1.096 (σ = 1.045) 1.274 (σ = 2.146) No (p=0.517)2018 2.206 (σ = 4.058) 1.601 (σ = 1.658) No (p=0.886)2019 1.352 (σ = 1.477) 1.439 (σ = 1.642) No (p=0.684)
Table 3: Abusive tweets per 100 responses (Mean Value)
this analysis, and often they also receive few replies in total.This means that even a single abusive reply can have a hugeimpact on the percentage of abuse they appear to receive.For example, in 2015 2.4% of replies to Liberal DemocratMPs were classified as abusive. However, if one looks atthe raw data (this is also evident through the per MP sun-burst diagrams) this equated to just 335 out of 13,947 tweets.This hardly compares to the roughly similar level of abusivereplies (2.5%) sent to the Labour party over the same period,which was made up of 2,623 abusive tweets out of a total of106,080 replies. In order to communicate this uncertainty infigure 6, we have added a red bar that indicates how the re-sult would change if that party received three more or threeless abusive tweets. It is evident that the impact on the re-sult for the Conservative and Labour parties is insignificant,whereas for smaller parties a few tweets here and there couldchange the result substantially. Therefore bars with small orinvisible ranges should be considered more reliable.
Proceeding, we focus on just the main two parties whohave larger numbers of MPs, so we can start to examinethe differences for statistical significance. Specifically, if welook at the mean number of abusive tweets an MP could ex-pect to see depending on which party they belong to, thenacross all four years, Conservative MPs are likely to seemore abuse, and this difference is statistically significant inthree out of the four periods, as shown in table 4. A possibleexplanation for this is that, as the party in power, the Con-
Date Conserv. Party Labour Party Is signif.
2015 0.775 (σ = 1.282) 0.583 (σ = 0.759) No (p=0.993)
2017 1.580 (σ = 2.629) 0.913 (σ = 1.071) Yes (p=0.01)
2018 2.061 (σ = 2.242) 1.231 (σ = 1.526) Yes (p<0.001)
2019 1.646 (σ = 1.889) 1.193 (σ = 1.152) Borderline(p=0.071)
Table 4: Abusive tweets per 100 responses (Mean Value)
servatives will be held responsible to a greater extent thanthe opposition for anything that aggrieves people enough toauthor an abusive tweet.
It is also worth noting that the periods from 2017 onwardsare based on a different set of MPs from those in the 2015period, due to the snap election held in 2017. This slight dif-ference in the makeup of parliament might explain the dif-ference in abuse levels before and after the 2017 election, aswell as the emergence of Brexit and Europe as highly polar-izing topics. We will return to the latter point in subsequentsections.
Brexit Stance We now consider Brexit stance as a factorthat might influence the amount of abuse received. There aremany ways in which we could have labelled MPs as eitherfor or against Brexit, but we choose to focus on how theypublicly stated they intended to vote in the referendum. Weused a list produced by the Guardian for this classification,although clearly not everyone had a stated position.25
In the post referendum periods we can see that in generalabuse aimed at those who wanted to leave the EU and henceback Brexit has continually increased, as shown in table 5,whereas the abuse aimed at remainers has stayed at more or
25https://www.theguardian.com/
politics/ng-interactive/2016/feb/23/
how-will-your-mp-vote-in-the-eu-referendum
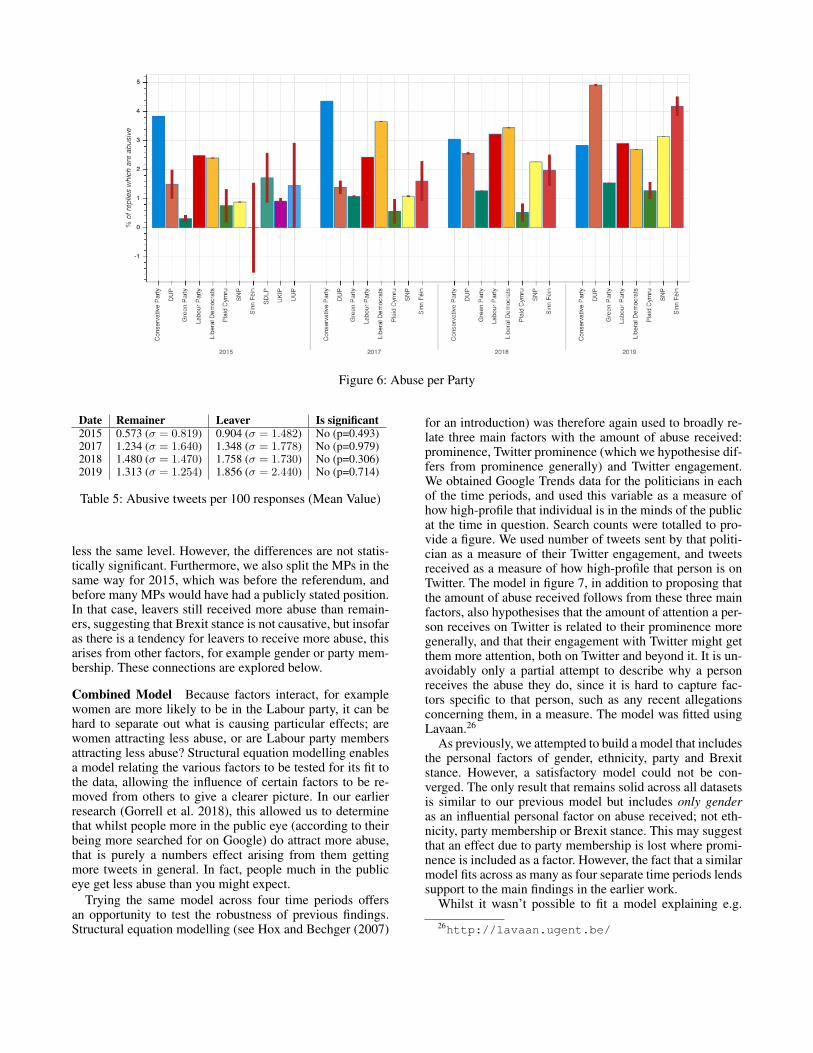
Figure 6: Abuse per Party
Date Remainer Leaver Is significant
2015 0.573 (σ = 0.819) 0.904 (σ = 1.482) No (p=0.493)2017 1.234 (σ = 1.640) 1.348 (σ = 1.778) No (p=0.979)2018 1.480 (σ = 1.470) 1.758 (σ = 1.730) No (p=0.306)2019 1.313 (σ = 1.254) 1.856 (σ = 2.440) No (p=0.714)
Table 5: Abusive tweets per 100 responses (Mean Value)
less the same level. However, the differences are not statis-tically significant. Furthermore, we also split the MPs in thesame way for 2015, which was before the referendum, andbefore many MPs would have had a publicly stated position.In that case, leavers still received more abuse than remain-ers, suggesting that Brexit stance is not causative, but insofaras there is a tendency for leavers to receive more abuse, thisarises from other factors, for example gender or party mem-bership. These connections are explored below.
Combined Model Because factors interact, for examplewomen are more likely to be in the Labour party, it can behard to separate out what is causing particular effects; arewomen attracting less abuse, or are Labour party membersattracting less abuse? Structural equation modelling enablesa model relating the various factors to be tested for its fit tothe data, allowing the influence of certain factors to be re-moved from others to give a clearer picture. In our earlierresearch (Gorrell et al. 2018), this allowed us to determinethat whilst people more in the public eye (according to theirbeing more searched for on Google) do attract more abuse,that is purely a numbers effect arising from them gettingmore tweets in general. In fact, people much in the publiceye get less abuse than you might expect.
Trying the same model across four time periods offersan opportunity to test the robustness of previous findings.Structural equation modelling (see Hox and Bechger (2007)
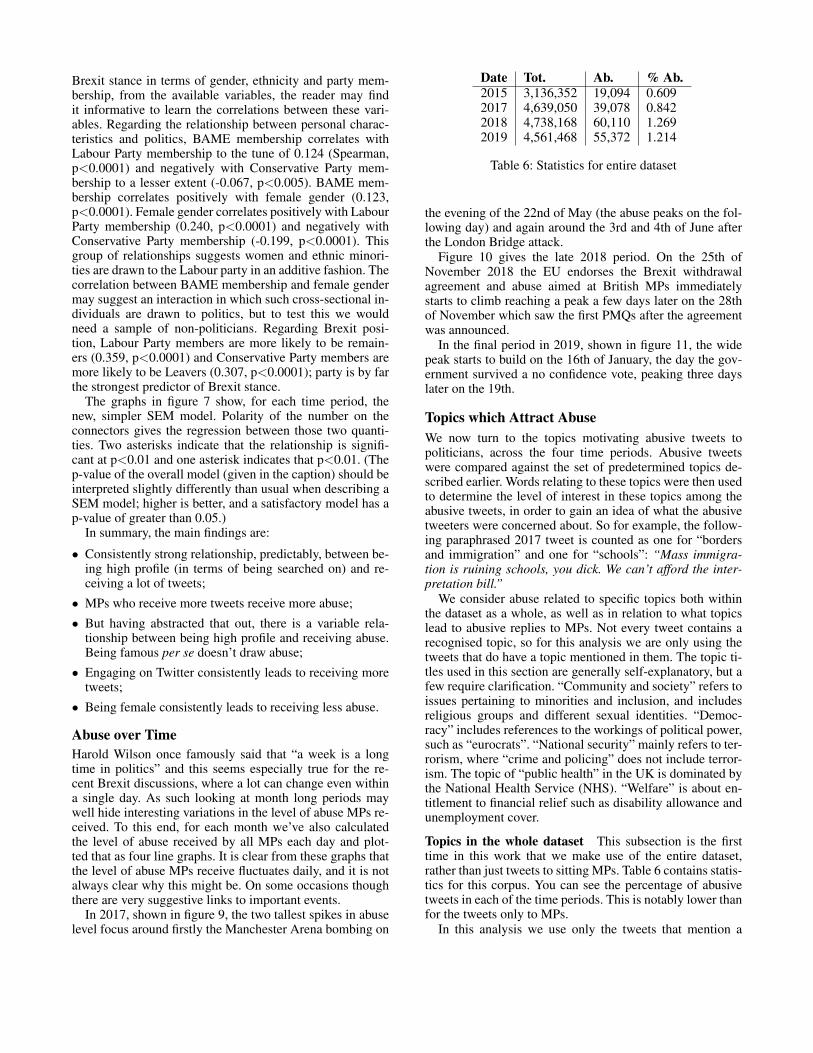
for an introduction) was therefore again used to broadly re-late three main factors with the amount of abuse received:prominence, Twitter prominence (which we hypothesise dif-fers from prominence generally) and Twitter engagement.We obtained Google Trends data for the politicians in eachof the time periods, and used this variable as a measure ofhow high-profile that individual is in the minds of the publicat the time in question. Search counts were totalled to pro-vide a figure. We used number of tweets sent by that politi-cian as a measure of their Twitter engagement, and tweetsreceived as a measure of how high-profile that person is onTwitter. The model in figure 7, in addition to proposing thatthe amount of abuse received follows from these three mainfactors, also hypothesises that the amount of attention a per-son receives on Twitter is related to their prominence moregenerally, and that their engagement with Twitter might getthem more attention, both on Twitter and beyond it. It is un-avoidably only a partial attempt to describe why a personreceives the abuse they do, since it is hard to capture fac-tors specific to that person, such as any recent allegationsconcerning them, in a measure. The model was fitted usingLavaan.26
As previously, we attempted to build a model that includesthe personal factors of gender, ethnicity, party and Brexitstance. However, a satisfactory model could not be con-verged. The only result that remains solid across all datasetsis similar to our previous model but includes only genderas an influential personal factor on abuse received; not eth-nicity, party membership or Brexit stance. This may suggestthat an effect due to party membership is lost where promi-nence is included as a factor. However, the fact that a similarmodel fits across as many as four separate time periods lendssupport to the main findings in the earlier work.
Whilst it wasn’t possible to fit a model explaining e.g.
26http://lavaan.ugent.be/
Brexit stance in terms of gender, ethnicity and party mem-bership, from the available variables, the reader may findit informative to learn the correlations between these vari-ables. Regarding the relationship between personal charac-teristics and politics, BAME membership correlates withLabour Party membership to the tune of 0.124 (Spearman,p<0.0001) and negatively with Conservative Party mem-bership to a lesser extent (-0.067, p<0.005). BAME mem-bership correlates positively with female gender (0.123,p<0.0001). Female gender correlates positively with LabourParty membership (0.240, p<0.0001) and negatively withConservative Party membership (-0.199, p<0.0001). Thisgroup of relationships suggests women and ethnic minori-ties are drawn to the Labour party in an additive fashion. Thecorrelation between BAME membership and female gendermay suggest an interaction in which such cross-sectional in-dividuals are drawn to politics, but to test this we wouldneed a sample of non-politicians. Regarding Brexit posi-tion, Labour Party members are more likely to be remain-ers (0.359, p<0.0001) and Conservative Party members aremore likely to be Leavers (0.307, p<0.0001); party is by farthe strongest predictor of Brexit stance.
The graphs in figure 7 show, for each time period, thenew, simpler SEM model. Polarity of the number on theconnectors gives the regression between those two quanti-ties. Two asterisks indicate that the relationship is signifi-cant at p<0.01 and one asterisk indicates that p<0.01. (Thep-value of the overall model (given in the caption) should beinterpreted slightly differently than usual when describing aSEM model; higher is better, and a satisfactory model has ap-value of greater than 0.05.)
In summary, the main findings are:
• Consistently strong relationship, predictably, between be-ing high profile (in terms of being searched on) and re-ceiving a lot of tweets;
• MPs who receive more tweets receive more abuse;
• But having abstracted that out, there is a variable rela-tionship between being high profile and receiving abuse.Being famous per se doesn’t draw abuse;
• Engaging on Twitter consistently leads to receiving moretweets;
• Being female consistently leads to receiving less abuse.
Abuse over Time
Harold Wilson once famously said that “a week is a longtime in politics” and this seems especially true for the re-cent Brexit discussions, where a lot can change even withina single day. As such looking at month long periods maywell hide interesting variations in the level of abuse MPs re-ceived. To this end, for each month we’ve also calculatedthe level of abuse received by all MPs each day and plot-ted that as four line graphs. It is clear from these graphs thatthe level of abuse MPs receive fluctuates daily, and it is notalways clear why this might be. On some occasions thoughthere are very suggestive links to important events.
In 2017, shown in figure 9, the two tallest spikes in abuselevel focus around firstly the Manchester Arena bombing on
Date Tot. Ab. % Ab.
2015 3,136,352 19,094 0.6092017 4,639,050 39,078 0.8422018 4,738,168 60,110 1.2692019 4,561,468 55,372 1.214
Table 6: Statistics for entire dataset
the evening of the 22nd of May (the abuse peaks on the fol-lowing day) and again around the 3rd and 4th of June afterthe London Bridge attack.
Figure 10 gives the late 2018 period. On the 25th ofNovember 2018 the EU endorses the Brexit withdrawalagreement and abuse aimed at British MPs immediatelystarts to climb reaching a peak a few days later on the 28thof November which saw the first PMQs after the agreementwas announced.
In the final period in 2019, shown in figure 11, the widepeak starts to build on the 16th of January, the day the gov-ernment survived a no confidence vote, peaking three dayslater on the 19th.
Topics which Attract Abuse
We now turn to the topics motivating abusive tweets topoliticians, across the four time periods. Abusive tweetswere compared against the set of predetermined topics de-scribed earlier. Words relating to these topics were then usedto determine the level of interest in these topics among theabusive tweets, in order to gain an idea of what the abusivetweeters were concerned about. So for example, the follow-ing paraphrased 2017 tweet is counted as one for “bordersand immigration” and one for “schools”: “Mass immigra-tion is ruining schools, you dick. We can’t afford the inter-pretation bill.”
We consider abuse related to specific topics both withinthe dataset as a whole, as well as in relation to what topicslead to abusive replies to MPs. Not every tweet contains arecognised topic, so for this analysis we are only using thetweets that do have a topic mentioned in them. The topic ti-tles used in this section are generally self-explanatory, but afew require clarification. “Community and society” refers toissues pertaining to minorities and inclusion, and includesreligious groups and different sexual identities. “Democ-racy” includes references to the workings of political power,such as “eurocrats”. “National security” mainly refers to ter-rorism, where “crime and policing” does not include terror-ism. The topic of “public health” in the UK is dominated bythe National Health Service (NHS). “Welfare” is about en-titlement to financial relief such as disability allowance andunemployment cover.
Topics in the whole dataset This subsection is the firsttime in this work that we make use of the entire dataset,rather than just tweets to sitting MPs. Table 6 contains statis-tics for this corpus. You can see the percentage of abusivetweets in each of the time periods. This is notably lower thanfor the tweets only to MPs.
In this analysis we use only the tweets that mention a
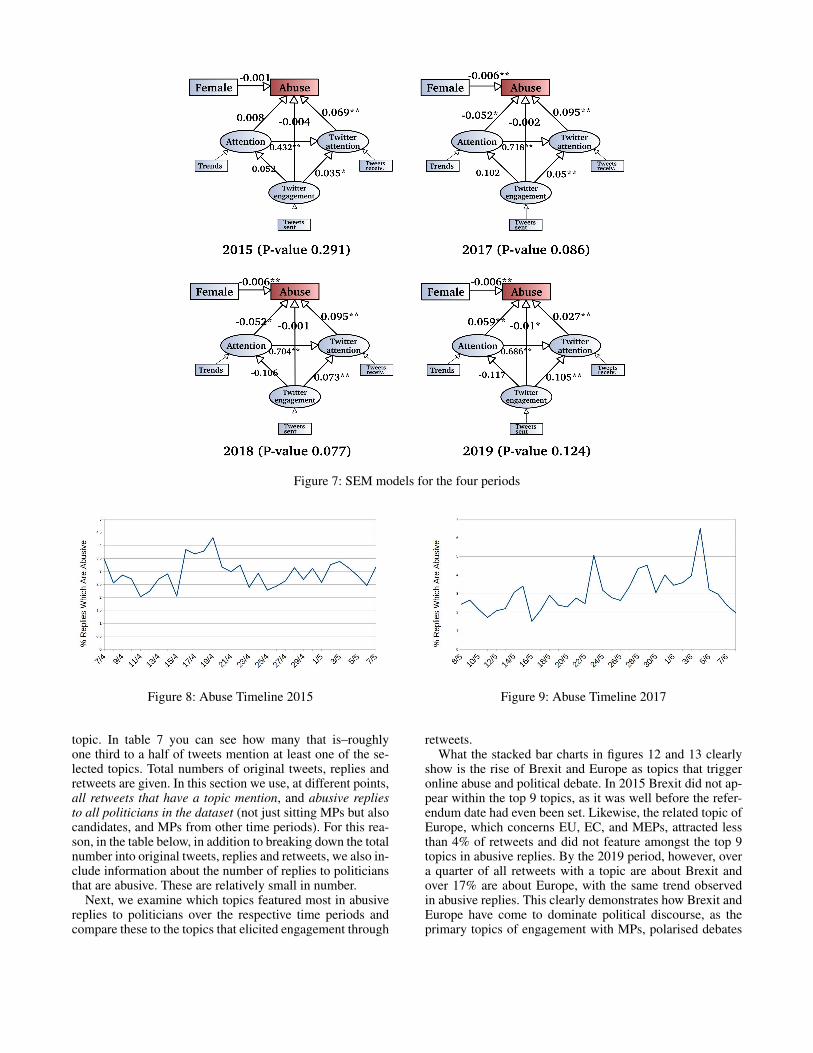
Figure 7: SEM models for the four periods
Figure 8: Abuse Timeline 2015
topic. In table 7 you can see how many that is–roughlyone third to a half of tweets mention at least one of the se-lected topics. Total numbers of original tweets, replies andretweets are given. In this section we use, at different points,all retweets that have a topic mention, and abusive repliesto all politicians in the dataset (not just sitting MPs but alsocandidates, and MPs from other time periods). For this rea-son, in the table below, in addition to breaking down the totalnumber into original tweets, replies and retweets, we also in-clude information about the number of replies to politiciansthat are abusive. These are relatively small in number.
Next, we examine which topics featured most in abusivereplies to politicians over the respective time periods andcompare these to the topics that elicited engagement through
Figure 9: Abuse Timeline 2017
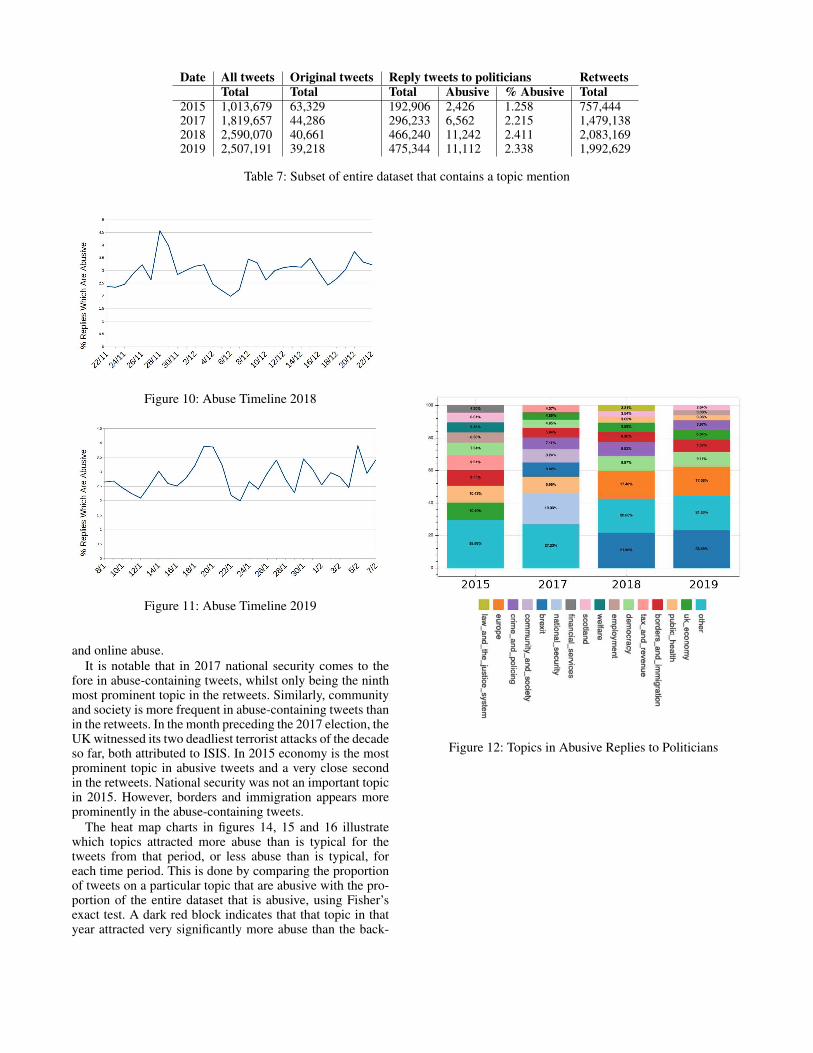
retweets.What the stacked bar charts in figures 12 and 13 clearly
show is the rise of Brexit and Europe as topics that triggeronline abuse and political debate. In 2015 Brexit did not ap-pear within the top 9 topics, as it was well before the refer-endum date had even been set. Likewise, the related topic ofEurope, which concerns EU, EC, and MEPs, attracted lessthan 4% of retweets and did not feature amongst the top 9topics in abusive replies. By the 2019 period, however, overa quarter of all retweets with a topic are about Brexit andover 17% are about Europe, with the same trend observedin abusive replies. This clearly demonstrates how Brexit andEurope have come to dominate political discourse, as theprimary topics of engagement with MPs, polarised debates
Date All tweets Original tweets Reply tweets to politicians Retweets
Total Total Total Abusive % Abusive Total
2015 1,013,679 63,329 192,906 2,426 1.258 757,4442017 1,819,657 44,286 296,233 6,562 2.215 1,479,1382018 2,590,070 40,661 466,240 11,242 2.411 2,083,1692019 2,507,191 39,218 475,344 11,112 2.338 1,992,629
Table 7: Subset of entire dataset that contains a topic mention
Figure 10: Abuse Timeline 2018
Figure 11: Abuse Timeline 2019
and online abuse.
It is notable that in 2017 national security comes to thefore in abuse-containing tweets, whilst only being the ninthmost prominent topic in the retweets. Similarly, communityand society is more frequent in abuse-containing tweets thanin the retweets. In the month preceding the 2017 election, theUK witnessed its two deadliest terrorist attacks of the decadeso far, both attributed to ISIS. In 2015 economy is the mostprominent topic in abusive tweets and a very close secondin the retweets. National security was not an important topicin 2015. However, borders and immigration appears moreprominently in the abuse-containing tweets.
The heat map charts in figures 14, 15 and 16 illustratewhich topics attracted more abuse than is typical for thetweets from that period, or less abuse than is typical, foreach time period. This is done by comparing the proportionof tweets on a particular topic that are abusive with the pro-portion of the entire dataset that is abusive, using Fisher’sexact test. A dark red block indicates that that topic in thatyear attracted very significantly more abuse than the back-
Figure 12: Topics in Abusive Replies to Politicians
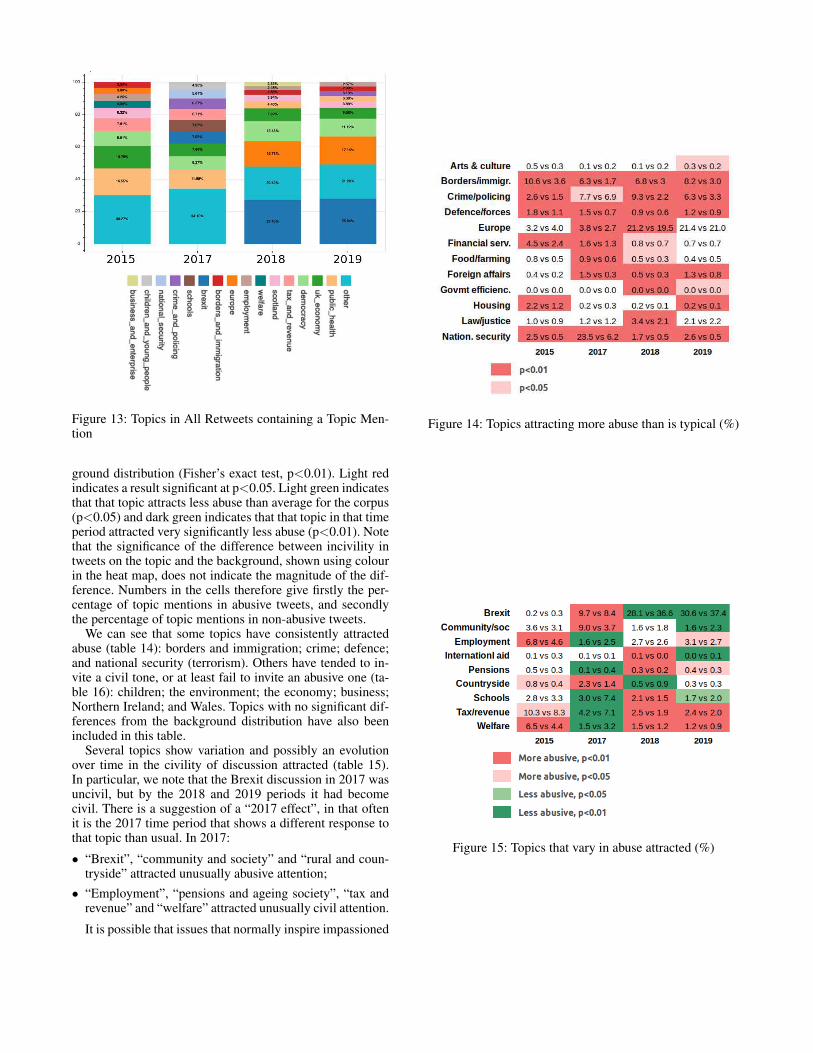
Figure 13: Topics in All Retweets containing a Topic Men-tion
ground distribution (Fisher’s exact test, p<0.01). Light redindicates a result significant at p<0.05. Light green indicatesthat that topic attracts less abuse than average for the corpus(p<0.05) and dark green indicates that that topic in that timeperiod attracted very significantly less abuse (p<0.01). Notethat the significance of the difference between incivility intweets on the topic and the background, shown using colourin the heat map, does not indicate the magnitude of the dif-ference. Numbers in the cells therefore give firstly the per-centage of topic mentions in abusive tweets, and secondlythe percentage of topic mentions in non-abusive tweets.
We can see that some topics have consistently attractedabuse (table 14): borders and immigration; crime; defence;and national security (terrorism). Others have tended to in-vite a civil tone, or at least fail to invite an abusive one (ta-ble 16): children; the environment; the economy; business;Northern Ireland; and Wales. Topics with no significant dif-ferences from the background distribution have also beenincluded in this table.
Several topics show variation and possibly an evolutionover time in the civility of discussion attracted (table 15).In particular, we note that the Brexit discussion in 2017 wasuncivil, but by the 2018 and 2019 periods it had becomecivil. There is a suggestion of a “2017 effect”, in that oftenit is the 2017 time period that shows a different response tothat topic than usual. In 2017:
• “Brexit”, “community and society” and “rural and coun-tryside” attracted unusually abusive attention;
• “Employment”, “pensions and ageing society”, “tax andrevenue” and “welfare” attracted unusually civil attention.
It is possible that issues that normally inspire impassioned
Figure 14: Topics attracting more abuse than is typical (%)
Figure 15: Topics that vary in abuse attracted (%)
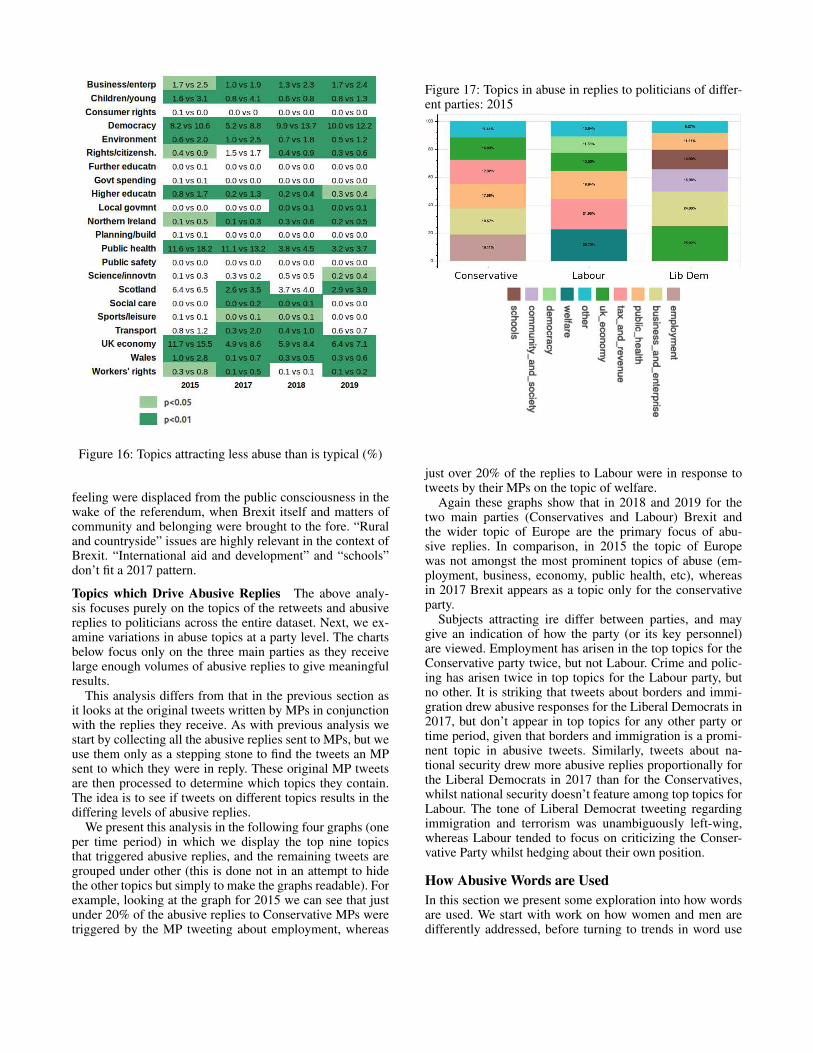
Figure 16: Topics attracting less abuse than is typical (%)
feeling were displaced from the public consciousness in thewake of the referendum, when Brexit itself and matters ofcommunity and belonging were brought to the fore. “Ruraland countryside” issues are highly relevant in the context ofBrexit. “International aid and development” and “schools”don’t fit a 2017 pattern.
Topics which Drive Abusive Replies The above analy-sis focuses purely on the topics of the retweets and abusivereplies to politicians across the entire dataset. Next, we ex-amine variations in abuse topics at a party level. The chartsbelow focus only on the three main parties as they receivelarge enough volumes of abusive replies to give meaningfulresults.
This analysis differs from that in the previous section asit looks at the original tweets written by MPs in conjunctionwith the replies they receive. As with previous analysis westart by collecting all the abusive replies sent to MPs, but weuse them only as a stepping stone to find the tweets an MPsent to which they were in reply. These original MP tweetsare then processed to determine which topics they contain.The idea is to see if tweets on different topics results in thediffering levels of abusive replies.
We present this analysis in the following four graphs (oneper time period) in which we display the top nine topicsthat triggered abusive replies, and the remaining tweets aregrouped under other (this is done not in an attempt to hidethe other topics but simply to make the graphs readable). Forexample, looking at the graph for 2015 we can see that justunder 20% of the abusive replies to Conservative MPs weretriggered by the MP tweeting about employment, whereas
Figure 17: Topics in abuse in replies to politicians of differ-ent parties: 2015
just over 20% of the replies to Labour were in response totweets by their MPs on the topic of welfare.
Again these graphs show that in 2018 and 2019 for thetwo main parties (Conservatives and Labour) Brexit andthe wider topic of Europe are the primary focus of abu-sive replies. In comparison, in 2015 the topic of Europewas not amongst the most prominent topics of abuse (em-ployment, business, economy, public health, etc), whereasin 2017 Brexit appears as a topic only for the conservativeparty.
Subjects attracting ire differ between parties, and maygive an indication of how the party (or its key personnel)are viewed. Employment has arisen in the top topics for theConservative party twice, but not Labour. Crime and polic-ing has arisen twice in top topics for the Labour party, butno other. It is striking that tweets about borders and immi-gration drew abusive responses for the Liberal Democrats in2017, but don’t appear in top topics for any other party ortime period, given that borders and immigration is a promi-nent topic in abusive tweets. Similarly, tweets about na-tional security drew more abusive replies proportionally forthe Liberal Democrats in 2017 than for the Conservatives,whilst national security doesn’t feature among top topics forLabour. The tone of Liberal Democrat tweeting regardingimmigration and terrorism was unambiguously left-wing,whereas Labour tended to focus on criticizing the Conser-vative Party whilst hedging about their own position.
How Abusive Words are Used
In this section we present some exploration into how wordsare used. We start with work on how women and men aredifferently addressed, before turning to trends in word use
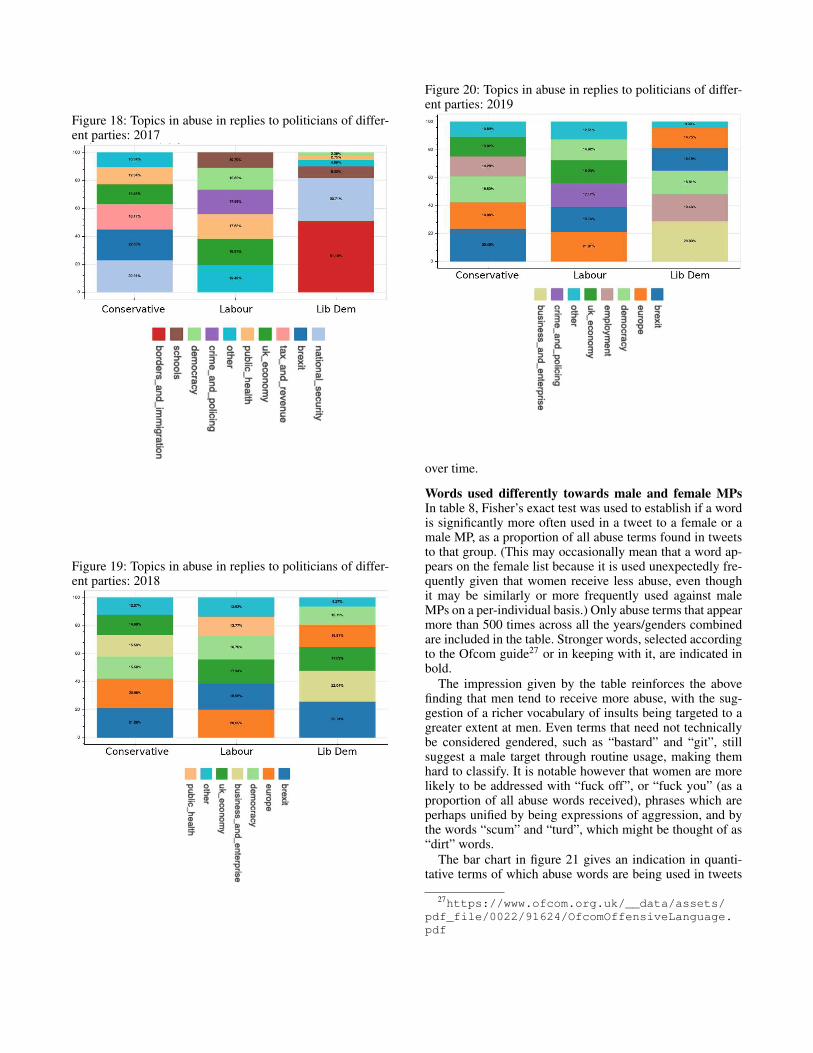
Figure 18: Topics in abuse in replies to politicians of differ-ent parties: 2017
Figure 19: Topics in abuse in replies to politicians of differ-ent parties: 2018
Figure 20: Topics in abuse in replies to politicians of differ-ent parties: 2019
over time.
Words used differently towards male and female MPsIn table 8, Fisher’s exact test was used to establish if a wordis significantly more often used in a tweet to a female or amale MP, as a proportion of all abuse terms found in tweetsto that group. (This may occasionally mean that a word ap-pears on the female list because it is used unexpectedly fre-quently given that women receive less abuse, even thoughit may be similarly or more frequently used against maleMPs on a per-individual basis.) Only abuse terms that appearmore than 500 times across all the years/genders combinedare included in the table. Stronger words, selected accordingto the Ofcom guide27 or in keeping with it, are indicated inbold.
The impression given by the table reinforces the abovefinding that men tend to receive more abuse, with the sug-gestion of a richer vocabulary of insults being targeted to agreater extent at men. Even terms that need not technicallybe considered gendered, such as “bastard” and “git”, stillsuggest a male target through routine usage, making themhard to classify. It is notable however that women are morelikely to be addressed with “fuck off”, or “fuck you” (as aproportion of all abuse words received), phrases which areperhaps unified by being expressions of aggression, and bythe words “scum” and “turd”, which might be thought of as“dirt” words.
The bar chart in figure 21 gives an indication in quanti-tative terms of which abuse words are being used in tweets
27https://www.ofcom.org.uk/__data/assets/
pdf_file/0022/91624/OfcomOffensiveLanguage.
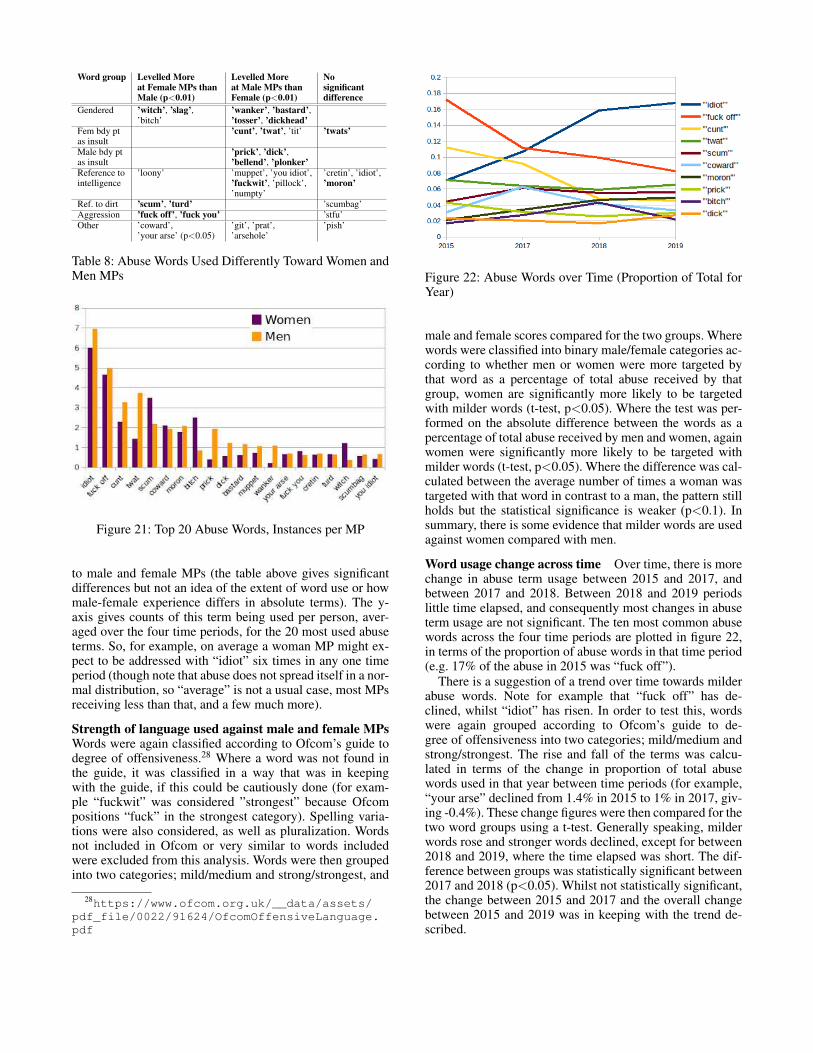
Word group Levelled More Levelled More Noat Female MPs than at Male MPs than significantMale (p<0.01) Female (p<0.01) difference
Gendered ’witch’, ’slag’, ’wanker’, ’bastard’,’bitch’ ’tosser’, ’dickhead’
Fem bdy pt ’cunt’, ’twat’, ’tit’ ’twats’as insult
Male bdy pt ’prick’, ’dick’,as insult ’bellend’, ’plonker’
Reference to ’loony’ ’muppet’, ’you idiot’, ’cretin’, ’idiot’,intelligence ’fuckwit’, ’pillock’, ’moron’
’numpty’
Ref. to dirt ’scum’, ’turd’ ’scumbag’
Aggression ’fuck off’, ’fuck you’ ’stfu’
Other ’coward’, ’git’, ’prat’, ’pish’’your arse’ (p<0.05) ’arsehole’
Table 8: Abuse Words Used Differently Toward Women andMen MPs
Figure 21: Top 20 Abuse Words, Instances per MP
to male and female MPs (the table above gives significantdifferences but not an idea of the extent of word use or howmale-female experience differs in absolute terms). The y-axis gives counts of this term being used per person, aver-aged over the four time periods, for the 20 most used abuseterms. So, for example, on average a woman MP might ex-pect to be addressed with “idiot” six times in any one timeperiod (though note that abuse does not spread itself in a nor-mal distribution, so “average” is not a usual case, most MPsreceiving less than that, and a few much more).
Strength of language used against male and female MPsWords were again classified according to Ofcom’s guide todegree of offensiveness.28 Where a word was not found inthe guide, it was classified in a way that was in keepingwith the guide, if this could be cautiously done (for exam-ple “fuckwit” was considered ”strongest” because Ofcompositions “fuck” in the strongest category). Spelling varia-tions were also considered, as well as pluralization. Wordsnot included in Ofcom or very similar to words includedwere excluded from this analysis. Words were then groupedinto two categories; mild/medium and strong/strongest, and
28https://www.ofcom.org.uk/__data/assets/
pdf_file/0022/91624/OfcomOffensiveLanguage.
Figure 22: Abuse Words over Time (Proportion of Total forYear)
male and female scores compared for the two groups. Wherewords were classified into binary male/female categories ac-cording to whether men or women were more targeted bythat word as a percentage of total abuse received by thatgroup, women are significantly more likely to be targetedwith milder words (t-test, p<0.05). Where the test was per-formed on the absolute difference between the words as apercentage of total abuse received by men and women, againwomen were significantly more likely to be targeted withmilder words (t-test, p<0.05). Where the difference was cal-culated between the average number of times a woman wastargeted with that word in contrast to a man, the pattern stillholds but the statistical significance is weaker (p<0.1). Insummary, there is some evidence that milder words are usedagainst women compared with men.
Word usage change across time Over time, there is morechange in abuse term usage between 2015 and 2017, andbetween 2017 and 2018. Between 2018 and 2019 periodslittle time elapsed, and consequently most changes in abuseterm usage are not significant. The ten most common abusewords across the four time periods are plotted in figure 22,in terms of the proportion of abuse words in that time period(e.g. 17% of the abuse in 2015 was “fuck off”).
There is a suggestion of a trend over time towards milderabuse words. Note for example that “fuck off” has de-clined, whilst “idiot” has risen. In order to test this, wordswere again grouped according to Ofcom’s guide to de-gree of offensiveness into two categories; mild/medium andstrong/strongest. The rise and fall of the terms was calcu-lated in terms of the change in proportion of total abusewords used in that year between time periods (for example,“your arse” declined from 1.4% in 2015 to 1% in 2017, giv-ing -0.4%). These change figures were then compared for thetwo word groups using a t-test. Generally speaking, milderwords rose and stronger words declined, except for between2018 and 2019, where the time elapsed was short. The dif-ference between groups was statistically significant between2017 and 2018 (p<0.05). Whilst not statistically significant,the change between 2015 and 2017 and the overall changebetween 2015 and 2019 was in keeping with the trend de-scribed.
It may be that awareness has increased and/or attitudeshave changed, or it may be that users hope to avoid sanctionsfrom Twitter, resulting in an increase in use of milder wordssuch as ”idiot” and a decrease in stronger words/phrasessuch as “fuck off” and “cunt”, as illustrated in the chartabove.
Discussion and Future WorkWe describe how abusive language was used in tweets toBritish MPs in four separate month-long time periods; pre-ceding general elections in 2015 and 2017, and around keydecision points in the negotiation of the United Kingdom’sexit from the European Union late 2018 and early 2019. Thedata show what politicians contend with in terms of abusiveattention on Twitter, and how variable this between individ-uals with different public roles and reputations.
We find that the topics that draw abuse evolve over theperiod studied. We see the appearance of “Brexit” as themain focus of attention both in abusive tweets and gener-ally, drawing attention from the previously strong focus ofpublic health (the NHS). Among abusive tweets, Brexit hascaptured attention previously focused to a greater extent onborders and immigration. In the wake of the referendum, na-tional security (terrorism) drew abusive attention in a waynot seen in any other period or in a non-abusive tweets.
The 2017 period preceded a general election uniquely fo-cused on Brexit, as Theresa May sought to strengthen her ne-gotiation position. In various ways, the focus of attention inthat time period differed from the others. The topic of Brexititself attracted unusually abusive attention, as did “commu-nity and society”, a topic that includes, most relevantly, re-ligious identities. After that period, the tone of conversationabout Brexit and about identity groups became civil. Recallthat there were two terrorist attacks attributed to ISIS in theUK in the month preceding the 2017 general election, whilstthe threat level from ISIS has dropped considerably since.
With regards to the relationship between demographiccharacteristics and abuse, much depends on individual char-acteristics such as an individual’s being outspoken on certaintopics. Being prominent per se doesn’t particularly attractabuse, but more prominent individuals will draw more atten-tion on Twitter, and therefore more abuse by volume. WhilstConservatives seem to attract more abuse, this effect is lostwhen prominence is factored out. However, female genderdoes seem to lead to less abuse by proportion in quantitativeterms. There is also some evidence that women are subjectedto less strong abuse. However, they were more likely to beaddressed using the “f” word and words suggesting dirt.
The finding regarding women receiving less abuse is inkeeping with findings across a more general population (Pew2014), though Pew find women in the 18-24 age range aredisproportionately targeted, whilst there are no women ofthat age range in our sample. The reader should also notethat words mean different things depending on who is ad-dressed, and quantitative findings do not address the fullcomplexity of society. Abuse might be received very differ-ently, for example, by a person who is more physically or so-cially vulnerable, or where it attacks a person’s right to taketheir place in the political arena. Furthermore our approach
lumps abuse together. It may be that a general tendency toaddress women somewhat more politely masks a sinister mi-nority of more unpleasant abuse. Most of the abuse in oursample arises from individuals expressing a strength of feel-ing about political matters, which isn’t personal. We don’tpresent data here about the specific demographics of per-sonal abuse, threats, bullying or persecution.
AcknowledgmentsThis work was partially supported by the European Union undergrant agreements No. 654024 SoBigData and No. 825297 WeVer-ify.
References[Bolukbasi et al. 2016] Bolukbasi, T.; Chang, K.-W.; Zou, J. Y.;
Saligrama, V.; and Kalai, A. T. 2016. Man is to computer program-mer as woman is to homemaker? debiasing word embeddings. InAdvances in neural information processing systems, 4349–4357.
[Bretschneider and Peters 2017] Bretschneider, U., and Peters, R.2017. Detecting offensive statements towards foreigners in socialmedia. In Proceedings of the 50th Hawaii International Confer-ence on System Sciences, 2213–2222.
[Burnap and Williams 2015] Burnap, P., and Williams, M. L. 2015.Cyber hate speech on twitter: An application of machine classifica-tion and statistical modeling for policy and decision making. Policy& Internet 7(2):223–242.
[Caliskan, Bryson, and Narayanan 2017] Caliskan, A.; Bryson,J. J.; and Narayanan, A. 2017. Semantics derived automaticallyfrom language corpora contain human-like biases. Science356(6334):183–186.
[Chemaly 2014] Chemaly, S. 2014. There’s no comparing male andfemale harassment online. http://time.com/3305466/
male-female-harassment-online/. Accessed: 2019-03-27.
[Chen et al. 2012] Chen, Y.; Zhou, Y.; Zhu, S.; and Xu, H. 2012.Detecting offensive language in social media to protect adolescentonline safety. In Privacy, Security, Risk and Trust (PASSAT), 2012International Conference on and 2012 International Confernece onSocial Computing (SocialCom), 71–80. IEEE.
[Cheng, Danescu-Niculescu-Mizil, and Leskovec 2015] Cheng, J.;Danescu-Niculescu-Mizil, C.; and Leskovec, J. 2015. Antisocialbehavior in online discussion communities. In ICWSM, 61–70.
[Coe, Kenski, and Rains 2014] Coe, K.; Kenski, K.; and Rains,S. A. 2014. Online and uncivil? patterns and determinants of inci-vility in newspaper website comments. Journal of Communication64(4):658–679.
[Colleoni, Rozza, and Arvidsson 2014] Colleoni, E.; Rozza, A.;and Arvidsson, A. 2014. Echo chamber or public sphere? pre-dicting political orientation and measuring political homophily intwitter using big data. Journal of Communication 64(2):317–332.
[Conover et al. 2011] Conover, M.; Ratkiewicz, J.; Francisco,M. R.; Goncalves, B.; Menczer, F.; and Flammini, A. 2011. Politi-cal polarization on twitter. ICWSM 133:89–96.
[Delisle et al. 2019] Delisle, L.; Kalaitzis, A.; Majewski, K.;de Berker, A.; Marin, M.; and Cornebise, J. 2019. A large-scale crowdsourced analysis of abuse against women journalistsand politicians on twitter. arXiv preprint arXiv:1902.03093.
[Dinakar et al. 2012] Dinakar, K.; Jones, B.; Havasi, C.; Lieberman,H.; and Picard, R. 2012. Common sense reasoning for detection,prevention, and mitigation of cyberbullying. ACM Transactions onInteractive Intelligent Systems (TiiS) 2(3):18.
[Dixon et al. 2018] Dixon, L.; Li, J.; Sorensen, J.; Thain, N.; andVasserman, L. 2018. Measuring and mitigating unintended bias intext classification. In Proceedings of the 2018 AAAI/ACM Confer-ence on AI, Ethics, and Society, 67–73. ACM.
[Elazar and Goldberg 2018] Elazar, Y., and Goldberg, Y. 2018. Ad-versarial removal of demographic attributes from text data. arXivpreprint arXiv:1808.06640.
[Fortuna and Nunes 2018] Fortuna, P., and Nunes, S. 2018. A sur-vey on automatic detection of hate speech in text. ACM ComputingSurveys (CSUR) 51(4):85.
[Gervais 2015] Gervais, B. T. 2015. Incivility online: Affective andbehavioral reactions to uncivil political posts in a web-based exper-iment. Journal of Information Technology & Politics 12(2):167–185.
[Gonen and Goldberg 2019] Gonen, H., and Goldberg, Y. 2019.Lipstick on a pig: Debiasing methods cover up systematic genderbiases in word embeddings but do not remove them. arXiv preprintarXiv:1903.03862.
[Gonzalez-Bailon, Banchs, and Kaltenbrunner 2010] Gonzalez-Bailon, S.; Banchs, R. E.; and Kaltenbrunner, A. 2010. Emotionalreactions and the pulse of public opinion: Measuring the impactof political events on the sentiment of online discussions. arXivpreprint arXiv:1009.4019.
[Gorrell et al. 2018] Gorrell, G.; Greenwood, M. A.; Roberts, I.;Maynard, D.; and Bontcheva, K. 2018. Twits, twats and twaddle:Trends in online abuse towards uk politicians. In Twelfth Interna-tional AAAI Conference on Web and Social Media.
[Hardt et al. 2016] Hardt, M.; Price, E.; Srebro, N.; et al. 2016.Equality of opportunity in supervised learning. In Advances in neu-ral information processing systems, 3315–3323.
[Hox and Bechger 2007] Hox, J. J., and Bechger, T. M. 2007. Anintroduction to structural equation modeling.
[Hwang et al. 2008] Hwang, H.; Borah, P.; Namkoong, K.; andVeenstra, A. 2008. Does civility matter in the blogosphere? ex-amining the interaction effects of incivility and disagreement oncitizen attitudes. In 58th Annual Conference of the InternationalCommunication Association, Montreal, QC, Canada.
[Kaczmirek et al. 2013] Kaczmirek, L.; Mayr, P.; Vatrapu, R.;Bleier, A.; Blumenberg, M.; Gummer, T.; Hussain, A.; Kinder-Kurlanda, K.; Manshaei, K.; Thamm, M.; et al. 2013. Social mediamonitoring of the campaigns for the 2013 german bundestag elec-tions on facebook and twitter. arXiv preprint arXiv:1312.4476.
[Kim 2014] Kim, Y. 2014. Convolutional neural networks for sen-tence classification. CoRR abs/1408.5882.
[Maynard et al. 2017] Maynard, D.; Roberts, I.; Greenwood, M. A.;Rout, D.; and Bontcheva, K. 2017. A framework for real-timesemantic social media analysis. Web Semantics: Science, Servicesand Agents on the World Wide Web 44:75–88.
[Munger 2017] Munger, K. 2017. Tweetment effects on thetweeted: Experimentally reducing racist harassment. Political Be-havior 39(3):629–649.
[Nobata et al. 2016] Nobata, C.; Tetreault, J.; Thomas, A.; Mehdad,Y.; and Chang, Y. 2016. Abusive language detection in online usercontent. In Proceedings of the 25th International Conference onWorld Wide Web, 145–153. International World Wide Web Confer-ences Steering Committee.
[Nulty et al. 2016] Nulty, P.; Theocharis, Y.; Popa, S. A.; arnet, O.;and Benoit, K. 2016. Social media and political communicationin the 2014 elections to the european parliament. Electoral studies44:429–444.
[Park, Shin, and Fung 2018] Park, J. H.; Shin, J.; and Fung, P. 2018.Reducing gender bias in abusive language detection. arXiv preprintarXiv:1808.07231.
[Pennington, Socher, and Manning 2014] Pennington, J.; Socher,R.; and Manning, C. D. 2014. Glove: Global vectors for wordrepresentation. In Empirical Methods in Natural Language Pro-cessing (EMNLP), 1532–1543.
[Perry and Olsson 2009] Perry, B., and Olsson, P. 2009. Cyberhate:the globalization of hate. Information & Communications Technol-ogy Law 18(2):185–199.
[Pew 2014] Pew. 2014. Online harrassment. https://www.
pewresearch.org/wp-content/uploads/sites/
9/2014/10/PI_OnlineHarassment_72815.pdf. Ac-cessed: 2019-03-27.
[Pleiss et al. 2017] Pleiss, G.; Raghavan, M.; Wu, F.; Kleinberg, J.;and Weinberger, K. Q. 2017. On fairness and calibration. In Ad-vances in Neural Information Processing Systems, 5680–5689.
[Rusel 2017] Rusel, J. T. 2017. Bringing civility back to internet-based political discourse on twitter research into the determinantsof uncivil behavior during online political discourse. Master’s the-sis, University of Twente.
[Schmidt and Wiegand 2017] Schmidt, A., and Wiegand, M. 2017.A survey on hate speech detection using natural language process-ing. In Proceedings of the Fifth International Workshop on NaturalLanguage Processing for Social Media. Association for Computa-tional Linguistics, Valencia, Spain, 1–10.
[Silva et al. 2016] Silva, L. A.; Mondal, M.; Correa, D.; Ben-evenuto, F.; and Weber, I. 2016. Analyzing the targets of hatein online social media. In ICWSM, 687–690.
[Stambolieva 2017] Stambolieva, E. 2017. Methodology: detect-ing online abuse against women mps on twitter. Technical report,Amnesty International.
[Theocharis et al. 2016] Theocharis, Y.; Barbera, P.; Fazekas, Z.;Popa, S. A.; and Parnet, O. 2016. A bad workman blameshis tweets: the consequences of citizens’ uncivil twitter use wheninteracting with party candidates. Journal of communication66(6):1007–1031.
[Vargo and Hopp 2017] Vargo, C. J., and Hopp, T. 2017. Socioeco-nomic status, social capital, and partisan polarity as predictors ofpolitical incivility on twitter: A congressional district-level analy-sis. Social Science Computer Review 35(1):10–32.
[Ward, Mcloughlin, and others 2017] Ward, S.; Mcloughlin, L.;et al. 2017. Turds, traitors and tossers: the abuse of uk mps viatwitter. ECPR Joint Sessions 2017.
[Waseem and Hovy 2016] Waseem, Z., and Hovy, D. 2016. Hate-ful symbols or hateful people? predictive features for hate speechdetection on twitter. In SRW@ HLT-NAACL, 88–93.
[Weber, Garimella, and Borra 2012] Weber, I.; Garimella, V. R. K.;and Borra, E. 2012. Mining web query logs to analyze politicalissues. In Proceedings of the 4th Annual ACM Web Science Con-ference, 330–334. ACM.
[Williams and Burnap 2015] Williams, M. L., and Burnap, P. 2015.Cyberhate on social media in the aftermath of woolwich: A casestudy in computational criminology and big data. British Journalof Criminology 56(2):211–238.
[Wulczyn, Thain, and Dixon 2017] Wulczyn, E.; Thain, N.; andDixon, L. 2017. Ex machina: Personal attacks seen at scale. In Pro-ceedings of the 26th International Conference on World Wide Web,1391–1399. International World Wide Web Conferences SteeringCommittee.
[Zhao et al. 2018] Zhao, J.; Wang, T.; Yatskar, M.; Ordonez, V.; andChang, K.-W. 2018. Gender bias in coreference resolution: Evalu-ation and debiasing methods. arXiv preprint arXiv:1804.06876.