Embed Size (px)
Citation preview

Received 22 February 2014
Accepted 5 May 2015
Online Anomaly Detection Based on Support Vector Clustering
Mohammad Amin AdibiFaculty of Industrial Engineering and Management Systems, Amirkabir University of Technology (Tehran
Polytechnic), 424 Hafez Ave., Tehran, Postal Code: 1591634311, IranE-mail: [email protected]
Jamal Shahrabi†
Faculty of Industrial Engineering and Management Systems, Amirkabir University of Technology (Tehran Polytechnic), 424 Hafez Ave., Tehran, Postal Code: 1591634311, Iran
E-mail: [email protected], Tel: +9821-66466497www.aut.ac.ir
Abstract
A two-phase online anomaly detection method based on support vector clustering (SVC) in the presence of non-stationary data is developed in this paper which permits arbitrary-shaped data clusters to be precisely treated. In the first step, offline learning is performed to achieve an appropriate detection model. Then the current model dynamically evolves to match the rapidly changing real-world data. To reduce the dimension of the quadratic programming (QP) problem emerging in the SVC, self-organizing map (SOM) and areplacement mechanism are used to summarize the incoming data. Thus, the proposed method can be efficiently and effectively useable in real time applications. The performance of the proposed method is evaluated by a simulated dataset, three subsets extracted from the KDD Cup 99 dataset, and the keystroke dynamics dataset. Results illustrate capabilities of the proposed method in detection of new attacks as well as normal pattern changes over the time.
Keywords: Online anomaly detection; support vector clustering; self-organizing map; quadratic programming.
† Corresponding author
International Journal of Computational Intelligence Systems, Vol. 8, No. 4 (2015) 735-746
Co-published by Atlantis Press and Taylor & FrancisCopyright: the authors
735

M. A. Adibi, J. Shahrabi
1. Introduction
Today a vast quantity of information exchange is performed through computer networks and an increasing need exists for early prevention against emerging network threats by intrusion detection systems (IDS).1 An IDS is a security tool that monitors all activity on a network and detects any attempts which may destroy confidentiality, integrity or availability of computer networks or systems.2,3 To have an efficient and effective IDS, patterns of previously observed activity are usually analyzed to determine normal traffic or attack specifications. Such specifications can be used in newly observed patterns for intrusion detection.Rule-based detection, commonly known as misusedetection, and anomaly detection systems are two classes of IDSs.4 A rule-based detection system usesrules which are formed by analyzing previousdifferent intrusion events to detect known attacks.Although it provides good results in detecting occurrences of previously known attacks, there is avery low chance to detect new attack types and variants of the known attacks. In the recent case, the rules should be manually modified for future use.Anomaly detection is based on the assumption that abnormal behavior differs from a previously learned normal behavior. Accordingly, machine learning approaches have been widely used in network anomaly detection.5-9 Depending on which machine learning approach is used, anomaly detection can be performed supervised or unsupervised. Supervised anomaly detection10 makes a model of normal data using labeled data and detects deviation from the normal model in observed data. The drawback of this type of system is that finding proper labeled data is almost difficult.In unsupervised anomaly detection which uses easy-to-obtain unlabeled data, it is assumed that the number of normal data is much more than abnormal data. In this type of anomaly detection, the aim is to detect instances which do not confirm the normal model as attack. Clustering as an unsupervised technique is usually used in this case.Evolution of intrusion detection systems from 1987 in which Denning proposed an intrusion-detection model11 to recent years is investigated by Aburomman and Ibne Reaz.12 They have reviewed
information relative to classifier designs, employed datasets, feature selection, clustering techniques, baseline classifiers and main researches oncomparisons, dataset validation, accuracy detection measures, and other test configurations.However, a serious challenge which classical anomaly detection systems are facing is the changes of normal data and emerging new types of attacks. In recent years, online anomaly detection systems are introduced to overcome this problem. In the case of using unsupervised learning techniques, online anomaly detection systems utilize ideas of online clustering13 and streaming data clustering14
simultaneously.
1.1. Previous works
An adaptive and dynamic clustering framework was developed in Ref. 1 for online anomaly detection. In this proposed framework, an initial model is constructed using the K-means clustering method and then it gradually evolves according to the current state of online data. However, the K-means algorithm may terminate in a locally optimal and the number of clusters (K) must be supplied by the user which is a restrictive fact working in non-stationary state in real-world applications. In Ref. 3 a genetic-X-means clustering algorithm (GXCA) which is ahybridization of genetic algorithm (GA) and the iterative optimal X-means algorithm was presented.This approach can lead to an increase in detection performance by reducing the risk of local optimality.An adaptive growing hierarchical self-organizing map (A-GHSOM) approach for network intrusion detection was proposed in Ref. 15. In fact, A-GHSOM is an expansion of the growing hierarchical self-organizing map (GHSOM) formerly proposed in Ref. 16 based on self-organizing map (SOM). It is notable that K-means and SOM are recommended for data with spherical cluster shapes.17, 18 So, in cases where there are nonspherical clusters, performance can drop down. An online oversampling principal component analysis algorithm to address anomaly detection in a large amount of data via an online updating technique based on oversampling the target instance and extracting the principal direction of the data was proposed in Ref. 19. However, this method cannot handle the multi-clustering structure and high dimensional data. In Ref. 20, a framework of
Co-published by Atlantis Press and Taylor & FrancisCopyright: the authors
736

Online AD based on SVC
autonomic intrusion detection that fulfills online and adaptive intrusion detection over unlabeled HTTP traffic streams in computer networks was introduced. The framework employed the affinity propagation (AP) algorithm to learn a subject’s behaviors throughdynamical clustering of the streaming data. However, in this method, it has been assumed that normal and attack data are in spherical cluster shape.
1.2. Paper contributions
To address previously mentioned shortages of the current unsupervised online anomaly detection systems, a new method is proposed for online anomaly detection based on support vector clustering21 (SVC) which can be used efficiently when no special assumption about shape and densityof data region is guaranteed. SVC can handle arbitrary-shaped clusters through its boundary-based clustering model. So, the proposed anomaly detection method makes it possible to be more precise. SVChas the ability to deal with high-dimensional data by employing a kernel function. Therefore, the proposed method, which uses SVC as the core clustering technique, can be used when high-dimensional data survey is needed for anomaly detection.In the proposed method, clustering structure can be modified over the time to be consistent with the non-stationary environment through repeating SVC at some appropriate time sections. A data summarization tool based on SOM is proposed to reduce required computational time and effect of outlier data. Also, an autonomous replacement mechanism controls combination and amount of data which are used for clustering by SVC over the time. Using the proposed data summarization tool and the replacement mechanism causes to store relatively small amounts of the observed data over the time.
The performance of the proposed method is evaluated through experiments using datasets including asimulated dataset, the KDD Cup 99 dataset, and the keystroke dynamics dataset. Tow recently published online anomaly detection methods in Ref. 1 and Ref. 15 are also used as the benchmarks.
1.3. Paper organization
The rest of the paper is organized as follows: Section 2 explains the proposed framework in details.Evaluations using three datasets are performed in Section 3 followed by the discussion in Section 4.The conclusion is made in Section 5.
2. Proposed framework
In this section, the framework of the proposed online anomaly detection method is explained at first and then each part is discussed in details. This framework encompasses all procedures which are used in this paper for online anomaly detection.
2.1. Overall framework
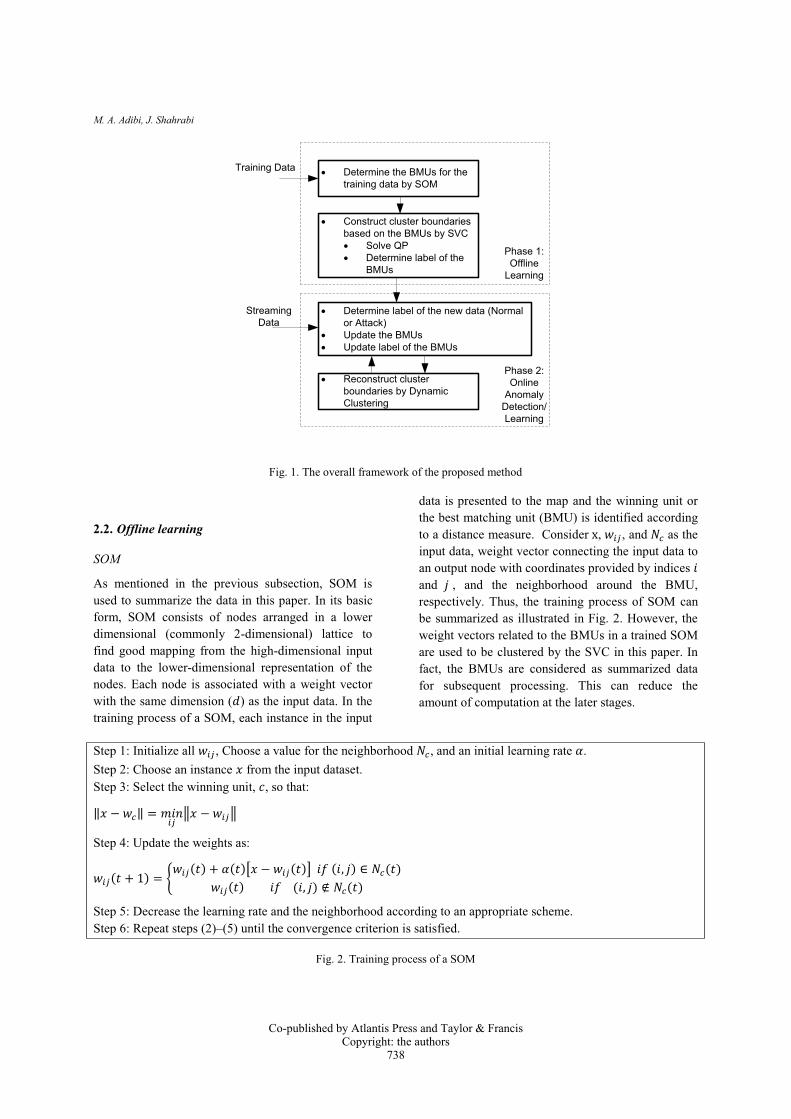
As illustrated in Fig. 1, the proposed anomaly detection method in this paper consists of two phases. In the first phase, a training dataset is initially summarized by SOM. Then the summarized data is fed to the SVC to construct normal and attack cluster boundaries. In this paper, it is assumed that attack instances are a very small part of all the data. Thisassumption makes it possible to identify clusters of normal and attack data. In the second phase, theboundaries are used to determine the label of the data that will stream to the system. In addition, reconstruction of the cluster boundaries is done whena tangible deviation from the current state takes place.
Co-published by Atlantis Press and Taylor & FrancisCopyright: the authors
737
M. A. Adibi, J. Shahrabi
Determine the BMUs for the training data by SOM
Construct cluster boundaries based on the BMUs by SVC
Solve QPDetermine label of the BMUs
Phase 1:Offline
Learning
Training Data
Determine label of the new data (Normalor Attack)Update the BMUsUpdate label of the BMUs
Reconstruct cluster boundaries by Dynamic Clustering
Phase 2:Online
AnomalyDetection/Learning
StreamingData
Fig. 1. The overall framework of the proposed method
2.2. Offline learning
SOM
As mentioned in the previous subsection, SOM is used to summarize the data in this paper. In its basic form, SOM consists of nodes arranged in a lower dimensional (commonly 2-dimensional) lattice to find good mapping from the high-dimensional input data to the lower-dimensional representation of thenodes. Each node is associated with a weight vector with the same dimension ( ) as the input data. In thetraining process of a SOM, each instance in the input
data is presented to the map and the winning unit or the best matching unit (BMU) is identified according to a distance measure. Consider x, , and as the input data, weight vector connecting the input data to an output node with coordinates provided by indices and , and the neighborhood around the BMU,respectively. Thus, the training process of SOM can be summarized as illustrated in Fig. 2. However, theweight vectors related to the BMUs in a trained SOM are used to be clustered by the SVC in this paper. In fact, the BMUs are considered as summarized datafor subsequent processing. This can reduce the amount of computation at the later stages.
Step 1: Initialize all , Choose a value for the neighborhood , and an initial learning rate .Step 2: Choose an instance from the input dataset.Step 3: Select the winning unit, , so that:
=
Step 4: Update the weights as:
( + 1) =( ) + ( ) ( ) ( , ) ( )
( ) ( , ) ( )
Step 5: Decrease the learning rate and the neighborhood according to an appropriate scheme.Step 6: Repeat steps (2)–(5) until the convergence criterion is satisfied.
Fig. 2. Training process of a SOM
Co-published by Atlantis Press and Taylor & FrancisCopyright: the authors
738
Online AD based on SVC
SVC
Consider the dataset = { , , … , } , .The optimization piece of SVC tries to find a minimum hypersphere containing data in a new and usually higher dimensional space, namely feature space. The optimization problem is expressed as follows:
, ,+
Subject to:( ) +
0. (1)
Therein is the non-linear map from the input space to the feature space, is the slack variable to incorporate soft constraints, is the hypersphere center, is the hypersphere radius, and the penalty parameter. The Wolfe dual for the problem in Eq. (1) is as Eq. (2).22
< ( ), ( ) >
< ( ), ( ) >
Subject to:
0
= 1. (2)
With the kernel trick, , =< ( ), ( ) >,and using Gaussian kernel as , =
( ) in which is the scale parameter, the recent optimization problem converts to optimization problem indicated in Eq. (3). Thisoptimization problem can be solved by a range of methods.23
( , ) ( , )
Subject to:
0
= 1. (3)
It is proven that in the quadratic programming presented by Eq. (3), the image of point with 0 < < lies on the surface of the feature space hypersphere. Such a point will be referred to as a support vector or SV. SVs lie on cluster boundaries.
Points with = 0 are mapped to the inside of the feature space hypersphere and with = , they lie outside the feature space hypersphere.22 The value of the other variable , radius of the hypersphere, can be calculated by Eq. (4) for an arbitrary SV.
( ) = ( ) = ( , )
2 ( , ) + ( , ). (4)
The basic approach of the labeling piece in SVC is to identify clusters by computing a complete graph and taking connected components of the graph as clusterswhich is well-known as a complete graph (CG)method. The CG is represented by an adjacent matrix, , which is formulated based on anobservation that given a pair of data points thatbelong to different clusters, any path that connects them must exit from the hypersphere. Thus, that pathcontains a segment of points such that ( ) > .So, the adjacency matrix can be formed by Eq. (5).
=1 , , ( )
0 . (5)
Checking the line segment is implemented by sampling a number of points. Since such a procedure is time consuming, in a modified method, the CG is formed only for SVs, namely the support vector graph (SVG) method21 which is used in this paper. The other points are labeled according to their nearest SV.
2.3. Online anomaly detection and learning
As illustrated in Fig. 3, which is a detailed form of Fig. 1, in the first phase, namely offline learning, two sets are formed. Set contains BMUs which come from the SOM. The second set, , includes those of newly observed data which stand out of the current normal and attack data clusters. is empty at the beginning.Online anomaly detection and learning to track the changes in real-world data are performed as the new observed data stream to the system. The distance of a new datum and the members of which are shown by ( = 1,2, … , ) is calculated. If the minimum distance is less than a predefined parameter, , is labeled similar to the closest .
Co-published by Atlantis Press and Taylor & FrancisCopyright: the authors
739

M. A. Adibi, J. Shahrabi
Otherwise, is labeled similar to the nearest and at the same time, is added to . In the recent case, the distance between the new datum and the nearest
is added to a cumulatively storing variable .When reaches a predefined threshold, , all vectors in are fed to the SOM. In this situation, will be flushed and the BMU with the biggest number of the attracted vector, , is added to .To fix the number of at a constant value, the member of which has the oldest data absorption, , is put out. Now the coefficient matrix of the problem indicated in Eq. (3) is changed and a new solution which forms the new normal and attack data clusters will beobtained by solving the new QP problem. These cluster boundaries are considered as the basis todetermine label of the new data until the next modification.
2.4. Example
An example of the overall process of the proposed method is presented in Fig. 4. In fact, this example clearly shows the steps of the proposed methods for a typical dataset. As illustrated in this figure, initial data are summarized by SOM and are fed to SVC to determine initial normal and attack data cluster boundaries or model. This model will be used until sufficient evidence is found for the next update. After summarizing the data that don’t confirm the current models, a new set of the BMUs is formed using replacement mechanism. These BMUs are used to update models by SVC. This process will continue as long as the data flow continues.
Initial unlabeled data set
Identify BMUs by SOM
Perform SVC on the BMUs
Form set Sb
containing nb BMUsand set Sn={}
new datum, y
No
YesMini{ ||y-yb
i||}< 1
Label y as same as the
closest yb
Dcum=0
Label y as same as the closest yb, add y to Sn, and
Dcum=Dcum+Mini{ ||y-ybi||}
No
Dcum> 2 Dcum=0Yes Perform SOM on Sn and identify the
BMU with the most attracted data, yin
,and yout Sb with the oldest absorption
Update Sb by replacing yout
with yin , and Sn={}
Perform SVC on Sb andupdate cluster
boundaries
Offline Learning
Online Anomaly Detection / Learning
NoKeepcurrentborders
Fig. 3. Process of the proposed online anomaly detection and learning method
Co-published by Atlantis Press and Taylor & FrancisCopyright: the authors
740

Online AD based on SVC
Replacementmechanism
SVC
Labeling
SOMSVC
Labeling
SOM
Initial dataBMUs in form of Sb
Initial SVs & clusterboundaries
Streamingdata
Data which confirm the current boundaries
Data in Sn
Current Sb
New Sb
New SVs &cluster
boundaries
Data which don’t confirm the current boundaries
Check data by the current model
The removed BMU
The added BMU
Modelreplacement
Normal & attackdata cluster boundaries
Offline Learning
Online Anomaly Detection / Learning
BMUs of Sn
Fig. 4. An example of the overall process of the proposed method
3. Experiments
Three datasets are exploited in this section to demonstrate the effectiveness of the proposed online anomaly detection method. Following Ref. 24, asimulated dataset is firstly generated which can give reader an idea about typical environment which the proposed method is designated for it. The KDD Cup99 intrusion detection dataset is then adopted to produce three subsets to be used in evaluation process. The third one is a keystroke dynamics dataset which is introduced in Ref. 25. The following two standard measures are also selected for evaluating the proposed method26:
Detection rate (DR): ratio between the number of correctly detected anomalies and the total number of anomalies.False positive rate (FPR): ratio between the number of data records from the normal class
that are misclassified as anomalies and the total number of data records from the normal class.
All computations are performed on a computer with intel core i5 CPU 2.53 GHz processor and in MATLAB® 7.1 programming language. YALMIP modeling and optimization toolbox in MATLAB® is also used to solve the QP problems during simulation process to obtain the solution.
3.1. Simulated dataset
To simulate a non-stationary environment in which normal data pattern changes over the time and new attack data emerges while there is no related historical detected pattern, Eq. (6) to Eq. (9) are used. Eq. (6) and (7) are used to create normal data in 5 close time sections. By means of Eq. (6), 2000 data instances are created in 200 steps. At a step , 10 random data is created. Then all 2000 data are randomly mixed to eliminate sequential nature which exists in. As presented in Fig. 5(a), this procedure
Co-published by Atlantis Press and Taylor & FrancisCopyright: the authors
741

M. A. Adibi, J. Shahrabi
yields a nonspherical shape and data density is also different over data region. A relatively smaller cluster is created by Eq. (8) as an attack data cluster which encloses 200 data instances. The last 200 attack data are mixed by 2000 normal data to form initial datasetapplicable in offline learning. To generate normal data to be used in online anomaly detection and learning, Eq. (7) is used at =
1,2,3, 4. For each value of , 500 data instances are generated in 50 steps. These data are appended according to . This procedure leads to changing pattern for normal data as illustrated in Fig. 5(b). Anew attack cluster is also created using Eq. (9). Members of such cluster are mixed by the new normal data and gradually streams to the anomaly detection system.
[ _ ( )] =2 cos ( ) + 6
3 sin ( ) + 2.6× 1
+ ( ), = 1,2, … ,200.(6)
[ _ ( )]
=
2 cos ( ) + 6
3 sin ( ) + 2.6 +4 ×
× 1
+ ( ),= 1,2, … ,50
= 1,2,3,4.
(7)
[ _ ( )] =1.5 cos ( ) + 4.7
1.5 sin ( ) + 4.3
+ ( ), = 1,2, … ,200.(8)
[ _ ( )] =1.5 cos ( ) + 4.7
1.5 sin ( ) + 5.3
+ ( ), = 1,2, … ,200.(9)
In Eq. (6) to (9), ( ) is a random matrix of vectors in 2D space generated at each step using MATLAB® function mvnrnd. The dispersal ( ) of the random matrix ( ) and the arguments
( ) and ( ) change at each step according to:
( ) = ( 1) +1
. (10)
( ) = ( 1) +1
. (11)
The parameters of Eq. (10) and Eq. (11) are set as S = 0.01 , S = 0.0125 , , = 6 , , =
0, , = 4, and , = 4.Values of DR and FPR are calculated for the proposed anomaly detection system using the simulated dataset. The dataset is also introduced to two benchmark methods. The first benchmark method from Ref. 1, HSK, employs a hybrid of SOM and K-means algorithm in its online anomaly detection method. In this method, the K-meanstechnique (with = 2 ) is used when necessity of modifying current cluster centers or deriving a new attack cluster from a normal cluster is specified for instances introduced by a SOM. The second benchmark method is adaptive growing hierarchical self organizing map (A-GHSOM) proposed in Ref. 15. Please note that only those functions of A-GHSOM are considered which are not dependent to human intervention. Mean and standard deviation (SD) of DR, FPR for 10 runs and average time needed to specify cluster of a new observed data instance (AT) are given in Table 1. The results show that the proposed method can yield acceptable metrics in the challenging simulated environment when data clusters are nonspherical. It is notable that stable performance of the proposed method is of being on optimum solution over clustering procedure using SVC.
Co-published by Atlantis Press and Taylor & FrancisCopyright: the authors
742

Online AD based on SVC
(a) (b)
Fig. 5. Initial dataset and changes which take place over the time, (a) Initial dataset generated by Eq. (6) & (8) including normal data at time = 0 and data related to Attack 1, (b) Normal data at time = 0 and = 4, a new attack (Attack 2) is appeared
later over the time.
Table 1. Results of using the proposed method for simulated dataset, = 2, = 1 , = 0.2, = 5, , = 30, SOM lattice structure: 10 × 10 for offline learning and 2 × 2 for online learning, and = 0.2.
Dataset HSK A-GHSOM Proposed method
DR FPRAT (s) DR FPR
AT (s) DR FPR
AT (s)
Simulated dataset
Mean SD Mean SD Mean SD Mean SD Mean SD Mean SD0.30 0.12 0.24 0.10 0.001 0.63 0.00 0.00 0.00 0.001 0.72 0.00 0.19 0.00 0.004
3.2. The KDD Cup 99 dataset
The KDD Cup 99 dataset has been the most wildly used dataset for the evaluation of anomaly detection methods27 and is built based on the data captured in DARPA’98 IDS evaluation program managed by the MIT Lincoln Labs. The KDD Cup 99 dataset consists of 4,940,000 single connection vectors each of which contains 41 features and is labeled as either normal or one of the 24 attack types. The attack types fall in one of the following categories: denial of service (DoS), remote to user (R2L), user to root (U2R) and probing. Although the label of the KDD Cup 99 is known for all data instances, in this paper it is assumed that it is unknown and is used only for evaluation of the proposed method.
In this subsection, three subsets , , and have been selected from the KDD Cup 99. Each subsetconsisted of 20000 data and contained mutually exclusive attacks which were a small portion of the subsets (approximately 1%). To conduct the experiment, one dataset was used in offline training and then all of the three subsets were applied as online data for testing the system. The number and type of attacks which were mixed with normal data in each subset are presented in Table 2.The subsets have been fed to the benchmark methodstoo. The results are located in Table 3 whichillustrates performance of the proposed method in presence of previously unseen data. To emphasize the effectiveness of the proposed method, the subsets which have been used to test the system are processed by both the offline trained model and the model with online learning.
4 4.5 5 5.5 6 6.5 7 7.5 83
3.5
4
4.5
5
5.5
6
Data of Attack 1
Initial Normal Data
4 4.5 5 5.5 6 6.5 7 7.5 83
3.5
4
4.5
5
5.5
6
6.5
7
Initial Normal Data
Normal Data at T=4
Data of Attack 2
Data of Attack 1
Co-published by Atlantis Press and Taylor & FrancisCopyright: the authors
743

M. A. Adibi, J. Shahrabi
3.3. The keystroke dynamics dataset
In its basic form, the keystroke dynamics dataset consists of 20400 data which are arranged as a table with 34 columns. Each row of data corresponds to the timing information for a single repetition of the password by a single subject (or a typist). There are totally 51 subject identified by a unique code from s002 to s057. For each subject, 400 records are presented. 31 features of a record contain timing information for one password typing by a subject.These data can be considered as a digital fingerprint to distinguish people by their typing rhythms.However, in this paper, two subsets are produced
form the keystroke dynamics dataset. The first one contains of 400 records related to s002 as normal data and 40 records randomly selected from typing information of s011 as attack data. This subset is considered as initial data in offline training. The second subset contains of 400 records related to s007 as normal data and 40 records randomly selected from typing information of s004 as a new attack data.It’s notable that the records of s007 are relatively close to records of s002 and are considered as a drifted form of the initial data. The subsets have been fed to the proposed and the benchmark methods. The results are located in Table 4.
Table 2. Type and number of the attacks mixed with normal data to build the subsets
Subset Subset Subset Attack
categoryAttack
typeNumber of data
Attack category Attack type Number
of dataAttack
category Attack type Number of data
DoS
smurf 85
R2L+U2R
ftp_write 8
Probing
ipsweep 62
Back 15 guess_passwd 53 nmap 21neptune 75 Phf 4 portsweep 61
Land 21 Imap 12 satan 61teardrop 25 multihop 7
Pod 10 spy 2warezclient 85warezmaster 20
buffer_overflow 30loadmodule 9
perl 3rootkit 10
Total 231 243 205
Table 3. Results of using the proposed method for the KDD Cup 99 dataset, = 0.01, = 1 , = 1, = 10, = 10, SOM:lattice structure: 10 × 15 for offline learning and 3 × 3 for online learning, and = 0.2.
Test No.
TrainingSet
TestingSet
HSK A-GHSOM Proposed methodOffline Online Offline Online Offline Online
DR FPR DR FPR DR FPR DR FPR DR FPR DR FPR1 0.94 0.32 0.91 0.26 0.68 0.01 0.76 0.01 0.92 0.17 0.93 0.112 0.98 0.32 0.98 0.32 0.20 0.00 0.42 0.02 0.38 0.17 0.94 0.083 1.00 0.32 0.95 0.19 0.27 0.01 0.31 0.01 0.74 0.17 0.94 0.034 0.94 0.28 0.94 0.20 0.76 0.03 0.70 0.02 0.93 0.21 0.91 0.135 0.38 0.28 0.46 0.13 0.75 0.01 0.73 0.01 0.98 0.21 0.97 0.056 1.00 0.28 0.99 0.16 0.57 0.04 0.62 0.02 0.83 0.21 0.96 0.077 0.94 0.23 0.82 0.18 0.48 0.05 0.74 0.02 0.34 0.06 0.93 0.108 0.38 0.23 0.77 0.17 0.18 0.00 0.57 0.01 0.38 0.17 0.97 0.169 1.00 0.22 0.96 0.12 0.54 .01 0.73 0.03 1.00 0.17 1.00 0.19
Mean 0.84 0.28 0.87 0.19 0.49 0.017 0.62 0.016 0.72 0.17 0.95 0.10AT(s) 0.00025 0.0012 0.00035
Co-published by Atlantis Press and Taylor & FrancisCopyright: the authors
744

Online AD based on SVC
Table 4. Results of using the proposed method for keystroke dynamics dataset, = 0.01, = 1 , = 0.5, = 10, , = 15
,the SOM lattice structure: 10 × 10 for offline learning and 2 × 2 for online learning, and = 0.3.
Dataset HSK A-GHSOM Proposed method
DR FPR AT (s) DR FPR AT
(s) DR FPR AT (s)
KeystrokeMean SD Mean SD Mean SD Mean SD Mean SD Mean SD0.82 0.08 0.42 0.04 0.001 0.32 0.00 0.04 0.00 0.001 0.87 0.02 0.18 0.01 0.019
4. Discussion
According to growing threats for computer networks, designing an anomaly detection system which can detect abnormal behavior in the presence of unlabeled data, arbitrary shaped data clusters, and previously unseen attacks is desirable. On the other hand, in real time applications, automatically quick response to the changing environment is necessary. The proposed online anomaly detection method overcomes these challenges by using support vector clustering which is an unsupervised learning approach to clustering arbitrary-shaped data for situation in which distribution of data is unknown. Anew framework is also proposed in this paper to control optimization problem dimension in order to achieve ability of real time response to new streamer data. Dynamically reconstructing cluster boundaries,which are proposed in this article, conveniently meet the emerging needs of rapidly changing real-world data. The proposed framework ensures that computational time is mainly dependent on the SOM lattice dimension. It is because only a constant number of BMUs is used over the time which is at most equal to the offline learning SOM lattice dimension. Furthermore, using kernel function in SVC makes the proposed model capable to handle high dimensional data. In fact, dimension of QP problem in Eq. (3) only depends on the number of data which are considered to be clustered (number of BMUs). In this framework, beside online anomaly detection, only information of a constant number of BMUs and those data existing in is stored. So, there is no need to store incoming data.
5. Conclusions
In this paper, a new two-phase method based on support vector clustering is proposed for online
anomaly detection. In the first phase, offline learning is performed to identify normal and attack clusters based on unlabeled data. To reduce the dimension of the clustering problem and computational time in SVC, the initial and streaming data are summarized by SOM. To adjust the generated model in the first phase to the new observations, dynamic clustering is used for reconstruction of cluster boundaries in case of necessity. YALMIP modeling and optimization solver in MATLAB® used to solve the emerging QPproblem. The performance of the proposed method was evaluated through experiments using achallenging simulated dataset, three subsets of the KDD Cup 99 dataset, and two subset of keystroke dynamics dataset. The results illustrate higher performance of the proposed online method in comparison to the benchmark methods based on HSK and A-GHSOM considering DR and FPR measures while response time is still acceptable. Specifically, experiments showed that the proposed method can detect anomalous cases more precisely in comparison with competing techniques when groups of data are not in spherical shape as well as dimension of data is considerably high. FPR for the proposed method wasalso better than of HSK but A_GHSOM showed better performance in this measure. However, results in tables 1, 3, and 4 illustrated that DR for A-GHSOM decreased significantly when dimension of data increased. Nevertheless, the proposed method has a stable performance.
References
1. S. Lee, G. Kim, and S. Kim, Self-adaptive anddynamic clustering for online anomaly detection, Expert Syst. Appl. 38(12) (2011) 14891-14898.
2. N. Sengupta, J. Sen, J. Sil, and M. Saha, Designing of on line intrusion detection system using rough set theory and Q-learning algorithm, Neurocomputing 111(2013) 161-168.
3. S. S. Sivatha Sindhu and A. Kannan, Evolving Clusters for Network Intrusion Detection System Using Genetic-X-Means Algorithm, Information
Co-published by Atlantis Press and Taylor & FrancisCopyright: the authors
745

M. A. Adibi, J. Shahrabi
Security Journal: A Global Perspective 19(4) (2010) 204-212.
4. O. Depren, M. Topallar, E. Anarim, and M. K. Ciliz, An intelligent intrusion detection system (IDS) for anomaly and misuse detection in computer networks, Expert Syst. Appl. 29(4) (2005) 713-722.
5. U. Fiore, F. Palmieri, A. Castiglione, and A. De Santis, Network anomaly detection with the restricted Boltzmann machine, Neurocomputing 122 (2013) 13-23.
6. P. Garcia-Teodoro, J. Diaz-Verdejo, G. Maciá-Fernández, and E. Vázquez, Anomaly-based network intrusion detection: Techniques, systems and challenges, Comput. Secur. 28(1) (2009) 18-28.
7. M. Hejazi and Y. P. Singh, One-Class Support Vector Machines Approach To Anomaly Detection, Appl. Artif. Intell. 27(5) (2013) 351-366.
8. A. Patcha and J. M. Park, An overview of anomaly detection techniques: Existing solutions and latest technological trends, Comput. Netw. 51(12) (2007) 3448-3470.
9. S. Shamshirband, A. Amini, N. B. Anuar, M. L. M. Kiah, Y. W. Teh, and S. Furnell,. D-FICCA: A density-based fuzzy imperialist competitive clustering algorithm for intrusion detection in wireless sensor networks, Measurement 55 (2014) 212-226.
10. D. Li, S. Liu, and H. Zhang, A negative selection algorithm with online adaptive learning under small samples for anomaly detection, Neurocomputing 149(2015) 515-525.
11. D. E. Denning, An intrusion-detection model,Software Engineering, IEEE Transactions on 2(1987), pp. 222-232.
12. A. A. Aburomman and M. Bin Ibne Reaz, Evolution of Intrusion Detection Systems Based on Machine Learning Methods, Australian Journal of Basic and Applied Sciences 7(7) (2013) 799-813.
13. S. Aghabozorgi, M. R. Saybani, and T. Y. Wah, Incremental clustering of time-series by fuzzy clustering, J. Inf. Sci. Eng. 28(4) (2012) 671-688.
14. A. Amini, T. Y. Wah, and H. Saboohi, On density-based data streams clustering algorithms: A survey, J. Comput. Sci. Tech. 29(1) (2014) 116-141.
15. D. Ippoliti and X. Zhou, A-GHSOM: An adaptive growing hierarchical self organizing map for network anomaly detection, J. Parallel Distrib. Comput. 72(2012) 1576–1590.
16. M. Dittenbach, D. Merkl, and A. Rauber, The growing hierarchical self-organizing map, in Neural Networks, IEEE-INNS-ENNS International Joint Conference on (6), IEEE Computer Society (2000), pp. 6015-6015.
17. M. Z. U. Rehman, T. Li, Y. Yang, and H. Wang, Hyper-ellipsoidal clustering technique for evolving data stream, Knowl-Based Syst. 70 (2014) 3-14.
18. O. Maimon and L. Rokach, Data Mining and Knowledge Discovery Handbook (Springer, New York, 2010).
19. Y. J. Lee, Y. R. Yeh, and Y. C. F. Wang, Anomaly detection via online oversampling principal component analysis, IEEE T. Knowl. Data En. 25(7) (2013) 1460-1470.
20. W. Wang, T. Guyet, R. Quiniou, M. O. Cordier, F. Masseglia, and X. Zhang, Autonomic intrusion detection: Adaptively detecting anomalies over unlabeled audit data st7reams in computer networks, Knowl-Based Syst. 70 (2014) 103-117.
21. A. Ben-Hur, D. Horn, H. T. Siegelmann, and V. Vapnik, Support vector clustering, J. Mach. Learn. Res. 2 (2002) 125-137.
22. L. Ping, Z. Chun-Guang, and Z. Xu, Improved support vector clustering, Eng. Appl. Artif. Intel. 23(4) (2010) 552-559.
23. J. Nocedal and S. Wright, Numerical optimization, series in operations research and financial engineering (Springer, New York, 2006).
24. H. A. Boubacar, S. Lecoeuche, and S. Maouche, SAKM: Self-adaptive kernel machine A kernel-based algorithm for online clustering, Neural Networks 21(9) (2008) 1287-1301.
25. K. S. Killourhy and R. A. Maxion, Comparing anomaly-detection algorithms for keystroke dynamics, in Proc. IEEE/IFIP International Conference on Dependable Systems & Networks (2009), pp. 125-134.
26. V. Chandola, A. Banerjee, and V. Kumar, Anomaly detection: A survey, ACM Comput. Surv. (CSUR)41(3) (2009) 15.
27. M. Tavallaee, E. Bagheri, W. Lu, and A. A. Ghorbani, A detailed analysis of the KDD Cup 99 data set, in Proc. 2nd IEEE Symposium on Computational Intelligence for Security and Defense Applications(2009).
Co-published by Atlantis Press and Taylor & FrancisCopyright: the authors
746


![A Support Vector Method for Clusteringpapers.nips.cc/paper/1823-a-support-vector-method... · A Support Vector Method for Clustering ... 5] an SV algorithm for ... In this section](https://img.pdfslide.net/doc/110x75/5ab319097f8b9aea528df4a2/a-support-vector-method-for-support-vector-method-for-clustering-5-an-sv-algorithm.jpg)