Embed Size (px)
DESCRIPTION
Online Machine Learning with Distributed In-memory Clusters. Arshak Navruzyan, VP Product Argyle Data Acknowledgements Nina Zumel, PhD – Win-Vector LLC. Contents. Business use-cases DevOps / Continuous Deployment Quality of Service (QOS) Quality of Experience ( QoE ) - PowerPoint PPT Presentation
Citation preview
Online Machine Learning with Distributed In-memory Clusters
Arshak Navruzyan, VP Product Argyle Data
AcknowledgementsNina Zumel, PhD – Win-Vector LLC
Contents Business use-cases
- DevOps / Continuous Deployment
- Quality of Service (QOS)
- Quality of Experience (QoE)
Machine learning methods for anomaly detection
- Nearest Neighbor (NN)
- Isolation Forest (iForest)
- Random Forests (RF)
Ecommerce operator use case Large distributed search farm logs usage data into in-memory grid
- Mixed measurements
- Continuous: query latency, resource utilization, etc.
- Categorical: client IP, server IP, code version, etc.
- ~1-3 TB of search logs every 12 hours
Find the anomalies
- Data isn’t easy to characterize due to size
- Anomalies are across multiple variables (combination of server, code version, latency)
- No labeled data is available
- High rate of false-positives at this scale is a flood of data
- Very few ML methods operate at this scale
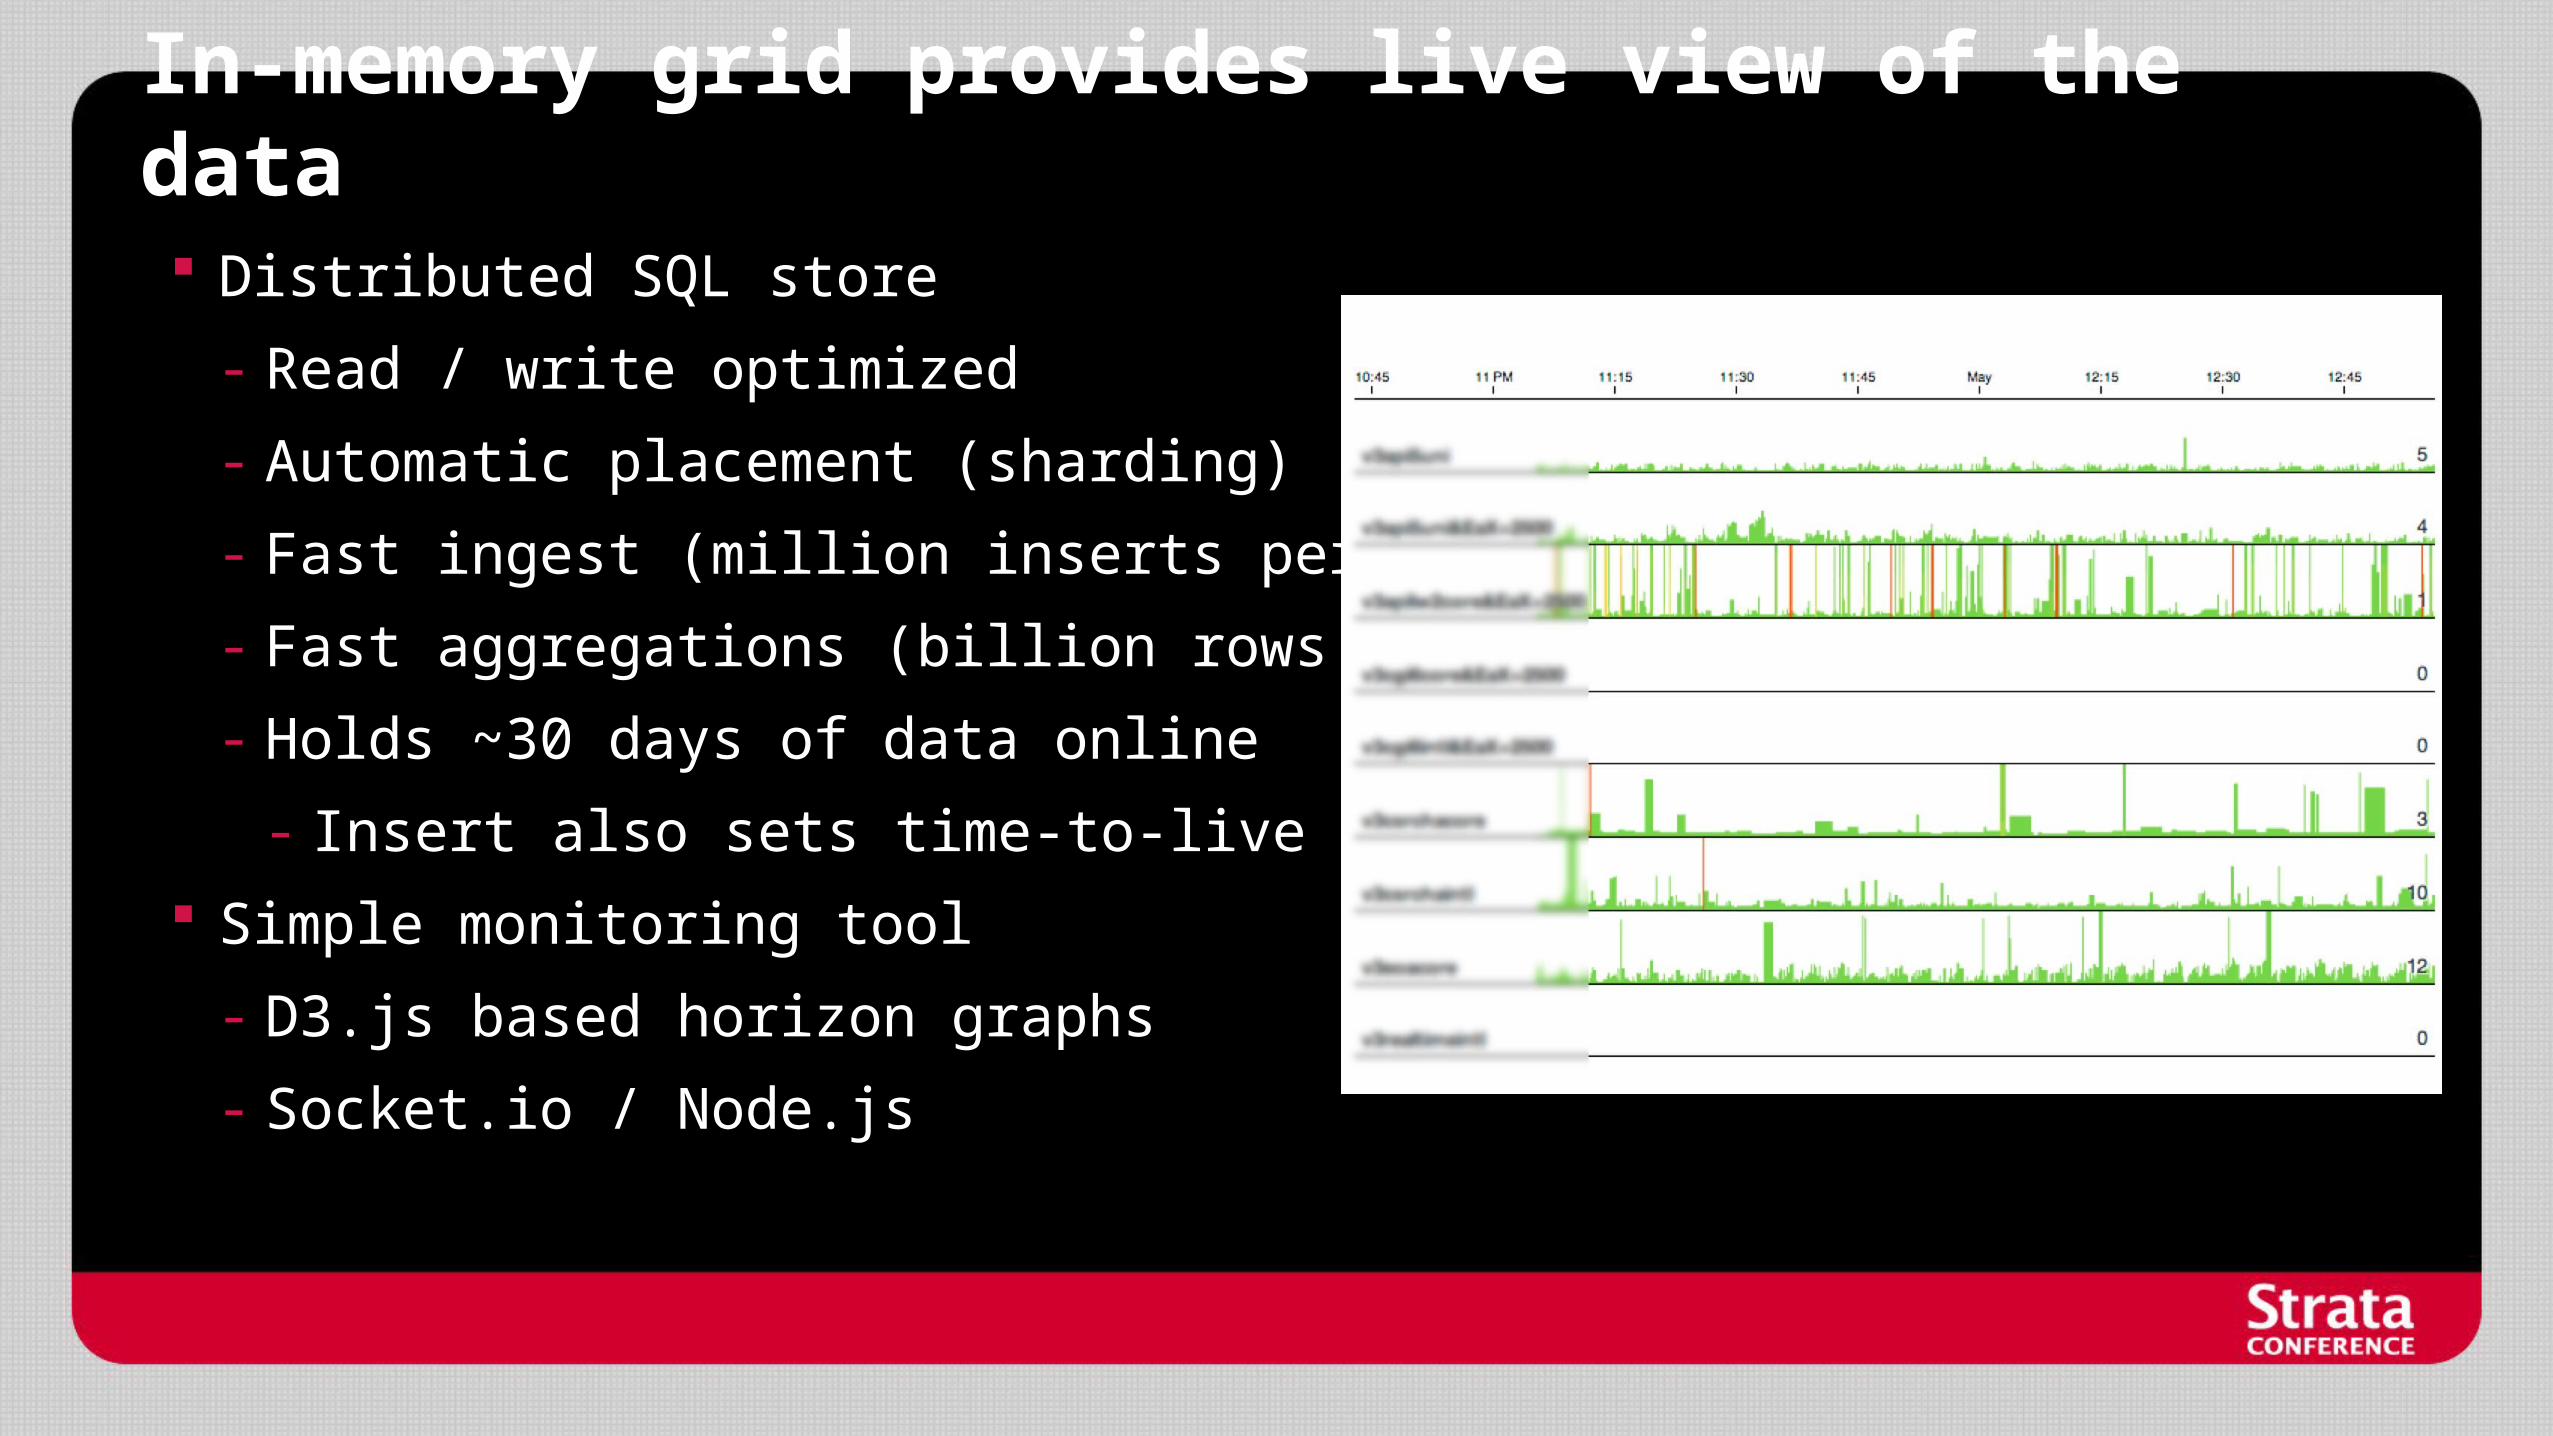
In-memory grid provides live view of the data Distributed SQL store
- Read / write optimized
- Automatic placement (sharding)
- Fast ingest (million inserts per sec.)
- Fast aggregations (billion rows per sec.)
- Holds ~30 days of data online
- Insert also sets time-to-live (ttl)
Simple monitoring tool
- D3.js based horizon graphs
- Socket.io / Node.js
Isn’t there an open source project that does this? Etsy’s continuous deployment problem
- 1.5b page views, 1M users, $117m in goods sold
- 250+ commiters, everyone deploys!
- 30+ deploys to production a day
- ~8 commits per deploy
- How do you NOT break production?
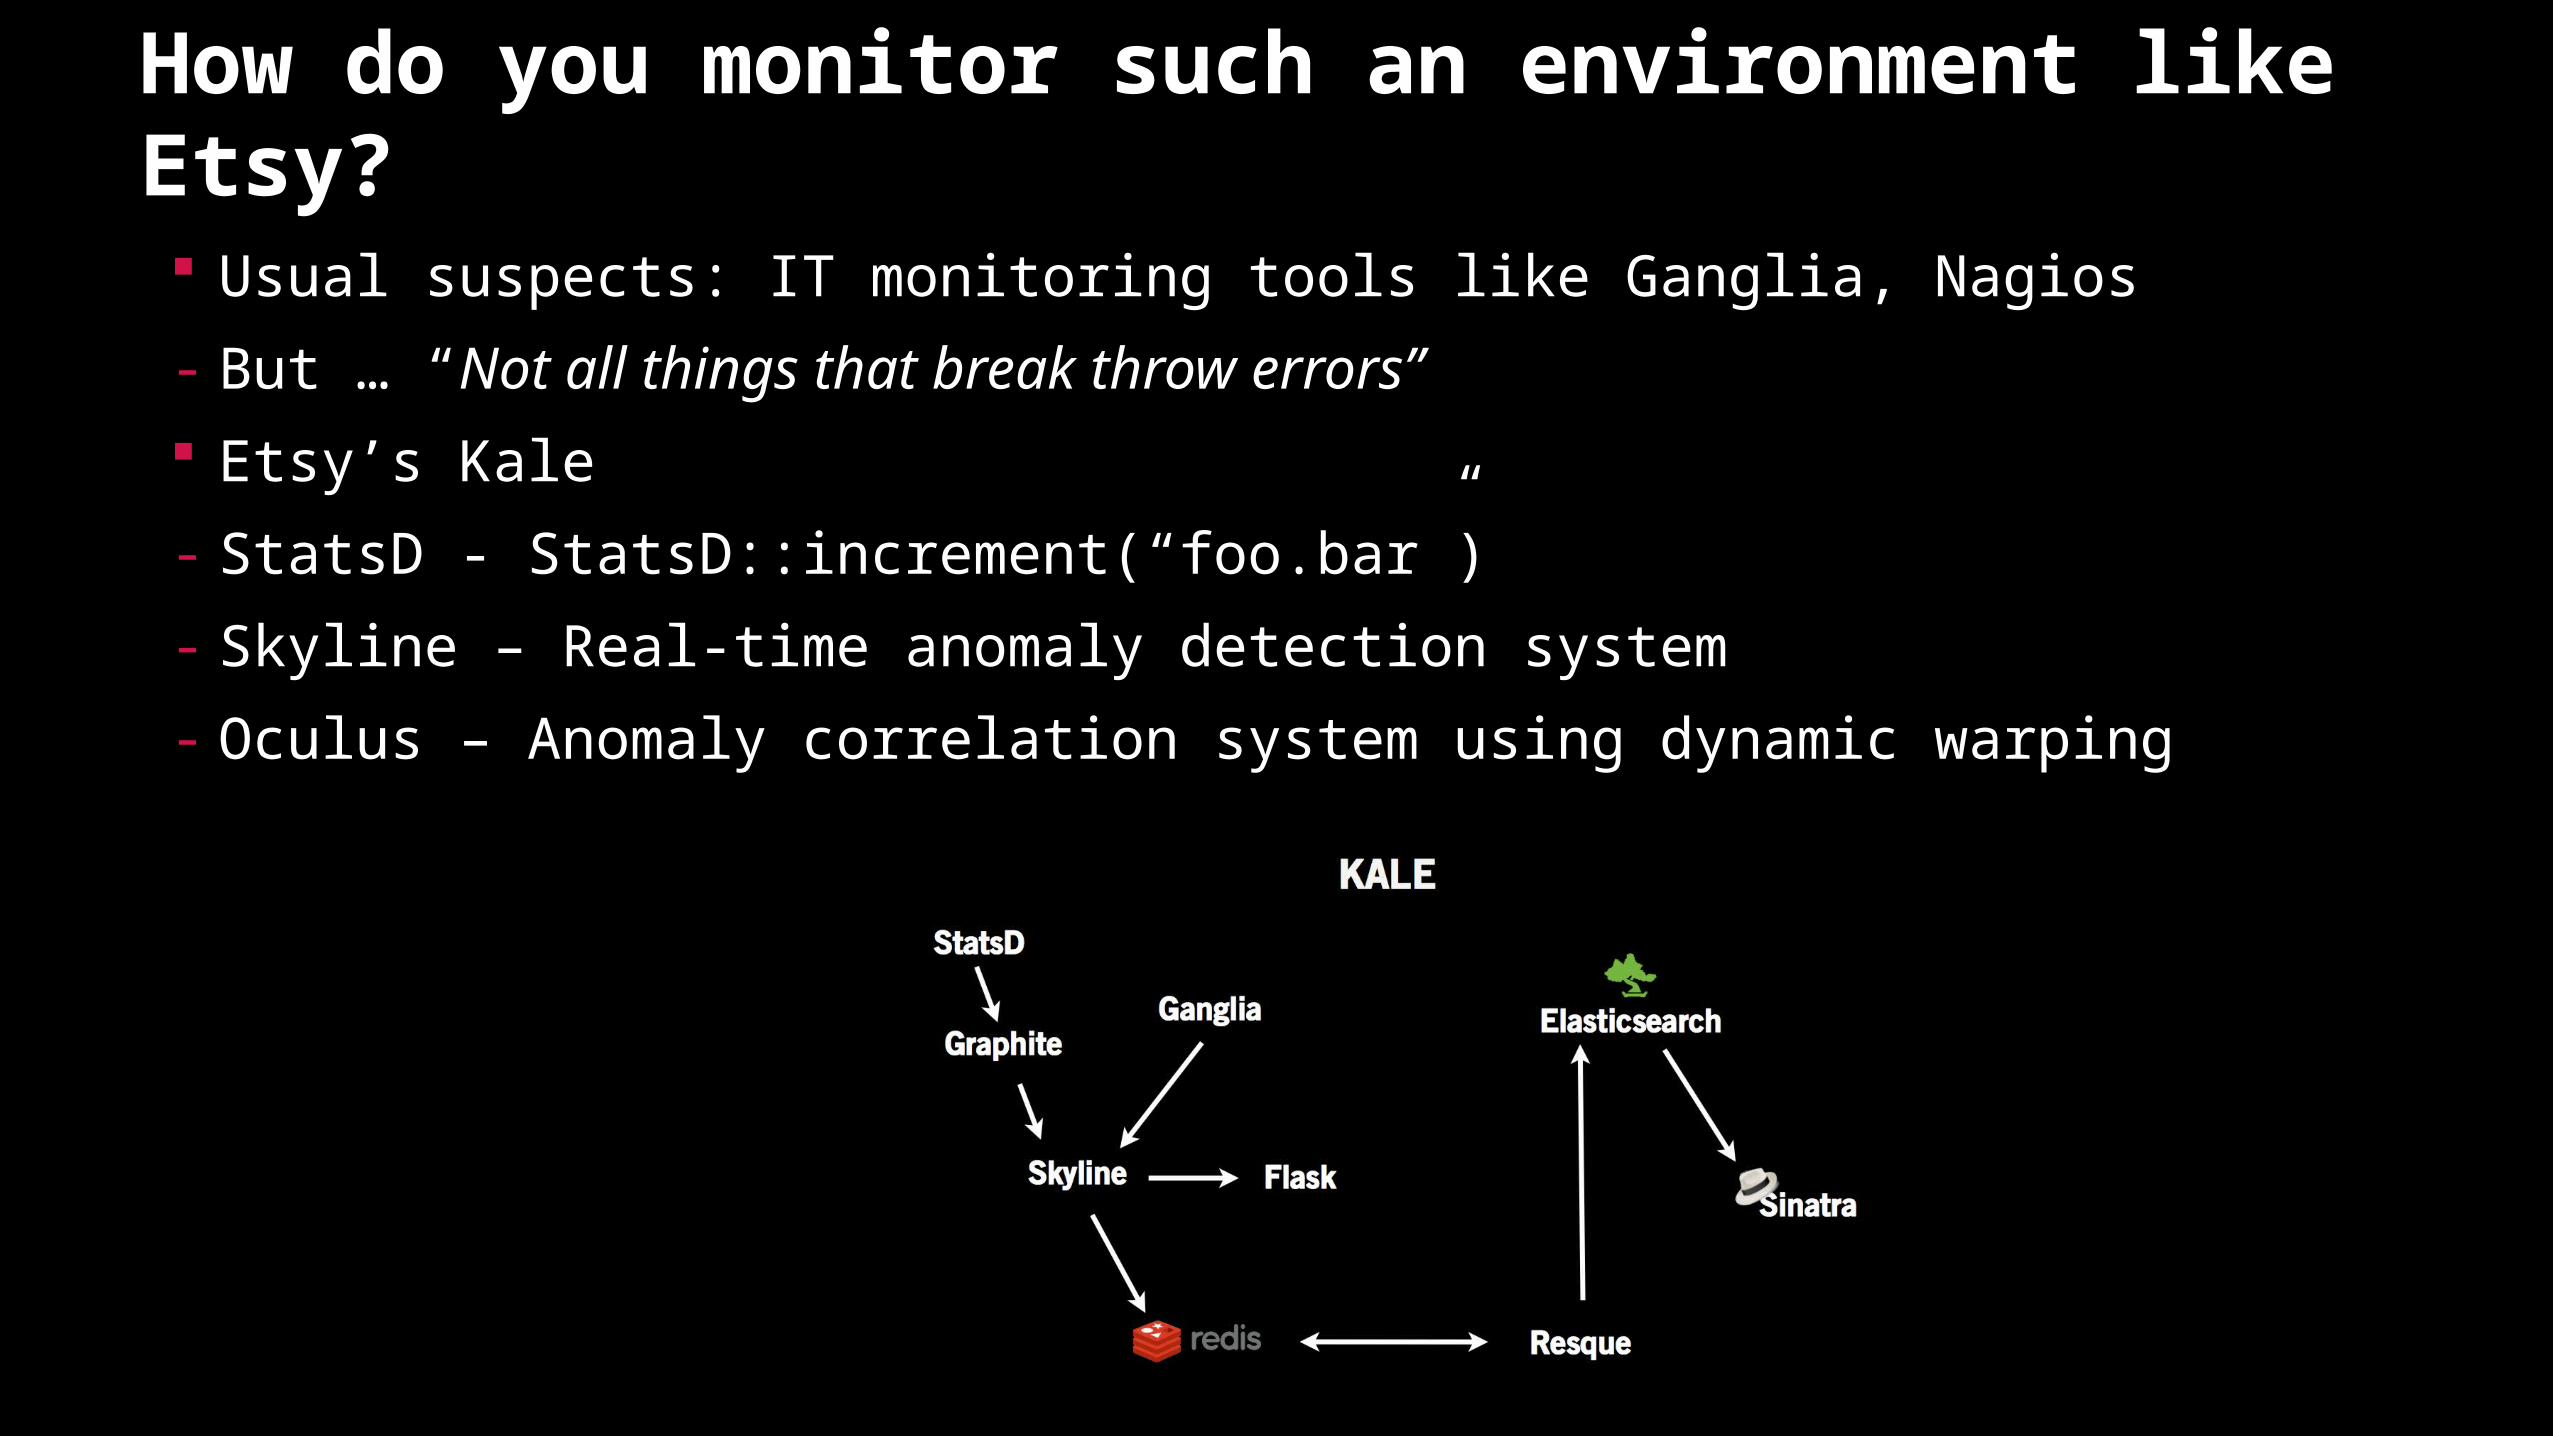
How do you monitor such an environment like Etsy? Usual suspects: IT monitoring tools like Ganglia, Nagios
- But … “Not all things that break throw errors”
Etsy’s Kale
- StatsD - StatsD::increment(“foo.bar”)
- Skyline – Real-time anomaly detection system
- Oculus – Anomaly correlation system using dynamic warping
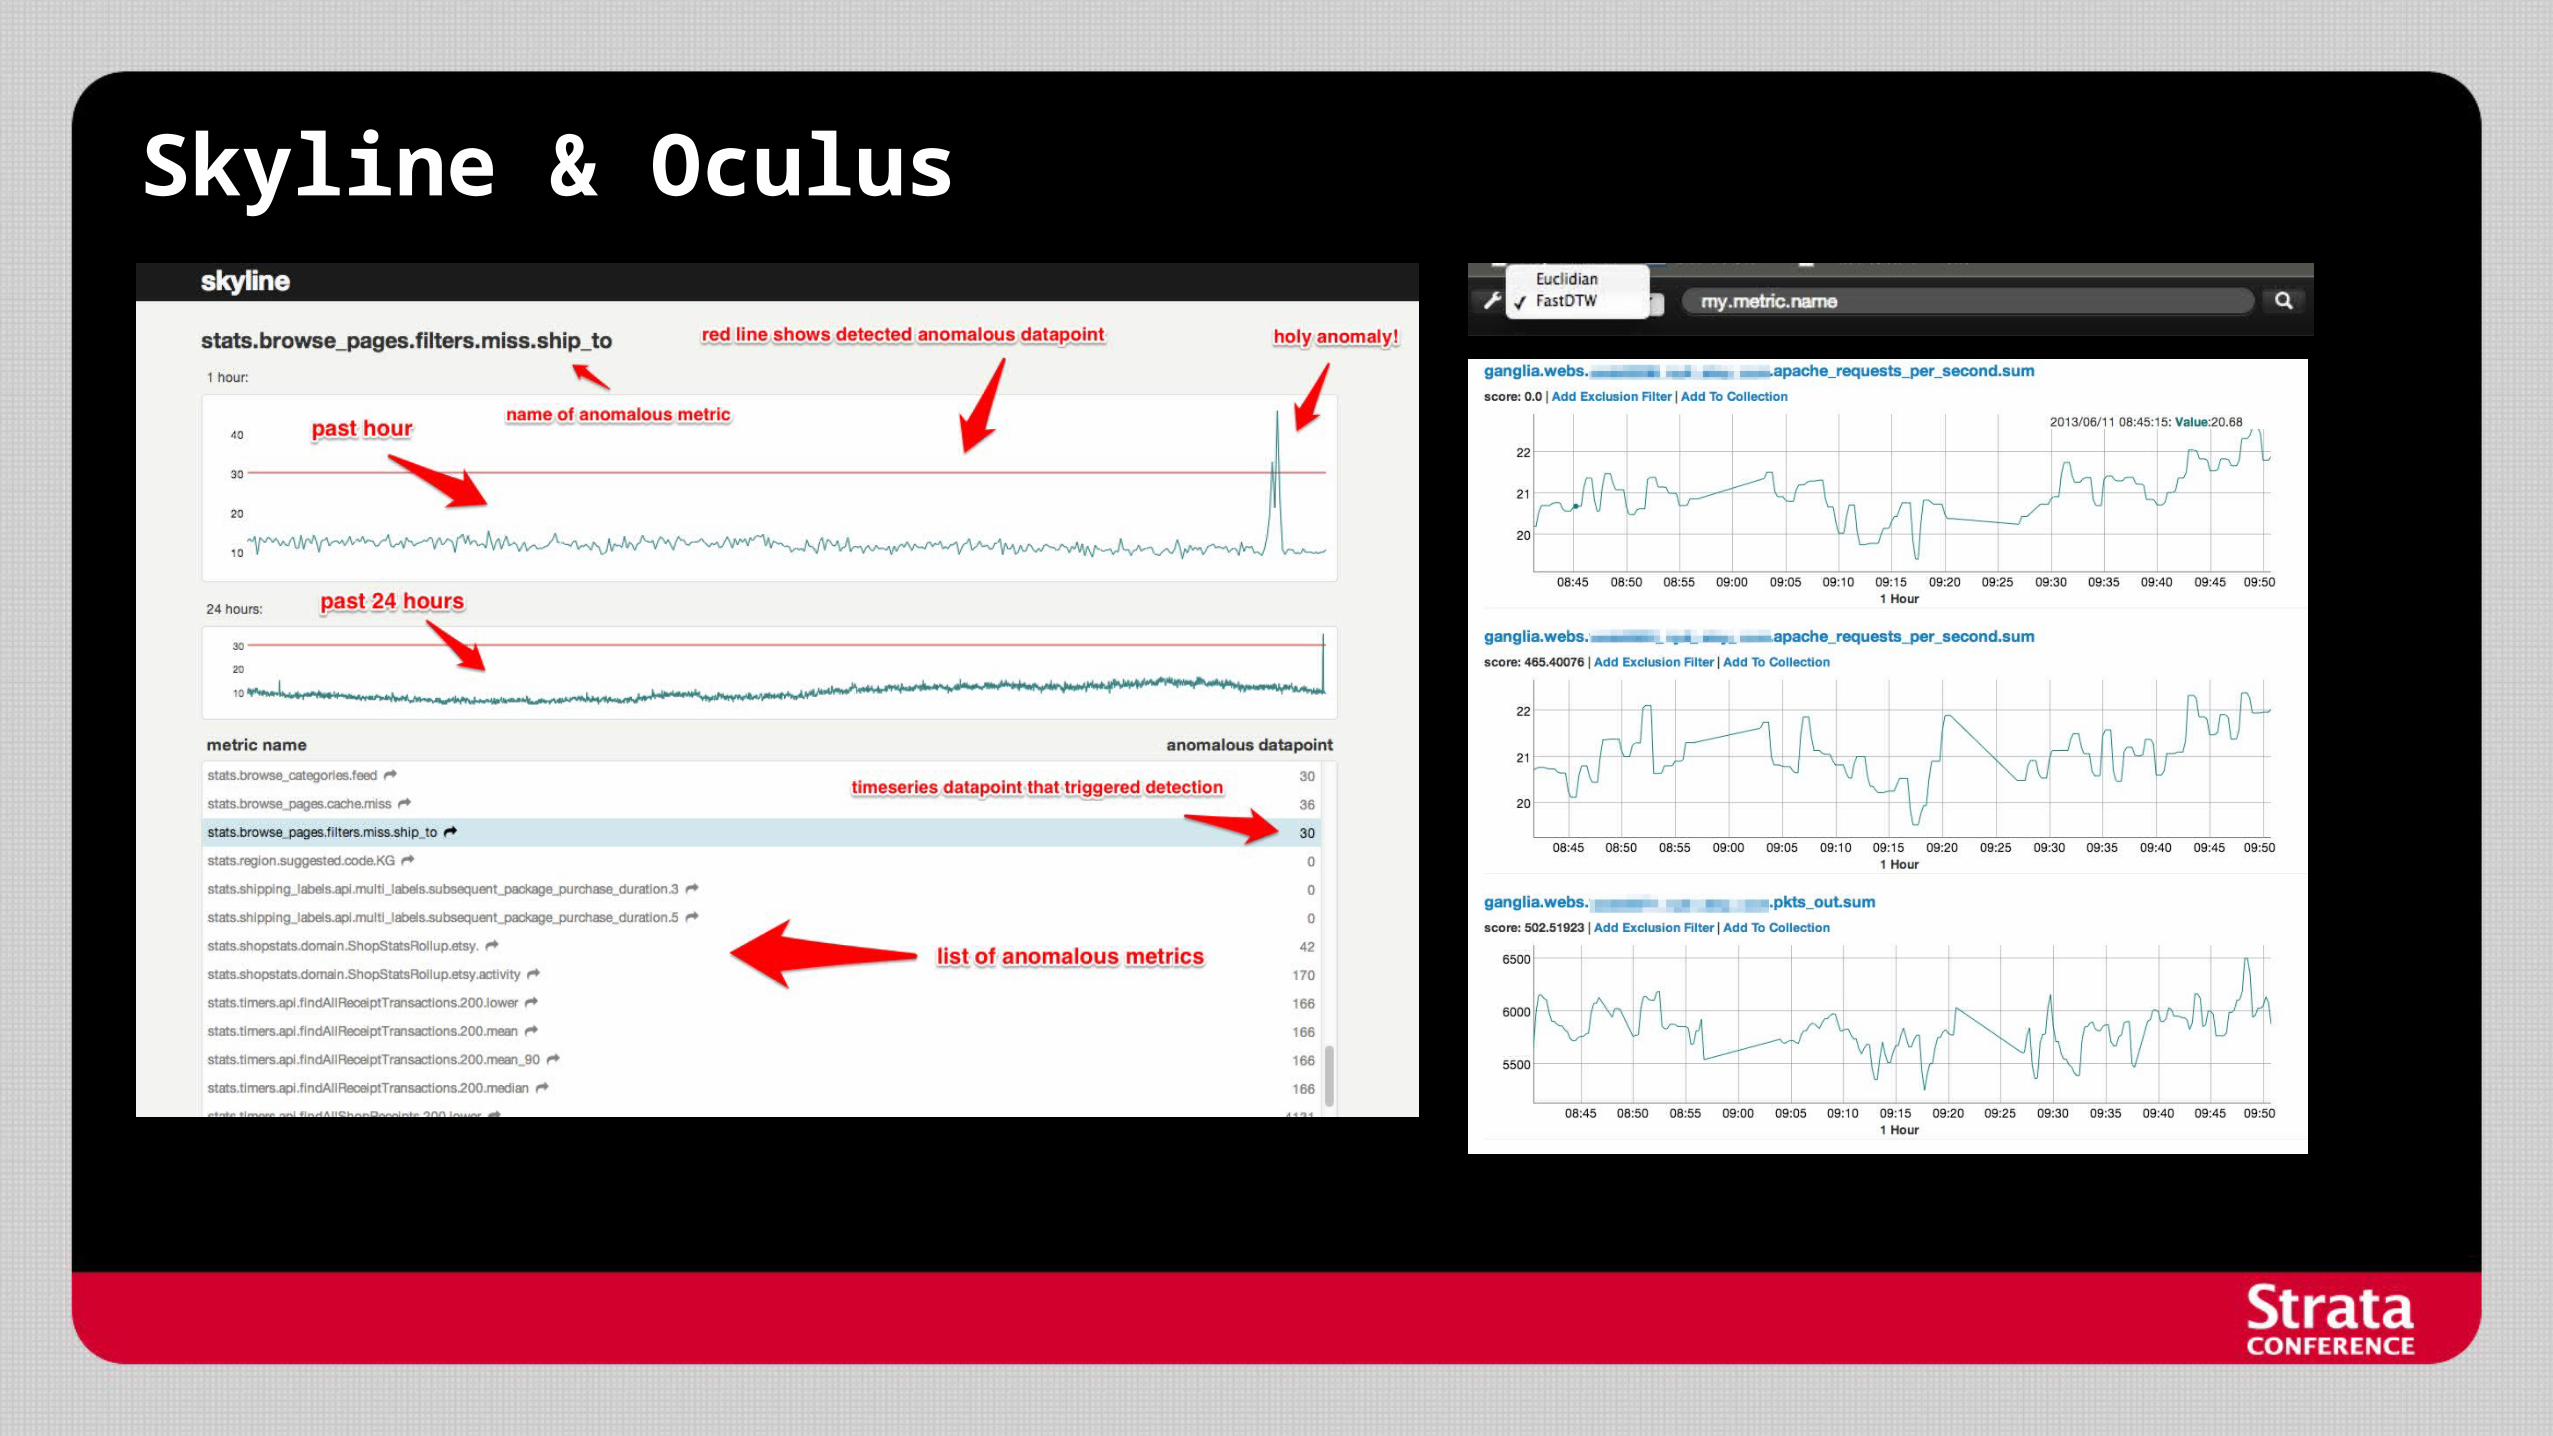
Skyline & Oculus
Did they solve the problem? Skyline’s Anomaly Detection
- Basic principle: “Metric is anomalous if it’s latest datapoint is over three standard deviations above the moving average”
- Ensemble of methods from tailing average, median absolute deviation, grubbs, stdev from moving average, least squares (3 sigma), Kolmogorov-Smirnov test, etc.
- Results get better with ensemble technqiue but still very noisy
- Non-normal distributions
- Spike influence
- Periodicity / seasonality
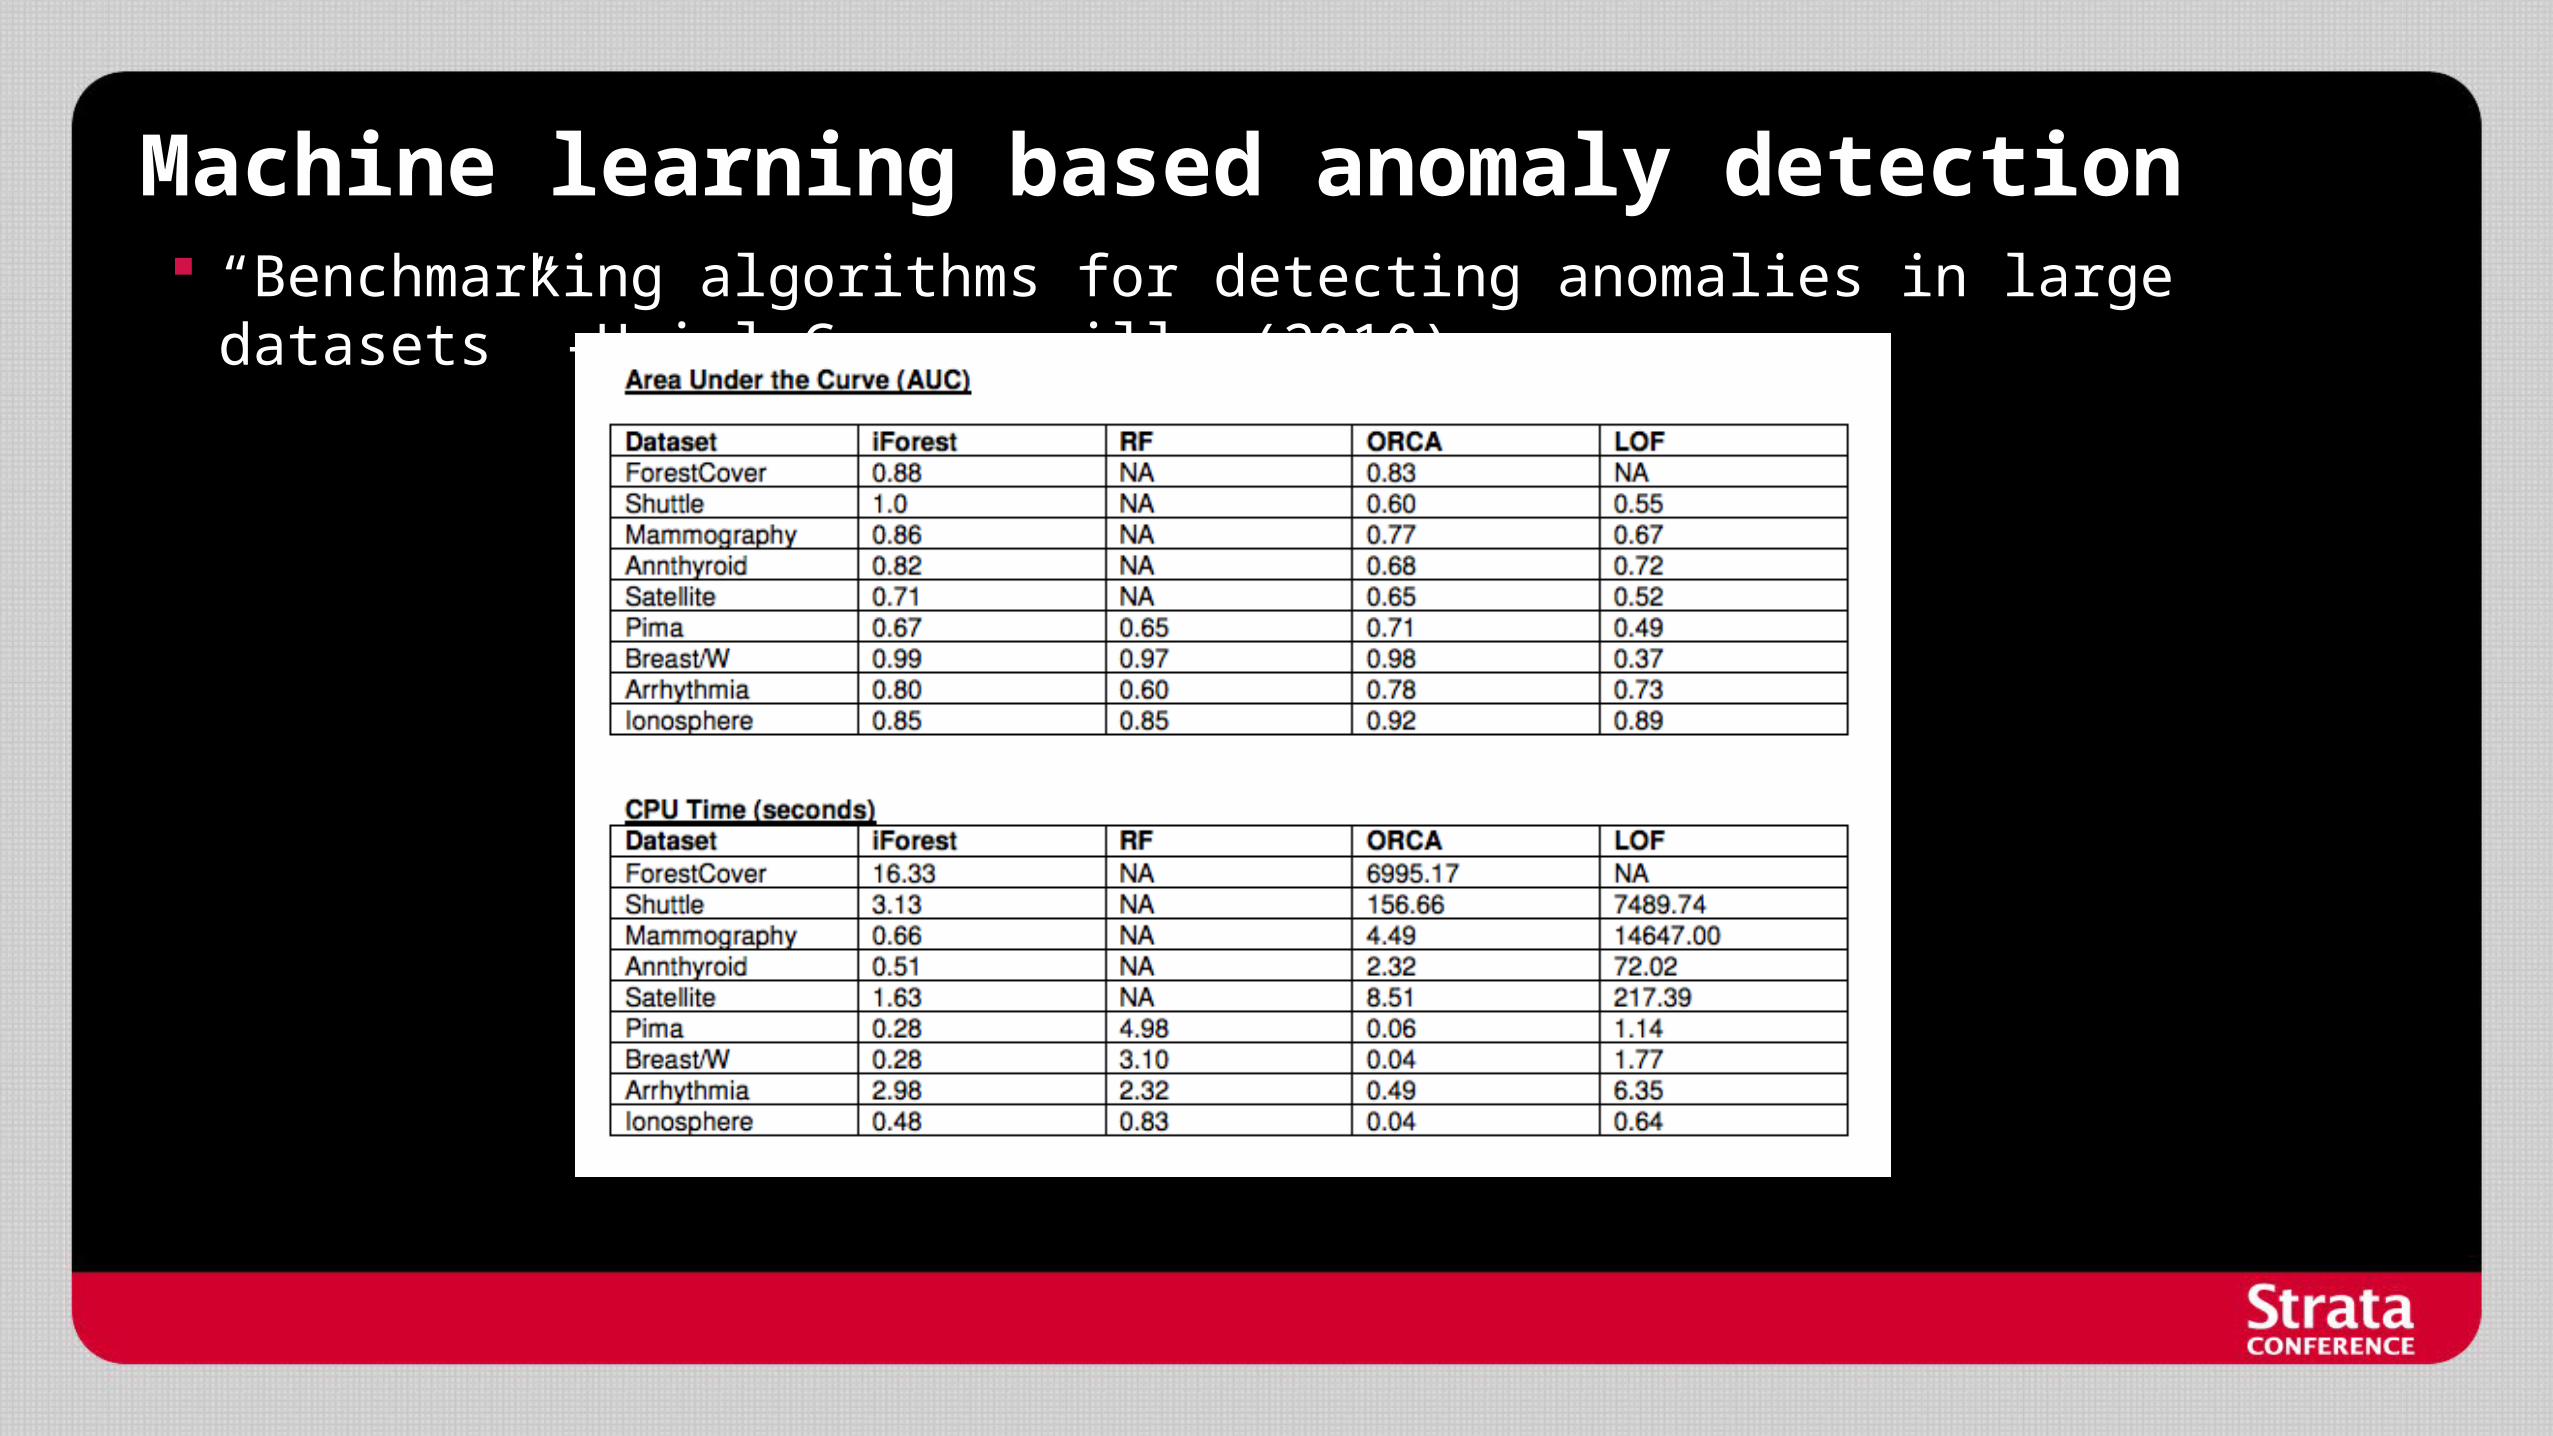
Machine learning based anomaly detection “Benchmarking algorithms for detecting anomalies in large datasets” -Uriel Carrasquilla
(2010)
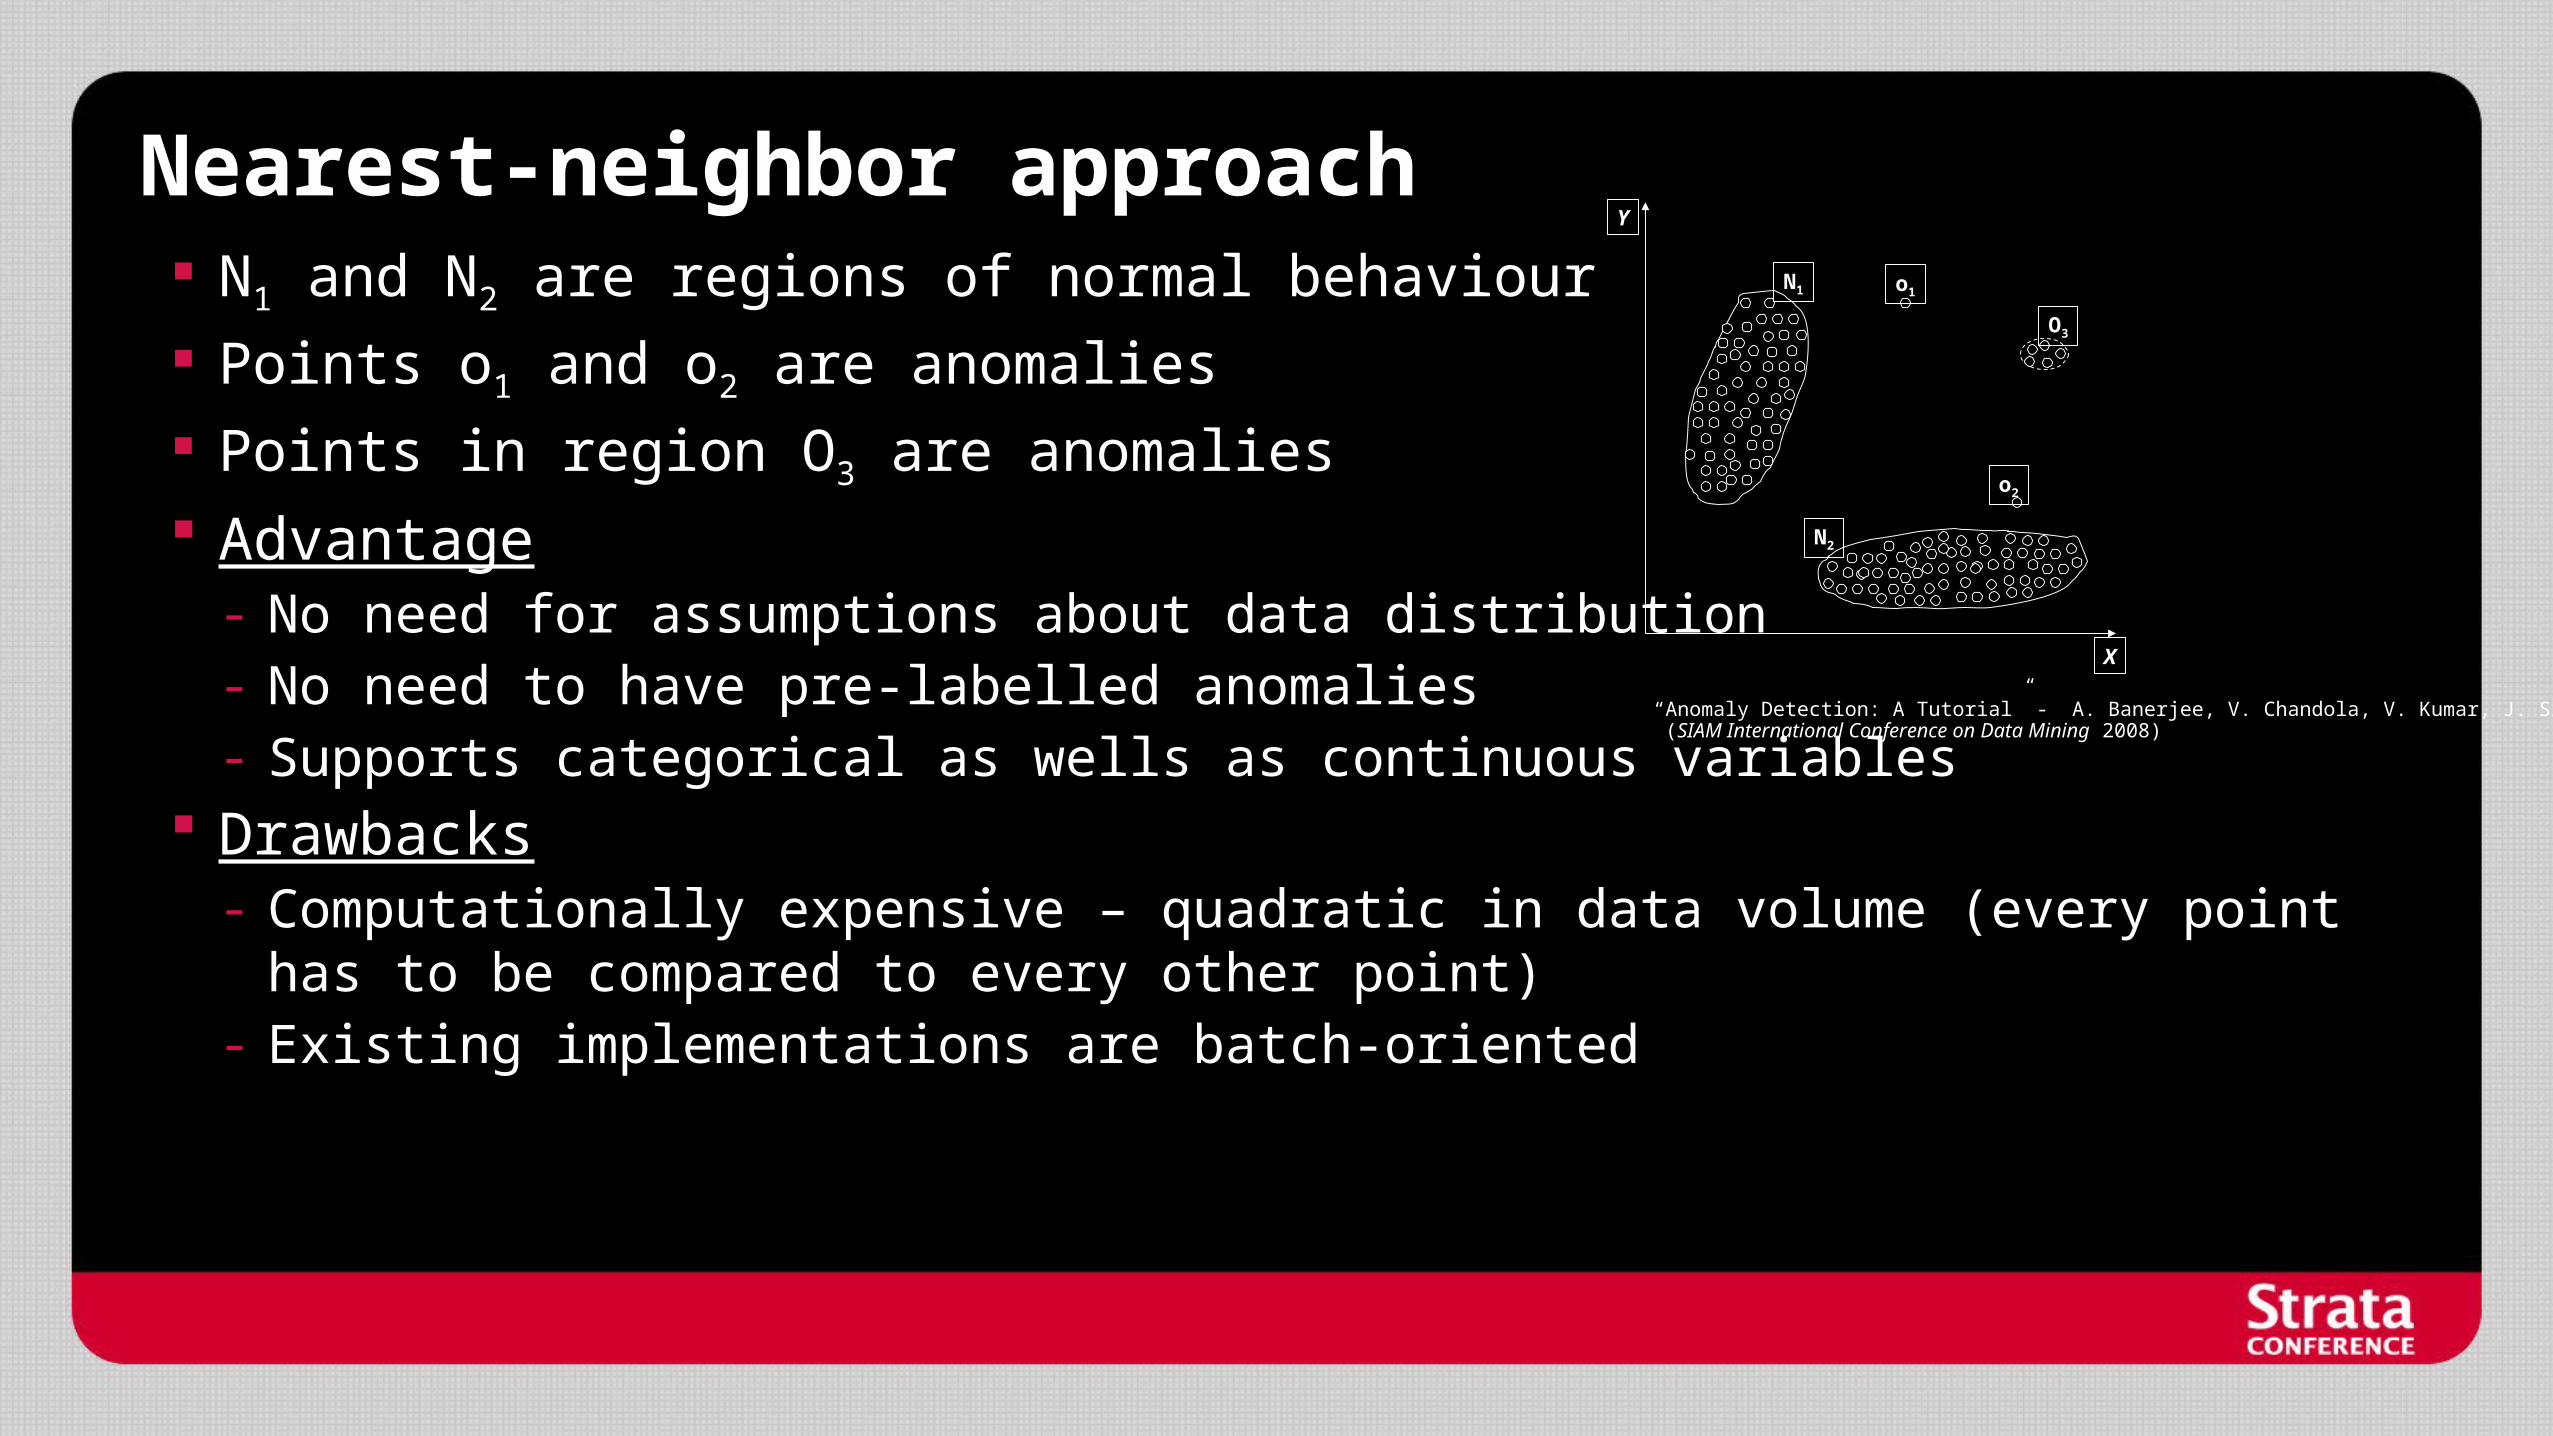
Nearest-neighbor approach N1 and N2 are regions of normal behaviour
Points o1 and o2 are anomalies
Points in region O3 are anomalies Advantage
- No need for assumptions about data distribution- No need to have pre-labelled anomalies- Supports categorical as wells as continuous variables
Drawbacks- Computationally expensive – quadratic in data volume (every point has to be compared to
every other point)- Existing implementations are batch-oriented
X
Y
N1
N2
o1
o2
O3
“Anomaly Detection: A Tutorial” - A. Banerjee, V. Chandola, V. Kumar, J. Srivastava (SIAM International Conference on Data Mining 2008)
Avoiding the quadratic computation time of NN Bay & Schwabacher SIGKDD 2003
- Outliners in Near Linear Time with Randomization and a Simple Pruning Rule
Only anomalies are compared to every point in the data set
- If anomalies are rare, points only get compared to a small constant number of points
Challenges that remain
- Batch learner won’t work for our scale
- How would this work in a sharded environment?
- Linear time is still long for “Big Data”
Nearest-neighbor as an online learner ORCA concepts can be extended to online learning
- Randomly pull a small sample of the data that is representative of a time period
- Compare the streaming data (latest observations) to the representative set
- Representative set moves with time (sliding window) so that noon is compared to typical noon (this addresses periodicity)
Other enhancements
- Every node needs the full reference set
- Distributed cache moves reference set between nodes
- Locality sensitive hashing
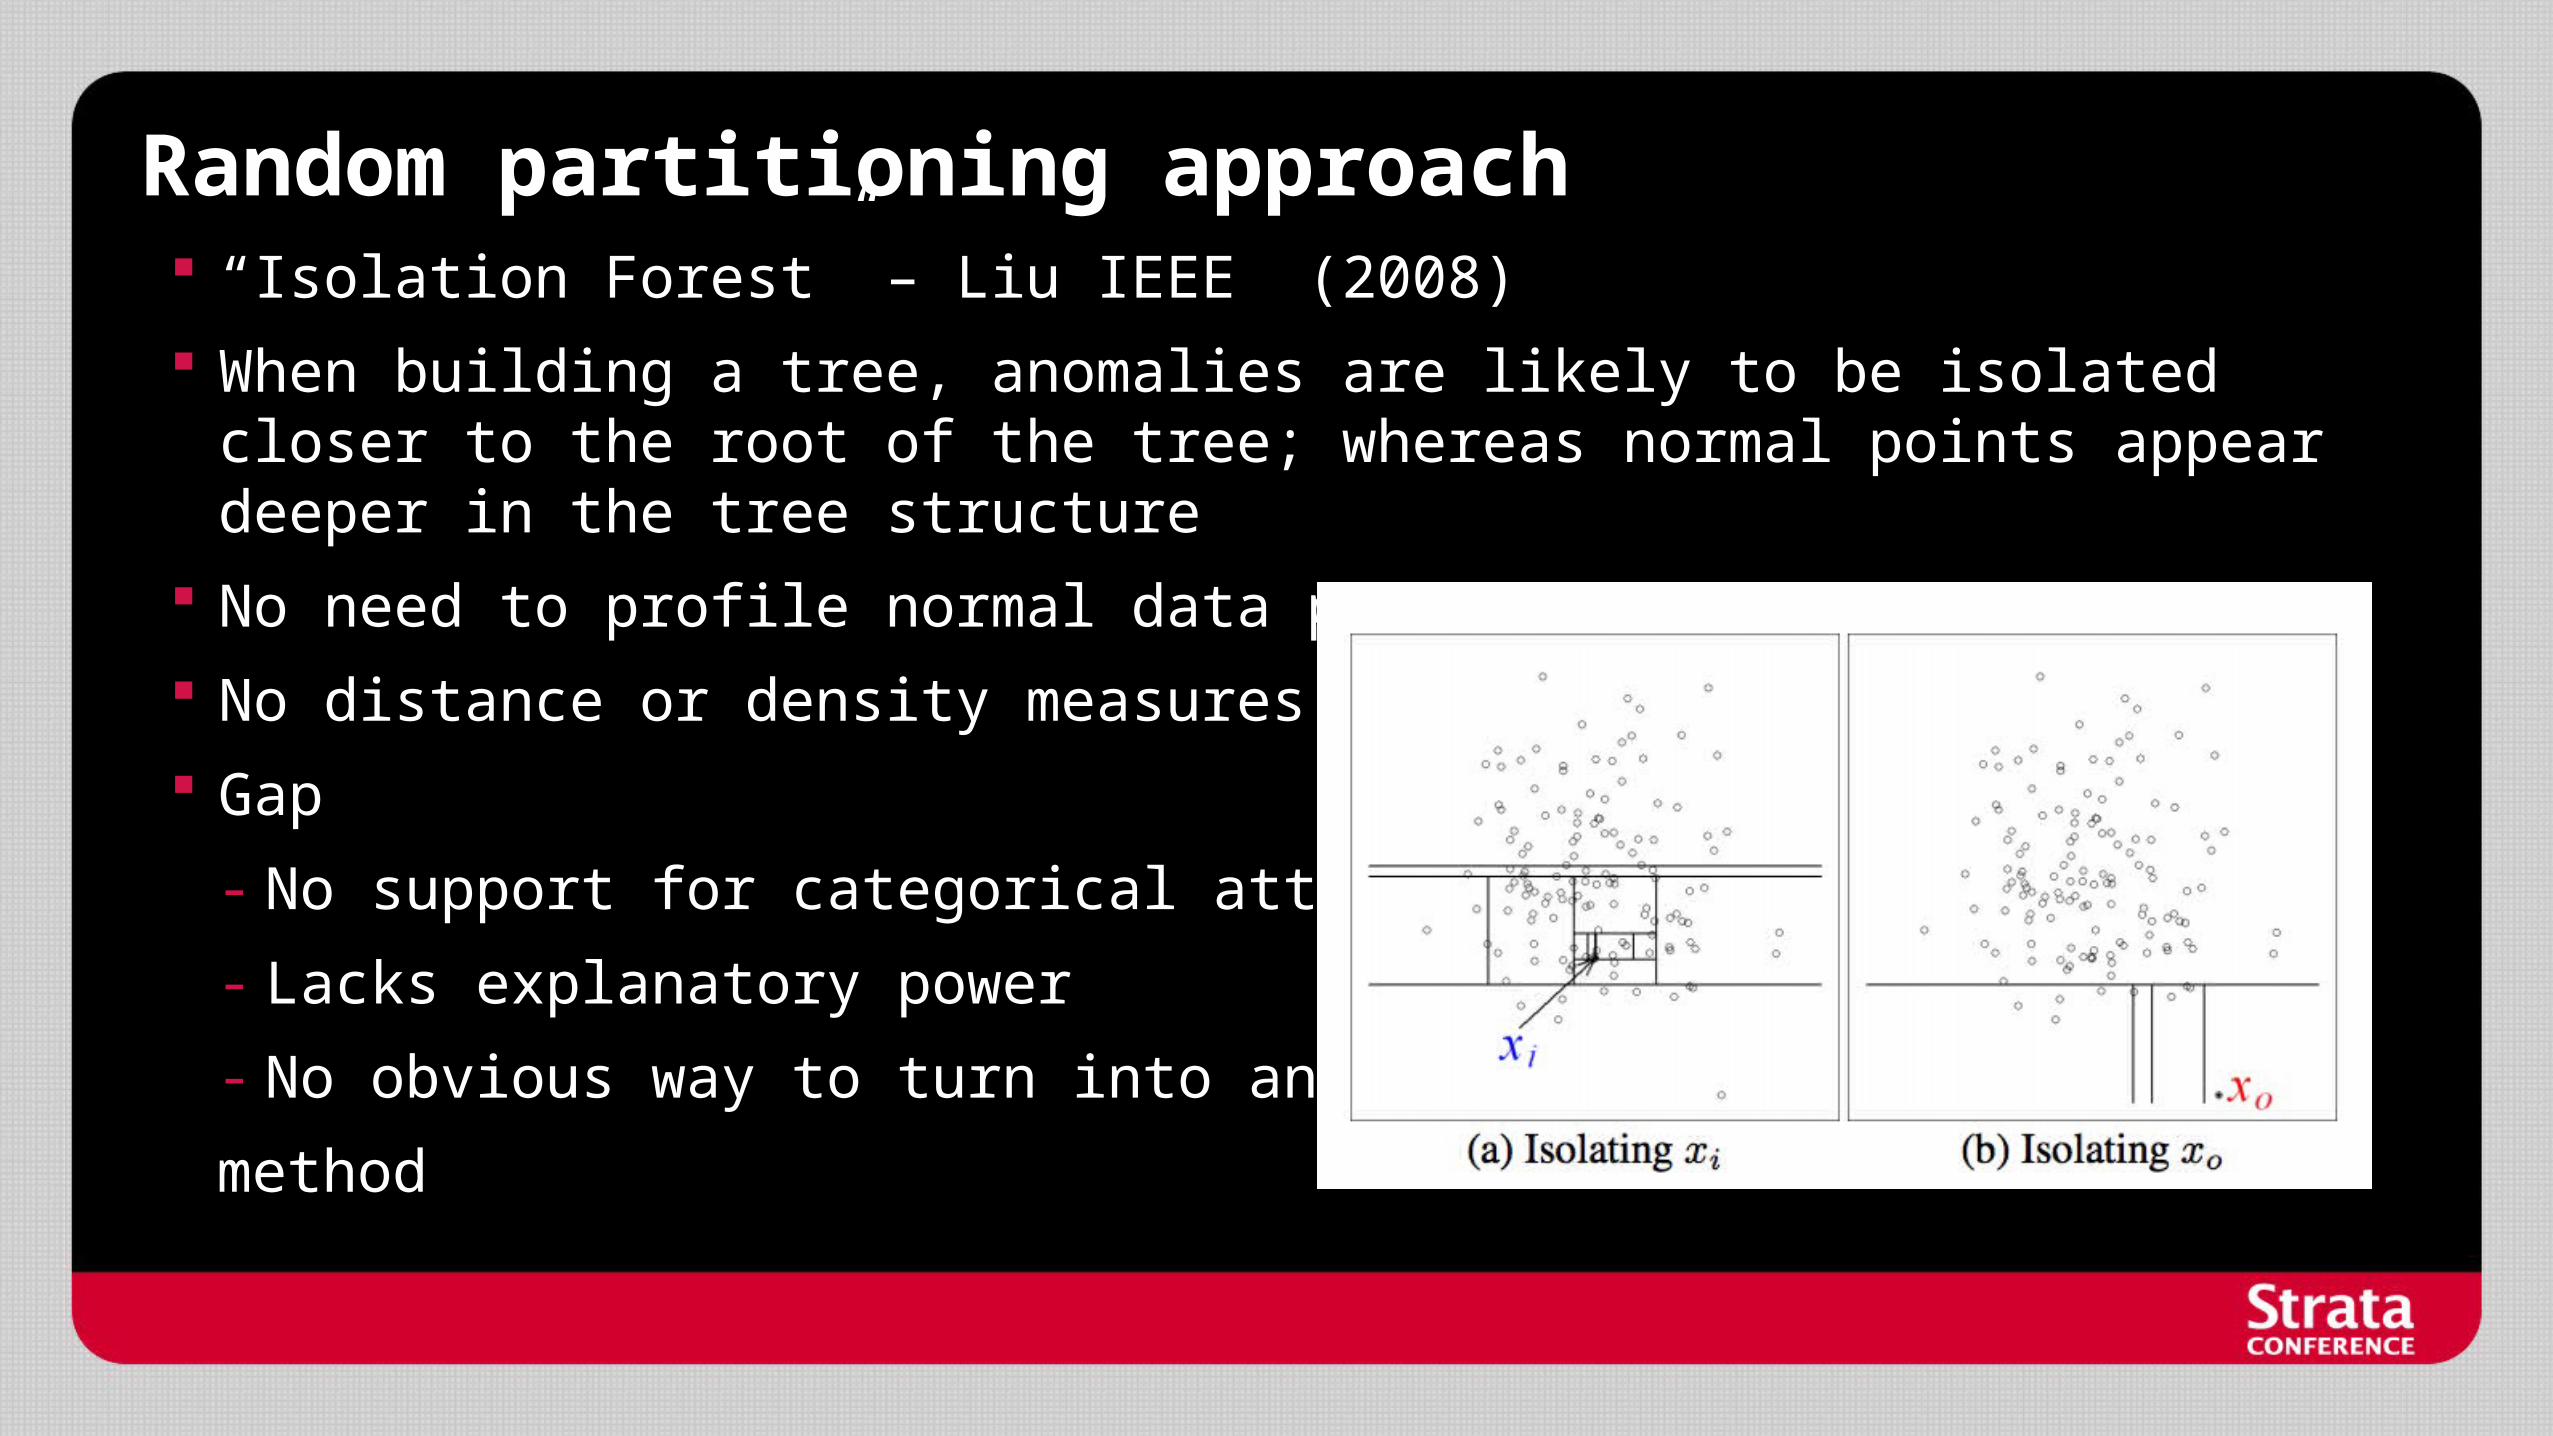
Random partitioning approach “Isolation Forest” – Liu IEEE (2008)
When building a tree, anomalies are likely to be isolated closer to the root of the tree; whereas normal points appear deeper in the tree structure
No need to profile normal data points
No distance or density measures
Gap
- No support for categorical attributes
- Lacks explanatory power
- No obvious way to turn into an online
method
Ensemble of trees as an online learner Random Forest (RF) basics
- Take the square root of the number of attributes and build that many trees
- Random selection (with replacement) of observations (in-bag/out-of-bag)
- Random selection of variables
“Online Random Forests” (ORF) algorithm of Saffari et al., ICCV-OLCV 2009
- How do you perform bagging online? (Oza “Online bagging and Boosting”)
- Probability of an individual tree seeing an observation in batch learning mode is Poisson (λ = 1)
- How to grow random trees on-the-fly?
- Continuously measure info-gain (or gini) of a potential split
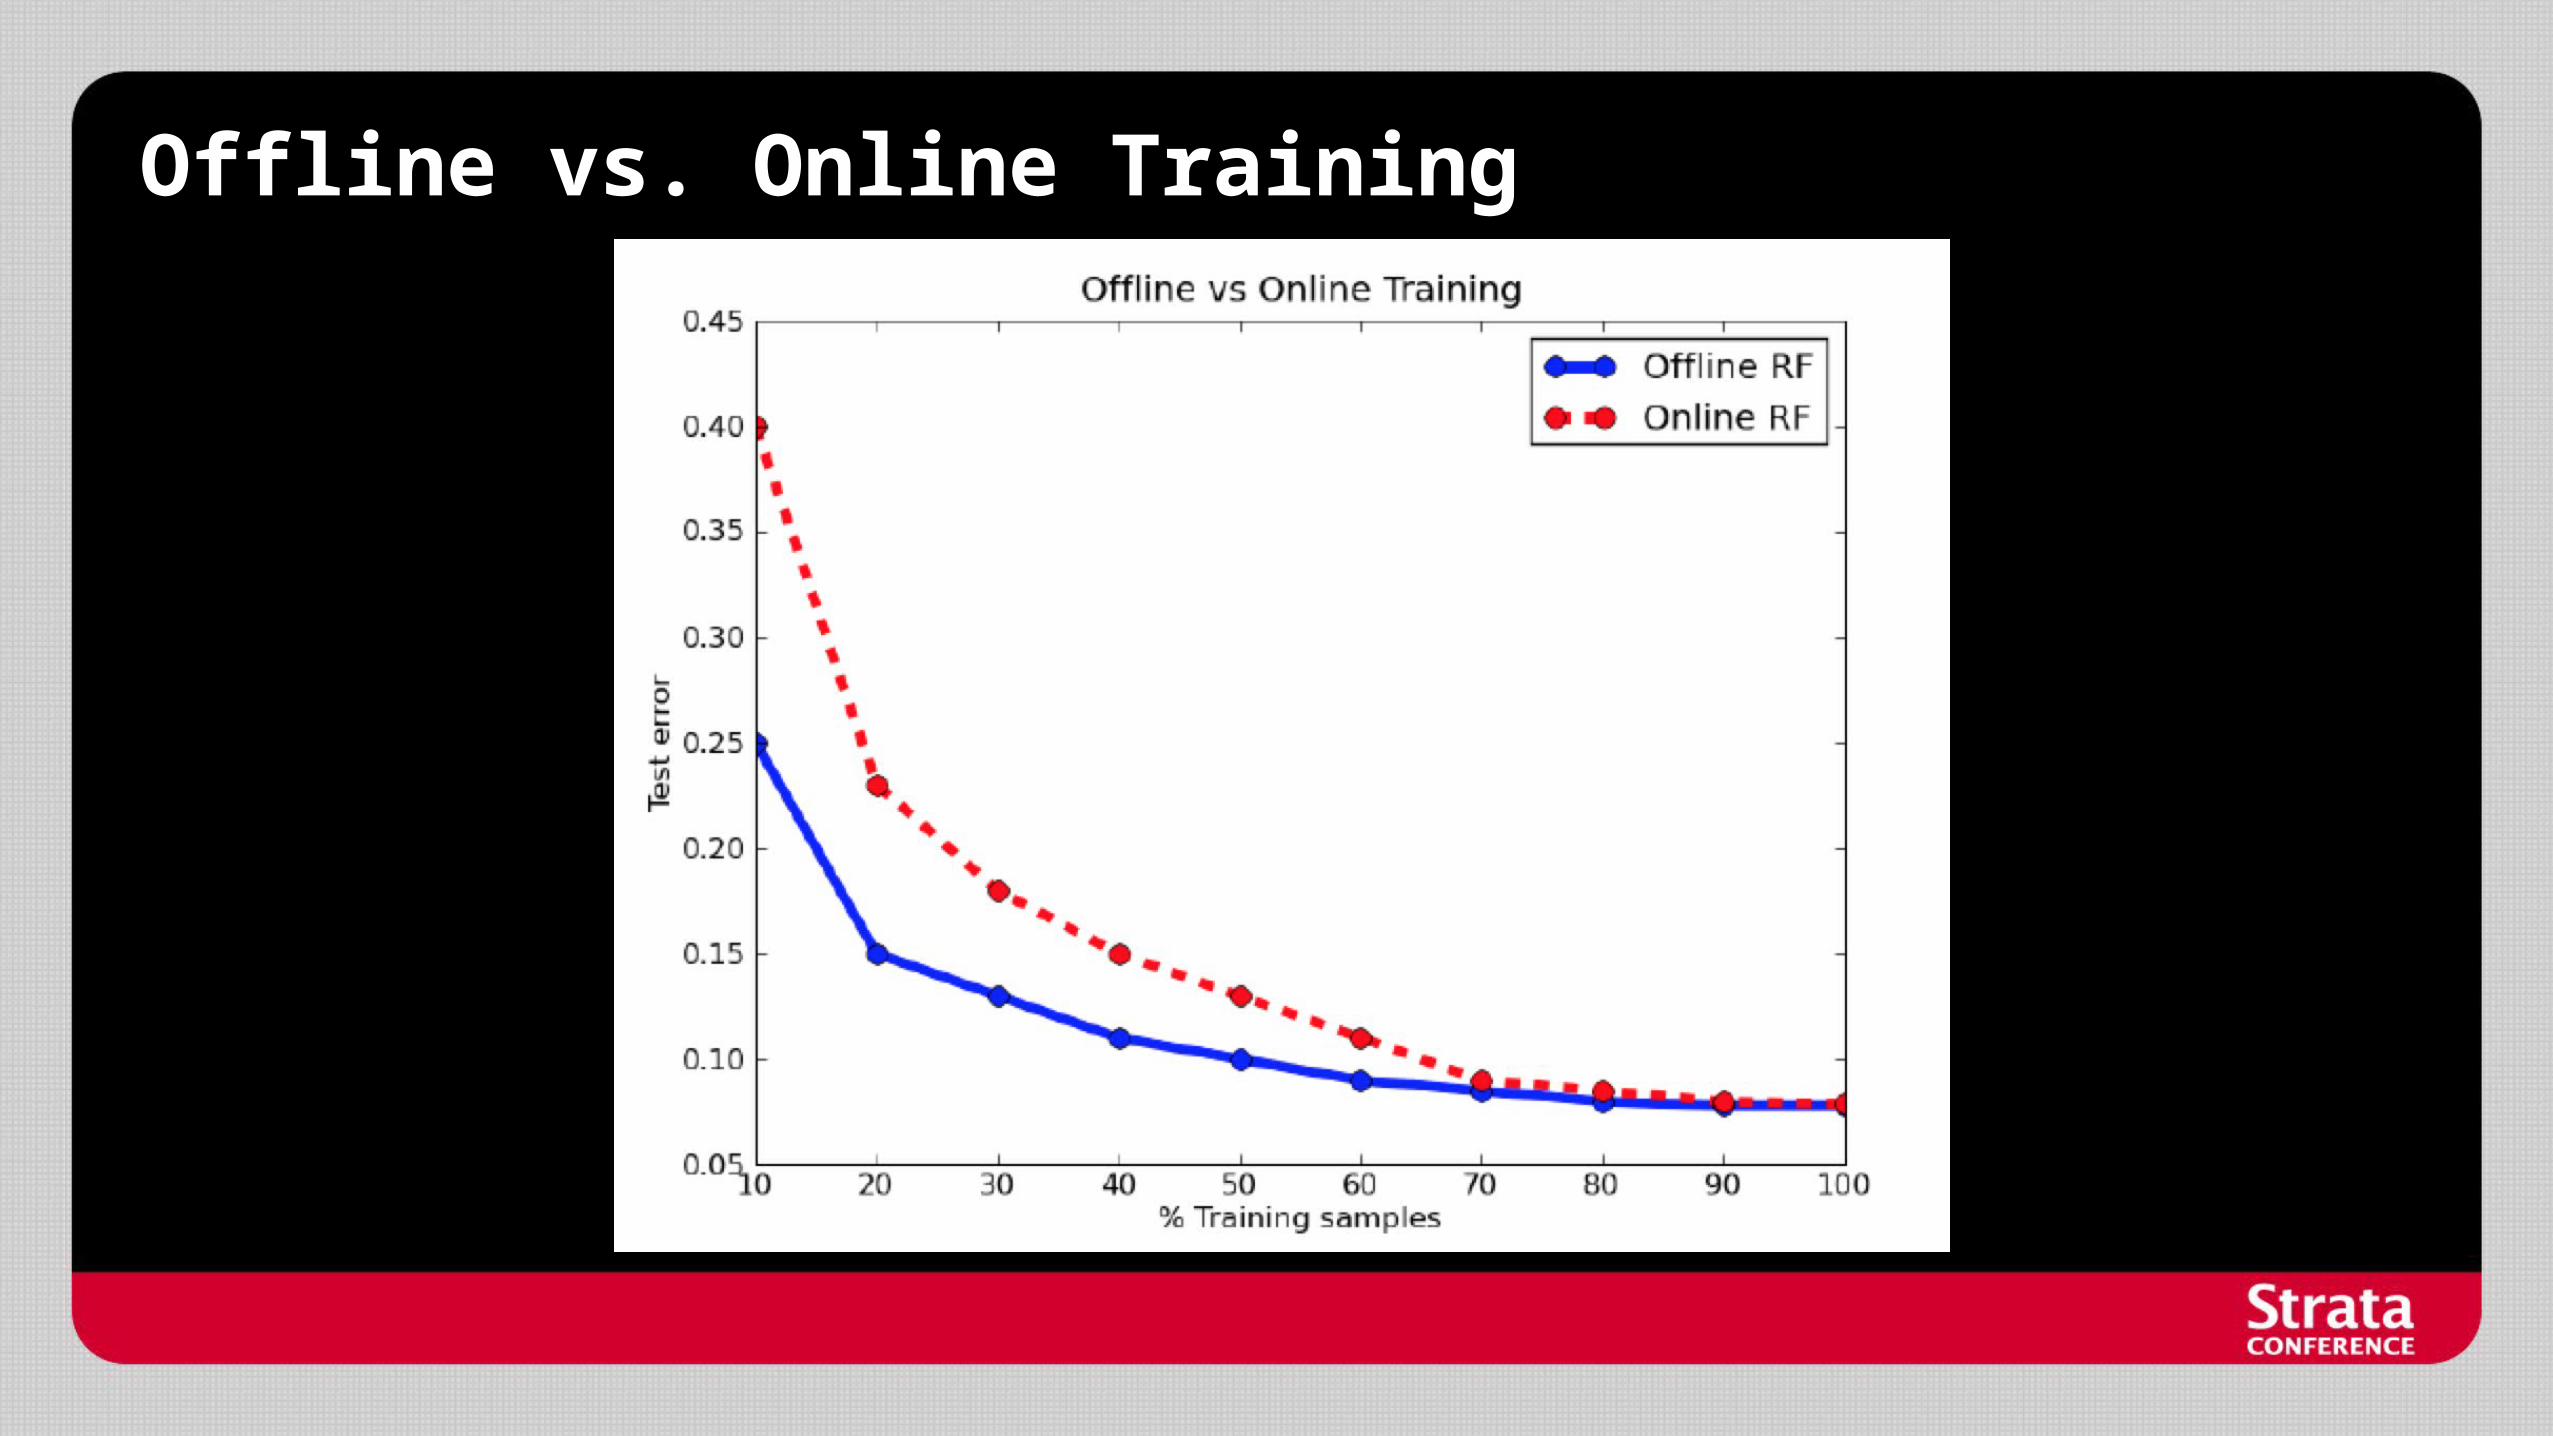
Offline vs. Online Training
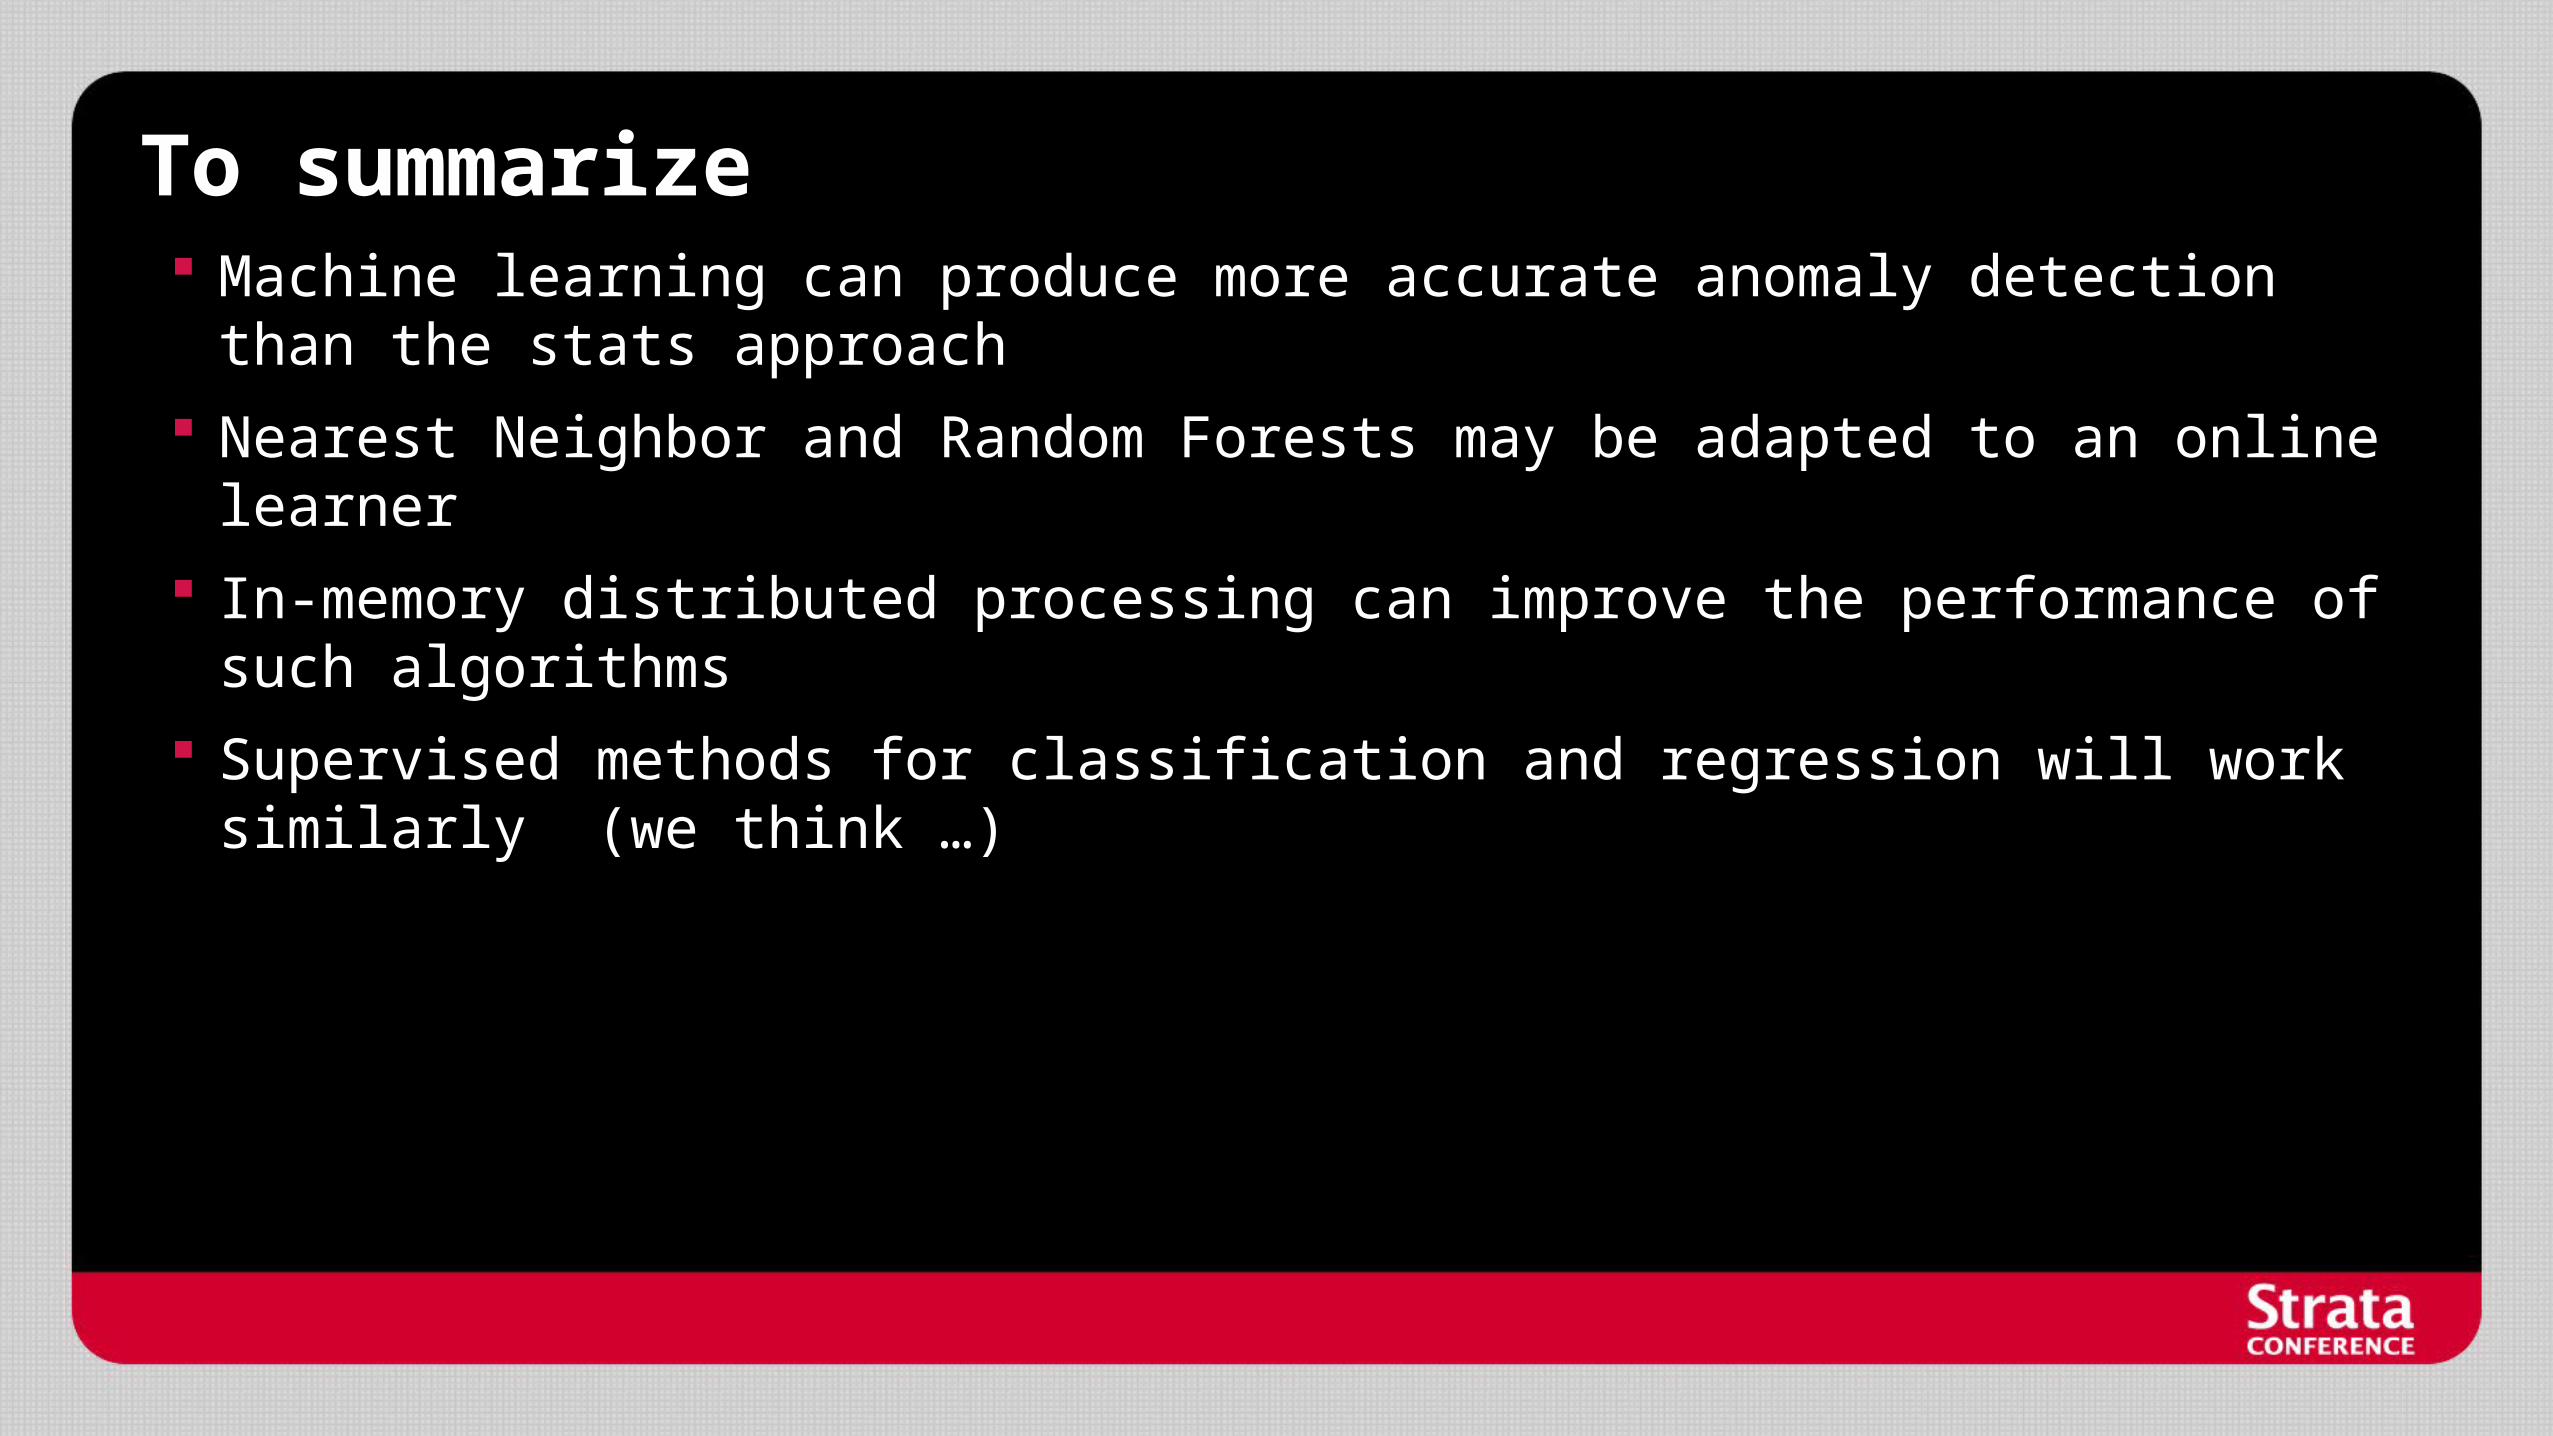
To summarize Machine learning can produce more accurate anomaly detection than the stats
approach
Nearest Neighbor and Random Forests may be adapted to an online learner
In-memory distributed processing can improve the performance of such algorithms
Supervised methods for classification and regression will work similarly (we think …)

Thank you!www.linkedin.com/in/arshak