Embed Size (px)
Citation preview
E-WAter Official Publication of the European Water Association (EWA)
© EWA 2008 ISSN 1994-8549
Ekkehard Christoffels 1, Erftverband, Bergheim
Online Monitoring of Water Quality on the River Erft
Abstract
Eighteen years ago the Erftverband, a water management association in North Rhine-
Westphalia (Germany) initiated an online monitoring network for continuous recording of
contents of surface water in the catchment area of the Erft river. With this system the
Erftverband can collect data on the most important parameters for water quality management.
The reason for establishing this online monitoring network is explained and the system, which
could serve as a model for planning, building and operating any such network, is described.
Some examples of data obtained using this system are presented.
KEYWORDS: online monitoring; in-situ station; on-site station; water quality; water
temperature; oxygen concentration; nutrients.
1. Introduction
Water quality in the Erft requires considerable attention because usage demands are high
relative to the rivers modest size. Some background on the river and its uses are provided to
explain why the Erftverband established online substance monitoring.
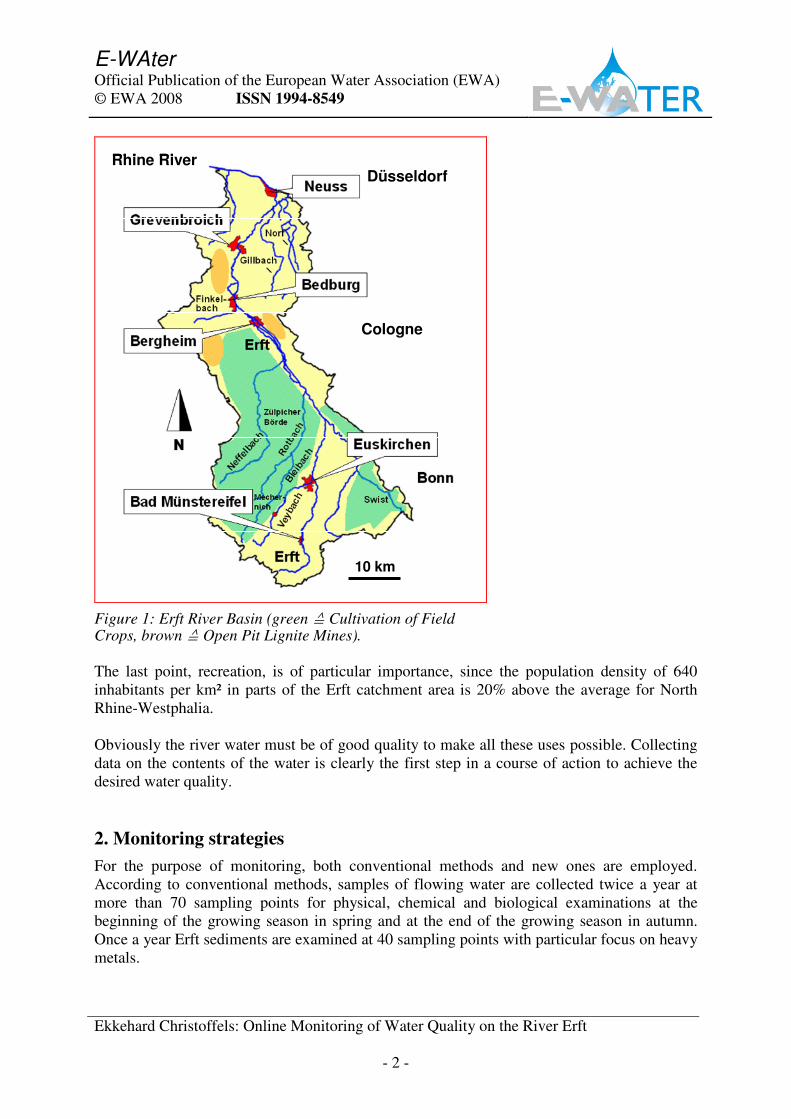
The source of the Erft river is situated in the general vicinity of the former German capital,
Bonn, in North Rhine-Westphalia (figure 1). Near the city of Euskirchen the river, with an
average 1% slope of decline, leaves the mountainous region called the Eifel. In the middle
and lower reaches the Erft descends at a very gradual slope of 0.1%. At the end of its 110 km
course the Erft flows into the Rhine river near the city of Düsseldorf.
Wide areas of the river basin are dominated by cultivation of field crops including wheat, rye,
barley and sugar beets. In addition, the region is well known for its open pit lignite mines.
Large quantities of groundwater must be pumped out to keep these mines dry. About 250
million cubic meters a year of this groundwater is discharged in the Erft river in the middle
reach [1]. The discharged groundwater determines the level of water flow in the middle and
lower portions of the river. The mean run off at the mouth is around ten cubic meters per
second, of which the natural run off amounts to only about 3 cubic meters per second.
Besides extensive cultivation of field crops and coal mining, some other significant activities
impact the Erft river:
• Discharge from waste water treatment plants;
• Abstraction of water for aquatic biotopes and intensive fruit and vegetable production;
• And recreation (e.g. sportfishing, boating).
Dr. rer. nat. Ekkehard Christoffels; D-50126 Bergheim Am Erftverband 6
Mail: [email protected]
E-WAter Official Publication of the European Water Association (EWA)
© EWA 2008 ISSN 1994-8549
Ekkehard Christoffels: Online Monitoring of Water Quality on the River Erft
- 2 -
DüsseldorfRhine River
Cologne
10 km
DüsseldorfRhine River
Cologne
DüsseldorfRhine River
Cologne
10 km
Figure 1: Erft River Basin (green ≙ Cultivation of Field Crops, brown ≙ Open Pit Lignite Mines).
The last point, recreation, is of particular importance, since the population density of 640
inhabitants per km² in parts of the Erft catchment area is 20% above the average for North
Rhine-Westphalia.
Obviously the river water must be of good quality to make all these uses possible. Collecting
data on the contents of the water is clearly the first step in a course of action to achieve the
desired water quality.
2. Monitoring strategies
For the purpose of monitoring, both conventional methods and new ones are employed.
According to conventional methods, samples of flowing water are collected twice a year at
more than 70 sampling points for physical, chemical and biological examinations at the
beginning of the growing season in spring and at the end of the growing season in autumn.
Once a year Erft sediments are examined at 40 sampling points with particular focus on heavy
metals.
E-WAter Official Publication of the European Water Association (EWA)
© EWA 2008 ISSN 1994-8549
Ekkehard Christoffels: Online Monitoring of Water Quality on the River Erft
- 3 -
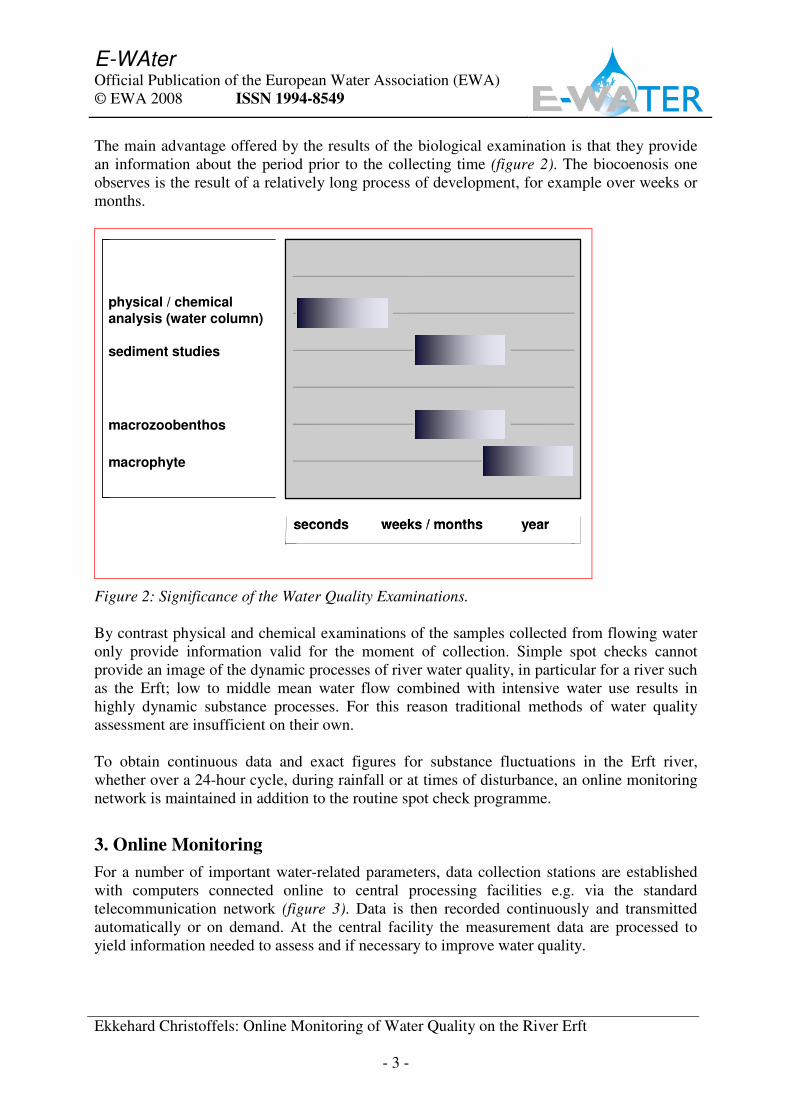
The main advantage offered by the results of the biological examination is that they provide
an information about the period prior to the collecting time (figure 2). The biocoenosis one
observes is the result of a relatively long process of development, for example over weeks or
months.
physical / chemical
analysis (water column)
sediment studies
macrozoobenthos
macrophyte
seconds weeks / months year
physical / chemical
analysis (water column)
sediment studies
macrozoobenthos
macrophyte
seconds weeks / months year
Figure 2: Significance of the Water Quality Examinations.
By contrast physical and chemical examinations of the samples collected from flowing water
only provide information valid for the moment of collection. Simple spot checks cannot
provide an image of the dynamic processes of river water quality, in particular for a river such
as the Erft; low to middle mean water flow combined with intensive water use results in
highly dynamic substance processes. For this reason traditional methods of water quality
assessment are insufficient on their own.
To obtain continuous data and exact figures for substance fluctuations in the Erft river,
whether over a 24-hour cycle, during rainfall or at times of disturbance, an online monitoring
network is maintained in addition to the routine spot check programme.
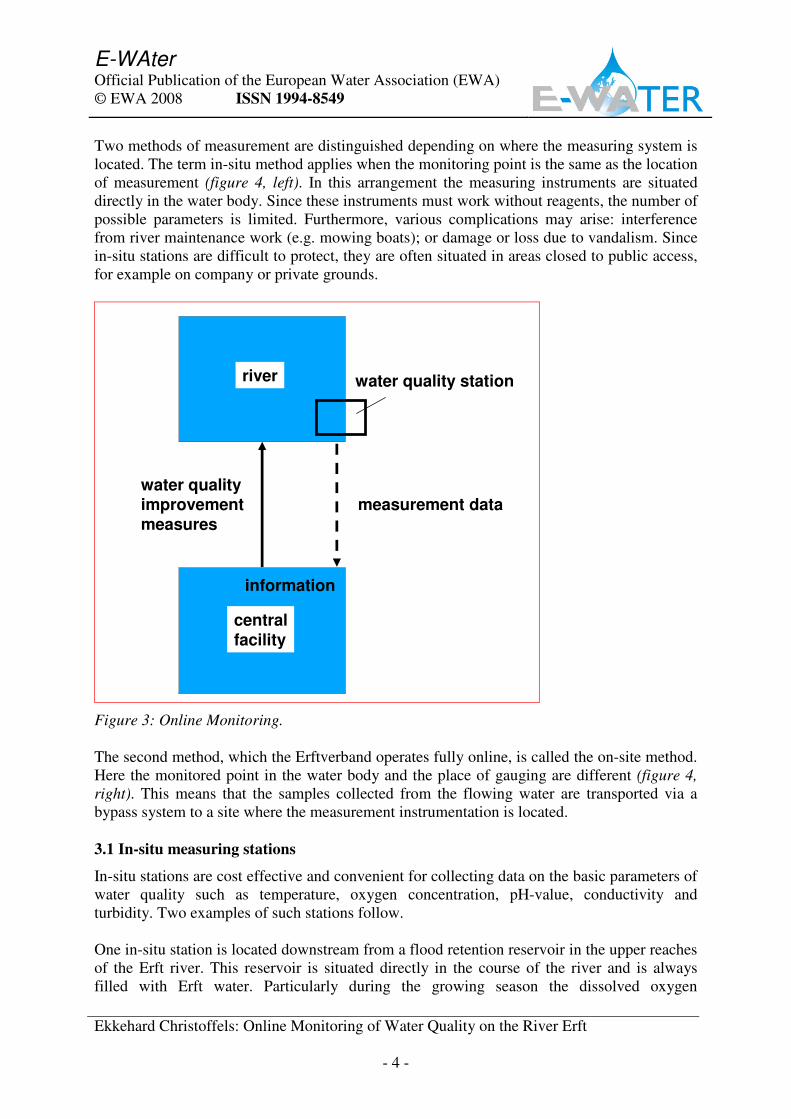
3. Online Monitoring
For a number of important water-related parameters, data collection stations are established
with computers connected online to central processing facilities e.g. via the standard
telecommunication network (figure 3). Data is then recorded continuously and transmitted
automatically or on demand. At the central facility the measurement data are processed to
yield information needed to assess and if necessary to improve water quality.
E-WAter Official Publication of the European Water Association (EWA)
© EWA 2008 ISSN 1994-8549
Ekkehard Christoffels: Online Monitoring of Water Quality on the River Erft
- 4 -
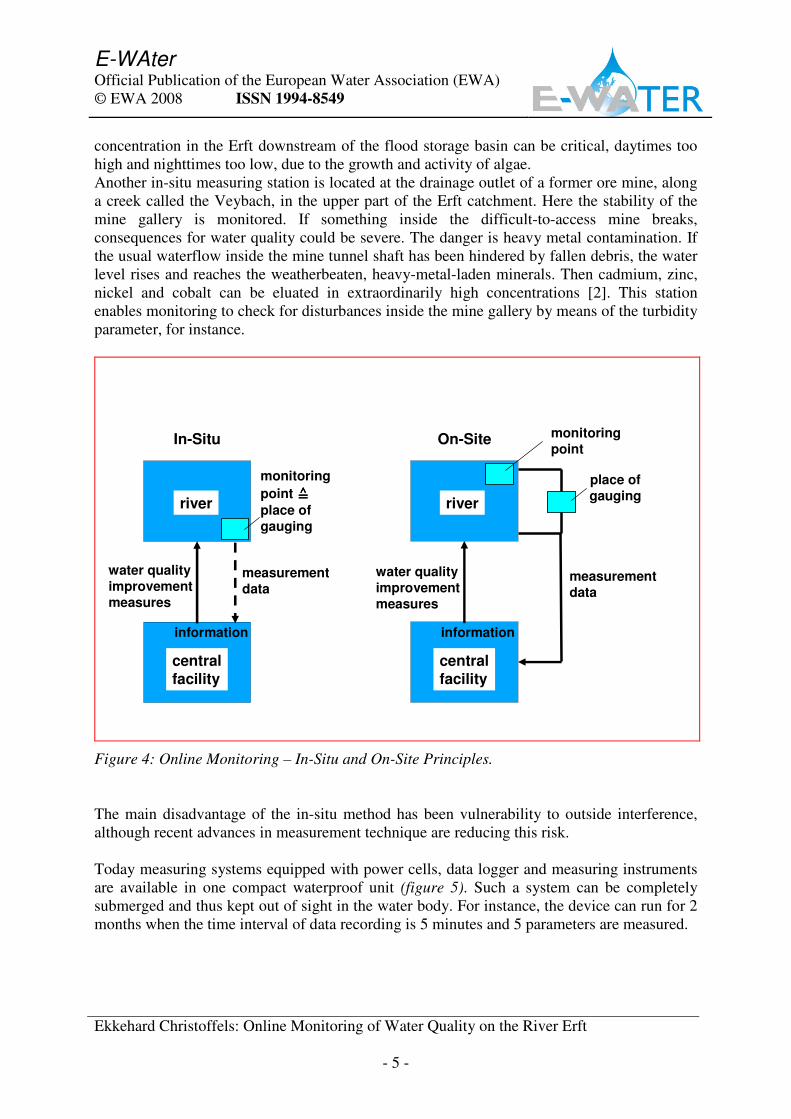
Two methods of measurement are distinguished depending on where the measuring system is
located. The term in-situ method applies when the monitoring point is the same as the location
of measurement (figure 4, left). In this arrangement the measuring instruments are situated
directly in the water body. Since these instruments must work without reagents, the number of
possible parameters is limited. Furthermore, various complications may arise: interference
from river maintenance work (e.g. mowing boats); or damage or loss due to vandalism. Since
in-situ stations are difficult to protect, they are often situated in areas closed to public access,
for example on company or private grounds.
water qualityimprovementmeasures
measurement data
information
water quality station
water qualityimprovementmeasures
measurement data
information
water quality station
centralfacility
river
Figure 3: Online Monitoring.
The second method, which the Erftverband operates fully online, is called the on-site method.
Here the monitored point in the water body and the place of gauging are different (figure 4,
right). This means that the samples collected from the flowing water are transported via a
bypass system to a site where the measurement instrumentation is located.
3.1 In-situ measuring stations
In-situ stations are cost effective and convenient for collecting data on the basic parameters of
water quality such as temperature, oxygen concentration, pH-value, conductivity and
turbidity. Two examples of such stations follow.
One in-situ station is located downstream from a flood retention reservoir in the upper reaches
of the Erft river. This reservoir is situated directly in the course of the river and is always
filled with Erft water. Particularly during the growing season the dissolved oxygen
E-WAter Official Publication of the European Water Association (EWA)
© EWA 2008 ISSN 1994-8549
Ekkehard Christoffels: Online Monitoring of Water Quality on the River Erft
- 5 -
concentration in the Erft downstream of the flood storage basin can be critical, daytimes too
high and nighttimes too low, due to the growth and activity of algae.
Another in-situ measuring station is located at the drainage outlet of a former ore mine, along
a creek called the Veybach, in the upper part of the Erft catchment. Here the stability of the
mine gallery is monitored. If something inside the difficult-to-access mine breaks,
consequences for water quality could be severe. The danger is heavy metal contamination. If
the usual waterflow inside the mine tunnel shaft has been hindered by fallen debris, the water
level rises and reaches the weatherbeaten, heavy-metal-laden minerals. Then cadmium, zinc,
nickel and cobalt can be eluated in extraordinarily high concentrations [2]. This station
enables monitoring to check for disturbances inside the mine gallery by means of the turbidity
parameter, for instance.
water quality
improvement
measures
measurement
data
In-Situ
monitoring
point ≙≙≙≙
place of
gauging
information
water quality
improvement
measures
On-Site
measurement
data
place of
gauging
information
monitoring
point
central
facility
central
facility
river river
water quality
improvement
measures
measurement
data
In-Situ
monitoring
point ≙≙≙≙
place of
gauging
information
water quality
improvement
measures
On-Site
measurement
data
place of
gauging
information
monitoring
point
central
facility
central
facility
river river
Figure 4: Online Monitoring – In-Situ and On-Site Principles.
The main disadvantage of the in-situ method has been vulnerability to outside interference,
although recent advances in measurement technique are reducing this risk.
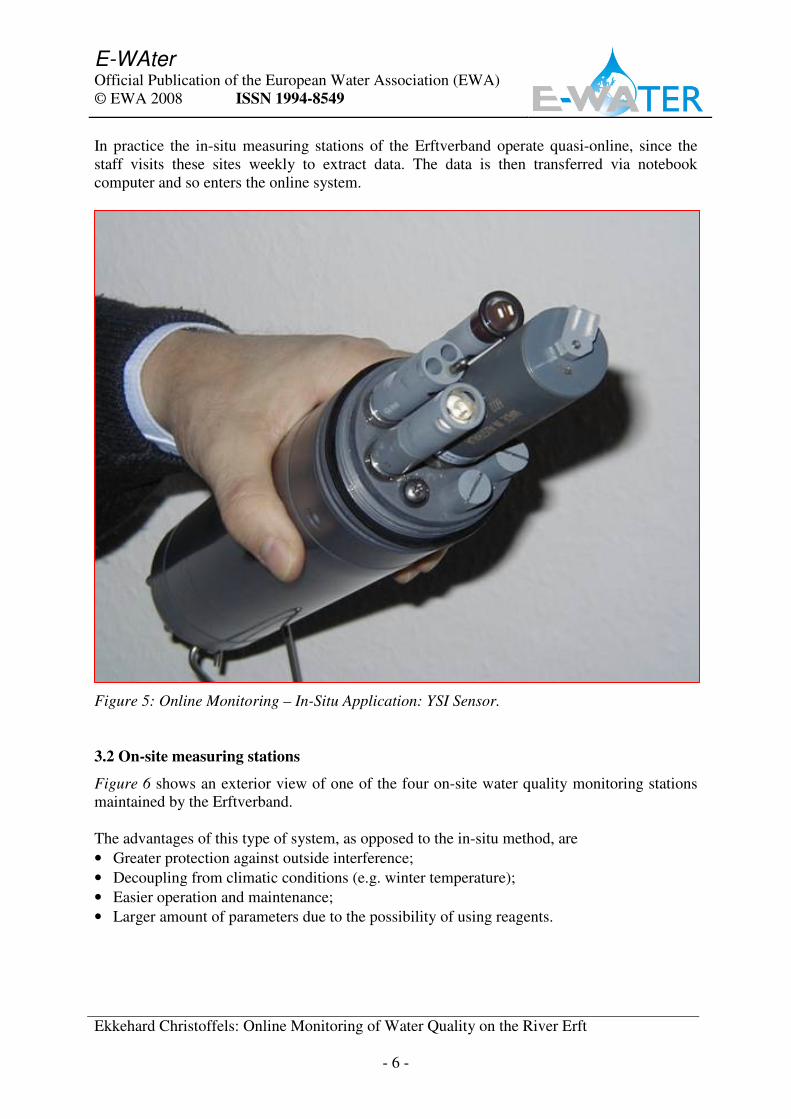
Today measuring systems equipped with power cells, data logger and measuring instruments
are available in one compact waterproof unit (figure 5). Such a system can be completely
submerged and thus kept out of sight in the water body. For instance, the device can run for 2
months when the time interval of data recording is 5 minutes and 5 parameters are measured.
E-WAter Official Publication of the European Water Association (EWA)
© EWA 2008 ISSN 1994-8549
Ekkehard Christoffels: Online Monitoring of Water Quality on the River Erft
- 6 -
In practice the in-situ measuring stations of the Erftverband operate quasi-online, since the
staff visits these sites weekly to extract data. The data is then transferred via notebook
computer and so enters the online system.
Figure 5: Online Monitoring – In-Situ Application: YSI Sensor.
3.2 On-site measuring stations
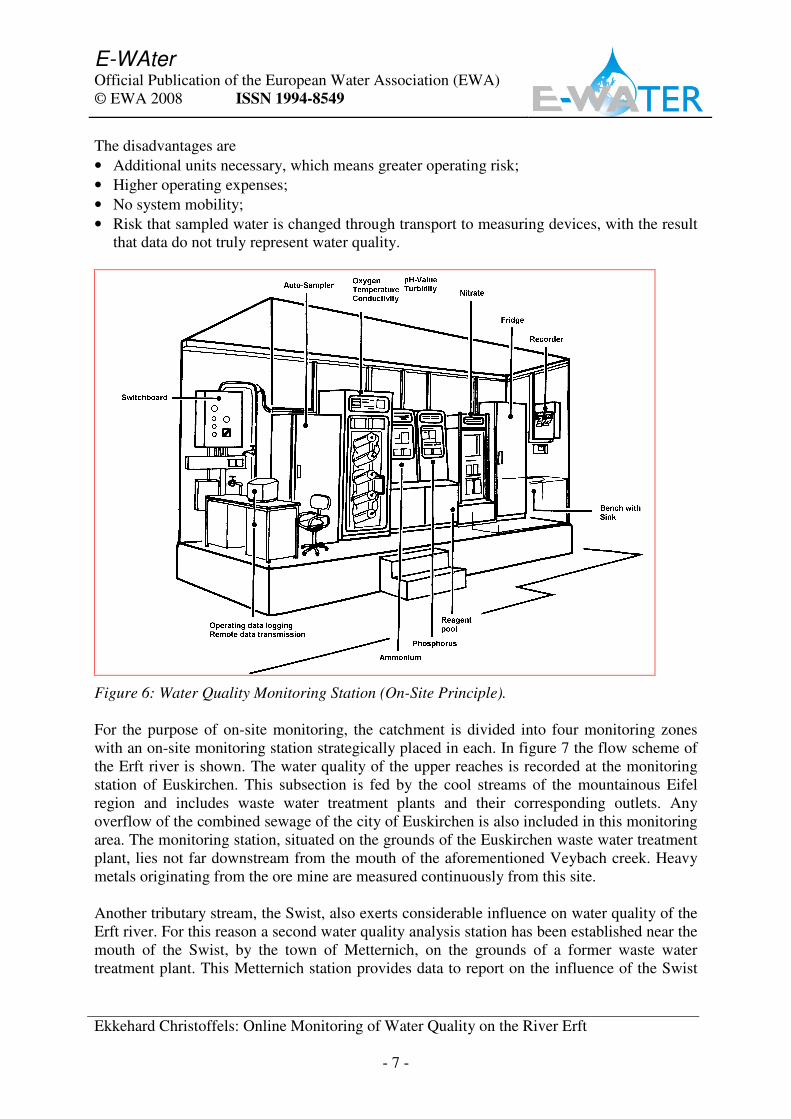
Figure 6 shows an exterior view of one of the four on-site water quality monitoring stations
maintained by the Erftverband.
The advantages of this type of system, as opposed to the in-situ method, are
• Greater protection against outside interference;
• Decoupling from climatic conditions (e.g. winter temperature);
• Easier operation and maintenance;
• Larger amount of parameters due to the possibility of using reagents.
E-WAter Official Publication of the European Water Association (EWA)
© EWA 2008 ISSN 1994-8549
Ekkehard Christoffels: Online Monitoring of Water Quality on the River Erft
- 7 -
The disadvantages are
• Additional units necessary, which means greater operating risk;
• Higher operating expenses;
• No system mobility;
• Risk that sampled water is changed through transport to measuring devices, with the result
that data do not truly represent water quality.
Figure 6: Water Quality Monitoring Station (On-Site Principle).
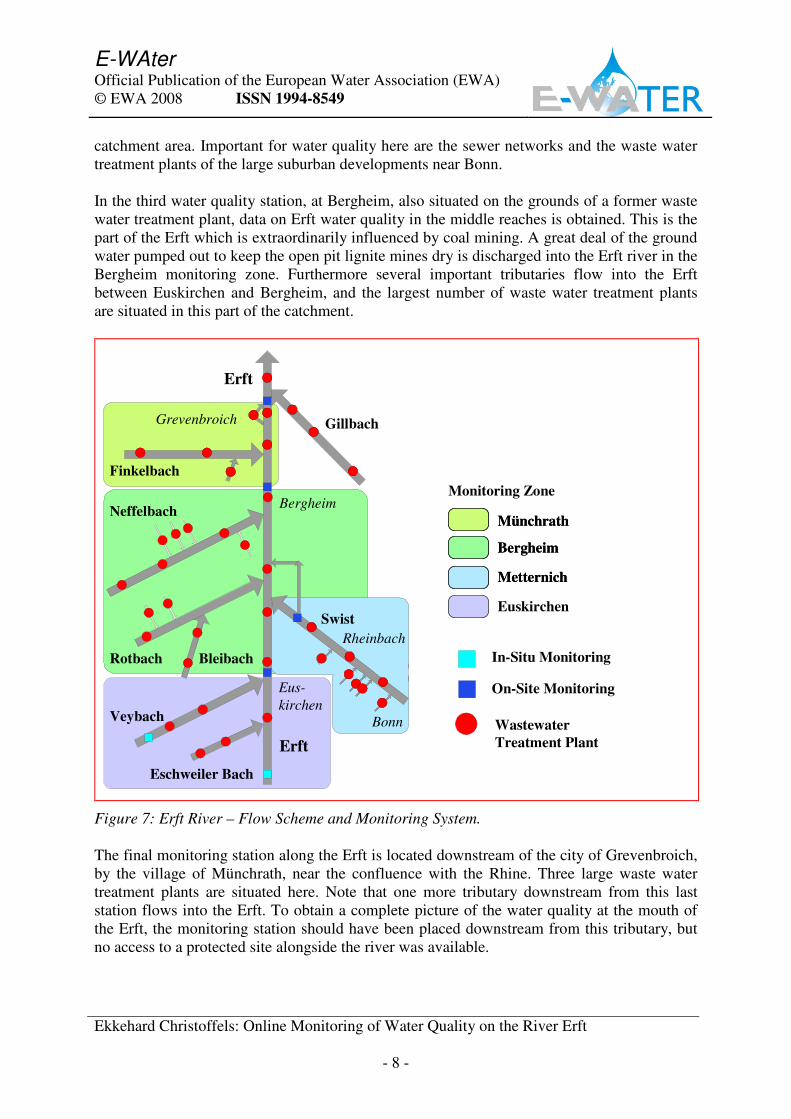
For the purpose of on-site monitoring, the catchment is divided into four monitoring zones
with an on-site monitoring station strategically placed in each. In figure 7 the flow scheme of
the Erft river is shown. The water quality of the upper reaches is recorded at the monitoring
station of Euskirchen. This subsection is fed by the cool streams of the mountainous Eifel
region and includes waste water treatment plants and their corresponding outlets. Any
overflow of the combined sewage of the city of Euskirchen is also included in this monitoring
area. The monitoring station, situated on the grounds of the Euskirchen waste water treatment
plant, lies not far downstream from the mouth of the aforementioned Veybach creek. Heavy
metals originating from the ore mine are measured continuously from this site.
Another tributary stream, the Swist, also exerts considerable influence on water quality of the
Erft river. For this reason a second water quality analysis station has been established near the
mouth of the Swist, by the town of Metternich, on the grounds of a former waste water
treatment plant. This Metternich station provides data to report on the influence of the Swist
E-WAter Official Publication of the European Water Association (EWA)
© EWA 2008 ISSN 1994-8549
Ekkehard Christoffels: Online Monitoring of Water Quality on the River Erft
- 8 -
catchment area. Important for water quality here are the sewer networks and the waste water
treatment plants of the large suburban developments near Bonn.
In the third water quality station, at Bergheim, also situated on the grounds of a former waste
water treatment plant, data on Erft water quality in the middle reaches is obtained. This is the
part of the Erft which is extraordinarily influenced by coal mining. A great deal of the ground
water pumped out to keep the open pit lignite mines dry is discharged into the Erft river in the
Bergheim monitoring zone. Furthermore several important tributaries flow into the Erft
between Euskirchen and Bergheim, and the largest number of waste water treatment plants
are situated in this part of the catchment.
Euskirchen
Münchrath
Bergheim
Metternich
Wastewater
Treatment PlantErft
Swist
Veybach
Eus-
kirchen
Gillbach
Erft
Rheinbach
Bergheim
Grevenbroich
Bonn
In-Situ Monitoring
Neffelbach
Rotbach Bleibach
Finkelbach
Eschweiler Bach
Monitoring Zone
On-Site Monitoring
Euskirchen
MünchrathMünchrath
BergheimBergheim
MetternichMetternich
Wastewater
Treatment PlantErft
Swist
Veybach
Eus-
kirchen
Gillbach
Erft
Rheinbach
Bergheim
Grevenbroich
Bonn
In-Situ Monitoring
Neffelbach
Rotbach Bleibach
Finkelbach
Eschweiler Bach
Monitoring Zone
On-Site Monitoring
Figure 7: Erft River – Flow Scheme and Monitoring System.
The final monitoring station along the Erft is located downstream of the city of Grevenbroich,
by the village of Münchrath, near the confluence with the Rhine. Three large waste water
treatment plants are situated here. Note that one more tributary downstream from this last
station flows into the Erft. To obtain a complete picture of the water quality at the mouth of
the Erft, the monitoring station should have been placed downstream from this tributary, but
no access to a protected site alongside the river was available.
E-WAter Official Publication of the European Water Association (EWA)
© EWA 2008 ISSN 1994-8549
Ekkehard Christoffels: Online Monitoring of Water Quality on the River Erft
- 9 -
All four of these monitoring stations are almost identical in design and selection of
parameters: water and air temperature, oxygen concentration, conductivity, pH-value,
turbidity and the nutrients nitrogen (as nitrate and ammonium) and phosphorus. Additionally,
nickel is measured at the Euskirchen station to take account of the heavy metals from the ore
mine. Moreover, iron is monitored at the Bergheim station due to the possibility of significant
iron concentrations in the discharged ground water, while solar radiation is monitored at the
Metternich station to obtain an overview of the radiation conditions in the river basin.
3. Monitoring techniques
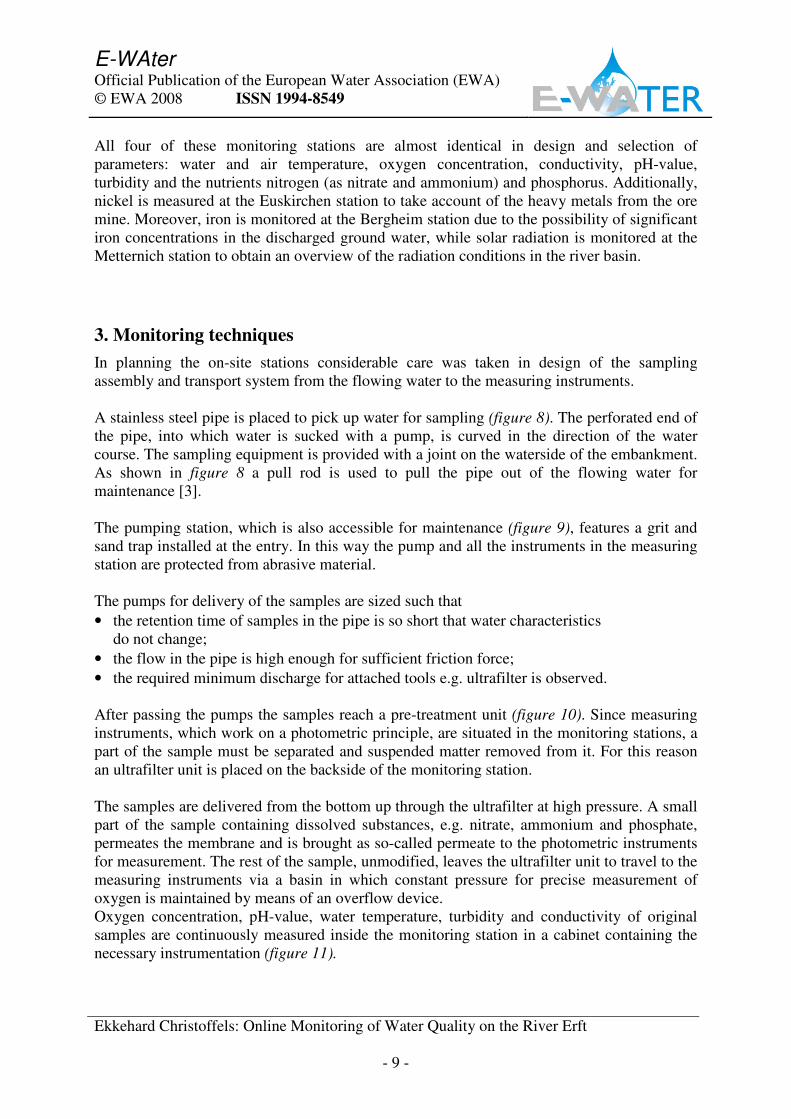
In planning the on-site stations considerable care was taken in design of the sampling
assembly and transport system from the flowing water to the measuring instruments.
A stainless steel pipe is placed to pick up water for sampling (figure 8). The perforated end of
the pipe, into which water is sucked with a pump, is curved in the direction of the water
course. The sampling equipment is provided with a joint on the waterside of the embankment.
As shown in figure 8 a pull rod is used to pull the pipe out of the flowing water for
maintenance [3].
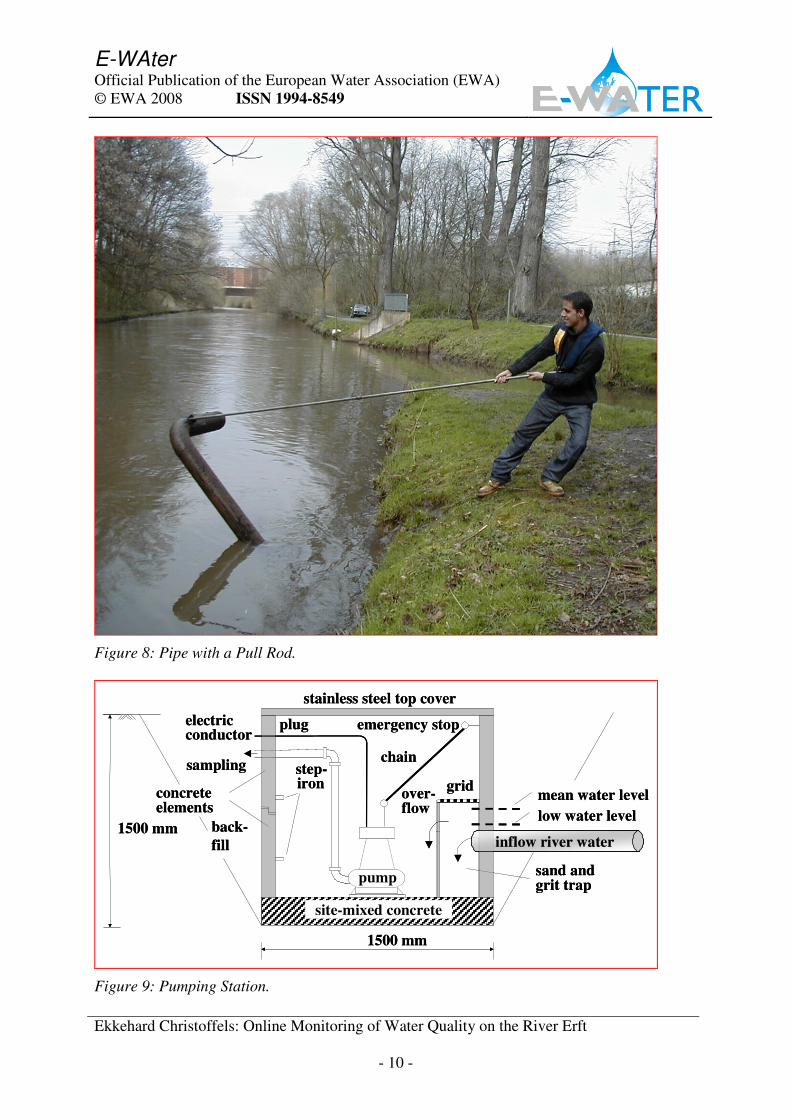
The pumping station, which is also accessible for maintenance (figure 9), features a grit and
sand trap installed at the entry. In this way the pump and all the instruments in the measuring
station are protected from abrasive material.
The pumps for delivery of the samples are sized such that
• the retention time of samples in the pipe is so short that water characteristics
do not change;
• the flow in the pipe is high enough for sufficient friction force;
• the required minimum discharge for attached tools e.g. ultrafilter is observed.
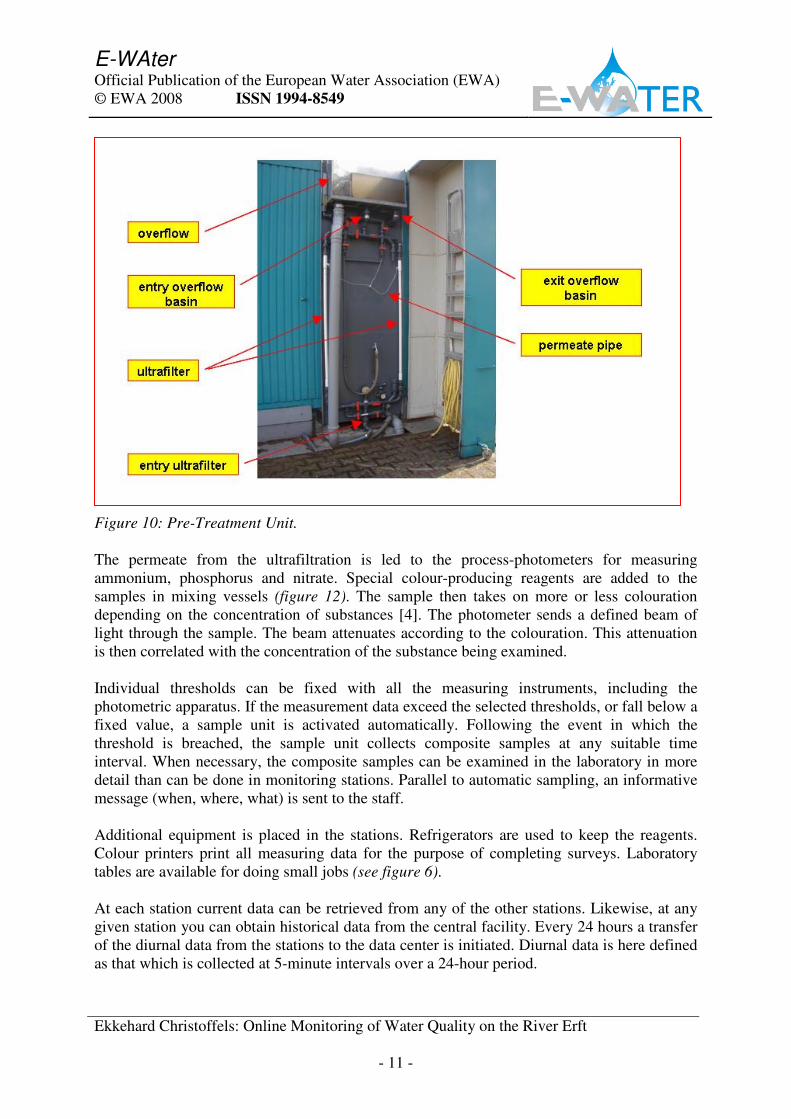
After passing the pumps the samples reach a pre-treatment unit (figure 10). Since measuring
instruments, which work on a photometric principle, are situated in the monitoring stations, a
part of the sample must be separated and suspended matter removed from it. For this reason
an ultrafilter unit is placed on the backside of the monitoring station.
The samples are delivered from the bottom up through the ultrafilter at high pressure. A small
part of the sample containing dissolved substances, e.g. nitrate, ammonium and phosphate,
permeates the membrane and is brought as so-called permeate to the photometric instruments
for measurement. The rest of the sample, unmodified, leaves the ultrafilter unit to travel to the
measuring instruments via a basin in which constant pressure for precise measurement of
oxygen is maintained by means of an overflow device.
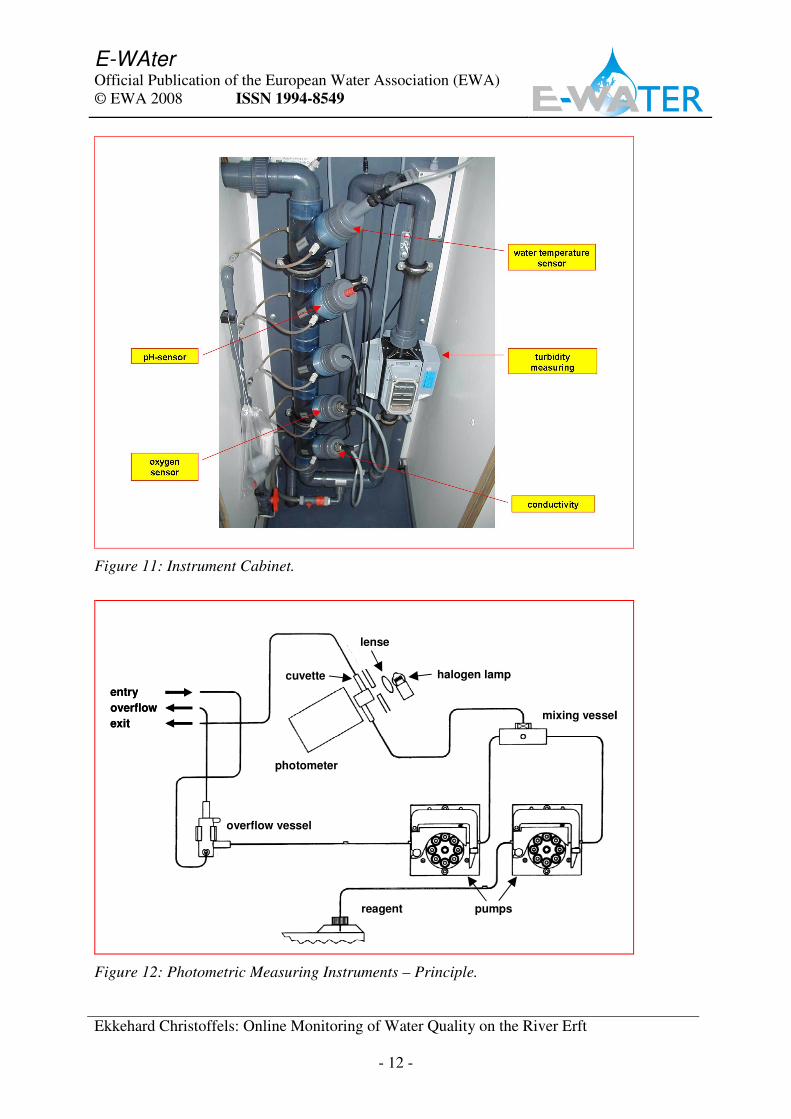
Oxygen concentration, pH-value, water temperature, turbidity and conductivity of original
samples are continuously measured inside the monitoring station in a cabinet containing the
necessary instrumentation (figure 11).
E-WAter Official Publication of the European Water Association (EWA)
© EWA 2008 ISSN 1994-8549
Ekkehard Christoffels: Online Monitoring of Water Quality on the River Erft
- 10 -
Figure 8: Pipe with a Pull Rod.
site-mixed concrete
grid
sand andgrit trap
over-flow
mean water level
low water level
chain
concreteelements
emergency stop
sampling
electricconductor
stainless steel top cover
plug
step-iron
1500 mm
1500 mm
back-
fill
pump
inflow river water
site-mixed concrete
grid
sand andgrit trap
over-flow
mean water level
low water level
chain
concreteelements
emergency stop
sampling
electricconductor
stainless steel top cover
plug
step-iron
1500 mm
1500 mm
back-
fill
pump
inflow river water
Figure 9: Pumping Station.
E-WAter Official Publication of the European Water Association (EWA)
© EWA 2008 ISSN 1994-8549
Ekkehard Christoffels: Online Monitoring of Water Quality on the River Erft
- 11 -
Figure 10: Pre-Treatment Unit.
The permeate from the ultrafiltration is led to the process-photometers for measuring
ammonium, phosphorus and nitrate. Special colour-producing reagents are added to the
samples in mixing vessels (figure 12). The sample then takes on more or less colouration
depending on the concentration of substances [4]. The photometer sends a defined beam of
light through the sample. The beam attenuates according to the colouration. This attenuation
is then correlated with the concentration of the substance being examined.
Individual thresholds can be fixed with all the measuring instruments, including the
photometric apparatus. If the measurement data exceed the selected thresholds, or fall below a
fixed value, a sample unit is activated automatically. Following the event in which the
threshold is breached, the sample unit collects composite samples at any suitable time
interval. When necessary, the composite samples can be examined in the laboratory in more
detail than can be done in monitoring stations. Parallel to automatic sampling, an informative
message (when, where, what) is sent to the staff.
Additional equipment is placed in the stations. Refrigerators are used to keep the reagents.
Colour printers print all measuring data for the purpose of completing surveys. Laboratory
tables are available for doing small jobs (see figure 6).
At each station current data can be retrieved from any of the other stations. Likewise, at any
given station you can obtain historical data from the central facility. Every 24 hours a transfer
of the diurnal data from the stations to the data center is initiated. Diurnal data is here defined
as that which is collected at 5-minute intervals over a 24-hour period.
E-WAter Official Publication of the European Water Association (EWA)
© EWA 2008 ISSN 1994-8549
Ekkehard Christoffels: Online Monitoring of Water Quality on the River Erft
- 12 -
Figure 11: Instrument Cabinet.
entry
overflow
exit
overflow vessel
reagent pumps
photometer
cuvette
lense
halogen lamp
mixing vessel
entry
overflow
exit
overflow vessel
reagent pumps
photometer
cuvette
lense
halogen lamp
mixing vessel
Figure 12: Photometric Measuring Instruments – Principle.
E-WAter Official Publication of the European Water Association (EWA)
© EWA 2008 ISSN 1994-8549
Ekkehard Christoffels: Online Monitoring of Water Quality on the River Erft
- 13 -
4. Results
Some typical examples of data collected during continuous recording of fundamental
parameters via the online monitoring network are presented [5].
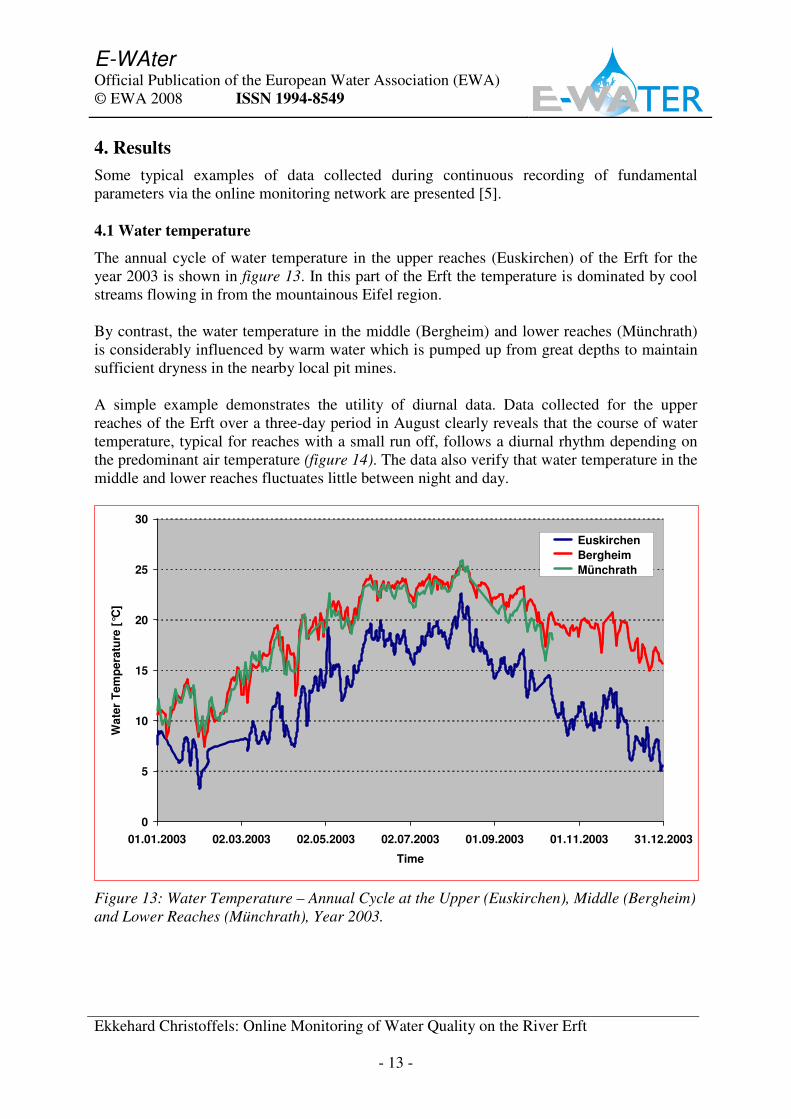
4.1 Water temperature
The annual cycle of water temperature in the upper reaches (Euskirchen) of the Erft for the
year 2003 is shown in figure 13. In this part of the Erft the temperature is dominated by cool
streams flowing in from the mountainous Eifel region.
By contrast, the water temperature in the middle (Bergheim) and lower reaches (Münchrath)
is considerably influenced by warm water which is pumped up from great depths to maintain
sufficient dryness in the nearby local pit mines.
A simple example demonstrates the utility of diurnal data. Data collected for the upper
reaches of the Erft over a three-day period in August clearly reveals that the course of water
temperature, typical for reaches with a small run off, follows a diurnal rhythm depending on
the predominant air temperature (figure 14). The data also verify that water temperature in the
middle and lower reaches fluctuates little between night and day.
0
5
10
15
20
25
30
01.01.2003 02.03.2003 02.05.2003 02.07.2003 01.09.2003 01.11.2003 31.12.2003
Time
Wa
ter
Tem
pera
ture
[°C
]
Euskirchen
Bergheim
Münchrath
Figure 13: Water Temperature – Annual Cycle at the Upper (Euskirchen), Middle (Bergheim)
and Lower Reaches (Münchrath), Year 2003.
E-WAter Official Publication of the European Water Association (EWA)
© EWA 2008 ISSN 1994-8549
Ekkehard Christoffels: Online Monitoring of Water Quality on the River Erft
- 14 -
13
15
17
19
21
23
25
27
00:00 12:00 00:00 12:00 00:00 12:00 00:00
Time
Wa
ter
Te
mp
era
ture
[°C
]
Bergheim
Münchrath
Euskirchen
+ 8.5°C
+ 10°C
+ 5.5°C
+ 7.5°C
6°°h
16°°h
Figure 14: Water Temperature – Diurnal Fluctuations in August at the Upper (Euskirchen),
Middle (Bergheim) and Lower (Münchrath) Reaches, Year 2003.
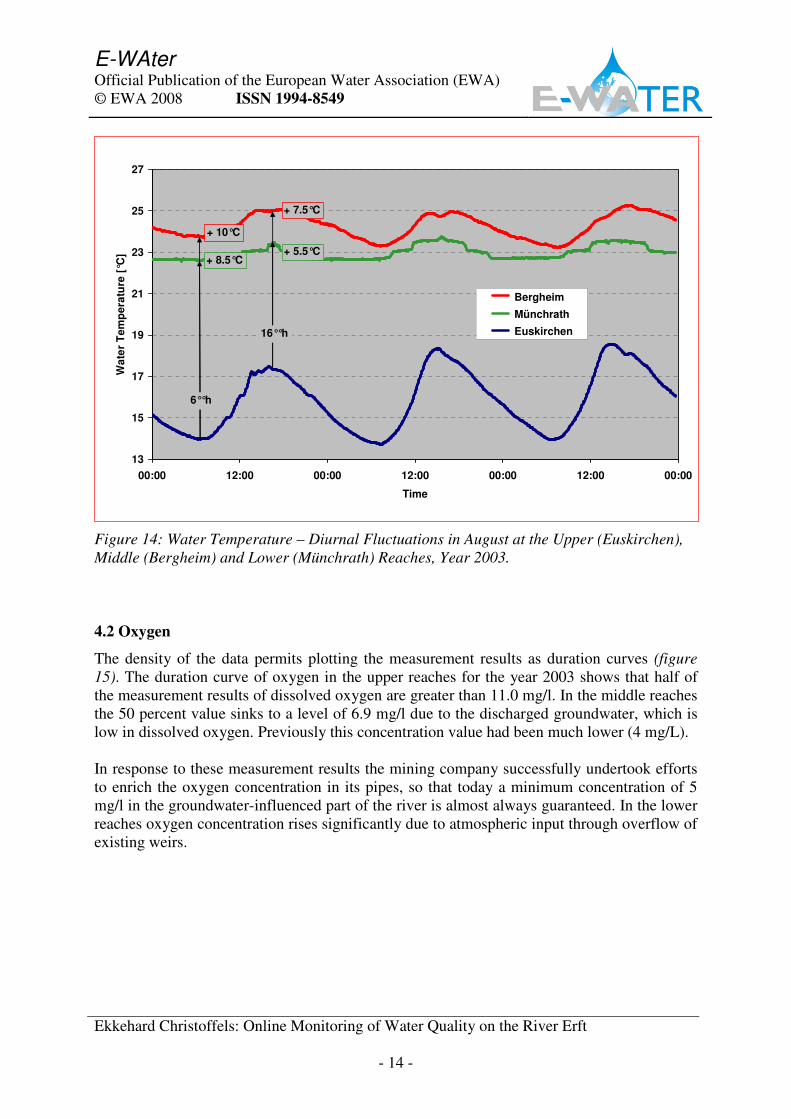
4.2 Oxygen
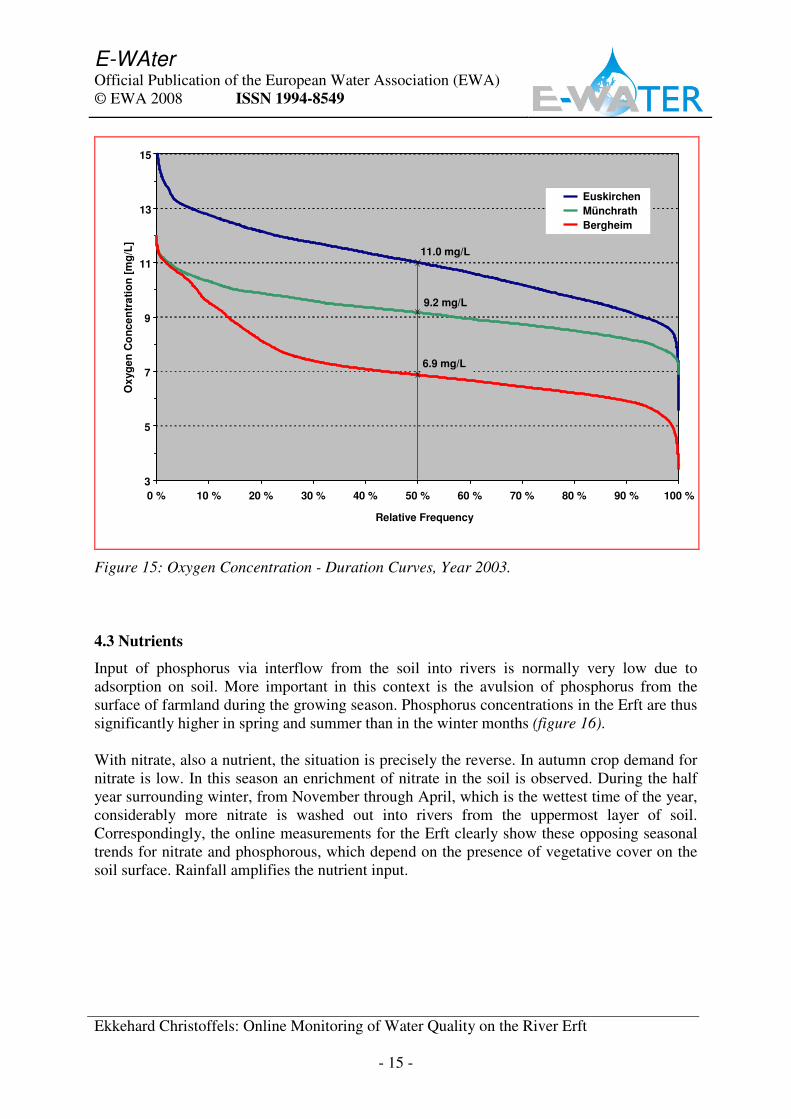
The density of the data permits plotting the measurement results as duration curves (figure
15). The duration curve of oxygen in the upper reaches for the year 2003 shows that half of
the measurement results of dissolved oxygen are greater than 11.0 mg/l. In the middle reaches
the 50 percent value sinks to a level of 6.9 mg/l due to the discharged groundwater, which is
low in dissolved oxygen. Previously this concentration value had been much lower (4 mg/L).
In response to these measurement results the mining company successfully undertook efforts
to enrich the oxygen concentration in its pipes, so that today a minimum concentration of 5
mg/l in the groundwater-influenced part of the river is almost always guaranteed. In the lower
reaches oxygen concentration rises significantly due to atmospheric input through overflow of
existing weirs.
E-WAter Official Publication of the European Water Association (EWA)
© EWA 2008 ISSN 1994-8549
Ekkehard Christoffels: Online Monitoring of Water Quality on the River Erft
- 15 -
6,9 mg/L
9,2 mg/L
11 mg/L
3
5
7
9
11
13
15
0 % 10 % 20 % 30 % 40 % 50 % 60 % 70 % 80 % 90 % 100 %
Ox
yg
en
Co
nc
en
tra
tio
n[m
g/L
]
Euskirchen
Münchrath
Bergheim
11.0 mg/L
9.2 mg/L
6.9 mg/L
Relative Frequency
6,9 mg/L
9,2 mg/L
11 mg/L
3
5
7
9
11
13
15
0 % 10 % 20 % 30 % 40 % 50 % 60 % 70 % 80 % 90 % 100 %
Ox
yg
en
Co
nc
en
tra
tio
n[m
g/L
]
Euskirchen
Münchrath
Bergheim
11.0 mg/L
9.2 mg/L
6.9 mg/L
Relative Frequency
Figure 15: Oxygen Concentration - Duration Curves, Year 2003.
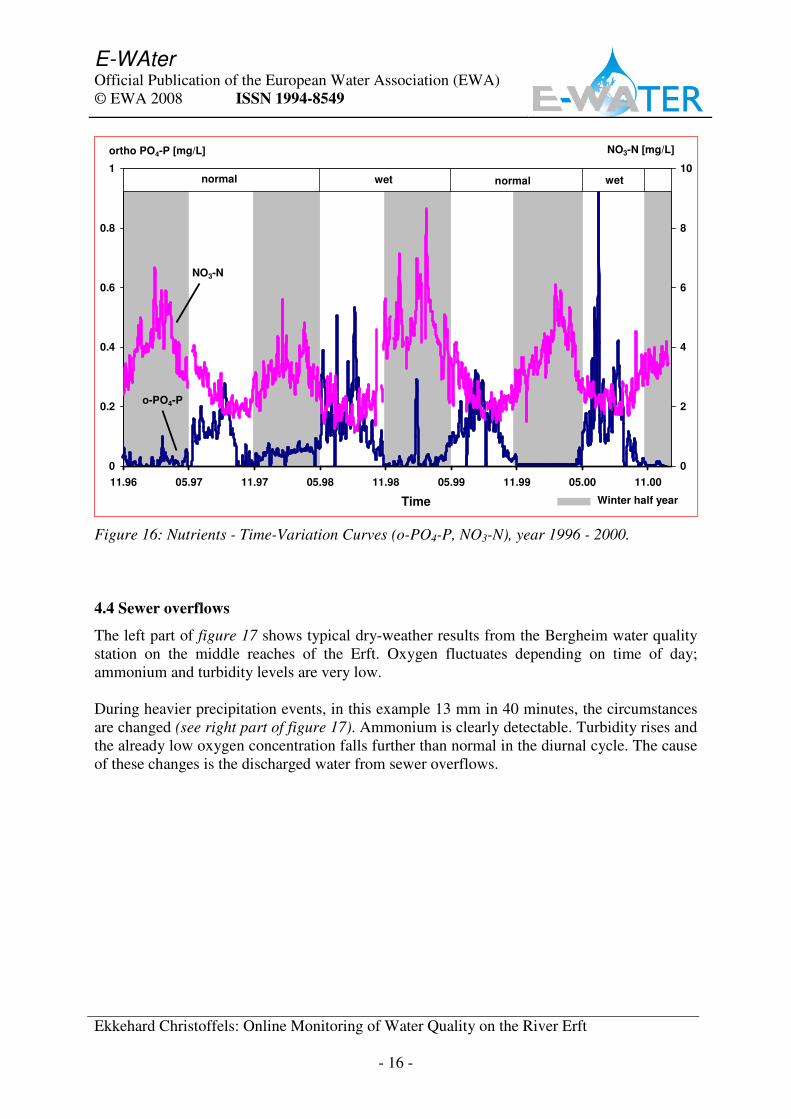
4.3 Nutrients
Input of phosphorus via interflow from the soil into rivers is normally very low due to
adsorption on soil. More important in this context is the avulsion of phosphorus from the
surface of farmland during the growing season. Phosphorus concentrations in the Erft are thus
significantly higher in spring and summer than in the winter months (figure 16).
With nitrate, also a nutrient, the situation is precisely the reverse. In autumn crop demand for
nitrate is low. In this season an enrichment of nitrate in the soil is observed. During the half
year surrounding winter, from November through April, which is the wettest time of the year,
considerably more nitrate is washed out into rivers from the uppermost layer of soil.
Correspondingly, the online measurements for the Erft clearly show these opposing seasonal
trends for nitrate and phosphorous, which depend on the presence of vegetative cover on the
soil surface. Rainfall amplifies the nutrient input.
E-WAter Official Publication of the European Water Association (EWA)
© EWA 2008 ISSN 1994-8549
Ekkehard Christoffels: Online Monitoring of Water Quality on the River Erft
- 16 -
0
0.2
0.4
0.6
0.8
1
11.96 05.97 11.97 05.98 11.98 05.99 11.99 05.00 11.00
0
2
4
6
8
10
NO3-N [mg/L]
Winter half year
wet wetnormal normal
NO3-N
o-PO4-P
Time
ortho PO4-P [mg/L]
Figure 16: Nutrients - Time-Variation Curves (o-PO4-P, NO3-N), year 1996 - 2000.
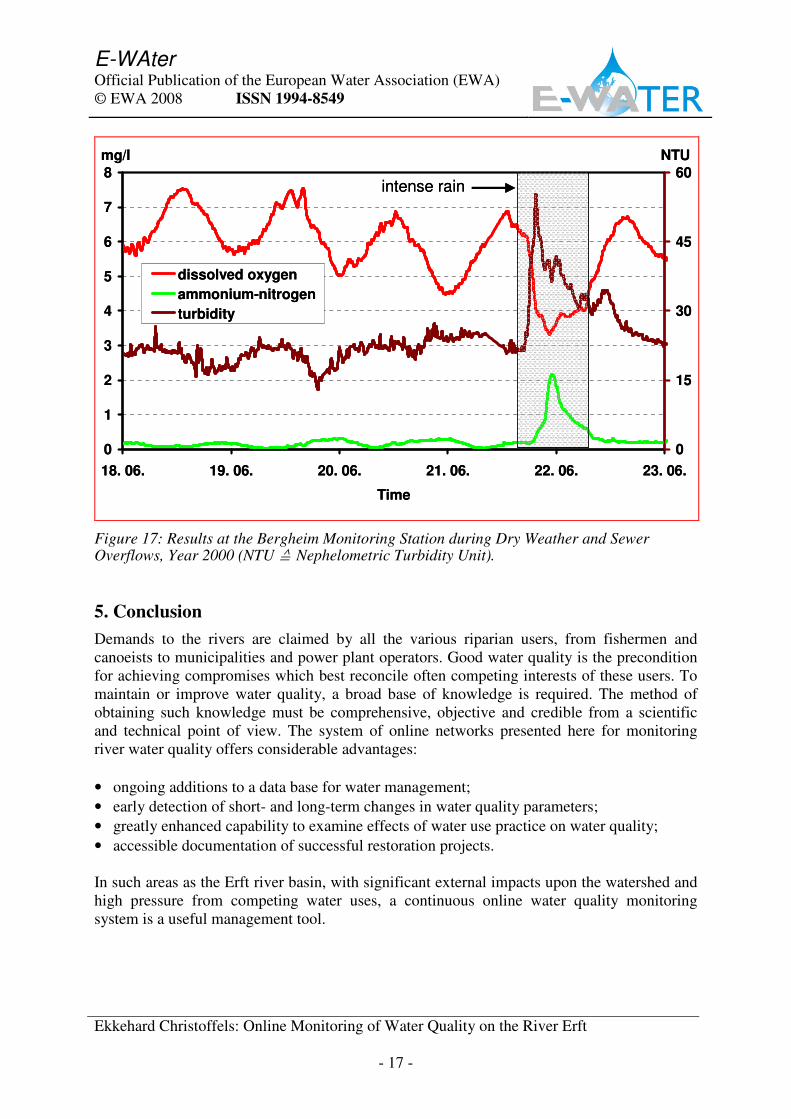
4.4 Sewer overflows
The left part of figure 17 shows typical dry-weather results from the Bergheim water quality
station on the middle reaches of the Erft. Oxygen fluctuates depending on time of day;
ammonium and turbidity levels are very low.
During heavier precipitation events, in this example 13 mm in 40 minutes, the circumstances
are changed (see right part of figure 17). Ammonium is clearly detectable. Turbidity rises and
the already low oxygen concentration falls further than normal in the diurnal cycle. The cause
of these changes is the discharged water from sewer overflows.
E-WAter Official Publication of the European Water Association (EWA)
© EWA 2008 ISSN 1994-8549
Ekkehard Christoffels: Online Monitoring of Water Quality on the River Erft
- 17 -
0
1
2
3
4
5
6
7
8
18. 06. 19. 06. 20. 06. 21. 06. 22. 06. 23. 06.
Time
mg/l
0
15
30
45
60
NTU
dissolved oxygen
ammonium-nitrogen
turbidity
intense rain
0
1
2
3
4
5
6
7
8
18. 06. 19. 06. 20. 06. 21. 06. 22. 06. 23. 06.
Time
mg/l
0
15
30
45
60
NTU
dissolved oxygen
ammonium-nitrogen
turbidity
intense rain
Figure 17: Results at the Bergheim Monitoring Station during Dry Weather and Sewer Overflows, Year 2000 (NTU ≙ Nephelometric Turbidity Unit).
5. Conclusion
Demands to the rivers are claimed by all the various riparian users, from fishermen and
canoeists to municipalities and power plant operators. Good water quality is the precondition
for achieving compromises which best reconcile often competing interests of these users. To
maintain or improve water quality, a broad base of knowledge is required. The method of
obtaining such knowledge must be comprehensive, objective and credible from a scientific
and technical point of view. The system of online networks presented here for monitoring
river water quality offers considerable advantages:
• ongoing additions to a data base for water management;
• early detection of short- and long-term changes in water quality parameters;
• greatly enhanced capability to examine effects of water use practice on water quality;
• accessible documentation of successful restoration projects.
In such areas as the Erft river basin, with significant external impacts upon the watershed and
high pressure from competing water uses, a continuous online water quality monitoring
system is a useful management tool.
E-WAter Official Publication of the European Water Association (EWA)
© EWA 2008 ISSN 1994-8549
Ekkehard Christoffels: Online Monitoring of Water Quality on the River Erft
- 18 -
6. References
[1] Erftverband (2005): Jahresbericht 2005 (Eigenverlag), Bergheim
[2] Schalich J., Schneider F. K., Stadler G. (1986): Die Bleierzlagerstätte Mechernich –
Grundlage des Wohlstandes, Belastung für den Boden, Geologisches Landesamt Nordrhein-
Westfalen, Krefeld 1986, ISSN 0071-8009
[3] Christoffels E. (1992): Gewässergütemessstationen an der Erft mit kontinuierlicher
Erfassung von Wasserinhaltsstoffen, Wasserwirtschaft, Zeitschrift für Wasserwesen und
Technik im Umweltschutz, 82. Jahrgang, 3/92, DVWK Bonn, ISSN 0043-0978
[4] Merkblatt DWA-M 269 (2008): Prozessmessgeräte für Stickstoff, Phosphor und
Kohlenstoff in Abwasserbehandlungsanlagen, Deutsche Vereinigung für Wasserwirtschaft,
Abwasser und Abfall, Hennef, ISBN-10 3940173525
[5] Christoffels, E. (2008): Monitoring und Modellanwendung – Entwicklung eines
Immissionsinventars am Beispiel der Erft, Erftverband Bergheim 2008, ISBN 978-3-00-
024445-2