Embed Size (px)
Citation preview
1
Online Retailers Opening Brick and
Mortar Stores and the Impact on the
Customer Base: The case of NetOnNet.
Marcus Jönsson
Richard Patrini
Nicolò Sammartini
Supervisor: James Sallis
Master’s Thesis 15 credits
Department of Business Studies
Uppsala University
Spring Semester of 2018
Date of Submission: 2018-06-01
Abstract
During recent years, technology has played a crucial role in shaping the retail industry.
Digitalisation and e-commerce are seen as the future of retailing. However, big online retailers
have shown increasing interest in offline shopping by heavily investing in brick and mortar
stores. The strategy of a retailer making use of both offline and online channels is called omni-
channel strategy. This study investigates why online retailers are investing in physical stores
and what is the impact of this decision on their customer base.
The study uses a two-step research. First, a case study on the Swedish retailer NetOnNet is
conducted to confirm the theoretical framework and build the research model. Then, a
quantitative research with questionnaire is used to investigate the impact of an omni-channel
strategy on the consumers’ attitudes towards the retailer. The results show that awareness and
control are the factors most affected by an omni-channel strategy. Instead, having both an online
and offline presence does not have a relevant impact on the factors trust, perceived risk and
personalisation.
Key words: omni-channel, retail industry, online shopping, offline shopping, firm input
variables, firm output variables, customer mediating variables.
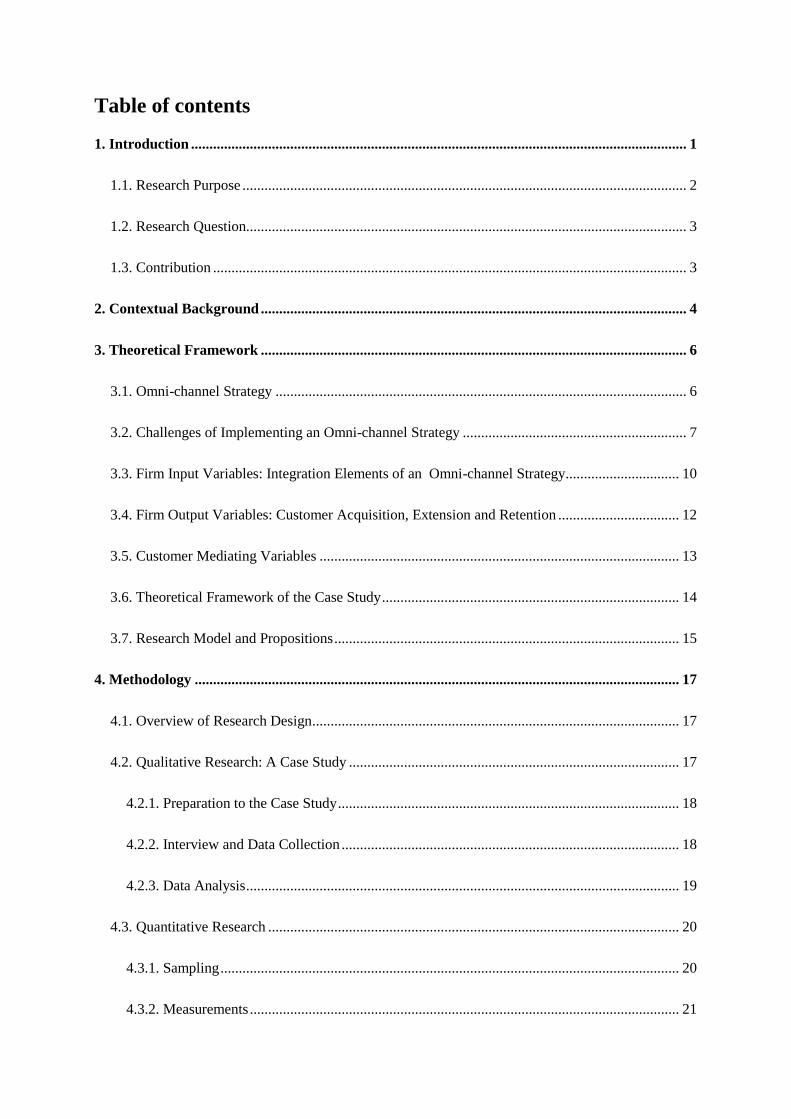
Table of contents
1. Introduction ....................................................................................................................................... 1
1.1. Research Purpose ......................................................................................................................... 2
1.2. Research Question........................................................................................................................ 3
1.3. Contribution ................................................................................................................................. 3
2. Contextual Background .................................................................................................................... 4
3. Theoretical Framework .................................................................................................................... 6
3.1. Omni-channel Strategy ................................................................................................................ 6
3.2. Challenges of Implementing an Omni-channel Strategy ............................................................. 7
3.3. Firm Input Variables: Integration Elements of an Omni-channel Strategy............................... 10
3.4. Firm Output Variables: Customer Acquisition, Extension and Retention ................................. 12
3.5. Customer Mediating Variables .................................................................................................. 13
3.6. Theoretical Framework of the Case Study ................................................................................. 14
3.7. Research Model and Propositions .............................................................................................. 15
4. Methodology .................................................................................................................................... 17
4.1. Overview of Research Design .................................................................................................... 17
4.2. Qualitative Research: A Case Study .......................................................................................... 17
4.2.1. Preparation to the Case Study ............................................................................................. 18
4.2.2. Interview and Data Collection ............................................................................................ 18
4.2.3. Data Analysis ...................................................................................................................... 19
4.3. Quantitative Research ................................................................................................................ 20
4.3.1. Sampling ............................................................................................................................. 20
4.3.2. Measurements ..................................................................................................................... 21
4.3.3. Data Collection and Process ............................................................................................... 24
4.3.4. Choice of Data Analysis ..................................................................................................... 24
5. Results and Analysis ........................................................................................................................ 25
5.1. Results of Qualitative Research ................................................................................................. 25
5.1.1. Firm Input Variables ........................................................................................................... 25
5.1.2. Customer Mediating Variables ........................................................................................... 29
5.1.3. Firm Outcome Variables..................................................................................................... 32
5.2. Results and Analysis of Quantitative Research ......................................................................... 33
5.2.1. Sample Profile .................................................................................................................... 34
5.2.2. Normality Analysis ............................................................................................................. 35
5.2.3. Factor Analysis ................................................................................................................... 36
5.2.4. Reliability ........................................................................................................................... 37
5.2.5. Descriptive Analysis ........................................................................................................... 39
6. Discussion ......................................................................................................................................... 48
6.1. Firm’s Perspective...................................................................................................................... 48
6.2. Customer’s Perspective .............................................................................................................. 49
7. Conclusion ........................................................................................................................................ 56
7.1. Managerial Implications ............................................................................................................ 56
7.2. Limitations and Suggestions for Future Research ..................................................................... 57
References ............................................................................................................................................ 58
Appendix 1: Interview Guide ............................................................................................................. 65
Appendix 2: Questionnaire ................................................................................................................. 66
1
1. Introduction
There is no doubt that in recent years technological trends have changed customers’ shopping
behaviour and digitalisation is shaping the future of the retail market. Online sales grew more
than 10% in 2016 while in the same period the total retail sales growth was just above 1%
(Hodson, Perrigo, & Hardman, 2017). According to Fung Global Retail and Technology, almost
7,000 brick and mortar store closure announcements have been made in the United States alone
during 2017, which is 200% of the previous year (Thomas, 2017). The internet revolution has
led many researchers to study the potential impact of e-commerce on retailing (Steve Burt,
2003; Alba, Lynch, Weitz, Janiszewski, Lutz, Sawyer & Wood, 1997; Petterson,
Balasubramanian, & Bronnenberg, 1997), as well as the business opportunities and challenges
related to the use of internet (Quelch & Klein, 1996). Others have analysed the digitalization
impact on offerings, actors, settings and exchange between retailers and consumers (Hagberg,
Sundstrom, & Egles-Zandén, 2016).
Despite the fact that it is a time when the majority of retailers are moving towards digitalization,
a new trend has emerged. This shows that big online retailers are opening brick and mortar
stores. For example, Amazon, the e-commerce giant, began experimenting with offline stores
in 2015 with the opening of its first bookstore in New York City (Perry, 2017) and recently it
acquired Whole Foods (Turner, Wang, & Soper, 2017). The list of online retailers opening brick
and mortar stores is long, and includes Blue Nile, JustFab, Bonobos, Athleta, Warby Parker,
ModCloth and Casper (Popomaronis, 2017).
Studies have been conducted on this trend, highlighting that, even though online retailing is
growing faster and faster, offline shopping is still relevant. The most common perspective of
this research is based on the customers' point of view on offline retailing and the experience
that brick and mortar stores provide to customers. According to KPMG International (2017),
consumers tend to highly rank the try/touch experience provided by the stores. The two main
reasons why customers shop in stores instead of online are that they want to see/touch the item
and try it before purchasing it. Moreover, the inconvenience of delivery time and shipping costs
associated with online shopping affects the decision of many consumers who prefer to go to the
stores. Also, data from PwC’s Global Consumer Insights Survey from 2018 confirm that
physical shopping is still important to consumers; there has been a growth of weekly brick and
2
mortar shoppers in the last years, from 36% of respondents in 2014 to 44% in 2018 (PwC,
2018).
Furthermore, other scholars have studied the widespread phenomenon of “showrooming”, or
the practice of trying the product in a physical store and buying it online. The advantage of
showrooming is not only associated with saving money according to a study by Gensler, Neslin
and Verhoef (2017). Instead, customers also have a higher perception of the product’s quality
because of the “try before buy” experience. At the same time, they also have the possibility to
avoid queues and waiting time associated with purchases in brick and mortar stores.
Parallel to these studies, there are those that focus on retailers’ strategy towards opening
different channels from which customers can have access to their products. This research refers
to online retailers that open brick and mortar stores and vice versa, and they refer to this
phenomenon as the omni-channel strategy. The omni-channel strategy refers to the practice of
using different channels – online, brick and mortar, telephone, TV etc. – to provide customers
with an integrated experience (Beck & Rygl, 2015). Customers can order online and pick up in
stores, compare product prices through smartphone apps and download coupons to use in store,
and by this they can take advantage of the different channels offered. According to Aberdeen
Group (TechSee, 2017), a strong omni-channel retail strategy can enable companies to retain
an average of 89% of their customers.
The previous perspectives take into considerations online retailers motives driven by consumer
behaviour for shopping in store and consumer behaviour using different channels. However,
the literature analysing the phenomenon of online retailers opening brick and mortar stores from
a firm perspective is underdeveloped. Therefore, the aim of this paper is to explore the reasons
behind the decision of online retailers to invest in physical stores and its impact on the customer
base.
1.1. Research Purpose
The purpose of this study is to investigate what is driving the decision of online retailers to
invest in brick and mortar stores. The research highlights the benefits and the challenges related
to an omni-channel strategy. Starting from a company perspective analysis of the omni-channel
strategy, the main drivers involved in the implementation of an omni-channel strategy are
3
identified. Then, the customer perspective is taken into account by investigating what are the
main factors that lead the customers to purchase from a retailer with an omni-channel strategy.
1.2. Research Question
The study aims to answer the following research questions:
Why do online retailers invest in brick and mortar stores? What is the impact of this decision
on the customer’s attitudes towards the company?
1.3. Contribution
This paper contributes to the previous literature on omni-channel strategy. First, it investigates
from a company perspective the reasons for an online retailer to invest in physical stores and
its impact on the customer base. Second, it analyses from a customer perspective what factors
are the most affected by the use of an omni-channel strategy. The research is based on a case
study on the Swedish online retailer NetOnNet.
4
2. Contextual Background
Our research is built on a case study based on the Swedish retailer NetOnNet.
NetOnNet AB was founded on March 10, 1999 by Roger Sandberg, Anders Halvarsson and
Hans-Krister Andersson. Its operations are based in Borås and it started originally as a pure
online store. However, beginning in 2001 NetOnNet started opening warehouse stores
functioning as physical stores. They also owned online presence in Germany and warehouses
in Munich and Nuremberg, but they left the German market in 2007. Four years later, in
September 2011, Anders Halvarsson retired from NetOnNet. On January 2011, a new owner
came in, Waldir AB, who made a bid worth 171 million SEK. The group as a whole sells
products for entertainment, communication, home and leisure from well-known manufacturers
as well as wholly owned brands. The group engages in sales to consumers and companies
through internet stores in Sweden and Norway, as well as in 34 physical stores in Sweden and
one in Norway.
Foreign affiliates of NetOnNet that operates in Norway are under the NetOnNet NUF branch
that is based in Moss. The group also has a purchasing office in China that helps in purchasing
activities and is operating under the branch NetOnNet Group China office based in Dongguan.
In Hong Kong there is a passive subsidiary of the group. In 2015, the subsidiary Netlogic
entered as part of NetOnNet Group AB during the period between January and May.
In 2015, NetOnNet and SIBA – another large Swedish retailer operating in Sweden, Denmark
and Norway – joined together in a single group, NetOnNet Group. The following year,
NetOnNet began a powerful expansion strategy with the replacement of all SIBA stores with
stores branded NetOnNet. The decision to convert SIBA stores into NetOnNet has entailed
relocation and centralization of SIBA administrative organization to NetOnNet’s central
organization in Borås. The expansion journey continued in 2017 with the opening of new stores
and seven new warehouses. NetOnNet has double its warehouse stores in the last year and a
half.
According to the Swedish Brand Awards, NetOnNet had the strongest product market in
consumer electronic in September 2016. The company had also obtained the highest rating in
“Cheapest” and “Favourite Brands” industry according Dagens Media on April 2016. This

5
provides a strong position in the Nordic market for NetOnNet since more and more consumers
are able to buy and trade through its platform.
NetOnNet Group AB represents the excellent example for what this paper is addressing. Indeed,
NetOnNet was born as a pure online store and it expanded into the offline market only after
two years. Therefore, the company is certainly using an omni-channel strategy, as it is also
openly stated in its annual reports. Moreover, the company accepted to be part of the study, and
the fact that both the company and us were located in Sweden allowed a face-to-face meeting.
6
3. Theoretical Framework
In this section we present a theoretical framework based on the previous literature on
omni-channel strategy and a research model based on propositions formulated after the case
study. First, we introduce the concept of omni-channel strategy and the challenges a company
faces in implementing it. Then, we discuss the elements necessary for the implementation of the
omni-channel strategy at the firm level (firm input variables) and the effect on customer
acquisition, retention and extension (firm output variables). Furthermore, we identify some
customer’s variables (customer mediating variables) that mediate the relationship between the
input and output variables.
3.1. Omni-channel Strategy
The world of retailing has changed dramatically compared to past decades (Verhoef, Kannan,
& Inman, 2015). With the emergence of online retailing and the increasing trend towards
digitalization, most of the retailers have seen themselves forced to change their behaviour and
strategy. These strategies take also into consideration the potential of introducing new channels
into the current channels mix.
Both traditional retailers, born purely offline, and online retailers face the question whether to
be present offline or not (Avery, Steenburgh, Deighton, & Caravella, 2012). Omni-channel
retailing has been the focus of many researchers, in particular the issues of managing customers
across channels, data integration, channels evaluation, allocation of resources across channels
and coordination of channel strategies (Neslin, Grewal, Leghorn, Shankar, Teerling, Thomas &
Verhoef, 2006).
Using an omni-channel retail strategy means providing to the customers different channels for
buying products or getting information related to their purchase (Chopra, 2016). Given the
growing relevance that e-commerce is gaining in retailing, many traditional physical retailers
are adapting themselves to current trend by implementing new distribution systems, which
allow customers to reach their products through different channels. Customers use several
channels during the purchasing process both offline and online, and they easily switch
interchangeably from one channel to the others as if they were one unique channel (van Delft,
2013). However, these channels can have quite different ways of distributing the products and
7
providing customers with product information. Therefore, implementing different distribution
channels together is not easy, and it implies different challenges. These challenges include
several issues, such as where orders should be fulfilled, where customers can return
merchandise, where orders can be picked up, and how delivery and return processes can be
organized (Hübner, Holzapfel, & Kuhn, 2016).
There are four alternatives of omni-channel retailing according to the framework of Bell,
Gallino and Moreno (2014), two offline and two online. Chopra (2016) has described these
further and written that the first offline channel is the traditional retailing with stores where
customers can experience the products and talk with sales agents. Customers then buy the
products in store and take them home right away. The second offline alternative is called
showrooming with home delivery. A showroom is similar to a store with the exception that no
products leave the showroom. Instead, customers can order the products in the showroom or
online and then products are delivered home. This alternative gives customers an opportunity
to experience the products in person and get face-to-face information from a sales agent and at
the same time the company does not need to pay for inventory space.
As far as the online alternatives are concerned, the first one is represented by online information
with home delivery. In this arrangement customers gain information about the products online
and the companies deliver products by mail (Chopra, 2016). The home delivery is expensive
for the companies but having centralised locations for inventory storage cut costs. The other
online alternative is to have online information with pickup in store. In this arrangement
companies avoid the transportation cost for home delivery, but it requires that the pickup
location is convenient for customers.
3.2. Challenges of Implementing an Omni-channel Strategy
Integrating different channels has the potential to create beneficial synergies. However, in order
to achieve those synergies, the company has to address many challenges.
Steinfield, Adelaar, and Lai (2002) identified multiple sources of synergy in an omni-channel
strategy. In the cases they analysed, they recognised that nearly all the companies exploited
common infrastructures, common operations, common marketing and sales forces, and
common buyers in integrating the different channels. Through a successful exploitation of these
synergies, a company can achieve different benefits. Costs savings are realized thanks to an
8
efficient management of the logistics, inventory and distribution. Differentiation is
accomplished through value added services before, during, and after the purchase. Improved
trust is achieved thanks to a lower customer risk and higher brand awareness and
embeddedness. Finally, market extension is based on the ability of reaching a wider spectrum
of geographic markets, product markets, and types of buyers.
In order to achieve synergy benefits, a company implementing an omni-channel strategy has to
achieve integration at many different levels. Saghiri, Wilding, Mena and Bourlakis (2017)
consider integration as one of the main enablers of an omni-channel strategy. The authors argue
that the integration should be consistent between all channel types, all channel agents
(manufacturer, physical retail, digital retail, third parties) and all channel stages (pre-purchase,
payment, delivery, return). Therefore, a company should guarantee integrated promotion before
the purchase; integrated transaction and integrated pricing in the payment stage; integrated
order fulfilment during the delivery; and integrated reverse logistics in case of product return.
Moreover, integrated consumer service and integrated product information must be
implemented during all the stages (Saghiri, et al., 2017).
However, a company has to face multiple challenges before effectively implementing an
omni-channel strategy and benefitting of the synergies mentioned before. Picot-Coupey, Huré
and Piveteau (2016) investigated the challenges for a retailer synchronizing online with offline
shopping into an omni-channel perspective. They categorised the challenges into strategy-
related and development-related.
On one hand, the strategy-related challenges derive from the drastic change on the organisation
associated with the implementation of an omni-channel strategy. Picot-Coupey et al. (2016)
identified five types of challenges within this category. Organisational challenges are related to
the implementation of cross-functional and transversal management and to the merging of
different channels into a unique one. Cultural challenges refer to the shift from a pure online
culture to a mixture of both online and offline culture. This change raises the necessity of
flexibility and cooperation, and of a common and shared internal culture, which focuses only
on the success of the brand. Besides, the integration of different channels determines a higher
organisational complexity. Managerial challenges must be tackled while developing a holistic
approach, in which planning and coordination become key tasks. Finally, the authors identified
also marketing and financial challenges, related to the difficulty of defining a coherent
9
marketing strategy across all channels and to the leverage of financial resources to implement
the operations necessary to overcome all the challenges (Picot-Coupey, et al., 2016).
On the other hand, development-related challenges are associated with the progressing of the
implementation of the omni-channel strategy, and they include three types of challenges (Picot-
Coupey, et al., 2016). The first is the retailing mix, which requires: to homogenise the brand
and the price in accordance to the brand positioning along all the channels; to implement
flexibility in terms of assortment and services to benefit of each channel advantages; to create
a coherent layout of offline and online stores; and to coordinate purchase. Moreover, another
important challenge is related to the Information System (IS). The IS is the means through
which a company can both deliver the consumer a seamless experience and create an internal
flow. The IS challenge is associated with the achievement of synchronisation between the
channels in order to manage effectively information related to the deployment of financial and
staff resources, the inventory management and purchases. Lastly, the CRM challenge addresses
the need to increase the interactions with the customers in order to offer him/her a fluent journey
that delivers value. This can be achieved only by identifying the different journeys a customer
can have while interacting with the company (Picot-Coupey, et al., 2016).
Along with the strategy-related and development-related challenges, Cook (2014) identifies a
further challenge in an omni-channel environment, namely, how to measure individual store
performance. Usually, store performance was measured according to sales, turnover and profit
over the year. However, as the role of the traditional store shifted from point of sale to point of
"try and buy online", or as what is referred as showrooming, conventional measurements of
performance are not reliable anymore to assess the store performance. Stores that result to be
unprofitable using conventional performance measurements, may, in reality, provide
substantial support to the end of the sale process. Metrics need to be adapted in order to capture
the value provided by the contribution of these stores in the role of showroom, distribution hub
and service centre. This could be done by including online, footfall and customers as new
measures for rating the overall performance of the retailer implementing an omni-channel
strategy.
10
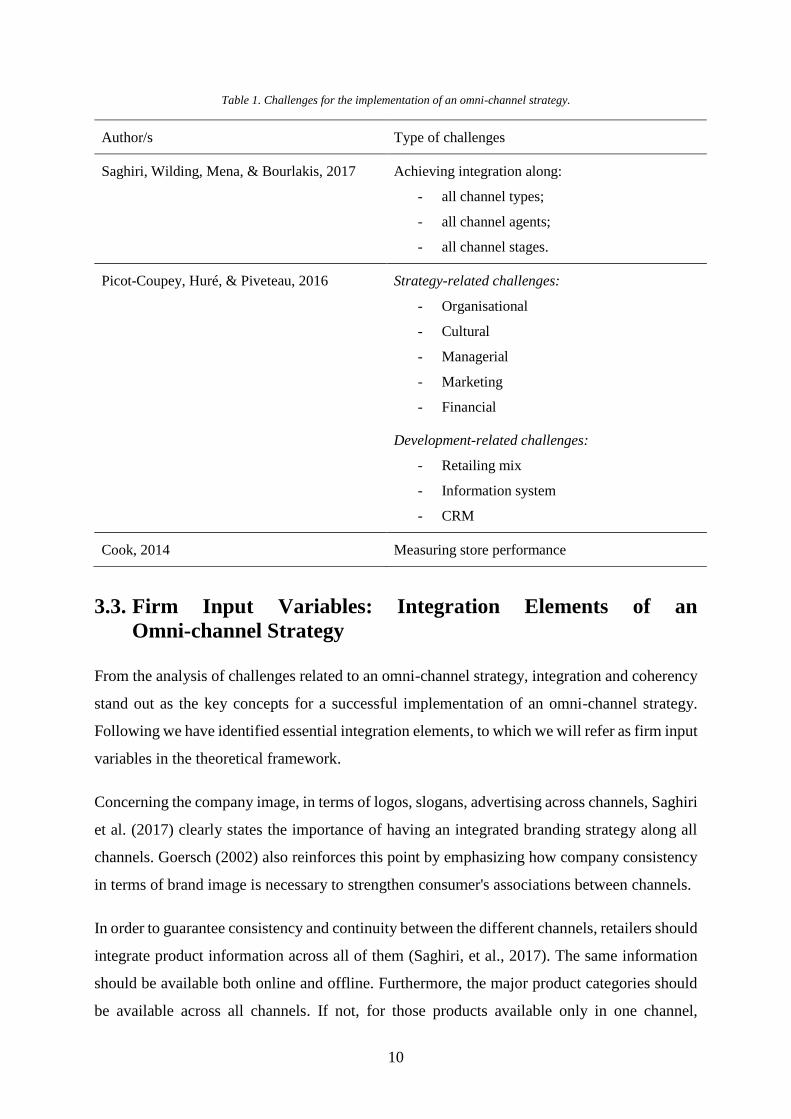
Table 1. Challenges for the implementation of an omni-channel strategy.
Author/s Type of challenges
Saghiri, Wilding, Mena, & Bourlakis, 2017 Achieving integration along:
- all channel types;
- all channel agents;
- all channel stages.
Picot-Coupey, Huré, & Piveteau, 2016 Strategy-related challenges:
- Organisational
- Cultural
- Managerial
- Marketing
- Financial
Development-related challenges:
- Retailing mix
- Information system
- CRM
Cook, 2014 Measuring store performance
3.3. Firm Input Variables: Integration Elements of an
Omni-channel Strategy
From the analysis of challenges related to an omni-channel strategy, integration and coherency
stand out as the key concepts for a successful implementation of an omni-channel strategy.
Following we have identified essential integration elements, to which we will refer as firm input
variables in the theoretical framework.
Concerning the company image, in terms of logos, slogans, advertising across channels, Saghiri
et al. (2017) clearly states the importance of having an integrated branding strategy along all
channels. Goersch (2002) also reinforces this point by emphasizing how company consistency
in terms of brand image is necessary to strengthen consumer's associations between channels.
In order to guarantee consistency and continuity between the different channels, retailers should
integrate product information across all of them (Saghiri, et al., 2017). The same information
should be available both online and offline. Furthermore, the major product categories should
be available across all channels. If not, for those products available only in one channel,
11
information related to them should be accessible from all the channels (Goersch, 2002). The
integration of information should not be limited to benefit the customer’s experience, but it
should also happen internally. Managing information efficiently may contribute to the
anticipation of consumer needs, as well as to the customization of products (Winer, 2001). For
this scope, the implementation of an integrated Information System (IS) is strategic. Collecting
customer data online and utilize them during the final stage of the product development may
increase the level of product personalisation (Picot-Coupey, et al., 2016).
Moreover, Saghiri et al (2017) identify a further variable that affects the coherency between the
different channels, which is the integrated cross-promotion across channels. In other words,
customers usage and awareness of different channels can be increased by providing
cross-channel promotions. For example, offering coupons in one channel that can be used in
another one (Goersch, 2002). The channel cross-promotion can also be implemented through
favouring behaviours like showrooming, which consists of trying a product in a store and
buying it online. Along with an integrated promotion, consistency in the pricing strategy is also
very important in order to offer to the customers the same experience, regardless the channel
they choose (Goersch, 2002).
Creating a cultural integration is very important as well. Picot-Coupey et al. (2016) show how
flexibility and cooperation are crucial to overcome this challenge. Shared values play a crucial
role in the creation of a common culture along all channels. Moreover, those values will be
present across all over the organization so that the customers will have a choerent and
systematic experience in all different channels. Sometimes overcoming the
so-called administrative heritage (Bartlett & Ghoshal, 1987) is a huge task, but it is crucial for
reinforcing the retailer coherent image in front of the customers. Thus, integrating the culture
across the organization represent a key component in the implementation of an omni-channel
strategy.
Finally, integrated logistics is a fundamental element (Saghiri, et al., 2017). In line with an
omni-channel strategy, customers should be able to purchase the merchandise online and return
it to the closest physical location. Or vice versa, they should have the possibility to purchase
the merchandise online and pick it up at the store. Moreover, a company implementing an
omni-channel strategy should also be able to manage efficiently its inventory, between
warehouses and stores, in order to have always the products in the right location. Creating an
12
integrated logistics system, where all channels work together in harmony, is key to successfully
implement an omni-channel strategy.
3.4. Firm Output Variables: Customer Acquisition, Extension and
Retention
There has been a debate between researchers and practitioners on whether a company should
integrate different channels or instead it should maintain them separate. Even though channel
separation has some benefits and channel integration has some challenges, it appears that the
advantages of an integrated strategy overweight its disadvantages (Gulati & Garino, 2000).
The integration of online and offline channels enables synergies between channels that benefit
the customers and ultimately the retailer. Goersch (2002) identifies the retailer’s benefits of an
omni-channel strategy in improved customer acquisition, retention and extension capabilities.
We will refer to these variables as the firm output variables.
These three variables are common to the Customer Relationship Management (CRM) theory.
Indeed, Kalakota and Robinson (1999) have structured CRM in three phases: acquiring new
customers, enhancing the profitability of the existing customers and retaining profitable
customers for life. Acquiring new customers is important to build a customer base. Enhancing
the profitability of the existing customers – to which Goersch (2002) refers as customer
extension – is attained by creating extra value by making current customers buy more or
increase the usage of a product or service. This is achieved by cross-selling and up-selling,
which permit the company to deepen and broaden the relationship with the customers. Finally,
retaining customers is about offering what the customer wants in order to achieve repeated
purchases from him/her.
Even though the integration of different channels can support the three phases of CRM, it is
also important to remember that on one hand a CRM strategy has to implement all the phases,
and on the other hand an omni-channel strategy does not have to support the three goals at the
same time (Goersch, 2002). In order words, CRM strategy is built upon goals of acquiring,
retaining and expanding the customer base, while the omni-channel strategy can impact each
of the three variables independently.
13
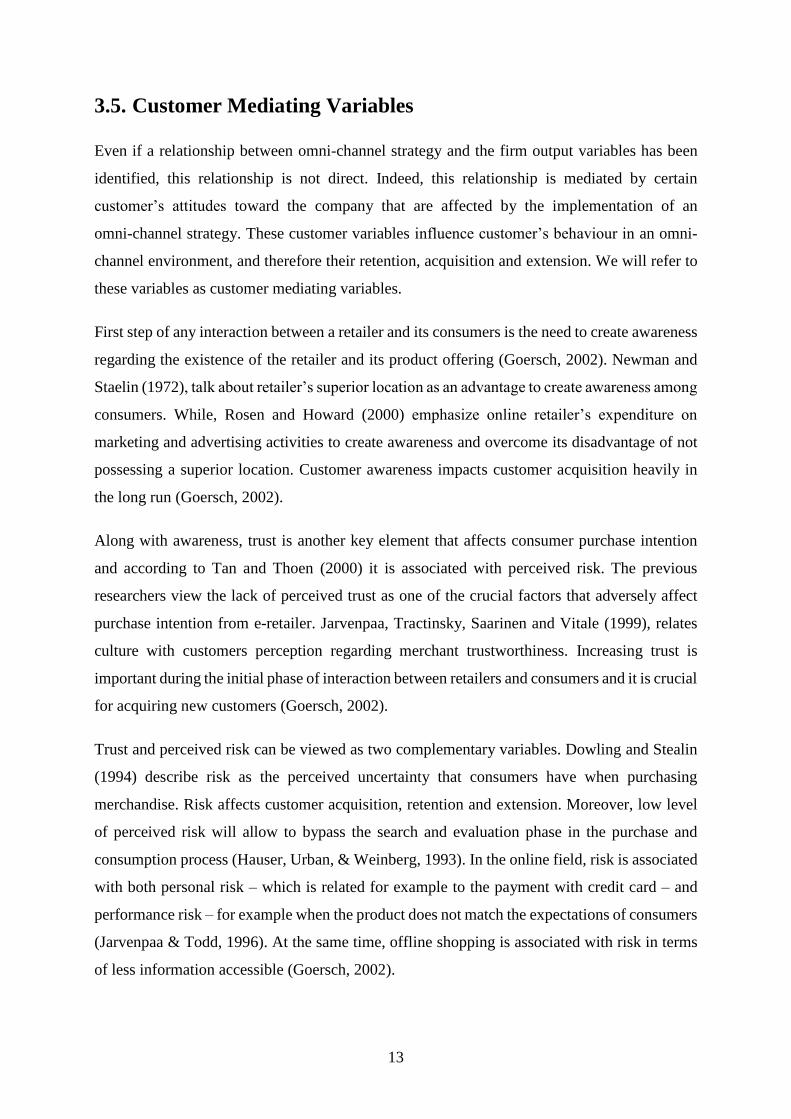
3.5. Customer Mediating Variables
Even if a relationship between omni-channel strategy and the firm output variables has been
identified, this relationship is not direct. Indeed, this relationship is mediated by certain
customer’s attitudes toward the company that are affected by the implementation of an
omni-channel strategy. These customer variables influence customer’s behaviour in an omni-
channel environment, and therefore their retention, acquisition and extension. We will refer to
these variables as customer mediating variables.
First step of any interaction between a retailer and its consumers is the need to create awareness
regarding the existence of the retailer and its product offering (Goersch, 2002). Newman and
Staelin (1972), talk about retailer’s superior location as an advantage to create awareness among
consumers. While, Rosen and Howard (2000) emphasize online retailer’s expenditure on
marketing and advertising activities to create awareness and overcome its disadvantage of not
possessing a superior location. Customer awareness impacts customer acquisition heavily in
the long run (Goersch, 2002).
Along with awareness, trust is another key element that affects consumer purchase intention
and according to Tan and Thoen (2000) it is associated with perceived risk. The previous
researchers view the lack of perceived trust as one of the crucial factors that adversely affect
purchase intention from e-retailer. Jarvenpaa, Tractinsky, Saarinen and Vitale (1999), relates
culture with customers perception regarding merchant trustworthiness. Increasing trust is
important during the initial phase of interaction between retailers and consumers and it is crucial
for acquiring new customers (Goersch, 2002).
Trust and perceived risk can be viewed as two complementary variables. Dowling and Stealin
(1994) describe risk as the perceived uncertainty that consumers have when purchasing
merchandise. Risk affects customer acquisition, retention and extension. Moreover, low level
of perceived risk will allow to bypass the search and evaluation phase in the purchase and
consumption process (Hauser, Urban, & Weinberg, 1993). In the online field, risk is associated
with both personal risk – which is related for example to the payment with credit card – and
performance risk – for example when the product does not match the expectations of consumers
(Jarvenpaa & Todd, 1996). At the same time, offline shopping is associated with risk in terms
of less information accessible (Goersch, 2002).
14
Convenience is another element that influences customer’s attitude in an omni-channel
environment. Szymanski and Hise (2000) consider convenience as one factor affecting
customer satisfaction while shopping. Satisfied customers will positively impact their retention,
acquisition and extension. Convenience implies ease of return items, ease of reaching the
merchant location, ease of collecting information, ease of placing orders, and ease of accessing
pick up locations (Gehrt, Yale, & Lawson, 1996). Overall, convenience means ease to conduct
purchase activities according to customer’s preferences. Along with convenience, perceived
control is another factor associated with customer satisfaction (Bateson, 1985). Offering
different shopping channels may increase consumers perceived control during their purchase
and consumption processes. However, when satisfaction towards a specific channel increases,
the willingness of the same customers to purchase from other channels provided by the same
retailer will decrease (Fornari, Fornari, Grandi, Menegatti, & Hofacker, 2016). This effect is
commonly known as cannibalization or stated in other words, having different channels will
potentially reduce sales in one channel as a result of the introduction of a new channel.
Finally, value-adding activities and supplementary support can contribute to view customers as
final producer of their products (Goersch, 2002). In such a way, customers may play a key role
in the production process, increasing the level of product customization and therefore the
overall level of satisfaction. Innovation toolkits offered through online website are an example
of consumer participation in the production process. From the retailer perspective, taking into
considerations customer’s needs when designing and producing a product would be a plus
(Keeney, 1999). Through multichannel exposure, retailer can gather consumer’s information in
one channel and use that information to tailor their products to consumer needs. This, in turn,
will affect consumer retention and extension. Moreover, collecting consumer information
through different channels may contribute to customer acquisition (Goersch, 2002).
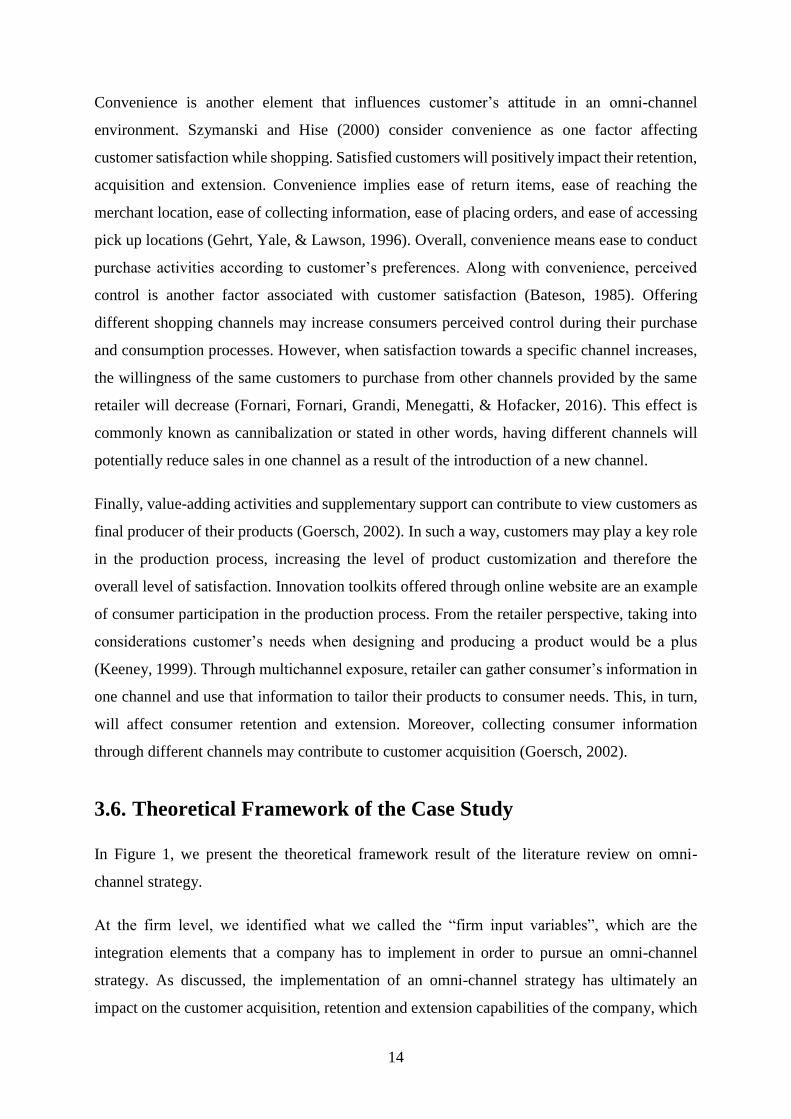
3.6. Theoretical Framework of the Case Study
In Figure 1, we present the theoretical framework result of the literature review on omni-
channel strategy.
At the firm level, we identified what we called the “firm input variables”, which are the
integration elements that a company has to implement in order to pursue an omni-channel
strategy. As discussed, the implementation of an omni-channel strategy has ultimately an
impact on the customer acquisition, retention and extension capabilities of the company, which
15
we identified as “firm output variables”. However, this relationship is mediated by customer’s
attitudes toward that company. We called these attitudes “customer mediating variables”.
Figure 1. Theoretical framework for the omni-channel strategy impact on customer acquisition, extension, and retention.
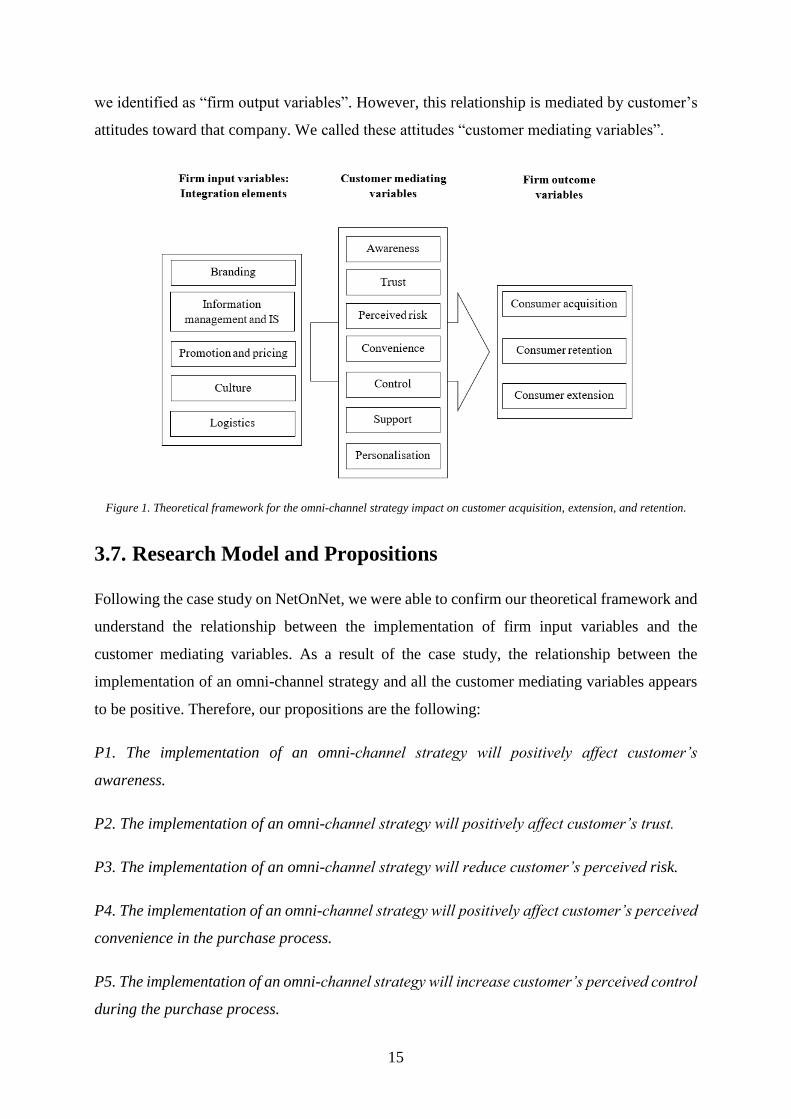
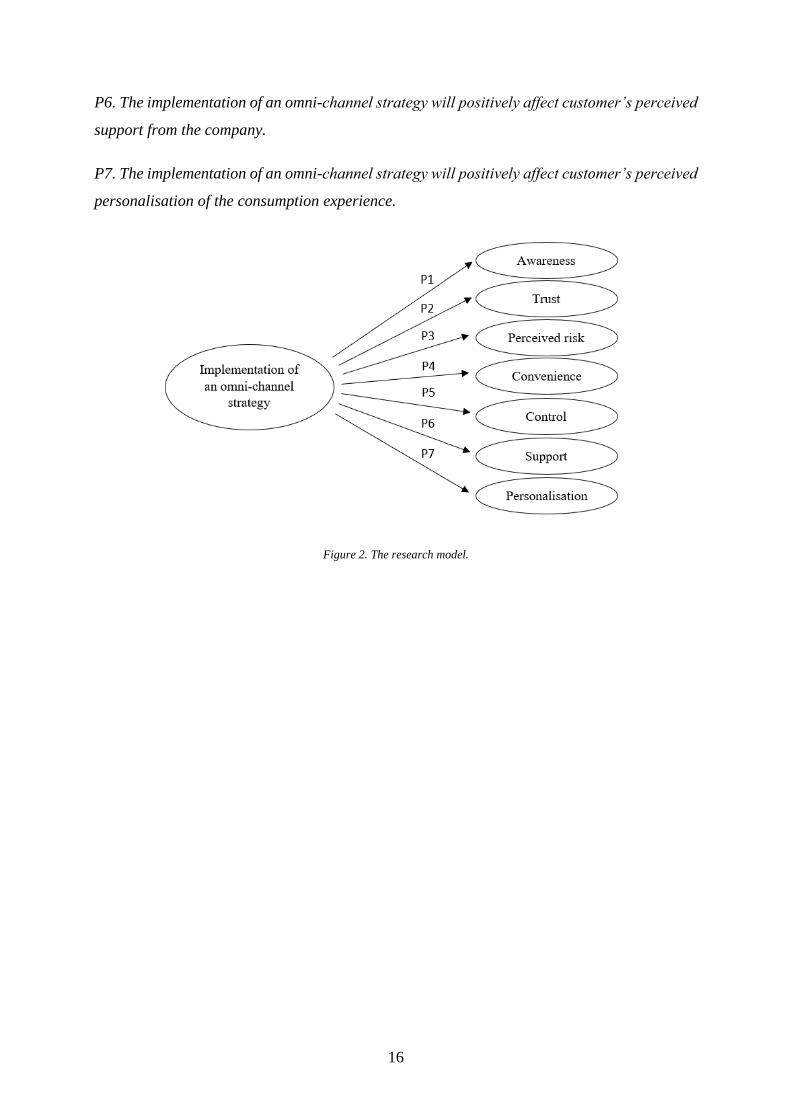
3.7. Research Model and Propositions
Following the case study on NetOnNet, we were able to confirm our theoretical framework and
understand the relationship between the implementation of firm input variables and the
customer mediating variables. As a result of the case study, the relationship between the
implementation of an omni-channel strategy and all the customer mediating variables appears
to be positive. Therefore, our propositions are the following:
P1. The implementation of an omni-channel strategy will positively affect customer’s
awareness.
P2. The implementation of an omni-channel strategy will positively affect customer’s trust.
P3. The implementation of an omni-channel strategy will reduce customer’s perceived risk.
P4. The implementation of an omni-channel strategy will positively affect customer’s perceived
convenience in the purchase process.
P5. The implementation of an omni-channel strategy will increase customer’s perceived control
during the purchase process.
16
P6. The implementation of an omni-channel strategy will positively affect customer’s perceived
support from the company.
P7. The implementation of an omni-channel strategy will positively affect customer’s perceived
personalisation of the consumption experience.
Figure 2. The research model.
17
4. Methodology
In this section, we outline the research method used in order to investigate our research
question. The research method included both qualitative and quantitative research. First, in the
qualitative research part, we introduce the case study and briefly discuss the semi-structured
interview, the data collection and the data analysis. Second, in the quantitative research part,
we present sampling, measurements, data collection and process.
4.1. Overview of Research Design
Because of the nature of the research, we decided to conduct a case study. The online Swedish
retailer NetOnNet fit the description of the company we were looking for – “online retailer that
invested in physical stores” – and, after contacting them, we received their availability to
participate in our study. Therefore, we decided to focus our case study on the Swedish company.
The case study was aimed at confirming the theoretical framework developed after the literature
review.
After that, we conducted a quantitative study through a questionnaire directed to the customers.
Starting from the propositions developed from the qualitative research, the quantitative research
aimed at investigating the relationship between the implementation of an omni-channel strategy
and the customer mediating variables.
4.2. Qualitative Research: A Case Study
Qualitative research refers to “any data collection technique (such as an interview) or data
analysis procedure (such as categorising data) that generates or uses non-numerical data”
(Saunders, Lewis, & Thornhill, 2009, p. 151). A qualitative research strategy mainly promotes
an inductive approach as far as the relationship between theory and research is concerned, and
it places emphasis on the generation of theories (Bryman & Bell, 2011). The semi-structured
interview is a technique often used in qualitative research. It helps to investigate factors that
influence the respondent’s opinions and attitudes, or – as it is the case of this study – to
understand the motives behind a decision taken by the respondent (Saunders, et al., 2009).
18
Given the nature of our research question, we decided that a case study research method was a
good fit. Yin (1994) argues that case study has specific advantages when a “how” or “why”
question is being asked about a contemporary set of events over which the investigator has little
or no control. Moreover, the case study was also appropriate to our research strategy. In a first
stage, we approached the topic with an inductive method, with the aim of developing
measurements, constructs, and theoretical propositions to be later verified, in a second stage,
through a deductive approach (Eisenhardt & Graebner, 2007).
Within the case study, we conducted a semi-structured interview with the CFO of NetOnNet
and augmented the findings with archival data, including publicly available company
information.
4.2.1. Preparation to the Case Study
As described by Eisenhardt (1989), before starting the case study, we defined the research
questions in order to avoid being overwhelmed by the amount of data collected, and we
conducted a literature review so that to help shaping the initial design of our inductive research.
So, in preparation to the case study, we made use of secondary data. The aim of this stage was
to acquire knowledge about the characteristics of an omni-channel strategy, and to investigate
the companies that are currently using it. This research revealed that NetOnNet, Swedish online
retailer, represented a suitable case for our study.
Through research conducted on the company’s annual reports, the fit of NetOnNet was
reinforced since the company publicly stated to have implemented an omni-channel strategy.
Moreover, as detailed in the 2016 annual report, NetOnNet has taken further its commitment
towards the omni-channel strategy. Indeed, the Swedish retailer decided to open NetOnNet
branded shops in the different locations where once there were SIBA branded shops, company
that joined the Group in 2015.
4.2.2. Interview and Data Collection
A key part of the qualitative research was to collect primary data through a semi-structured
face-to-face interview with the CFO of NetOnNet, Annelie Forsberg. We chose the
semi-structured interview because of the exploratory nature of the research and because of the
complex and broad questions we wanted to investigate (Saunders, et al., 2009). Moreover, we
desired to collect the largest amount of detailed data possible.
19
In order to have a fluent discussion without limiting the ability of the respondent to talk, we
posed open questions and we did not follow a specific order with which to introduce the
different concepts. We aimed to keep an open discussion on the subject, as long as all the
concepts identified prior the interview were discussed. To help the interviewer keeping track of
the topics to debate we developed an interview guide (Appendix 1). We structured the interview
guide on the basis of the literature review and the conceptual framework of the study. The
structure of the interview was kept flexible, so that the interviewer had the chance to ask also
questions that were not included in the guide but might have been relevant to explore concepts
mentioned by the interviewee (Bryman & Bell, 2011).
The interview was held in Swedish to make the interviewee more comfortable and permit her
to express herself in the best way. With the respondent’s permission, the interview was audio
recorded. After the interview, the answers were translated and transcribed in English for data
analysis.
4.2.3. Data Analysis
We implemented the data analysis according to the grounded theory, the most used framework
for the analysis of qualitative data (Bryman & Bell, 2011). Therefore, after the collection of the
data, we have performed the coding phase. Through coding, we have reviewed the transcript of
the interview and labelled component parts that seemed to have particular relevance and
theoretical significance for the topic of the study.
The coding was implemented at different levels, according to the three types of coding
described by Straus and Corbin (1990). The first stage was the open coding, defined as “the
process of breaking down, examining, comparing, conceptualizing and categorizing data”
(Strauss & Corbin, 1990, p. 61), through which we collected recurrent concepts. Later, during
axial coding, the relationships between the concepts were investigated and the concept were
consequently grouped in different categories. Finally, through selective coding, we identified
the core categories; “a core category is the central issue or focus around which all other
categories are integrated” (Bryman & Bell, 2011, p. 578).
In order to obtain a higher level of inter-rater reliability of the study, we decided to first code
the data individually, as suggested by Gwet (2014). After individual coding, we compared and
discussed the results obtained by the different team members.
20
4.3. Quantitative Research
In the data collection and analysis process, quantitative research strategy emphasizes
quantification. It predominantly involves a deductive approach as the relationship between
theory and research is concerned, and it focuses on testing of theories (Bryman & Bell, 2011).
In this study, we decided to use a questionnaire (Appendix 2) to investigate specifically the
relationship between the implementation of an omni-channel strategy and the customer
mediating variables, from a customer perspective. Questionnaires are often used in quantitative
researches. They enable to ask to a large number of respondents the same set of questions
(Saunders, et al., 2009). The aim of the questionnaire was to identify among the customer
mediating variables, the ones that mainly drive customers in their choice of purchasing from a
retailer with an omni-channel strategy.
4.3.1. Sampling
The population of this study did not have any limitation. We decide to use snowball sampling
to select faster our sample from the population (Saunders, et al., 2009). As Saunders, Lewis and
Thornhill (2009) described how to apply a snowball sampling, we initially got in touch with
some friends, and we later provided them the link to our questionnaire. After they completed
the questionnaires we asked them to forward the questionnaire to others of their friends or to
share it on their social media. In such a way, we were able to enlarge our sample size.
A limitation of the snowball sampling is the risk of biases. Indeed, the respondents initially
contacted are likely to forward the questionnaire to people closely related to them (family and
friends) and who are similar to themselves (Lee, 1993). To avoid this problem, we asked them
to send the questionnaire also to people not close to them. Moreover, we also tried to select an
initial pool of respondents with the highest heterogeneity we could achieve.
Considered the limited amount of time and resources we had, we also shared the questionnaire
in our personal Facebook and LinkedIn pages, and in some Facebook groups. Since our target
population did not have any specific limitation, sharing the questionnaire online provided us
with a higher number of respondents without negatively affecting the quality of the responses.
21
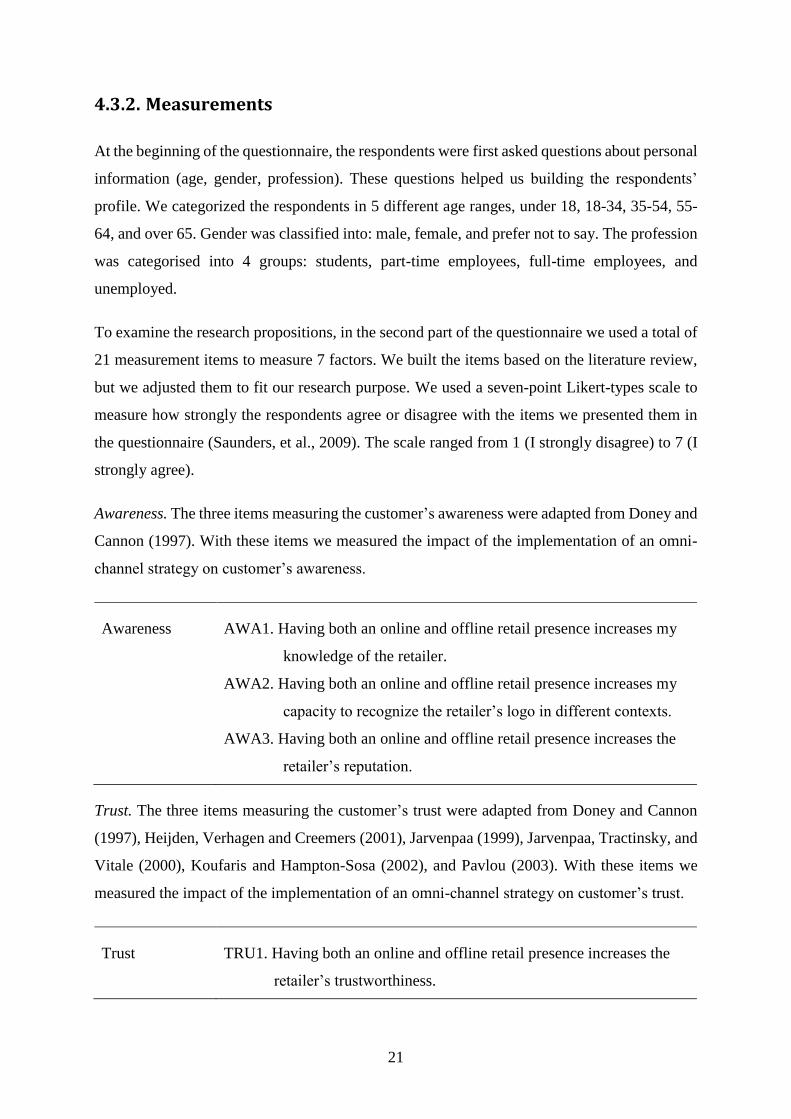
4.3.2. Measurements
At the beginning of the questionnaire, the respondents were first asked questions about personal
information (age, gender, profession). These questions helped us building the respondents’
profile. We categorized the respondents in 5 different age ranges, under 18, 18-34, 35-54, 55-
64, and over 65. Gender was classified into: male, female, and prefer not to say. The profession
was categorised into 4 groups: students, part-time employees, full-time employees, and
unemployed.
To examine the research propositions, in the second part of the questionnaire we used a total of
21 measurement items to measure 7 factors. We built the items based on the literature review,
but we adjusted them to fit our research purpose. We used a seven-point Likert-types scale to
measure how strongly the respondents agree or disagree with the items we presented them in
the questionnaire (Saunders, et al., 2009). The scale ranged from 1 (I strongly disagree) to 7 (I
strongly agree).
Awareness. The three items measuring the customer’s awareness were adapted from Doney and
Cannon (1997). With these items we measured the impact of the implementation of an omni-
channel strategy on customer’s awareness.
Awareness AWA1. Having both an online and offline retail presence increases my
knowledge of the retailer.
AWA2. Having both an online and offline retail presence increases my
capacity to recognize the retailer’s logo in different contexts.
AWA3. Having both an online and offline retail presence increases the
retailer’s reputation.
Trust. The three items measuring the customer’s trust were adapted from Doney and Cannon
(1997), Heijden, Verhagen and Creemers (2001), Jarvenpaa (1999), Jarvenpaa, Tractinsky, and
Vitale (2000), Koufaris and Hampton-Sosa (2002), and Pavlou (2003). With these items we
measured the impact of the implementation of an omni-channel strategy on customer’s trust.
Trust TRU1. Having both an online and offline retail presence increases the
retailer’s trustworthiness.
22
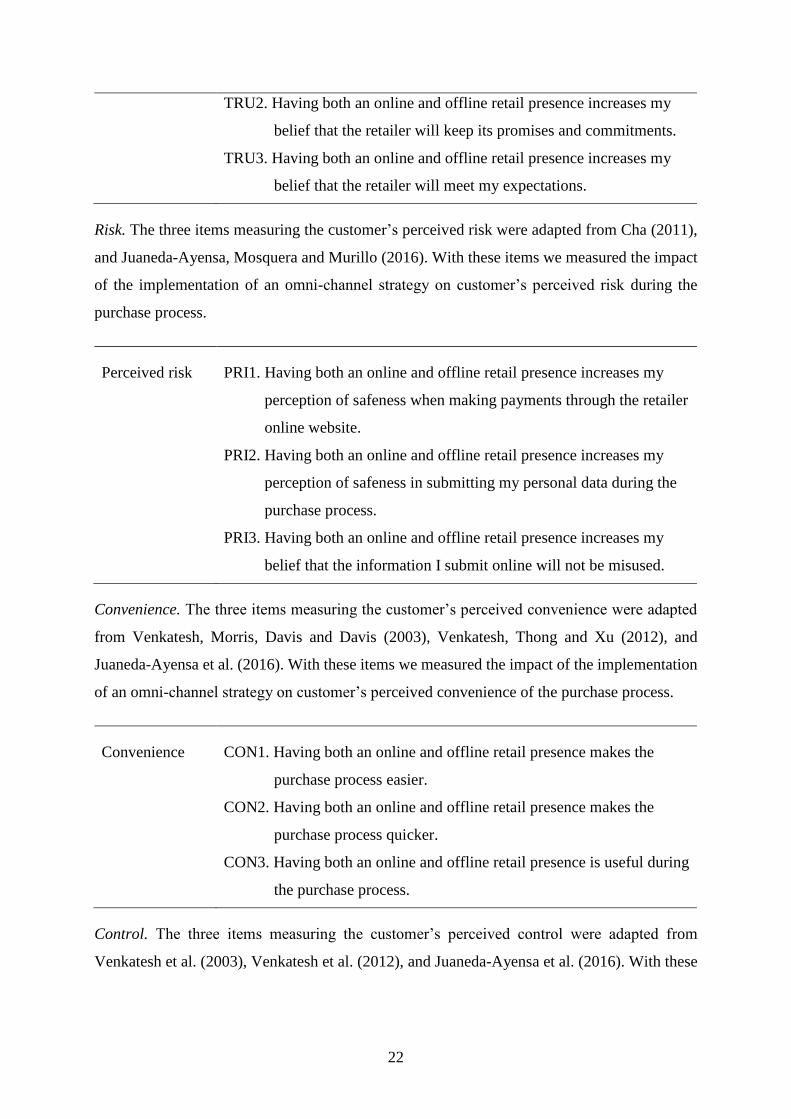
TRU2. Having both an online and offline retail presence increases my
belief that the retailer will keep its promises and commitments.
TRU3. Having both an online and offline retail presence increases my
belief that the retailer will meet my expectations.
Risk. The three items measuring the customer’s perceived risk were adapted from Cha (2011),
and Juaneda-Ayensa, Mosquera and Murillo (2016). With these items we measured the impact
of the implementation of an omni-channel strategy on customer’s perceived risk during the
purchase process.
Perceived risk PRI1. Having both an online and offline retail presence increases my
perception of safeness when making payments through the retailer
online website.
PRI2. Having both an online and offline retail presence increases my
perception of safeness in submitting my personal data during the
purchase process.
PRI3. Having both an online and offline retail presence increases my
belief that the information I submit online will not be misused.
Convenience. The three items measuring the customer’s perceived convenience were adapted
from Venkatesh, Morris, Davis and Davis (2003), Venkatesh, Thong and Xu (2012), and
Juaneda-Ayensa et al. (2016). With these items we measured the impact of the implementation
of an omni-channel strategy on customer’s perceived convenience of the purchase process.
Convenience CON1. Having both an online and offline retail presence makes the
purchase process easier.
CON2. Having both an online and offline retail presence makes the
purchase process quicker.
CON3. Having both an online and offline retail presence is useful during
the purchase process.
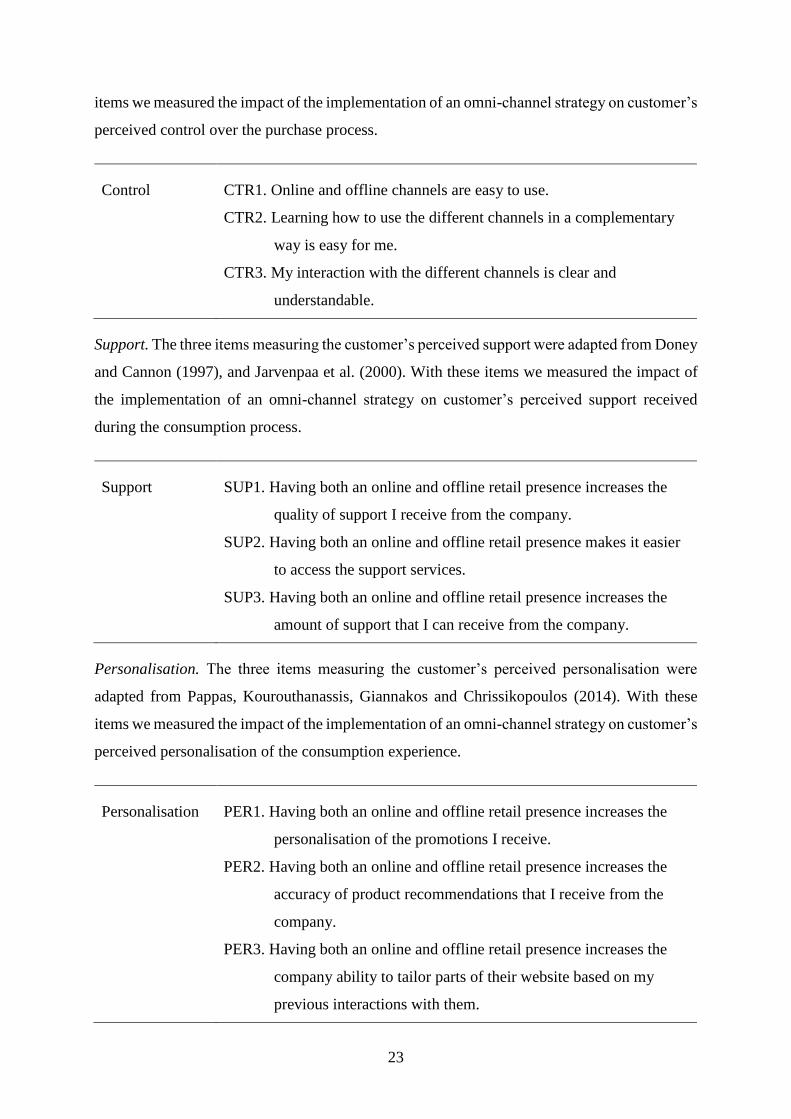
Control. The three items measuring the customer’s perceived control were adapted from
Venkatesh et al. (2003), Venkatesh et al. (2012), and Juaneda-Ayensa et al. (2016). With these
23
items we measured the impact of the implementation of an omni-channel strategy on customer’s
perceived control over the purchase process.
Control CTR1. Online and offline channels are easy to use.
CTR2. Learning how to use the different channels in a complementary
way is easy for me.
CTR3. My interaction with the different channels is clear and
understandable.
Support. The three items measuring the customer’s perceived support were adapted from Doney
and Cannon (1997), and Jarvenpaa et al. (2000). With these items we measured the impact of
the implementation of an omni-channel strategy on customer’s perceived support received
during the consumption process.
Support SUP1. Having both an online and offline retail presence increases the
quality of support I receive from the company.
SUP2. Having both an online and offline retail presence makes it easier
to access the support services.
SUP3. Having both an online and offline retail presence increases the
amount of support that I can receive from the company.
Personalisation. The three items measuring the customer’s perceived personalisation were
adapted from Pappas, Kourouthanassis, Giannakos and Chrissikopoulos (2014). With these
items we measured the impact of the implementation of an omni-channel strategy on customer’s
perceived personalisation of the consumption experience.
Personalisation PER1. Having both an online and offline retail presence increases the
personalisation of the promotions I receive.
PER2. Having both an online and offline retail presence increases the
accuracy of product recommendations that I receive from the
company.
PER3. Having both an online and offline retail presence increases the
company ability to tailor parts of their website based on my
previous interactions with them.
24
Finally, we asked the participants to choose the three elements, out of the seven customer
mediating variables, that mainly drive their choice of purchasing from an omni-channel retailer
rather than a mono-channel retailer. This final question had the aim of identifying the most
relevant customer mediating variables that a retailer implementing an omni-channel might want
to take especially into account.
4.3.3. Data Collection and Process
Based on the population we were addressing, we decided to design a questionnaire in English.
By avoiding translations in other languages, we limited the possibility of misinterpretation of
data from a language to a different one.
Before delivering the questionnaire, first we received positive feedback by our supervisor.
Secondly, we conducted a pilot test with five international people in order to make sure that the
English version of our questionnaire was understandable to everyone.
We decided to use an online questionnaire due to the fact that it could be easily spread in
different locations. Moreover, the use of an online questionnaire limits the amount of errors
because of its automated collection of data (Bryman & Bell, 2011). We created the
questionnaire on Google Forms survey software, which is easily accessible from any device
(laptop, tablet, and mobile). We limited the possibility of multiple responses from the same
respondent by using the specific function of Google Form based on the IP address of each
respondent. The online survey started on May 9th and ended on May 14th, 2018.
4.3.4. Choice of Data Analysis
In order to analyse the data collected with the survey, we decided to first use IBM SPSS
Statistics 22 for the following tasks:
1. descriptive statistics to examine the normality of the responses;
2. factor analysis to test the validity of the construct;
3. reliability analysis to test the internal validity of the measurement items.
Secondly, we decided to continue the analysis with Office Excel 2016. We used descriptive
statistics to determine the importance of each measurement item.
25
5. Results and Analysis
In this chapter we are presenting the results of both the qualitative and quantitative research.
First, the theoretical framework is confirmed by and compared to the results of the case study
on NetOnNet. Through the case study, potential relationships between the firm input variables
of an omni-channel strategy and the customer mediating variables are investigated, as well as
their impact on the firm output variables. Then, through the results of the quantitative analysis
we investigate whether the findings obtained with the case study are consistent with the
consumer perspective.
5.1. Results of Qualitative Research
In the interview with the CFO of NetOnNet, which took place on April 25,2018, we have tested
the theoretical framework. During the interview, we have tried to be as impartial as possible
regarding the omni-channel strategy, and its impact on a retailer and its customer base. Once
noticed an extremely positive opinion of the CFO regarding the subject, we tried to ask her
explicitly the disadvantages of such a strategy. However, she could not come up with any.
5.1.1. Firm Input Variables
Integrated Branding
According to Annelie Forsberg, NetOnNet is investing a lot in TV commercial and social media
to advertise NetOnNet’s commitment of being available where the customers prefer, both
online and offline. This strategy is aimed at installing in customers’ mind the existence of both
an online platform and physical stores of NetOnNet, which allow consumers to positively
associate NetOnNet logos and slogans with both type of channel.
“That [new commercial in episodes] exists to stress that we are available where you want,
both in store and online. And the next sweep will come now in a couple of weeks. There will
be commercial videos broadcasted on YouTube and social media and afterwards also TV
different periods… and that we stress that we are available, where you want when you want.”
NetOnNet has shown the ability of creating an integrated brand once more when in 2016 it took
the decision of converting all the stores branded SIBA, another brand part of the NetOnNet
26
Group, into NetOnNet branded stores. This decision aimed at strengthening NetOnNet brand
in the offline channel. At the same time, it has contributed to align the online and offline offering
of the group (NetOnNet Group, 2016).
Integrated Information Management and IS
During the interview, the importance of integrated information management was also
highlighted. In order to offer a consistent experience along all channels, NetOnNet has to give
access to the same information in all of them.
“We have built all our warehouse stores with stations where the customer also can find
information about different categories.”
NetOnNet CFO also mentioned the importance and the challenge of having an integrated
Information System, not just for customer’s benefit but also for an efficient management of the
information across the channels.
“That information where we look at what the customers have already bought, we try to use
and send out specific offers from. You bought this a couple of month ago. You are probably
interested in this now."
" We have a customer loyalty programme, and now comes the new rules with GDPR, which
results in that you need to be very careful about how you transfer and connect information,
what you save, and how you sort out."
NetOnNet ability to integrate information across channel is, for example, shown by the
possibility for customers to check online the availability of products in store. Moreover, the
Swedish retailer gives its customers also the opportunity to book from the webpage products
they find available in the store for 24 hours.
Besides, NetOnNet use an integrated Information System that collect and manage data across
all channels. For example, as can be seen from their website, customers, by logging in in their
personal page, can also check their purchase history. Furthermore, a customer purchasing a
product online and deciding to pick it up in a warehouse store, will need only to show a valid
ID at the store for registering the purchase. All this is made possible by an extremely advanced
and automated IT system, which was recently improved further through the implementation of
IFS Applications within the whole organisation (IFS Corporate Marketing, 2018).
27
Integrated Promotion and Pricing
Integrating different channels, so that they complement each other, is part of NetOnNet strategy
as can be understood from Annelie Forsberg’s words. Basically, NetOnNet offers its customers
the possibility to try the products in store and then buy it online. In such a way, it allows the
customers to experience the feeling of being in a store and being inspired by the moment to
purchase complement products, rather than just the original one. At the same time, it is upon
the customer’s preference to decide whether to purchase either online, offline or through a
combination of the two.
“Maybe the customer come in to buy a specific product but see something interesting and get
inspired and want to read more about it. And then maybe you do that and then click it home
online. Then you have already experienced it in store.”
NetOnNet is also delivering a consistent experience in all channels by offering the same price
regardless of the channel.
“We have a simple warehouse price and that’s what you get.”
NetOnNet’s commitment to maintaining the same prices online and offline is evident. In the
webpage Prisjakt, customers can find the lowest prices of a product in different stores.
NetOnNet is often ranked as one of the lowest prices, and this price is consistent both in online
and offline channels. At the same time, the company has also committed to achieve a great level
of integration as far as the promotion is concerned. Through the loyalty program, a customer
receives personalised promotions and offers. These are customized according both offline and
online purchases, and they are valid in all the channels.
Integrated Culture
Cultural clash was an issue when NetOnNet started to move from being a pure online retailer
towards opening physical stores. Annelie Forsberg describes the two different models in such
a way:
“There are two different ways to work with the products. It has been in the past. In the
physical flow there have been a lot of concepts inside the warehouse stores – how should it be
presented, how should the products be put for the customers…more focus on that. And in the
e-commerce it has been more digital. How do we get automatic hit for the customer? And
28
Prisjakt. So, there has been two different agendas. Therefore, it has been important to
“marry” these together.”
The integration of the two cultures was also possible thanks to employees working transversally
between the two channels.
“We have partly those who work only with physical stores and work with those questions and
then we have people who work solely online. But then we have people that are behind there
that work with purchasing products for the company, logistics, controlling, market and
suchlike who work in a joint front. And who must have both channels view, so they don’t lose
anything along the way.”
Talking about culture, Annelie Forsberg identified in the culture an important competitive
advantage for NetOnNet over its competitors who started as purely offline players.
“I think it’s easier to start online. [...] I think that to decrease the big cost [of implementing
an omni-channel strategy] it’s easier to start online and then slowly start with stores little at a
time.”
The fact that NetOnNet was born as a pure online retailer gave it the advantage of having
implemented automated systems since the very beginning. Because of that, the company gained
expertise and knowledge as far as the digitalisation of processes is concerned. This kind of
heritage is something missing in competitors starting their journey as pure offline retailer.
Instead, they have to develop these new skills once taken the decision of entering the online
market, and this could require some time given their administrative heritage.
“What is to our advantage is that we have built our whole business around e-commerce.
Hence, we have built in many automatic processes and suchlike for the e-commerce part,
which also has enabled us to keep costs low. Compare with for example many others in the
industry, we have had the lowest costs…so it’s something we are used to.”
“So, we are probably more agile (quick to adapt to changes). But they are of course looking
at these things as well, but we might experience that our flexibility is a little better than what
their flexibility is… we hope anyway.”
In order to guarantee an integrated culture within its employees, NetOnNet strongly emphasises
its values and establishes common goals through continuously updating and improving its
29
strategy. In this way, NetOnNet is able to strengthen its core values and share them among the
organisation.
Integrated Logistics
NetOneNet achieved an integrated logistics system through the integration of online and offline
channels. Moreover, by having people responsible simultaneously of both of them, there is
always someone aware of the “big picture” and how the different channels work together.
Annelie Forsberg mentioned the initial challenges of establishing an integrated logistics
between the two models. She described how with experience and time NetOnNet has succeed
in creating a natural flow within its distribution system and supply chain, allowing customers
to use their different channels for orders, returns, refunds and collection of merchandise.
“The customers also can feel secure to return it at a warehouse store instead of going to a
post office and send it. Then you can bring you TV to the warehouse store instead if there is a
problem instead of sending it.”
NetOnNet shows to have achieved an integrated logistics by offering the customers a totally
integrated experience of online and offline. The product is always in the right place at the right
time, which is made possible by an efficient logistics system that manages online and offline
channels as a single entity.
5.1.2. Customer Mediating Variables
During the interview, Annelie Forsberg has mentioned directly or indirectly all the variables
we have illustrated in our theoretical framework, also highlighting a positive relationship
between NetOnNet’s implementation of its omni-channel strategy and the customer mediating
variables we identified through our literature review.
Awareness
In our model we identified the importance of awareness to attract customers. During the
interview, Annelie Forsberg has highlighted the fact that the omni-channel strategy has had an
impact on customer’s awareness of NetOnNet. She said that the existence of physical stores,
and therefore the presence of NetOnNet signs on the street, increases the customers’ knowledge
of the company. Also, seeing the NetOnNet signs on the street makes NetOnNet become more
top of mind for customers.
30
Annelie Forsberg mentioned the recent event when SIBA shops were replaced with NetOnNet
branded shops. She told us that this decision has increased customers’ awareness of NetOnNet,
and ultimately it had also a positive effect on the e-shoppers in the area where the shops were
opened.
“Now we have become a more known actor in this way. So, we have seen a big advantage
when increasing the numbers of warehouse stores.”
“After we have opened those stores [SIBA stores replaced with NetOnNet branded stores], we
saw the knowledge about NetOnNet has increased.”
Trust
As we presented them in our theoretical framework, also from the semi-structured interview we
have identified a strong relation between trust and perceived risk.
Regarding trust, Annelie Forsberg has frequently mentioned the great importance for NetOnNet
of being trusted by the consumers. In order to achieve trust, the company focuses on the
reliability that the brand gives to the customers, and a big role is played by having honest prices.
NetOnNet pricing strategy is consistent in all channels and its products have often the lowest
prices in the market. Also, NetOnNet has always avoided the promotion of fake prices – for
example offering prices saying that are discounted, while they were actually never higher.
“We have become an established name that customer trust.”
"We have one warehouse price, and it is at Prisjakt and usually it is the lowest"
Perceived risk
As far as the perceived risk is concerned, Annelie Forsberg said that through a higher presence
of physical stores NetOnNet’s customers feel less insecure in purchasing from an online store
they have actually seen in the street. She also mentioned that the possibility of returning a
product to a physical store rather than send it decreases customer’s perceived risk.
“They know that “well, I have seen that store” – then it feels less insecure, because
sometimes it can be scary for customers to shop online from stores they don’t know.”
31
Convenience
During the interview, NetOnNet CFO has highlighted the importance of accessibility. The
company wants to be accessible to the customers in any way they prefer – purchasing online
and picking the product up in a store, trying a product in store and receiving it at home, etc. She
also mentioned that NetOnNet is investing in automation and Artificial Intelligence (AI) to
guarantee customers an easy access to any information.
“So, for us it’s important to meet the customers in every channel they want to be in, no matter
if they prefer to lie in bed at night and click home the product, if they want to collect it in the
store or if they want to come to the store.”
“We want to work more with mechanical selling, where the customers have easy information
access, and we have built all our warehouse stores with stations where the customer can find
information about all product categories.”
Control
NetOnNet has adopted a passive way of selling, in which the customer has the power of
choosing the channel or channels he/she prefers during the whole purchasing process.
Moreover, Annelie Forsberg said that even in the stores NetOnNet customers are purposely
given large freedom in their choice, with a low number of employees present that do not
interfere unless the customer asks for help. This is because the target group of the company is
generally young and middle-aged people who want to make their purchasing decisions without
external help.
“We noticed that customers like to do the work themselves and read before.”
“There is a lot of “do it yourself”-way.”
Support
Being present in different channels permits NetOnNet to provide better support to its customers.
As it is for the wide availability of products, the company guarantees also a wide accessibility
to support in all channels – for example with the possibility to return a product in a store after
having purchased it online.
32
“It’s a great advantage to be in both places [online and offline], to be where the customer
wants to […] get help with its product, no matter where the customer is.”
Personalisation
NetOnNet ability to personalise its offering is transversal to offline and online channels. Thanks
to its loyalty program, the company is able to collect information on customer’s purchases
regardless of where these happened. Through the analysis of these data, NetOnNet is able to
personalise its shopping suggestions and promotions according to each customer.
“We look at what the customers have already bought, and we try to use these data and send
out specific offers.”
5.1.3. Firm Outcome Variables
Customer Acquisition
According to Annelie Forsberg, the implementation of an omni-channel strategy has permitted
NetOnNet to expand its customer base by acquiring new customers who would have not
purchased from NetOnNet if it was present only online.
“Which was a very good complement [referring to the introduction of physical stores]
because only selling online – it’s a certain type of customer segment – but there is also the
other category who wants to go inside, touch and feel and collect the items themselves.”
Customer Retention
Retaining customers is accomplished by offering what the customers want in order to achieve
repeated purchases. NetOnNet is following this principle by offering customers what they want,
where they want and when they want, thanks to its multiple channels.
“Shop where you want when you want.”
“So, for us it’s important to meet the customers in every channel they want to be in, no matter
if they prefer to lie in bed at night and click home the product, if they want to collect in the
store or if want to come to the store. Everywhere the customer wants to be – we should be.”
33
Customer Extension
Enhancing the profitability of the existing customers is something that NetOnNet is constantly
working on, and also something the company was able to improve with the implementation of
an omni-channel strategy.
“But it’s also something that we are constantly working with, to increase the average receipt
for the customers who shop online and…yeah, also get inspired online to up-sale, to suggest
to also buy this product or this for a package price.”
Customer extension is achieved by creating extra value for the customers and making them
purchase more or increasing their usage of a product or service. This is accomplished through
the practices of cross-selling and up-selling, which are also improved by the possibility of
shopping both online and offline.
“Maybe the customer comes in to buy a specific product but see something interesting and get
inspired and want to read more about it. And then maybe you do that and then click it home
online. Then you have already experienced it in store.”
“We have a much higher [up-selling] from the customers in the physical stores than from the
ones who only shop online.
Annelie Forsberg often refers to the term inspiration. NetOnNet is trying to provide customers
with inspiration trough their purchasing process, both online and offline. In this way the
company avoids aggressive practices like having salesmen pushing customers to buy more. It
is instead the experience provided by the shopping process that inspires customers to buy more,
according to their needs.
“Browsers [category of customers that values a lot the inspiration gained by visiting physical
stores] who are looking for more inspiration, they may know that they will buy this TV, but
want to complement with something else along the journey. And to see other thing and feel
what it’s like…and get this inspiration in our stores.”
5.2. Results and Analysis of Quantitative Research
We collected a total of 162 responses from our online survey directed towards consumers. By
screening all the answers, we did not detect any respondent to be considered irrelevant – for
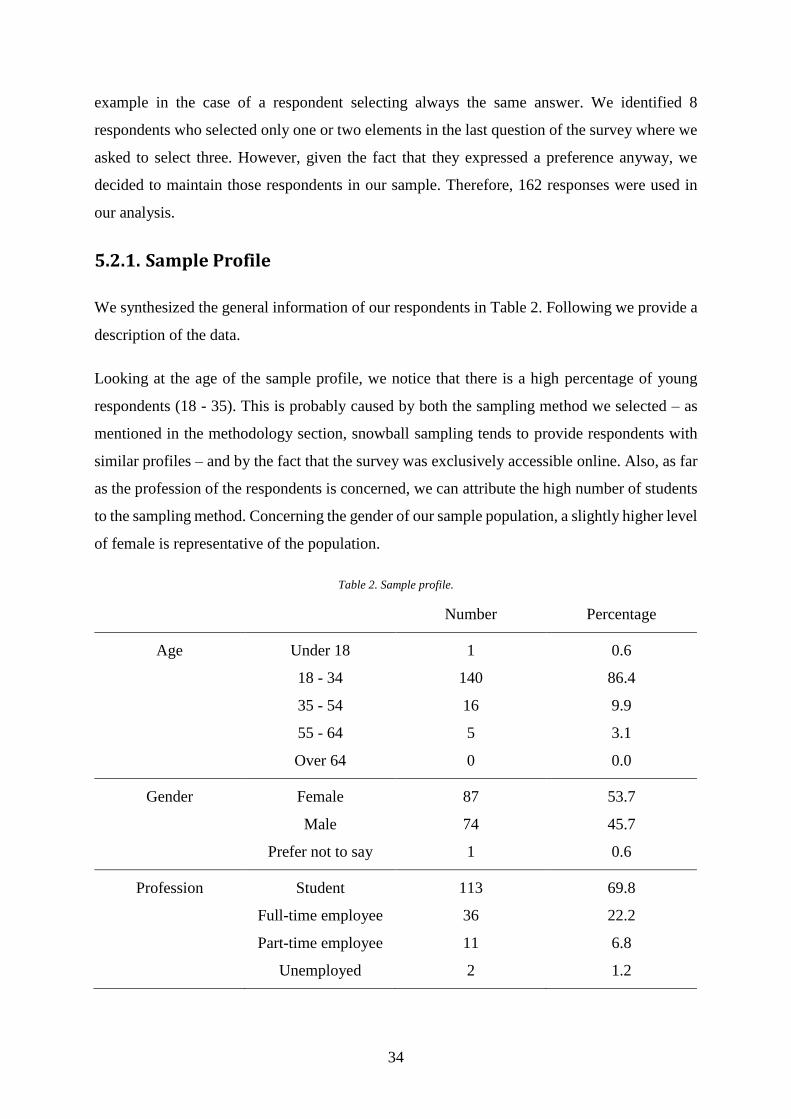
34
example in the case of a respondent selecting always the same answer. We identified 8
respondents who selected only one or two elements in the last question of the survey where we
asked to select three. However, given the fact that they expressed a preference anyway, we
decided to maintain those respondents in our sample. Therefore, 162 responses were used in
our analysis.
5.2.1. Sample Profile
We synthesized the general information of our respondents in Table 2. Following we provide a
description of the data.
Looking at the age of the sample profile, we notice that there is a high percentage of young
respondents (18 - 35). This is probably caused by both the sampling method we selected – as
mentioned in the methodology section, snowball sampling tends to provide respondents with
similar profiles – and by the fact that the survey was exclusively accessible online. Also, as far
as the profession of the respondents is concerned, we can attribute the high number of students
to the sampling method. Concerning the gender of our sample population, a slightly higher level
of female is representative of the population.
Table 2. Sample profile.
Number Percentage
Age Under 18 1 0.6
18 - 34 140 86.4
35 - 54 16 9.9
55 - 64 5 3.1
Over 64 0 0.0
Gender Female 87 53.7
Male 74 45.7
Prefer not to say 1 0.6
Profession Student 113 69.8
Full-time employee 36 22.2
Part-time employee 11 6.8
Unemployed 2 1.2
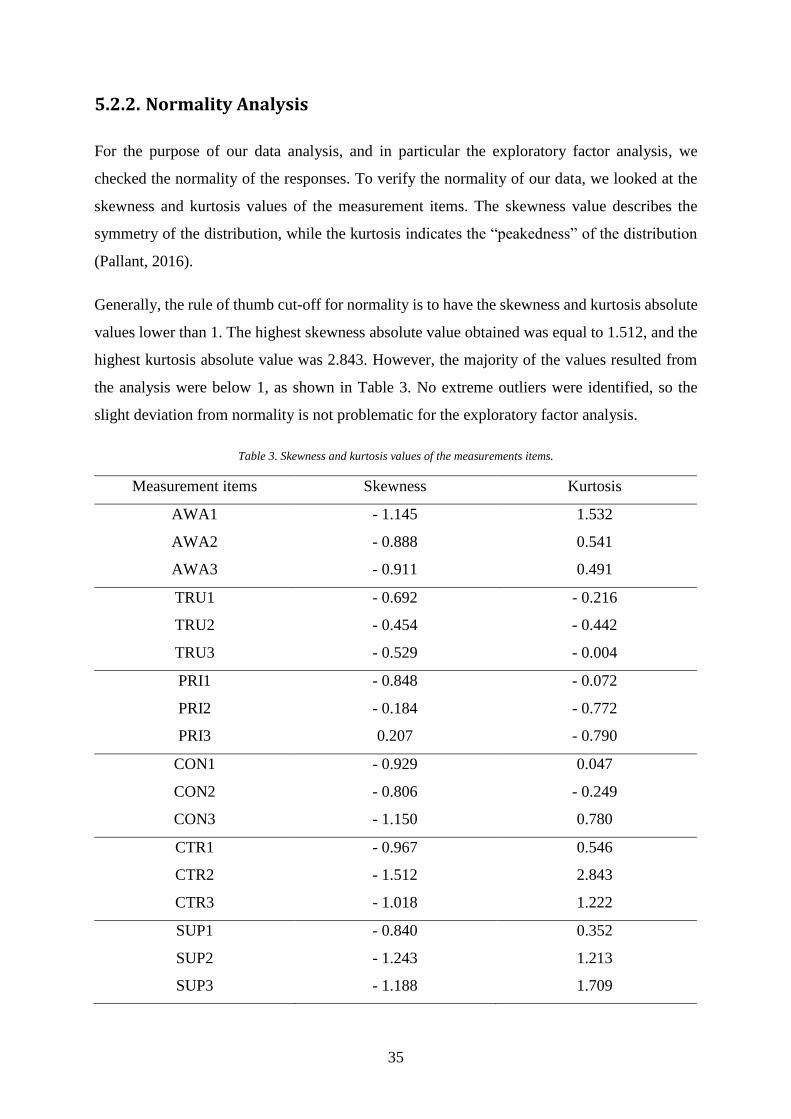
35
5.2.2. Normality Analysis
For the purpose of our data analysis, and in particular the exploratory factor analysis, we
checked the normality of the responses. To verify the normality of our data, we looked at the
skewness and kurtosis values of the measurement items. The skewness value describes the
symmetry of the distribution, while the kurtosis indicates the “peakedness” of the distribution
(Pallant, 2016).
Generally, the rule of thumb cut-off for normality is to have the skewness and kurtosis absolute
values lower than 1. The highest skewness absolute value obtained was equal to 1.512, and the
highest kurtosis absolute value was 2.843. However, the majority of the values resulted from
the analysis were below 1, as shown in Table 3. No extreme outliers were identified, so the
slight deviation from normality is not problematic for the exploratory factor analysis.
Table 3. Skewness and kurtosis values of the measurements items.
Measurement items Skewness Kurtosis
AWA1 - 1.145 1.532
AWA2 - 0.888 0.541
AWA3 - 0.911 0.491
TRU1 - 0.692 - 0.216
TRU2 - 0.454 - 0.442
TRU3 - 0.529 - 0.004
PRI1 - 0.848 - 0.072
PRI2 - 0.184 - 0.772
PRI3 0.207 - 0.790
CON1 - 0.929 0.047
CON2 - 0.806 - 0.249
CON3 - 1.150 0.780
CTR1 - 0.967 0.546
CTR2 - 1.512 2.843
CTR3 - 1.018 1.222
SUP1 - 0.840 0.352
SUP2 - 1.243 1.213
SUP3 - 1.188 1.709
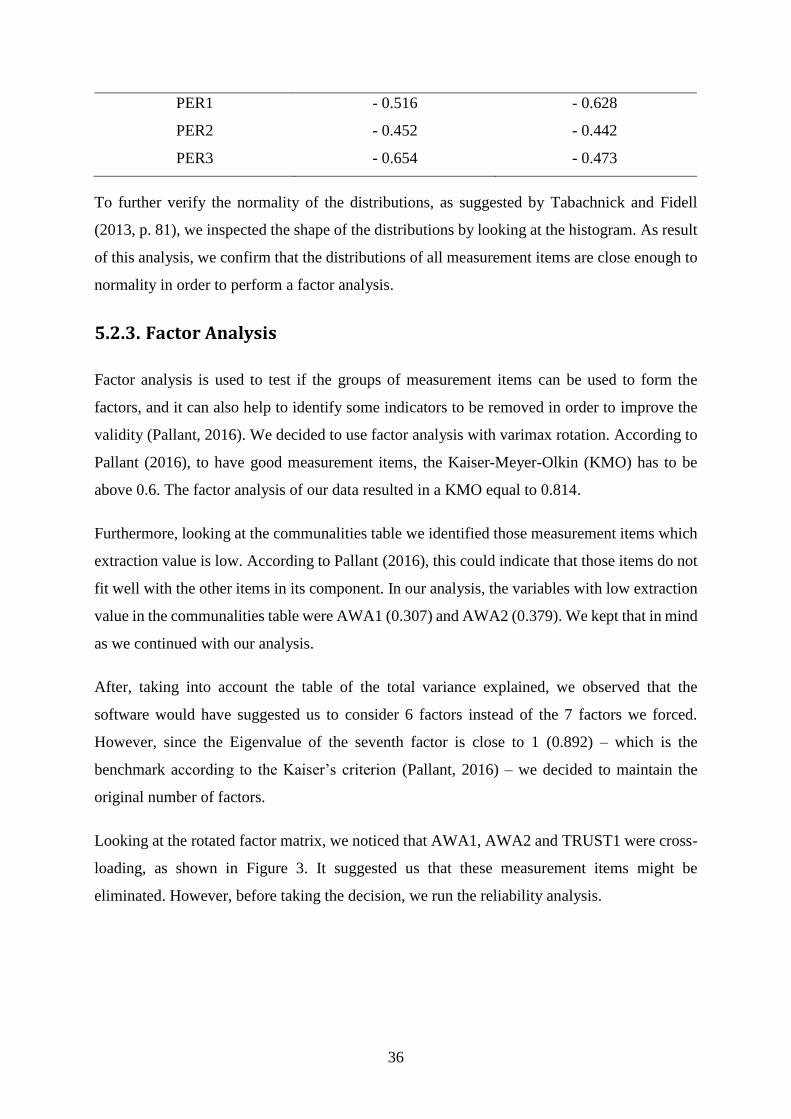
36
PER1 - 0.516 - 0.628
PER2 - 0.452 - 0.442
PER3 - 0.654 - 0.473
To further verify the normality of the distributions, as suggested by Tabachnick and Fidell
(2013, p. 81), we inspected the shape of the distributions by looking at the histogram. As result
of this analysis, we confirm that the distributions of all measurement items are close enough to
normality in order to perform a factor analysis.
5.2.3. Factor Analysis
Factor analysis is used to test if the groups of measurement items can be used to form the
factors, and it can also help to identify some indicators to be removed in order to improve the
validity (Pallant, 2016). We decided to use factor analysis with varimax rotation. According to
Pallant (2016), to have good measurement items, the Kaiser-Meyer-Olkin (KMO) has to be
above 0.6. The factor analysis of our data resulted in a KMO equal to 0.814.
Furthermore, looking at the communalities table we identified those measurement items which
extraction value is low. According to Pallant (2016), this could indicate that those items do not
fit well with the other items in its component. In our analysis, the variables with low extraction
value in the communalities table were AWA1 (0.307) and AWA2 (0.379). We kept that in mind
as we continued with our analysis.
After, taking into account the table of the total variance explained, we observed that the
software would have suggested us to consider 6 factors instead of the 7 factors we forced.
However, since the Eigenvalue of the seventh factor is close to 1 (0.892) – which is the
benchmark according to the Kaiser’s criterion (Pallant, 2016) – we decided to maintain the
original number of factors.
Looking at the rotated factor matrix, we noticed that AWA1, AWA2 and TRUST1 were cross-
loading, as shown in Figure 3. It suggested us that these measurement items might be
eliminated. However, before taking the decision, we run the reliability analysis.
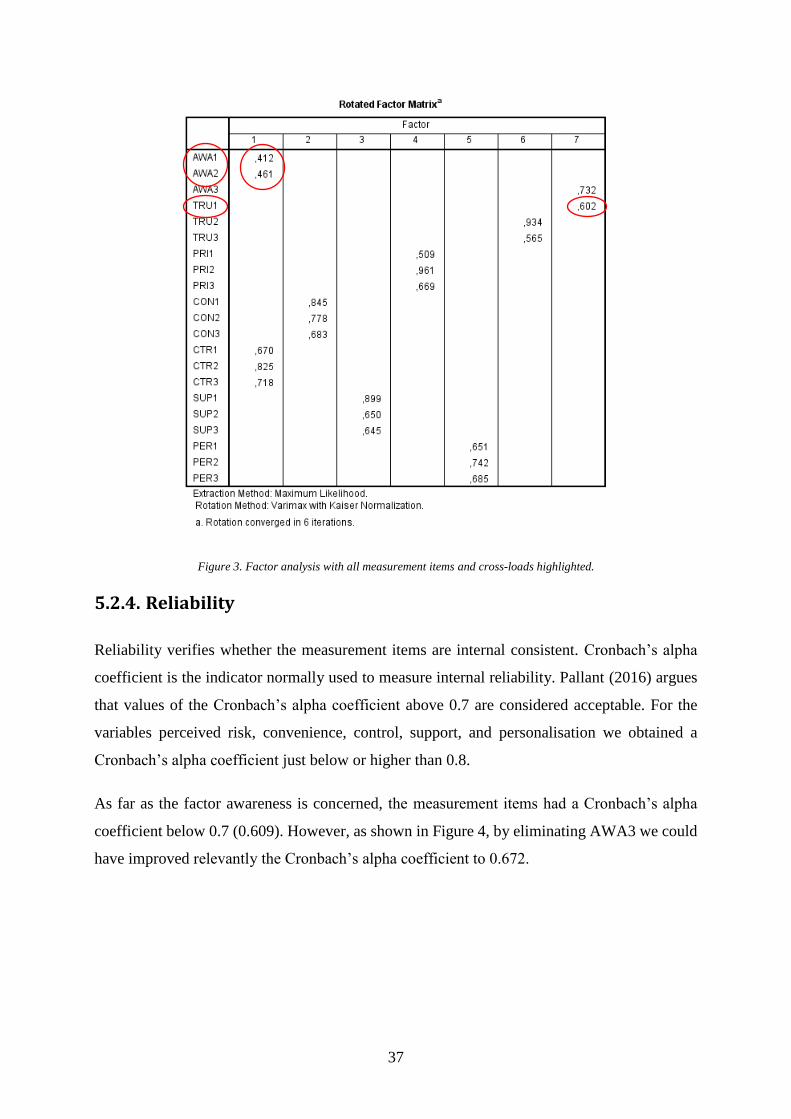
37
Figure 3. Factor analysis with all measurement items and cross-loads highlighted.
5.2.4. Reliability
Reliability verifies whether the measurement items are internal consistent. Cronbach’s alpha
coefficient is the indicator normally used to measure internal reliability. Pallant (2016) argues
that values of the Cronbach’s alpha coefficient above 0.7 are considered acceptable. For the
variables perceived risk, convenience, control, support, and personalisation we obtained a
Cronbach’s alpha coefficient just below or higher than 0.8.
As far as the factor awareness is concerned, the measurement items had a Cronbach’s alpha
coefficient below 0.7 (0.609). However, as shown in Figure 4, by eliminating AWA3 we could
have improved relevantly the Cronbach’s alpha coefficient to 0.672.
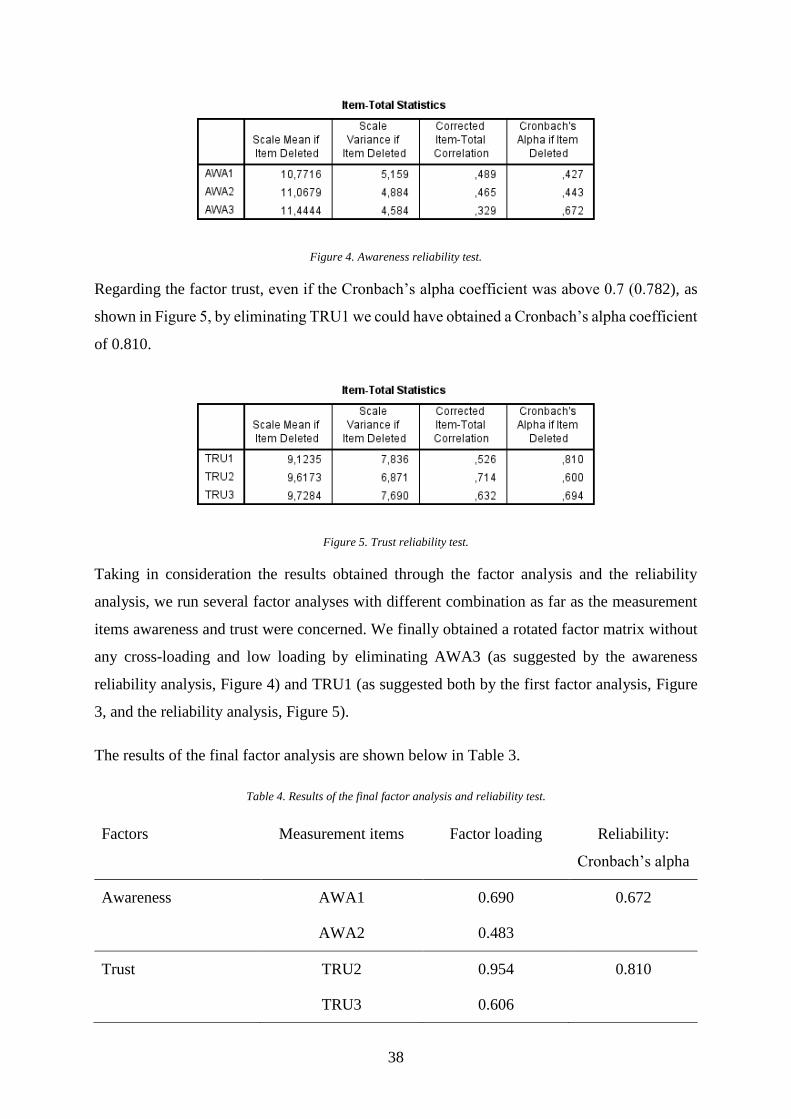
38
Figure 4. Awareness reliability test.
Regarding the factor trust, even if the Cronbach’s alpha coefficient was above 0.7 (0.782), as
shown in Figure 5, by eliminating TRU1 we could have obtained a Cronbach’s alpha coefficient
of 0.810.
Figure 5. Trust reliability test.
Taking in consideration the results obtained through the factor analysis and the reliability
analysis, we run several factor analyses with different combination as far as the measurement
items awareness and trust were concerned. We finally obtained a rotated factor matrix without
any cross-loading and low loading by eliminating AWA3 (as suggested by the awareness
reliability analysis, Figure 4) and TRU1 (as suggested both by the first factor analysis, Figure
3, and the reliability analysis, Figure 5).
The results of the final factor analysis are shown below in Table 3.
Table 4. Results of the final factor analysis and reliability test.
Factors Measurement items Factor loading Reliability:
Cronbach’s alpha
Awareness AWA1 0.690 0.672
AWA2 0.483
Trust TRU2 0.954 0.810
TRU3 0.606
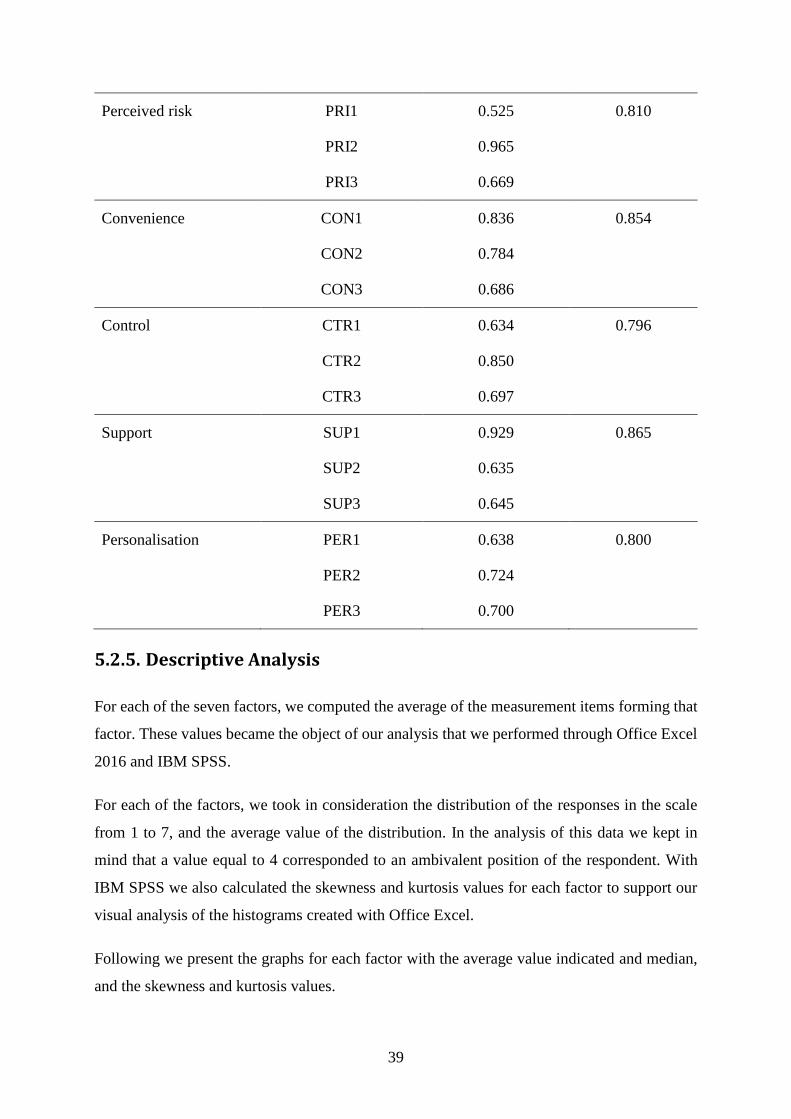
39
Perceived risk PRI1 0.525 0.810
PRI2 0.965
PRI3 0.669
Convenience CON1 0.836 0.854
CON2 0.784
CON3 0.686
Control CTR1 0.634 0.796
CTR2 0.850
CTR3 0.697
Support SUP1 0.929 0.865
SUP2 0.635
SUP3 0.645
Personalisation PER1 0.638 0.800
PER2 0.724
PER3 0.700
5.2.5. Descriptive Analysis
For each of the seven factors, we computed the average of the measurement items forming that
factor. These values became the object of our analysis that we performed through Office Excel
2016 and IBM SPSS.
For each of the factors, we took in consideration the distribution of the responses in the scale
from 1 to 7, and the average value of the distribution. In the analysis of this data we kept in
mind that a value equal to 4 corresponded to an ambivalent position of the respondent. With
IBM SPSS we also calculated the skewness and kurtosis values for each factor to support our
visual analysis of the histograms created with Office Excel.
Following we present the graphs for each factor with the average value indicated and median,
and the skewness and kurtosis values.
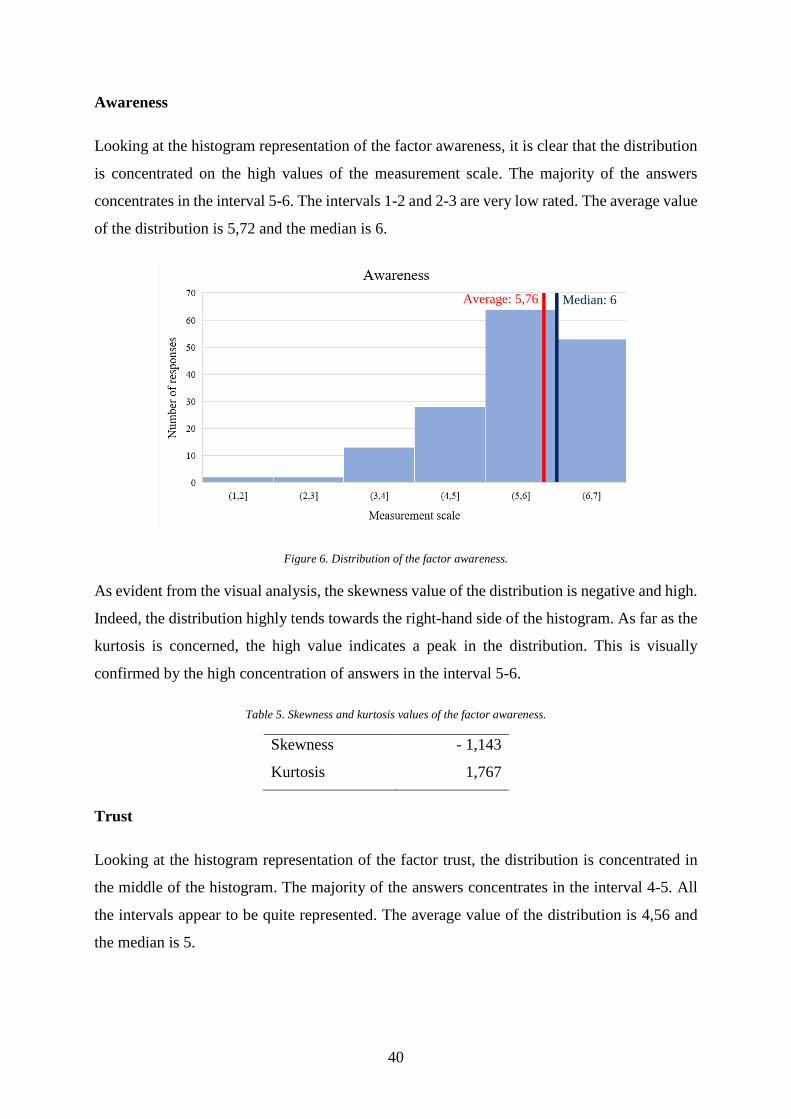
40
Awareness
Looking at the histogram representation of the factor awareness, it is clear that the distribution
is concentrated on the high values of the measurement scale. The majority of the answers
concentrates in the interval 5-6. The intervals 1-2 and 2-3 are very low rated. The average value
of the distribution is 5,72 and the median is 6.
Figure 6. Distribution of the factor awareness.
As evident from the visual analysis, the skewness value of the distribution is negative and high.
Indeed, the distribution highly tends towards the right-hand side of the histogram. As far as the
kurtosis is concerned, the high value indicates a peak in the distribution. This is visually
confirmed by the high concentration of answers in the interval 5-6.
Table 5. Skewness and kurtosis values of the factor awareness.
Skewness - 1,143
Kurtosis 1,767
Trust
Looking at the histogram representation of the factor trust, the distribution is concentrated in
the middle of the histogram. The majority of the answers concentrates in the interval 4-5. All
the intervals appear to be quite represented. The average value of the distribution is 4,56 and
the median is 5.
Average: 5,76 Median: 6
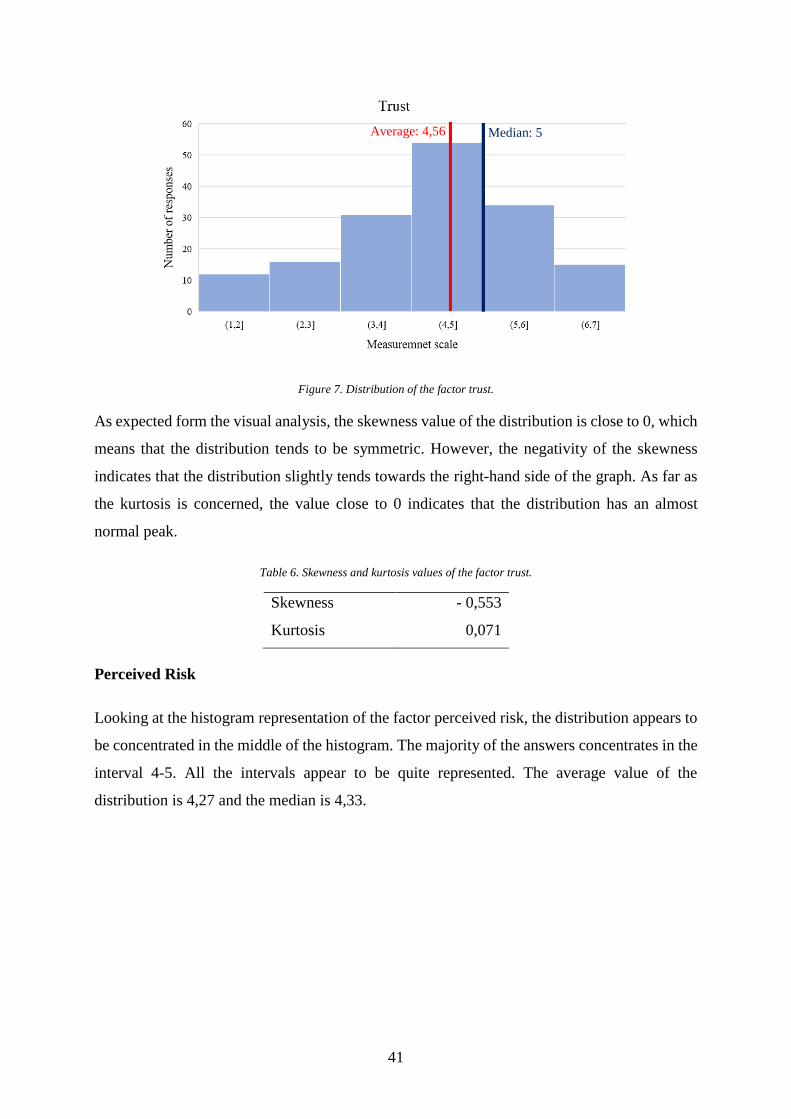
41
Figure 7. Distribution of the factor trust.
As expected form the visual analysis, the skewness value of the distribution is close to 0, which
means that the distribution tends to be symmetric. However, the negativity of the skewness
indicates that the distribution slightly tends towards the right-hand side of the graph. As far as
the kurtosis is concerned, the value close to 0 indicates that the distribution has an almost
normal peak.
Table 6. Skewness and kurtosis values of the factor trust.
Skewness - 0,553
Kurtosis 0,071
Perceived Risk
Looking at the histogram representation of the factor perceived risk, the distribution appears to
be concentrated in the middle of the histogram. The majority of the answers concentrates in the
interval 4-5. All the intervals appear to be quite represented. The average value of the
distribution is 4,27 and the median is 4,33.
Average: 4,56 Median: 5
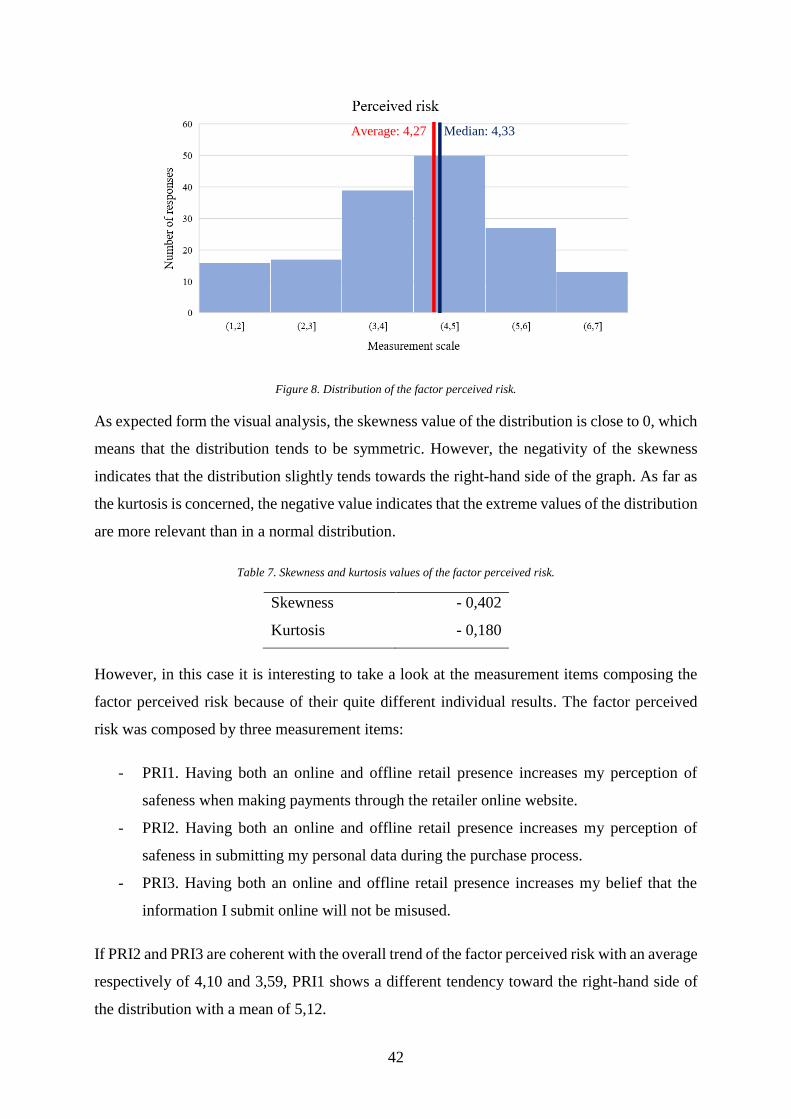
42
Figure 8. Distribution of the factor perceived risk.
As expected form the visual analysis, the skewness value of the distribution is close to 0, which
means that the distribution tends to be symmetric. However, the negativity of the skewness
indicates that the distribution slightly tends towards the right-hand side of the graph. As far as
the kurtosis is concerned, the negative value indicates that the extreme values of the distribution
are more relevant than in a normal distribution.
Table 7. Skewness and kurtosis values of the factor perceived risk.
Skewness - 0,402
Kurtosis - 0,180
However, in this case it is interesting to take a look at the measurement items composing the
factor perceived risk because of their quite different individual results. The factor perceived
risk was composed by three measurement items:
- PRI1. Having both an online and offline retail presence increases my perception of
safeness when making payments through the retailer online website.
- PRI2. Having both an online and offline retail presence increases my perception of
safeness in submitting my personal data during the purchase process.
- PRI3. Having both an online and offline retail presence increases my belief that the
information I submit online will not be misused.
If PRI2 and PRI3 are coherent with the overall trend of the factor perceived risk with an average
respectively of 4,10 and 3,59, PRI1 shows a different tendency toward the right-hand side of
the distribution with a mean of 5,12.
Average: 4,27 Median: 4,33
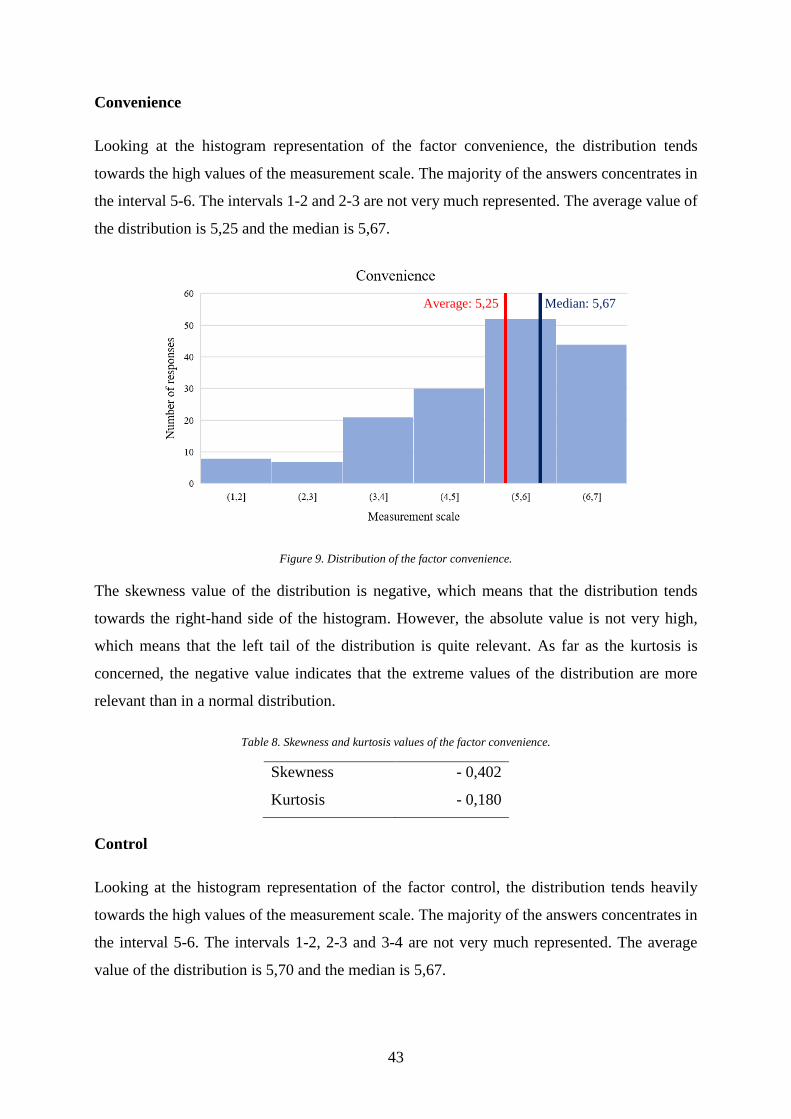
43
Convenience
Looking at the histogram representation of the factor convenience, the distribution tends
towards the high values of the measurement scale. The majority of the answers concentrates in
the interval 5-6. The intervals 1-2 and 2-3 are not very much represented. The average value of
the distribution is 5,25 and the median is 5,67.
Figure 9. Distribution of the factor convenience.
The skewness value of the distribution is negative, which means that the distribution tends
towards the right-hand side of the histogram. However, the absolute value is not very high,
which means that the left tail of the distribution is quite relevant. As far as the kurtosis is
concerned, the negative value indicates that the extreme values of the distribution are more
relevant than in a normal distribution.
Table 8. Skewness and kurtosis values of the factor convenience.
Skewness - 0,402
Kurtosis - 0,180
Control
Looking at the histogram representation of the factor control, the distribution tends heavily
towards the high values of the measurement scale. The majority of the answers concentrates in
the interval 5-6. The intervals 1-2, 2-3 and 3-4 are not very much represented. The average
value of the distribution is 5,70 and the median is 5,67.
Average: 5,25 Median: 5,67
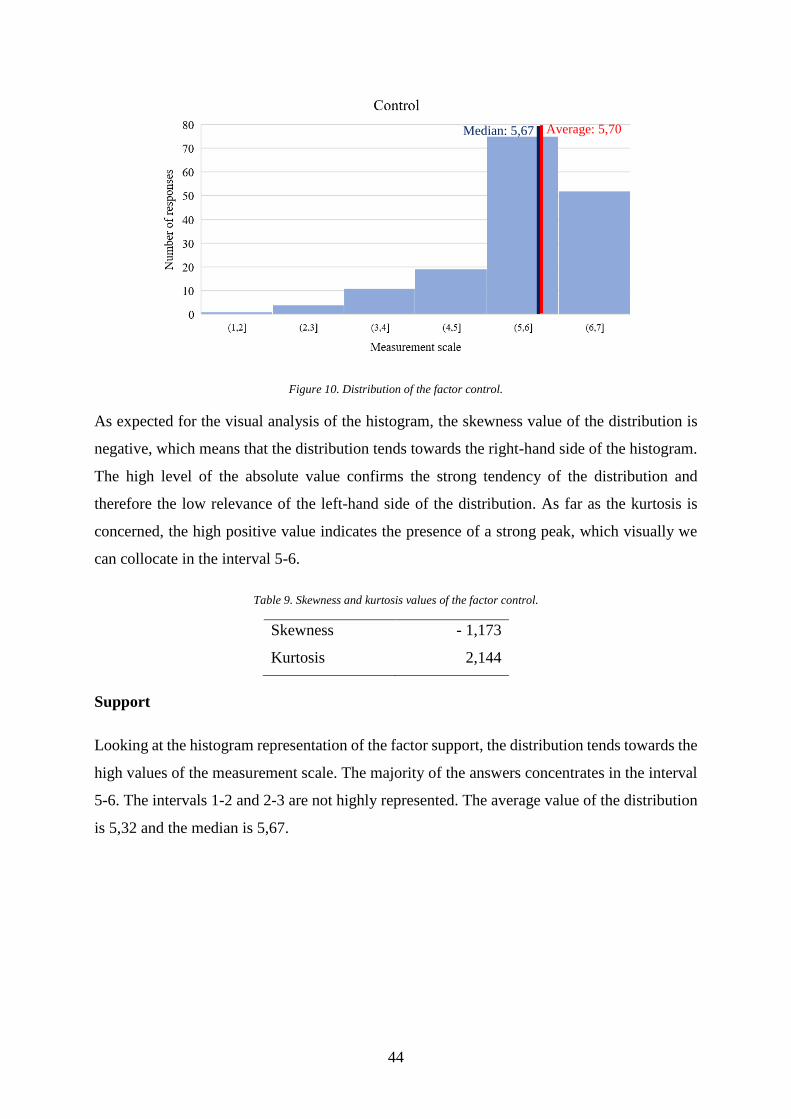
44
Figure 10. Distribution of the factor control.
As expected for the visual analysis of the histogram, the skewness value of the distribution is
negative, which means that the distribution tends towards the right-hand side of the histogram.
The high level of the absolute value confirms the strong tendency of the distribution and
therefore the low relevance of the left-hand side of the distribution. As far as the kurtosis is
concerned, the high positive value indicates the presence of a strong peak, which visually we
can collocate in the interval 5-6.
Table 9. Skewness and kurtosis values of the factor control.
Skewness - 1,173
Kurtosis 2,144
Support
Looking at the histogram representation of the factor support, the distribution tends towards the
high values of the measurement scale. The majority of the answers concentrates in the interval
5-6. The intervals 1-2 and 2-3 are not highly represented. The average value of the distribution
is 5,32 and the median is 5,67.
Average: 5,70 Median: 5,67
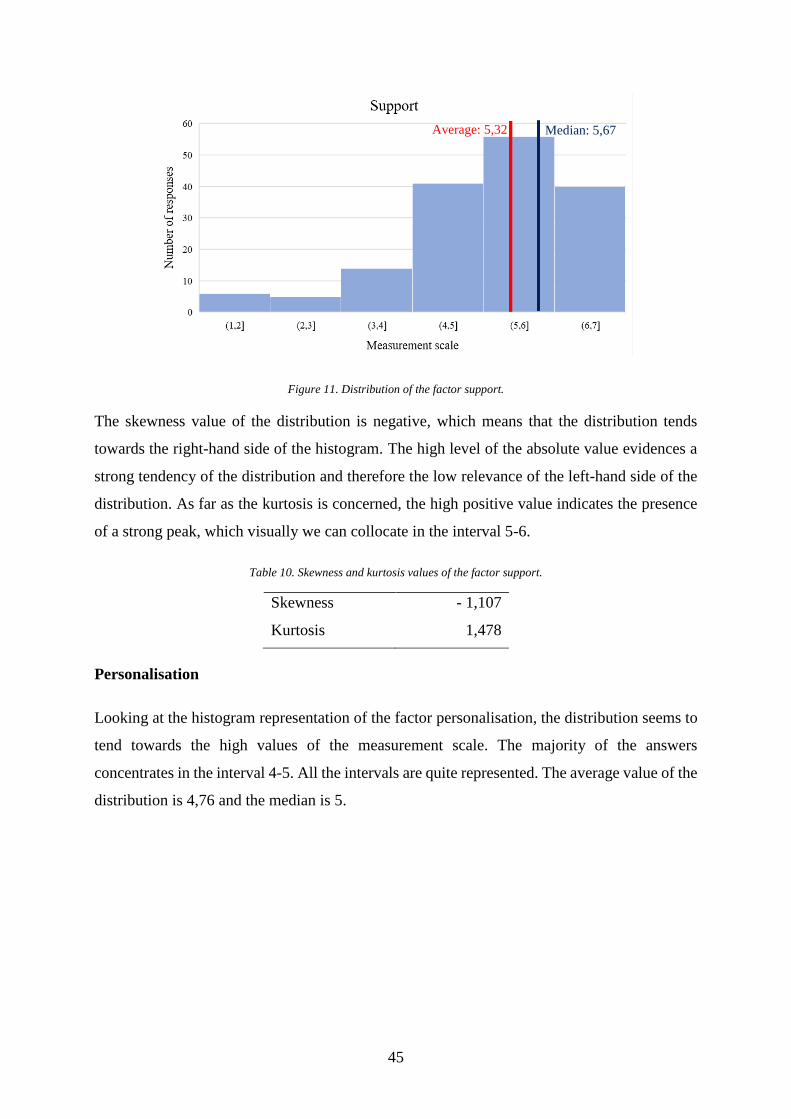
45
Figure 11. Distribution of the factor support.
The skewness value of the distribution is negative, which means that the distribution tends
towards the right-hand side of the histogram. The high level of the absolute value evidences a
strong tendency of the distribution and therefore the low relevance of the left-hand side of the
distribution. As far as the kurtosis is concerned, the high positive value indicates the presence
of a strong peak, which visually we can collocate in the interval 5-6.
Table 10. Skewness and kurtosis values of the factor support.
Skewness - 1,107
Kurtosis 1,478
Personalisation
Looking at the histogram representation of the factor personalisation, the distribution seems to
tend towards the high values of the measurement scale. The majority of the answers
concentrates in the interval 4-5. All the intervals are quite represented. The average value of the
distribution is 4,76 and the median is 5.
Average: 5,32 Median: 5,67
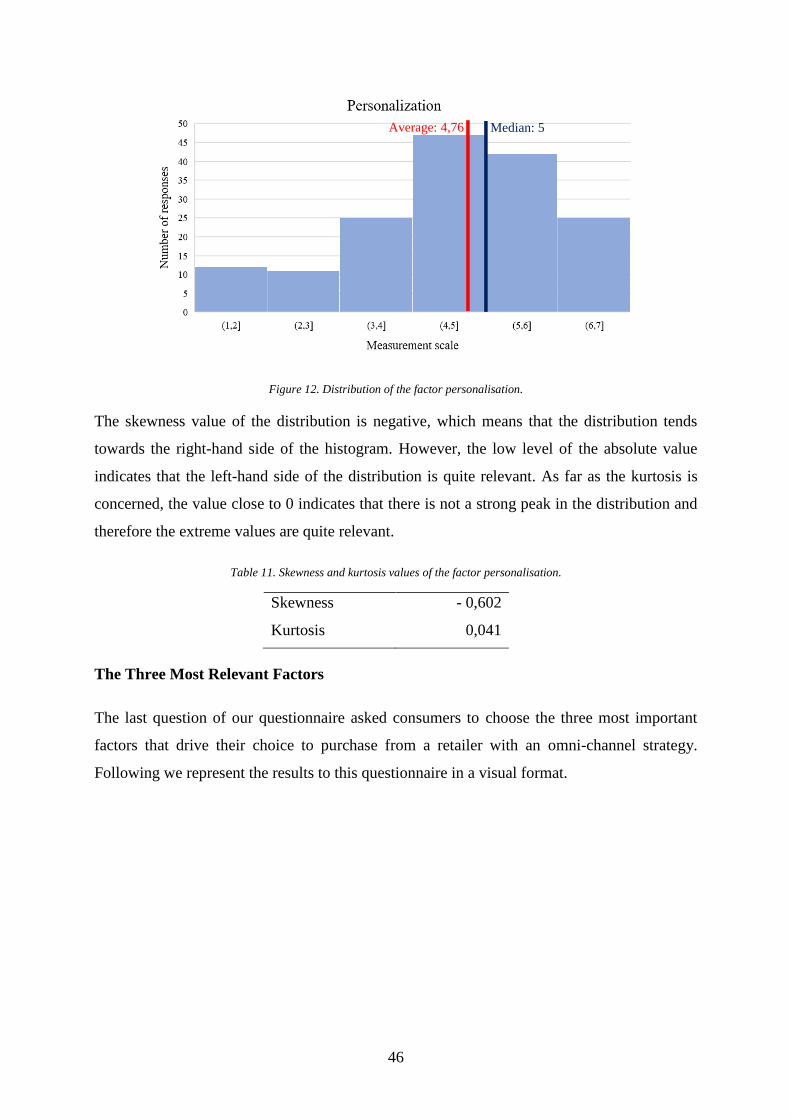
46
Figure 12. Distribution of the factor personalisation.
The skewness value of the distribution is negative, which means that the distribution tends
towards the right-hand side of the histogram. However, the low level of the absolute value
indicates that the left-hand side of the distribution is quite relevant. As far as the kurtosis is
concerned, the value close to 0 indicates that there is not a strong peak in the distribution and
therefore the extreme values are quite relevant.
Table 11. Skewness and kurtosis values of the factor personalisation.
Skewness - 0,602
Kurtosis 0,041
The Three Most Relevant Factors
The last question of our questionnaire asked consumers to choose the three most important
factors that drive their choice to purchase from a retailer with an omni-channel strategy.
Following we represent the results to this questionnaire in a visual format.
Average: 4,76 Median: 5
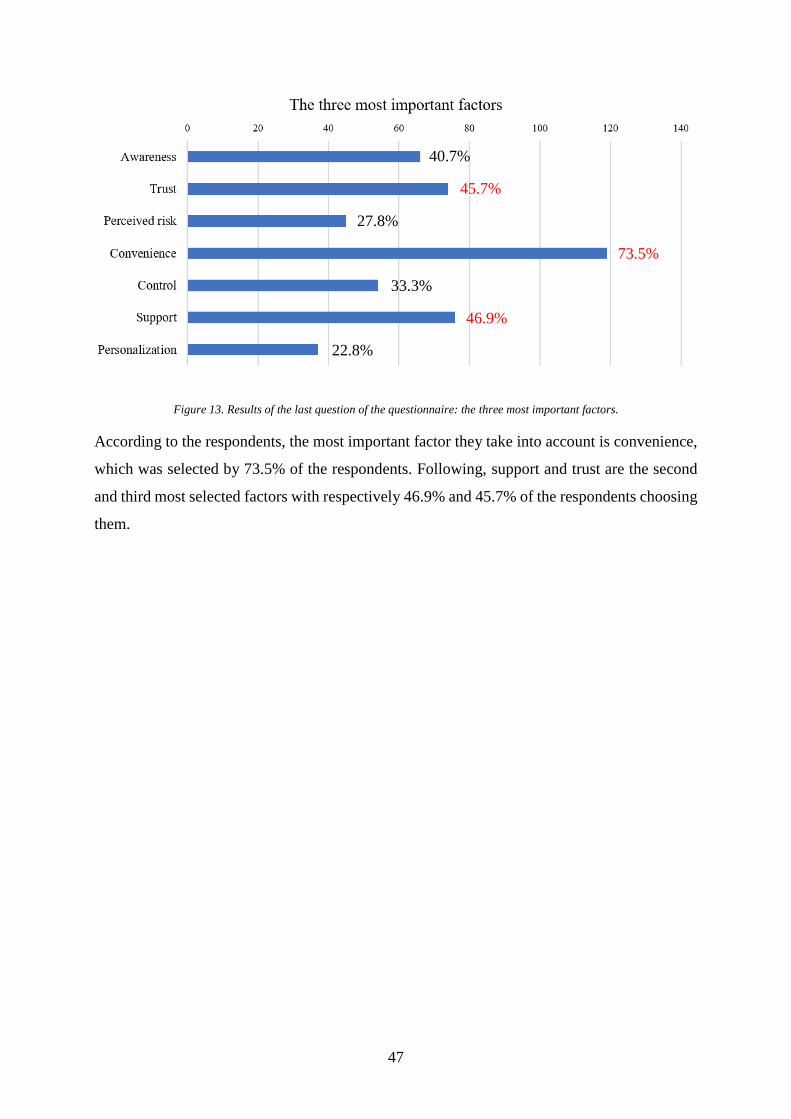
47
Figure 13. Results of the last question of the questionnaire: the three most important factors.
According to the respondents, the most important factor they take into account is convenience,
which was selected by 73.5% of the respondents. Following, support and trust are the second
and third most selected factors with respectively 46.9% and 45.7% of the respondents choosing
them.
40.7%
45.7%
27.8%
73.5%
33.3%
46.9%
22.8%
48
6. Discussion
In this section we discuss our findings based on the theoretical framework and the research
model. First, we discuss the results of the case study from the firm’s perspective. Second, we
discuss the customer’s perspective form the results of the questionnaire and compare them to
the insights collected during the case study.
6.1. Firm’s Perspective
Integration stood out as a key concept of the omni-channel strategy from previous studies
discussed in our literature review (Saghiri, et al., 2017). This concept was confirmed to be
crucial also during our research. Achieving a high level of organisational integration, represents
a source of both challenges and potential synergies associated with the implementation of an
omni-channel strategy.
NetOnNet’s successful implementation of the omni-channel strategy is built upon the ability of
being coherent and consistent across all the different channels. The integrated branding permits
the company to develop a consistent image of itself, allowing customers to recognize
NetOnNet’s offer both in an online and offline environment. In such a way, customers’
association between channels is strengthened (Goersch, 2002). Moreover, NetOnNet is able to
achieve continuity between channels through an integrated information management. This
allows customers to access the same level of information through any channel they are using.
At the same time, the development of an integrated Information System (IS) enables NetOnNet
to use customer’s data across channel. This has been recognized as a key advantage in
anticipating customer’s needs (Winer, 2001).
According to Annelie Forsberg, another key success factor of NetOnNet omni-channel strategy
was the choice of offering the same prices both online and offline. This strategy reinforces the
company’s ability to provide a consistent image of itself to its customers. Consistency in the
pricing strategy across the channels has been viewed as an important factor in order to offer the
customer with the same experience regardless the channel they use (Goersch, 2002). The
coherency of the pricing strategy reflects NetOnNet’s values of honesty and transparency.
Common values shared across all channels helps the company creating an integrated culture,
which keeps the company unified towards a common goal. This is ultimately also very
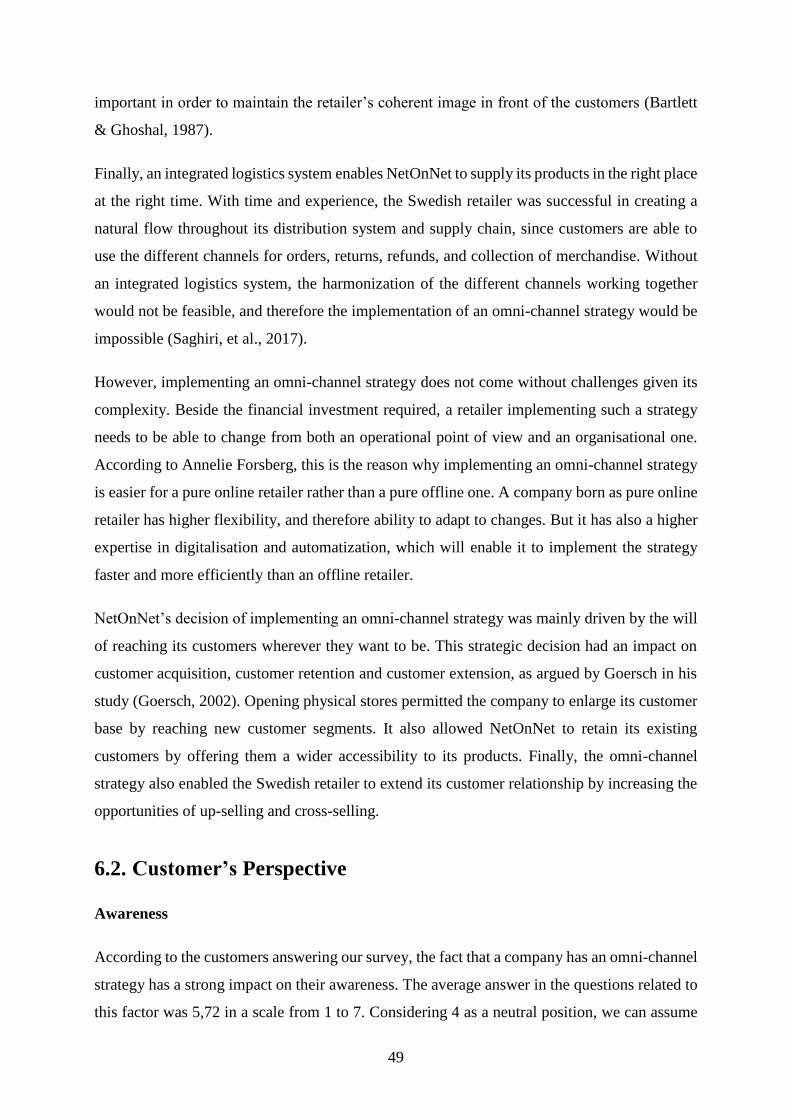
49
important in order to maintain the retailer’s coherent image in front of the customers (Bartlett
& Ghoshal, 1987).
Finally, an integrated logistics system enables NetOnNet to supply its products in the right place
at the right time. With time and experience, the Swedish retailer was successful in creating a
natural flow throughout its distribution system and supply chain, since customers are able to
use the different channels for orders, returns, refunds, and collection of merchandise. Without
an integrated logistics system, the harmonization of the different channels working together
would not be feasible, and therefore the implementation of an omni-channel strategy would be
impossible (Saghiri, et al., 2017).
However, implementing an omni-channel strategy does not come without challenges given its
complexity. Beside the financial investment required, a retailer implementing such a strategy
needs to be able to change from both an operational point of view and an organisational one.
According to Annelie Forsberg, this is the reason why implementing an omni-channel strategy
is easier for a pure online retailer rather than a pure offline one. A company born as pure online
retailer has higher flexibility, and therefore ability to adapt to changes. But it has also a higher
expertise in digitalisation and automatization, which will enable it to implement the strategy
faster and more efficiently than an offline retailer.
NetOnNet’s decision of implementing an omni-channel strategy was mainly driven by the will
of reaching its customers wherever they want to be. This strategic decision had an impact on
customer acquisition, customer retention and customer extension, as argued by Goersch in his
study (Goersch, 2002). Opening physical stores permitted the company to enlarge its customer
base by reaching new customer segments. It also allowed NetOnNet to retain its existing
customers by offering them a wider accessibility to its products. Finally, the omni-channel
strategy also enabled the Swedish retailer to extend its customer relationship by increasing the
opportunities of up-selling and cross-selling.
6.2. Customer’s Perspective
Awareness
According to the customers answering our survey, the fact that a company has an omni-channel
strategy has a strong impact on their awareness. The average answer in the questions related to
this factor was 5,72 in a scale from 1 to 7. Considering 4 as a neutral position, we can assume
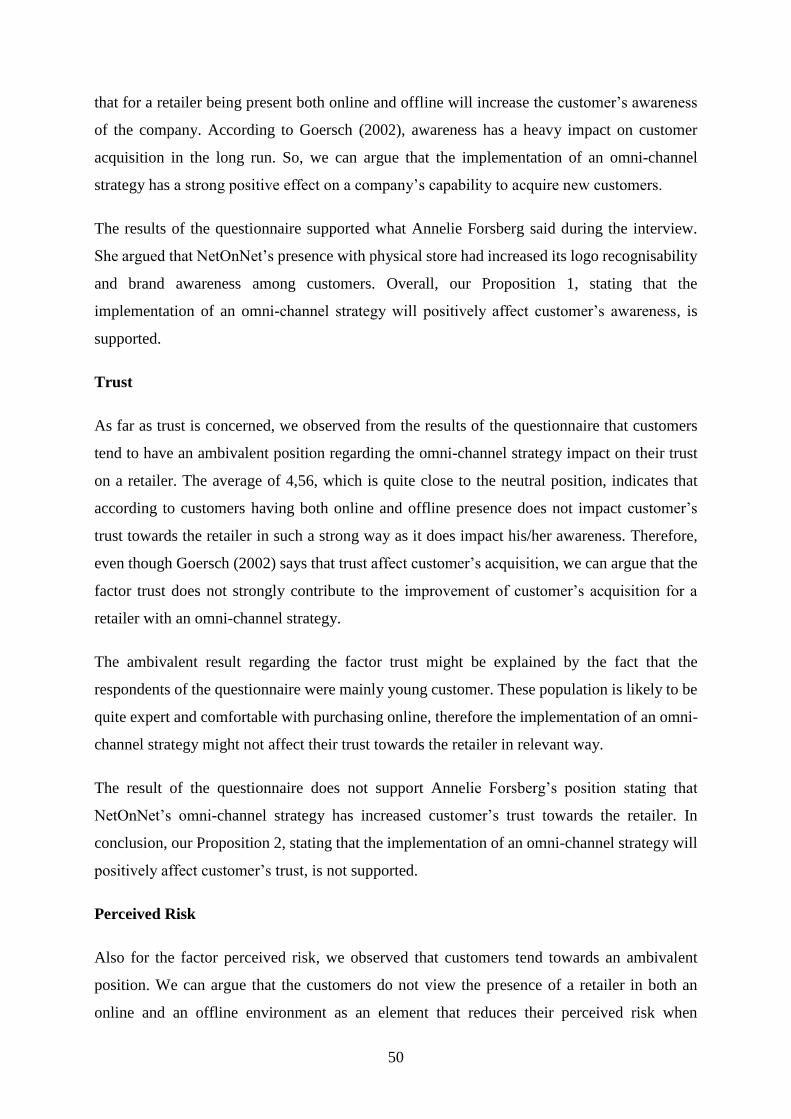
50
that for a retailer being present both online and offline will increase the customer’s awareness
of the company. According to Goersch (2002), awareness has a heavy impact on customer
acquisition in the long run. So, we can argue that the implementation of an omni-channel
strategy has a strong positive effect on a company’s capability to acquire new customers.
The results of the questionnaire supported what Annelie Forsberg said during the interview.
She argued that NetOnNet’s presence with physical store had increased its logo recognisability
and brand awareness among customers. Overall, our Proposition 1, stating that the
implementation of an omni-channel strategy will positively affect customer’s awareness, is
supported.
Trust
As far as trust is concerned, we observed from the results of the questionnaire that customers
tend to have an ambivalent position regarding the omni-channel strategy impact on their trust
on a retailer. The average of 4,56, which is quite close to the neutral position, indicates that
according to customers having both online and offline presence does not impact customer’s
trust towards the retailer in such a strong way as it does impact his/her awareness. Therefore,
even though Goersch (2002) says that trust affect customer’s acquisition, we can argue that the
factor trust does not strongly contribute to the improvement of customer’s acquisition for a
retailer with an omni-channel strategy.
The ambivalent result regarding the factor trust might be explained by the fact that the
respondents of the questionnaire were mainly young customer. These population is likely to be
quite expert and comfortable with purchasing online, therefore the implementation of an omni-
channel strategy might not affect their trust towards the retailer in relevant way.
The result of the questionnaire does not support Annelie Forsberg’s position stating that
NetOnNet’s omni-channel strategy has increased customer’s trust towards the retailer. In
conclusion, our Proposition 2, stating that the implementation of an omni-channel strategy will
positively affect customer’s trust, is not supported.
Perceived Risk
Also for the factor perceived risk, we observed that customers tend towards an ambivalent
position. We can argue that the customers do not view the presence of a retailer in both an
online and an offline environment as an element that reduces their perceived risk when
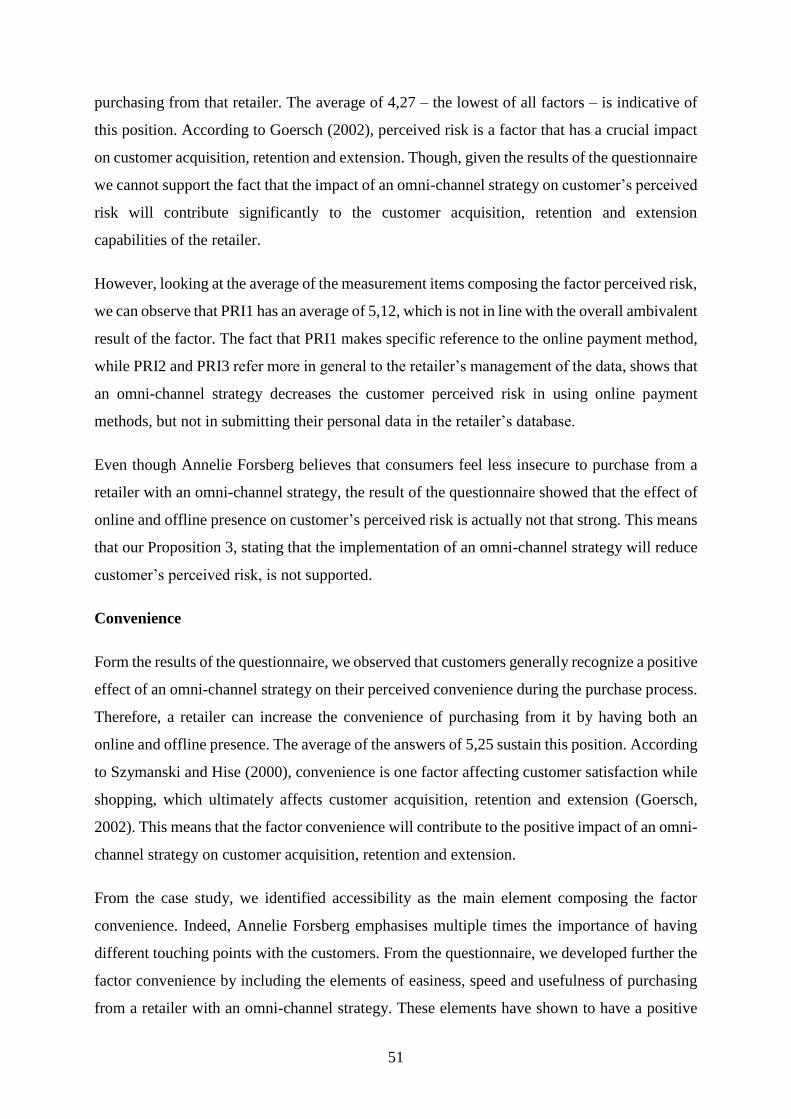
51
purchasing from that retailer. The average of 4,27 – the lowest of all factors – is indicative of
this position. According to Goersch (2002), perceived risk is a factor that has a crucial impact
on customer acquisition, retention and extension. Though, given the results of the questionnaire
we cannot support the fact that the impact of an omni-channel strategy on customer’s perceived
risk will contribute significantly to the customer acquisition, retention and extension
capabilities of the retailer.
However, looking at the average of the measurement items composing the factor perceived risk,
we can observe that PRI1 has an average of 5,12, which is not in line with the overall ambivalent
result of the factor. The fact that PRI1 makes specific reference to the online payment method,
while PRI2 and PRI3 refer more in general to the retailer’s management of the data, shows that
an omni-channel strategy decreases the customer perceived risk in using online payment
methods, but not in submitting their personal data in the retailer’s database.
Even though Annelie Forsberg believes that consumers feel less insecure to purchase from a
retailer with an omni-channel strategy, the result of the questionnaire showed that the effect of
online and offline presence on customer’s perceived risk is actually not that strong. This means
that our Proposition 3, stating that the implementation of an omni-channel strategy will reduce
customer’s perceived risk, is not supported.
Convenience
Form the results of the questionnaire, we observed that customers generally recognize a positive
effect of an omni-channel strategy on their perceived convenience during the purchase process.
Therefore, a retailer can increase the convenience of purchasing from it by having both an
online and offline presence. The average of the answers of 5,25 sustain this position. According
to Szymanski and Hise (2000), convenience is one factor affecting customer satisfaction while
shopping, which ultimately affects customer acquisition, retention and extension (Goersch,
2002). This means that the factor convenience will contribute to the positive impact of an omni-
channel strategy on customer acquisition, retention and extension.
From the case study, we identified accessibility as the main element composing the factor
convenience. Indeed, Annelie Forsberg emphasises multiple times the importance of having
different touching points with the customers. From the questionnaire, we developed further the
factor convenience by including the elements of easiness, speed and usefulness of purchasing
from a retailer with an omni-channel strategy. These elements have shown to have a positive
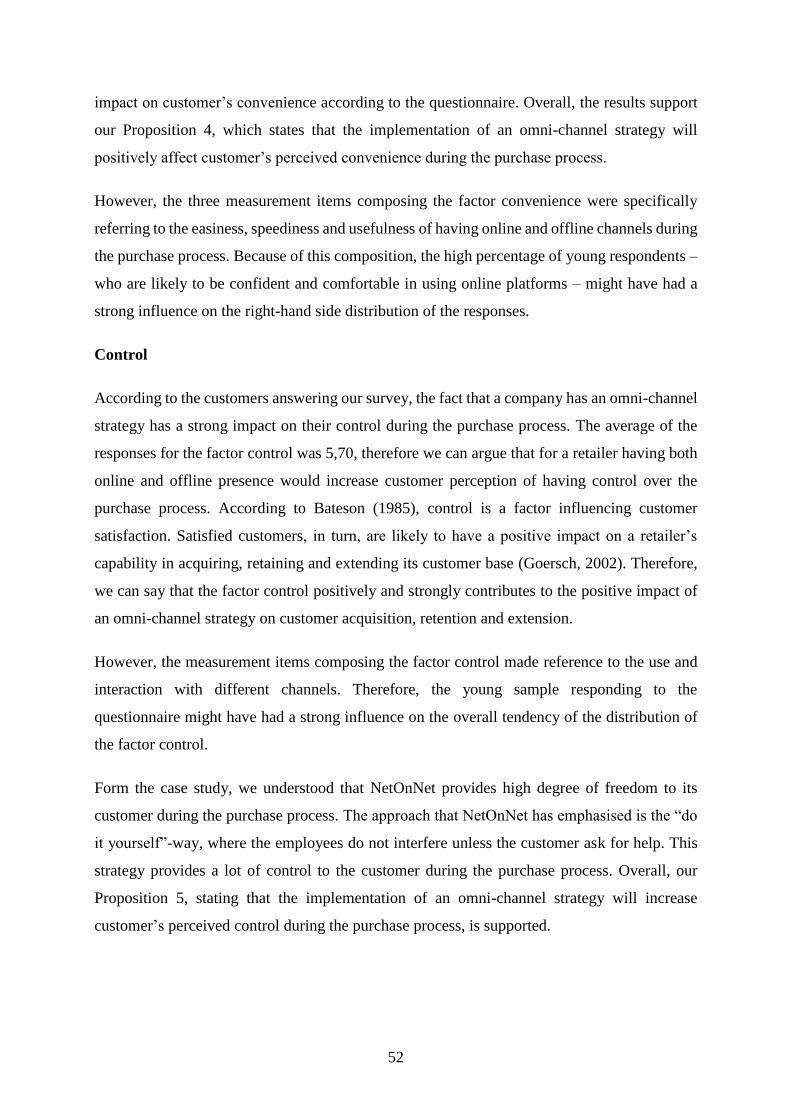
52
impact on customer’s convenience according to the questionnaire. Overall, the results support
our Proposition 4, which states that the implementation of an omni-channel strategy will
positively affect customer’s perceived convenience during the purchase process.
However, the three measurement items composing the factor convenience were specifically
referring to the easiness, speediness and usefulness of having online and offline channels during
the purchase process. Because of this composition, the high percentage of young respondents –
who are likely to be confident and comfortable in using online platforms – might have had a
strong influence on the right-hand side distribution of the responses.
Control
According to the customers answering our survey, the fact that a company has an omni-channel
strategy has a strong impact on their control during the purchase process. The average of the
responses for the factor control was 5,70, therefore we can argue that for a retailer having both
online and offline presence would increase customer perception of having control over the
purchase process. According to Bateson (1985), control is a factor influencing customer
satisfaction. Satisfied customers, in turn, are likely to have a positive impact on a retailer’s
capability in acquiring, retaining and extending its customer base (Goersch, 2002). Therefore,
we can say that the factor control positively and strongly contributes to the positive impact of
an omni-channel strategy on customer acquisition, retention and extension.
However, the measurement items composing the factor control made reference to the use and
interaction with different channels. Therefore, the young sample responding to the
questionnaire might have had a strong influence on the overall tendency of the distribution of
the factor control.
Form the case study, we understood that NetOnNet provides high degree of freedom to its
customer during the purchase process. The approach that NetOnNet has emphasised is the “do
it yourself”-way, where the employees do not interfere unless the customer ask for help. This
strategy provides a lot of control to the customer during the purchase process. Overall, our
Proposition 5, stating that the implementation of an omni-channel strategy will increase
customer’s perceived control during the purchase process, is supported.
53
Support
Form the results of the questionnaire, we observed that customers generally recognize a positive
effect of an omni-channel strategy on their perceived support during the consumption process.
The average of the responses is 5,32, which indicates that consumers perceive to have a higher
level of support from a retailer with both online and offline presence. According to Goersch
(2002), support activities strengthen customer retention and extension. Thus, this means that
the factor support will contribute to the positive impact of an omni-channel strategy on customer
retention and extension.
The result of the questionnaire support Annelie Forsberg’s position stating that thanks to an
omni-channel strategy NetOnNet is able to provide a better support to its customers. She
believes that reaching customers through all channels is a great advantage in supporting their
consumption experience. Overall, the results support our Proposition 6, which states that the
implementation of an omni-channel strategy will positively affect consumer’s perceived
support form the company.
Personalisation
From the result of the questionnaire, we observe that customers tend to have a neutral position
regarding the effect of both online and offline presence of a retailer on the personalisation of
the consumption experience. The average of the responses is 4,76, which is quite close to the
neutral position. This indicates that according to customers having both online and offline
presence does not impact customer’s perceived personalisation of the offers in a strong way.
According to Goersch (2002), the factor personalisation has a positive impact on customer
acquisition, retention and extension. However, given the ambivalent result of the questionnaire,
we cannot argue that the factor personalisation contributes to the positive impact of an omni-
channel strategy on customer acquisition, retention and extension.
From the case study, we acknowledge that NetOnNet offers personalized promotions and
recommendations to its customers, both online and offline. We can think that being online and
offline, and consequently the fact that the company is exposed to a larger amount of data, helps
the retailer to personalize its offers. However, from the survey seems that the online and offline
presence of a retailer does not affect its ability to personalize its offers. Therefore, our
Proposition 7, stating that the implementation of an omni-channel strategy will positively affect
customer’s perceived personalisation of the consumption experience, is not supported.
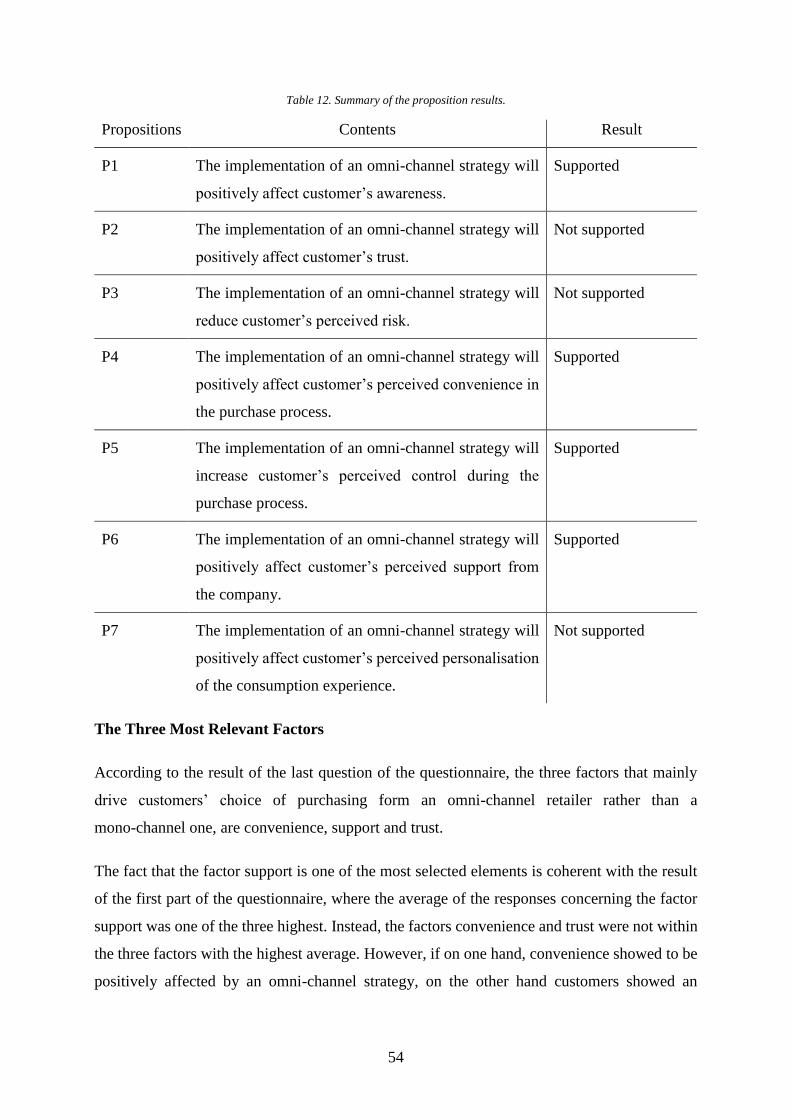
54
Table 12. Summary of the proposition results.
Propositions Contents Result
P1 The implementation of an omni-channel strategy will
positively affect customer’s awareness.
Supported
P2 The implementation of an omni-channel strategy will
positively affect customer’s trust.
Not supported
P3 The implementation of an omni-channel strategy will
reduce customer’s perceived risk.
Not supported
P4 The implementation of an omni-channel strategy will
positively affect customer’s perceived convenience in
the purchase process.
Supported
P5 The implementation of an omni-channel strategy will
increase customer’s perceived control during the
purchase process.
Supported
P6 The implementation of an omni-channel strategy will
positively affect customer’s perceived support from
the company.
Supported
P7 The implementation of an omni-channel strategy will
positively affect customer’s perceived personalisation
of the consumption experience.
Not supported
The Three Most Relevant Factors
According to the result of the last question of the questionnaire, the three factors that mainly
drive customers’ choice of purchasing form an omni-channel retailer rather than a
mono-channel one, are convenience, support and trust.
The fact that the factor support is one of the most selected elements is coherent with the result
of the first part of the questionnaire, where the average of the responses concerning the factor
support was one of the three highest. Instead, the factors convenience and trust were not within
the three factors with the highest average. However, if on one hand, convenience showed to be
positively affected by an omni-channel strategy, on the other hand customers showed an
55
ambivalent position as far as the factor trust is concerned. This might have been caused by
measurement items that we did not consider in the factor trust.
It is important to remind that the factors convenience and trust might have been selected by the
majority of the respondents, also due to the fact that the sample of our research was mainly
composed by young consumers. They are likely to be more comfortable in using digital
solutions and also more open minded to try new ones.
56
7. Conclusion
This study investigated why online retailers are investing in brick and mortar stores and what
is the impact of an omni-channel strategy on the customer base of a retailer that makes use of
it. We made use of previous literature on the omni-channel strategy to build the theoretical
framework. The findings of the study are that, (1) awareness and control are the customer’s
factors most positively influenced by an omni-channel strategy. (2) The impact of an omni-
channel strategy on trust, perceived risk and personalisation is not significant according to
customers, which is in opposition to NetOnNet CFO’s perspective. (3) Customers value the
most convenience, support and trust when deciding to purchase form an omni-channel retailer
rather than a mono-channel one. (4) Even if the impact of an omni-channel strategy on the factor
perceived risk is not supported, customers supported the positive impact on the measurement
item PRI1 – related to the perceived safeness of online payments. (5) There is a difference in
the effectiveness of implementing an omni-channel strategy whether the retailer starts as a pure
online retailer or as a pure offline one.
Our study contributes to the previous research on the omni-channel strategy by providing a new
case study and by investigating the impact of an omni-channel strategy on the customer base
first hand by asking to the customer themselves. Moreover, we identified that there are
differences between pure online retailer and pure offline retailer implementing an omni-channel
strategy. This is an important aspect that is currently underdeveloped in the literature.
Therefore, it will be relevant to further investigate it. Finally, the result of the study might help
retailer with an omni-channel strategy to identify what are the customer’s attitudes on which
mainly focus their attention.
7.1. Managerial Implications
From the study, we can extract some implications for managers in the retail industry. Firstly,
the study has shown the great relevance that physical stores have still in today’s digital world.
Therefore, our study suggests companies to value their physical stores – which have shown to
have a strong impact on customer awareness – and to invest in their modernization. Offline
shopping is still a big part of the total sales in the retail industry, it has only to be adapted to the
current times. Secondly, even if nowadays customers are highly independent during the
consumption process, the study shows that they still value a lot the support received form the
57
retailers. In the automatization of many of their processes, retailers should not forget and
underestimate the importance of supporting the customers. Finally, the study highlights the
importance of integration between channels and processes. Retailers should treat online and
offline channels as a unique channel, avoiding the risk of running the two channels individually
and incoherently. This could potentially undermine the brand image and the company, instead
of strengthening them.
7.2. Limitations and Suggestions for Future Research
Our study has some limitations. Firstly, the fact that the case study was restricted to one
company makes generalizing the finding to all online retailers investing in brick and mortar
stores not possible. Future studies might investigate other similar companies operating in
different cultural and geographical contexts to explore whether or not there are differences
between them. Secondly, the method of snowball sampling, which was used in our study, has
some limitations. Since most of our initial respondents were students in the age range between
18 and 34, the sample of population of our questionnaire is overrepresented by students and
people in the age range between 18 and 34. Future studies could use different sampling method
to overcome this limitation. Thirdly, this study is focused on a company born as pure online
retailer and then opening brick and mortar stores. Since we identify that there are differences
in the effectiveness of implementing an omni-channel strategy whether a retailer starts online
or offline, future studies might involve both types of retailer in order to investigate further these
differences. Finally, due to limited time and resources we did not measure the effect of an
omni-channel strategy on the firm output variables. Future studies might investigate how the
customer mediating variables individually impact on the firm output variable.
58
References
Alba, J., Lynch, J., Weitz, B., Janiszewski, C., Lutz, R., Sawyer, A., & Wood, S. (1997).
Interactive home shopping, consumer, retailer, and manufacturer incentives to
participate in electronic marketplaces. Journal of Marketing, 61(3), pp. 38-53.
Anderson, C. (2006). The Long Tail: Why the Future of Business is Selling Less of More.
Hyperion.
Avery, J., Steenburgh, T. J., Deighton, J., & Caravella, M. (2012, May). Adding Bricks to
Clicks: Predicting the Patterns of Cross-Channel Elasticities over Time. Journal of
Marketing, 76(3), 96–111.
Bartlett, C. A., & Ghoshal, S. (1987, Summer). Managing Across Borders: The Transnational
Solution. Sloan Management Review, 7-17.
Bateson, J. (1985). Self-Service Consumer: An Exploratory Study. Journal of Retailing, 61,
49-77.
Beck, N., & Rygl, D. (2015). Categorization of multiple channel retailing in Multi-, Cross-,
and Omni‐Channel Retailing for retailers and retailing. Journal of Retailing and
Consumer Services, pp. 170–178.
Bell, D. R., Gallino, S., & Moreno, A. (2014, September). How to Win in an Omnichannel
World. MIT Sloan Management Review, 56(1), 44-54.
Bryman, A., & Bell, E. (2011). Business Research Methods (III ed.). New York: Oxford
University Press.
Cha, J. (2011). Exploring the Internet as a unique shopping channel to sell both real and
virtual items: a comparison of factors affecting purchase intention and consumer
characteristics. Journal of Electronic, 12(2), 115.
Chopra, S. (2016). How omni-channel can be the future of retailing. Decision, 43(2), 135-144.
59
Cook, G. (2014, June). Customer experience in the omni-channel world and the challenges
and opportunities this presents. Journal of Direct, Data and Digital Marketing
Practice, 15(4), 262–266.
Deleersnyder, B., Geyskens, I., Gielens, K., & Dekimpe, M. G. (2002, December). How
cannibalistic is the Internet channel? A study of the newspaper industry in the United
Kingdom and The Netherlands. International Journal of Research in Marketing,
19(4), 337-348.
Doney, P. M., & Cannon, J. P. (1997). An Examination of the Nature of Trust in Buyer-Seller
Relationships. Journal of Marketing, 61(2), 35-51.
Dowling, G., & Stealin, R. (1994). A Model of Perceived Risk and Intended Risk-Handling
Activity. Journal of Consumer Research, 21, 199-134.
Eisenhardt, K. M. (1989). Building Theories from Case Study Research. Academy of
Management Review, 14(4), 532-550.
Eisenhardt, K. M., & Graebner, M. E. (2007). Theory Building from Cases: Opportunities and
Challenges. Academy of Management Journal, 50(1), 25-32.
Fornari, E., Fornari, D., Grandi, S., Menegatti, M., & Hofacker, C. F. (2016). Adding store to
web: migration and synergy effects in multi-channel retailing. International Journal of
Retail & Distribution Management, 4(6), 658-674.
Gehrt, K., Yale, L., & Lawson, D. (1996). The Convenience of Catalog Shopping: Is There
More to It than Time? Journal of Direct Marketing, 10(4), 19-28.
Gensler, S., Neslin, S. A., & Verhoef, P. C. (2017, May 2). The Showrooming Phenomenon:
It's More Than Just About the Price. Journal of Interactive Marketing(38), pp. 29-43.
Geyskens, I., Gielens, K., & Dekimpe, M. G. (2002, April). The Market Valuation of Internet
Channel Additions. Journal of Marketing, 62(2), 102-119.
Goersch, D. (2002). Multi-channel Integration and its Implications for Retail Web Sites. ECIS
2002. Gdańsk (Poland).
60
Gulati, R., & Garino, J. (2000). Get the Right Mix of Bricks and Clicks. Retrieved from
Harvard Business Review: https://hbr.org/2000/05/get-the-right-mix-of-bricks-and-
clicks
Gwet, K. L. (2014). Handbook of Inter-Rater Reliability (IV ed.). Gaithersburg: Advanced
Analytics, LLC.
Hagberg, J., Sundstrom, M., & Egles-Zandén, N. (2016). The digitalization of retailing: an
exploratory framework. International Journal of Retail & Distribution Management,
44, pp. 694-712.
Hauser, J., Urban, G., & Weinberg, B. (1993, November). How Consumers Allocate their
Time When Searching for Information. Journal of Marketing Research, 30, 452-466.
Heijden, H. v., Verhagen, T., & Creemers, M. (2001). Predicting Online Purchase Behavior:
Replications and Test of Competing Models. 34th Hawaii International Conference
on System Sciences. Hawaii.
Hodson, N., Perrigo, C., & Hardman, D. (2017). 2017 Retail Trends. Retrieved from
www.strategyand.pwc.com: https://www.strategyand.pwc.com/trend/2017-retail-
trends
Hübner, A. H., Holzapfel, A., & Kuhn, H. (2016). Distribution systems in omni-channel
retailing. Business Research.
IFS Corporate Marketing. (2018, April). NetOnNet Imporves the Retail Experience with IFS
Applications. Retrieved from IFS World: http://www.ifsworld.com/uk/-
/media/assets/2018/04/16/netonnet-written-customer-story.ashx
Jarvenpaa, S. (1999). Consumer Trust in an Internet Store: A Cross-Cultural Validation.
Journal of Computer-Mediated Communication, 5(2).
Jarvenpaa, S., & Todd, P. (1996, Winter). Consumer Reactions to Electronic Shopping on the
World Wide Web. International Journal of Electronic Commerce, 1(2), 59-88.
Jarvenpaa, S., Tractinsky, N., & Vitale, M. (2000). Consumer Trust in an Internet Store.
Information Technology and Management, 1(1-2), 45-71.
61
Jarvenpaa, S., Tractinsky, N., Saarinen, L., & Vitale, M. (1999, December). Consumer Trust
in an Internet Store: A Cross-Cultural Validation. Journal of Computer-Mediated
Communication, 5(2).
Juaneda-Ayensa, E., Mosquera, A., & Murillo, Y. S. (2016). Omnichannel Customer
Behavior: Key Drivers of Technology Acceptance and Use and Their Effects on
Purchase Intention. Frontiers in Psychology, 7.
Kalakota, R., & Robinson, M. (1999). “Customer Relationship Management: Integrating
Processes to Build . In R. Kalakota, & M. Robinson, “E-Business: Roadmap for
Success (pp. 109-135). Addison-Wesley.
Keeney, R. (1999, April). The Value of Internet Commerce to the Customer. Management
Science, 45(4), 533-542.
Koufaris, M., & Hampton-Sosa, W. (2002). Customer Trust Online: Examining the Role of
the Experience with the Web-Site. New York: CIS Working Paper Series.
KPMG international. (2017). The truth about online consumers: 2017 global online consumer
report. Retrieved from assets.kpmg.com:
https://assets.kpmg.com/content/dam/kpmg/xx/pdf/2017/01/the-truth-about-online-
consumers.pdf
Lee, R. M. (1993). Doing research on sensitive topics. London: Sage.
Neslin, S. A., Grewal, D., Leghorn, R., Shankar, V., Teerling, M. L., Thomas, J. S., &
Verhoef, P. C. (2006, November). Challenges and Opportunities in Multichannel
Customer Management. Journal of Service Research, 9(2), 95-112.
NetOnNet Group. (2016, May 16). Netonnet Group to expand and convert SIBA stores into
NetOnNet Warehouseshops. Retrieved from MyNewsDesk:
http://www.mynewsdesk.com/material/pressrelease/1405014/download?resource_type
=resource_attached_pdf_document
Newman, J., & Staelin, R. (1972, August). Prepurchase Information Seeking for New Cars
and Major Household. Journal of Marketing Research, 9, 249-57.
Pallant, J. (2016). SPSS Survival Manual (VI ed.). Maidenhead: McGraw-Hill Education.
62
Pappas, I. O., Kourouthanassis, P. E., Giannakos, M. N., & Chrissikopoulos, V. (2014). Shiny
happy people buying: the role of emotions on personalized e-shopping. Electronic
Markets, 24(3), 193-206.
Pavlou, P. A. (2003). Consumer Acceptance of Electronic Commerce - Integrating Trust and
Risk with the Technology Acceptance Model. International Journal of Electronic
Commerce, 7(3), 69-103.
Perry, K. (2017, June). Why Amazon, E-Commerce’s Top Player, Is Opening Physical Stores.
Retrieved from Social Media Week:
https://socialmediaweek.org/blog/2017/06/amazon-e-commerces-top-player-opening-
physical-stores/
Petterson, R. A., Balasubramanian, S., & Bronnenberg, B. J. (1997, September). Exploring
the implications of the internet for consumer marketing. Journal of the Academy of
Marketing Science.
Picot-Coupey, K., Huré, E., & Piveteau, L. (2016). Channel design to enrich customers’
shopping experiences: Synchronizing clicks with bricks in an omni-channel
perspective – the Direct Optic case. International Journal of Retail & Distribution
Management, 44(3), 336-368.
Popomaronis, T. (2017, June). Survival In Today's Retail Environment Means Merging
Physical And Digital. Retrieved from Forbes:
https://www.forbes.com/sites/tompopomaronis/2017/06/30/survival-in-todays-retail-
environment-means-merging-physical-and-digital/#3c62f10b16e9
PwC. (2018). PwC’s Global Consumer Insights Survey 2018. Retrieved from www.pwc.com:
https://www.pwc.com/gx/en/industries/consumer-markets/consumer-insights-
survey/new-consumer-habits.html
Quelch, J. A., & Klein, L. R. (1996). The Internet and International Marketing. Sloan
Management Review, 37(3), pp. 60-75.
Rosen, K., & Howard, A. (2000). E-Retail: Gold Rush or Fool’s Gold? California
Management Review, 42(3), 72-100.
63
Saghiri, S., Wilding, R., Mena, C., & Bourlakis, M. (2017). Toward a three-dimensional
framework for omni-channel. Journal of Business Research, 53-67.
Saunders, M., Lewis, P., & Thornhill, A. (2009). Research methods for business students (V
ed.). Harlow: Pearson Education Limited.
Steinfield, C., Adelaar, T., & Lai, Y.-j. (2002). Integrating Brick and Mortar Locations with
E-Commerce: Understanding Synergy Opportunities. Hawai’i International
Conference on System Sciences. Big Island (Hawaii).
Steve Burt, L. S. (2003). E-commerce and the retail process: a review. Journal of Retailing
and Consumer Services, pp. 275-286.
Strauss, A., & Corbin, J. M. (1990). Basics of Qualitative Research: Grounded Theory
Procedures and Techniques. Newbury Park, CA: Sage.
Szymanski, D., & Hise, R. (2000, Fall). e-Satisfaction: An Initial Examination. Journal of
Retailing, 76(3), 309-322.
Tabachnick, B. G., & Fidell, L. S. (2013). Using Multivariate Statistics (VI ed.). Boston:
Pearson Education.
Tan, Y., & Thoen, W. (2000, Winter). Toward a Generic Model of Trust for Electronic
Commerce. International Journal of Electronic Commerce, 5(3), 61-74.
TechSee. (2017). The Omni-Channel Visual Customer Experience Revolution. Retrieved from
techsee.me: https://techsee.me/wp-
content/uploads/2017/12/TechSee_WP_Visual_omnichannel.pdf
Thomas, L. (2017, December 26). Store closures rocked retail in 2017. Now 2018 is set to
bring another round of them. Retrieved from www.cnbc.com:
https://www.cnbc.com/2017/12/26/store-closures-rocked-retail-in-2017-and-more-
should-come-next-year.html
Turner, N., Wang, S., & Soper, S. (2017, June 16). Amazon to Acquire Whole Foods for $13.7
Billion. Retrieved from www.bloomberg.com:
https://www.bloomberg.com/news/articles/2017-06-16/amazon-to-acquire-whole-
foods-in-13-7-billion-bet-on-groceries
64
van Delft, L. (2013, October). Omnichannel Shopping Behaviour During the Customer
Journey. Retrieved from nrw.nl: http://nrw.nl/wp-
content/uploads/uploads/2014/06/Omni-channel-shopping-behavior-during-the-
customer-journey.pdf
Venkatesh, V., Morris, M. G., Davis, G. B., & Davis, F. D. (2003). User acceptance of
information technology: Toward a unified view. MIS quarterly, 425-478.
Venkatesh, V., Thong, J. Y., & Xu, X. (2012). Consumer acceptance and use of information
technology: extending the unified theory of acceptance and use of technology. MIS
Quarterly, 36(1), 157-178.
Verhoef, P. C., Kannan, P., & Inman, J. J. (2015). From Multi-Channel Retailing to Omni-
Channel Retailing Introduction to the Special Issue on Multi-Channel Retailing.
Journal of Retailing, 91(2), 174–181.
Winer, R. (2001). Management, A Framework for Customer Relationship. California
Management Review, 43(4), 89-105.
Yin, R. K. (1994). Case Study Research: Design and Methods (II ed.). Sage publications.
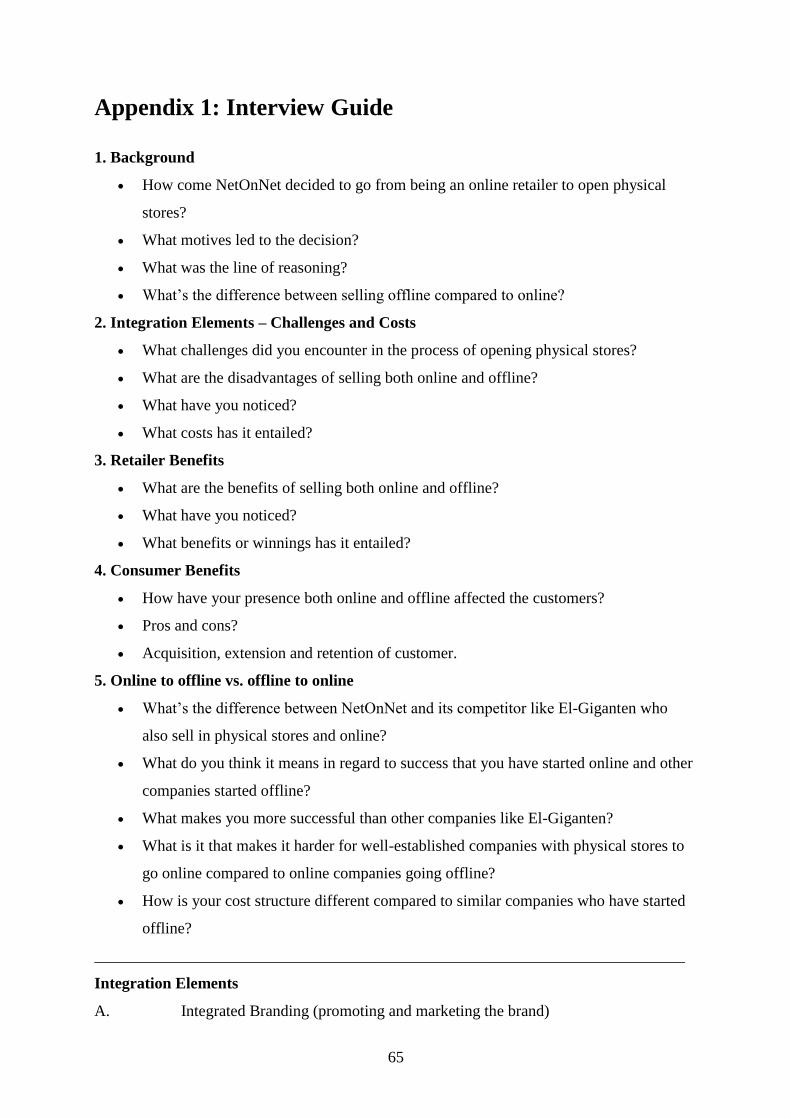
65
Appendix 1: Interview Guide
1. Background
• How come NetOnNet decided to go from being an online retailer to open physical
stores?
• What motives led to the decision?
• What was the line of reasoning?
• What’s the difference between selling offline compared to online?
2. Integration Elements – Challenges and Costs
• What challenges did you encounter in the process of opening physical stores?
• What are the disadvantages of selling both online and offline?
• What have you noticed?
• What costs has it entailed?
3. Retailer Benefits
• What are the benefits of selling both online and offline?
• What have you noticed?
• What benefits or winnings has it entailed?
4. Consumer Benefits
• How have your presence both online and offline affected the customers?
• Pros and cons?
• Acquisition, extension and retention of customer.
5. Online to offline vs. offline to online
• What’s the difference between NetOnNet and its competitor like El-Giganten who
also sell in physical stores and online?
• What do you think it means in regard to success that you have started online and other
companies started offline?
• What makes you more successful than other companies like El-Giganten?
• What is it that makes it harder for well-established companies with physical stores to
go online compared to online companies going offline?
• How is your cost structure different compared to similar companies who have started
offline?
__________________________________________________________________________
Integration Elements
A. Integrated Branding (promoting and marketing the brand)
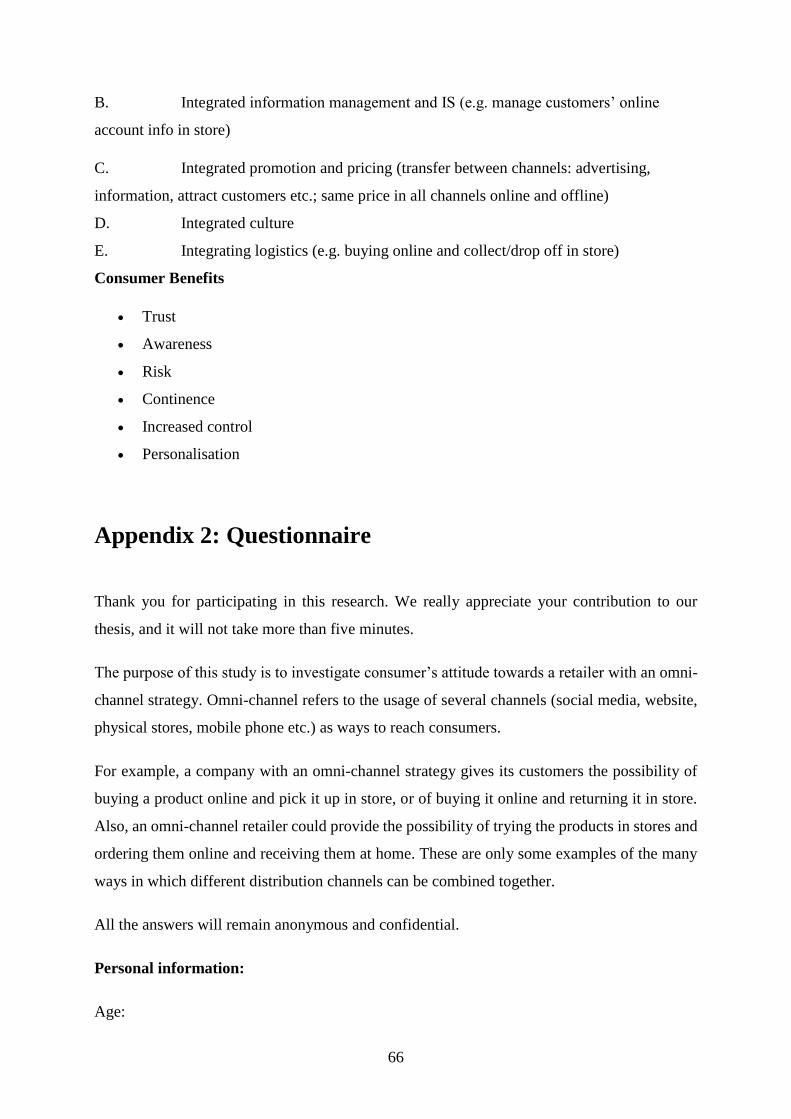
66
B. Integrated information management and IS (e.g. manage customers’ online
account info in store)
C. Integrated promotion and pricing (transfer between channels: advertising,
information, attract customers etc.; same price in all channels online and offline)
D. Integrated culture
E. Integrating logistics (e.g. buying online and collect/drop off in store)
Consumer Benefits
• Trust
• Awareness
• Risk
• Continence
• Increased control
• Personalisation
Appendix 2: Questionnaire
Thank you for participating in this research. We really appreciate your contribution to our
thesis, and it will not take more than five minutes.
The purpose of this study is to investigate consumer’s attitude towards a retailer with an omni-
channel strategy. Omni-channel refers to the usage of several channels (social media, website,
physical stores, mobile phone etc.) as ways to reach consumers.
For example, a company with an omni-channel strategy gives its customers the possibility of
buying a product online and pick it up in store, or of buying it online and returning it in store.
Also, an omni-channel retailer could provide the possibility of trying the products in stores and
ordering them online and receiving them at home. These are only some examples of the many
ways in which different distribution channels can be combined together.
All the answers will remain anonymous and confidential.
Personal information:
Age:
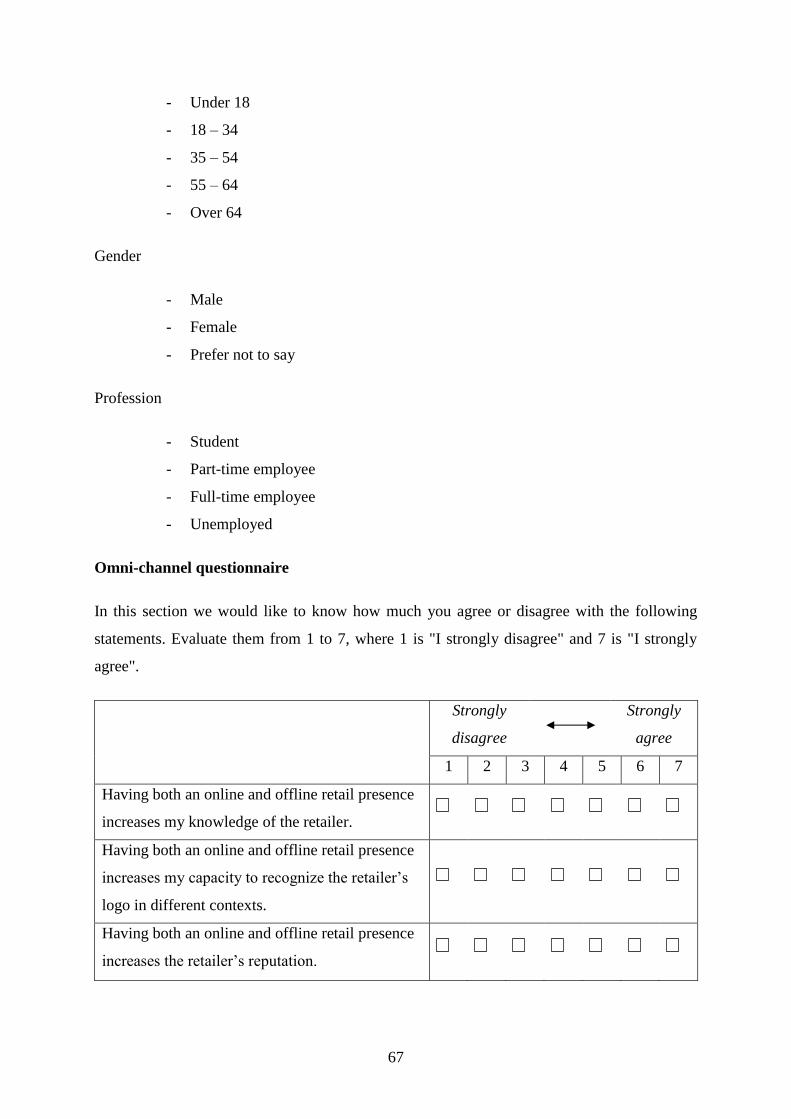
67
- Under 18
- 18 – 34
- 35 – 54
- 55 – 64
- Over 64
Gender
- Male
- Female
- Prefer not to say
Profession
- Student
- Part-time employee
- Full-time employee
- Unemployed
Omni-channel questionnaire
In this section we would like to know how much you agree or disagree with the following
statements. Evaluate them from 1 to 7, where 1 is "I strongly disagree" and 7 is "I strongly
agree".
Strongly
disagree
Strongly
agree
1 2 3 4 5 6 7
Having both an online and offline retail presence
increases my knowledge of the retailer.
Having both an online and offline retail presence
increases my capacity to recognize the retailer’s
logo in different contexts.
Having both an online and offline retail presence
increases the retailer’s reputation.
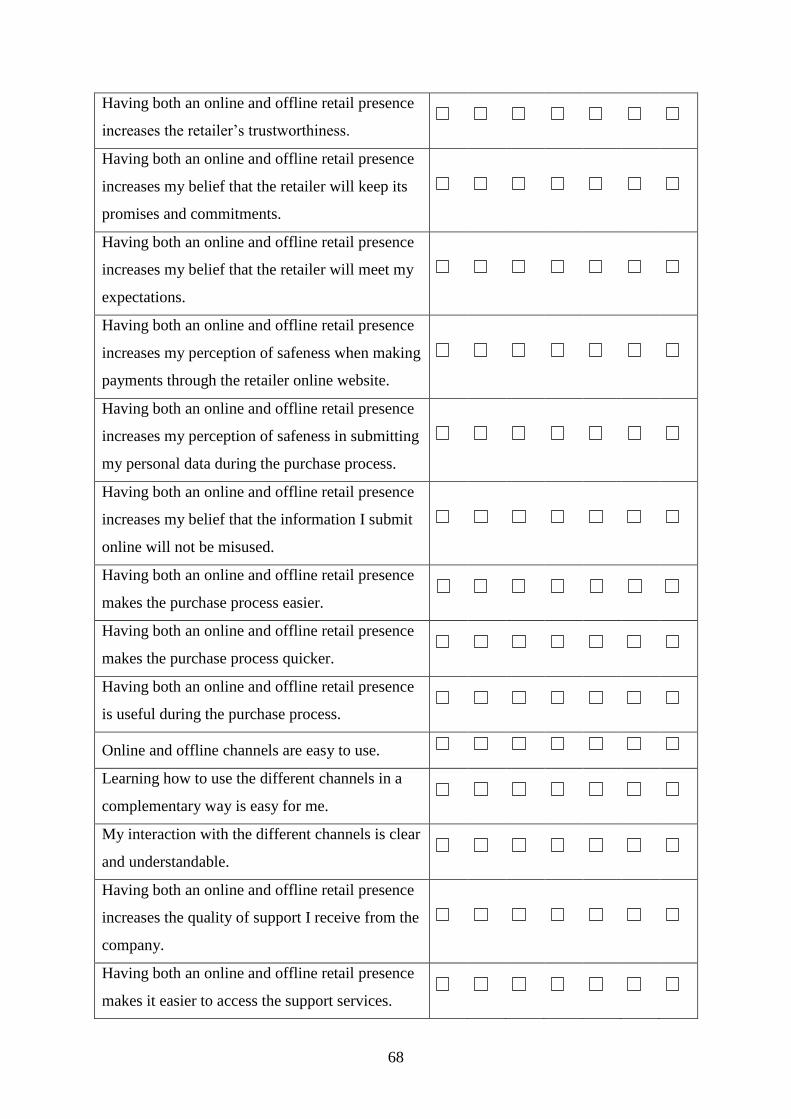
68
Having both an online and offline retail presence
increases the retailer’s trustworthiness.
Having both an online and offline retail presence
increases my belief that the retailer will keep its
promises and commitments.
Having both an online and offline retail presence
increases my belief that the retailer will meet my
expectations.
Having both an online and offline retail presence
increases my perception of safeness when making
payments through the retailer online website.
Having both an online and offline retail presence
increases my perception of safeness in submitting
my personal data during the purchase process.
Having both an online and offline retail presence
increases my belief that the information I submit
online will not be misused.
Having both an online and offline retail presence
makes the purchase process easier.
Having both an online and offline retail presence
makes the purchase process quicker.
Having both an online and offline retail presence
is useful during the purchase process.
Online and offline channels are easy to use.
Learning how to use the different channels in a
complementary way is easy for me.
My interaction with the different channels is clear
and understandable.
Having both an online and offline retail presence
increases the quality of support I receive from the
company.
Having both an online and offline retail presence
makes it easier to access the support services.
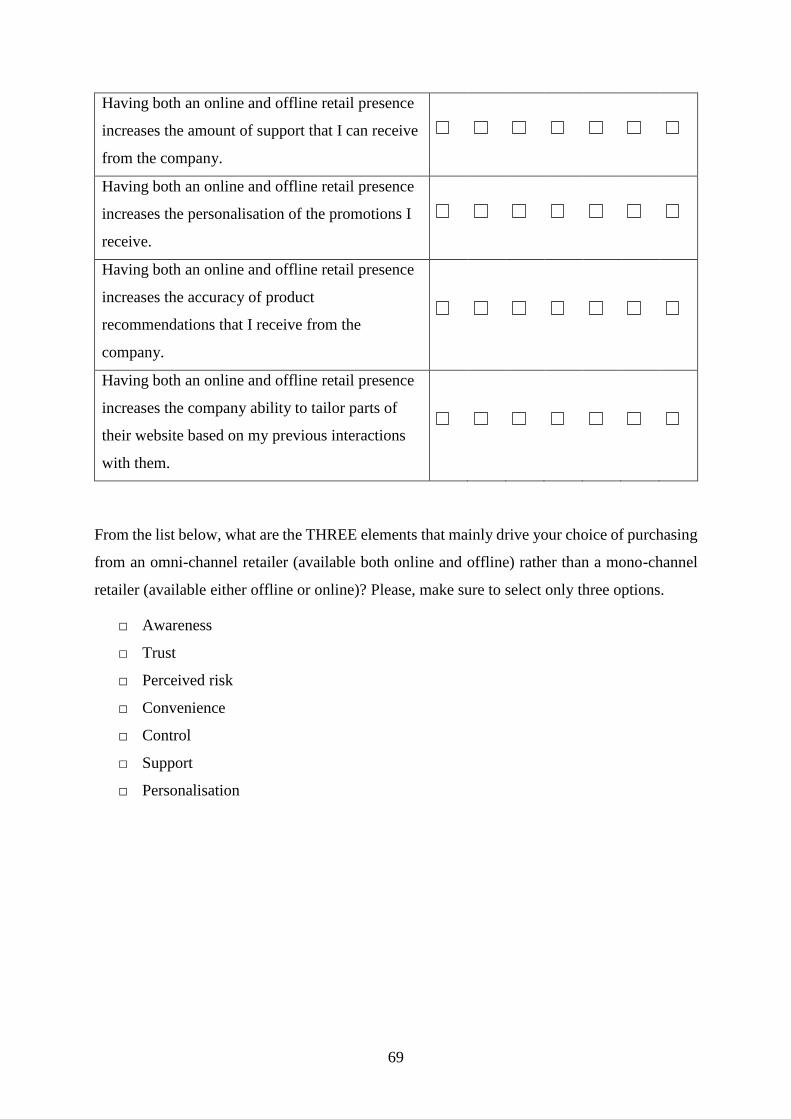
69
Having both an online and offline retail presence
increases the amount of support that I can receive
from the company.
Having both an online and offline retail presence
increases the personalisation of the promotions I
receive.
Having both an online and offline retail presence
increases the accuracy of product
recommendations that I receive from the
company.
Having both an online and offline retail presence
increases the company ability to tailor parts of
their website based on my previous interactions
with them.
From the list below, what are the THREE elements that mainly drive your choice of purchasing
from an omni-channel retailer (available both online and offline) rather than a mono-channel
retailer (available either offline or online)? Please, make sure to select only three options.
□ Awareness
□ Trust
□ Perceived risk
□ Convenience
□ Control
□ Support
□ Personalisation