Embed Size (px)
Citation preview
1
Online Shopping Behavior in Pakistan
Arsalan S. Khan, Faisal Ahmed, Hassan Yousuf, Sohaib ul Hassan and Syed Abbas Zia
Karachi School for Business & Leadership
2
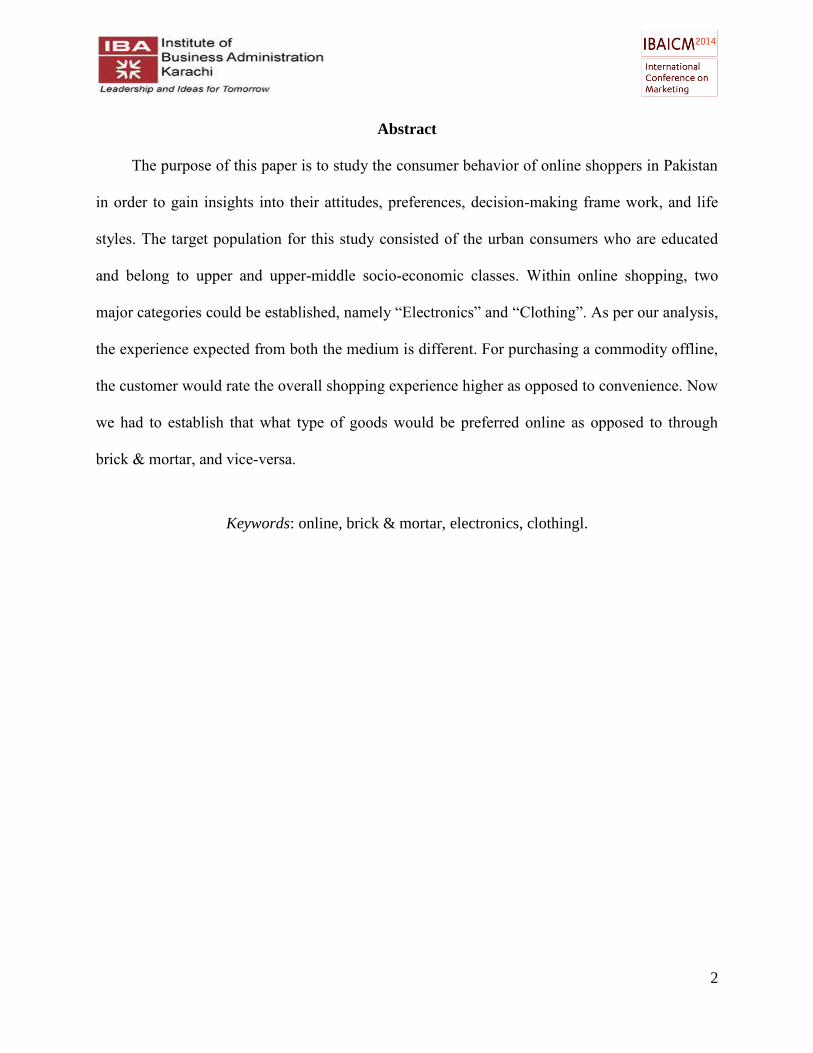
Abstract
The purpose of this paper is to study the consumer behavior of online shoppers in Pakistan
in order to gain insights into their attitudes, preferences, decision-making frame work, and life
styles. The target population for this study consisted of the urban consumers who are educated
and belong to upper and upper-middle socio-economic classes. Within online shopping, two
major categories could be established, namely “Electronics” and “Clothing”. As per our analysis,
the experience expected from both the medium is different. For purchasing a commodity offline,
the customer would rate the overall shopping experience higher as opposed to convenience. Now
we had to establish that what type of goods would be preferred online as opposed to through
brick & mortar, and vice-versa.
Keywords: online, brick & mortar, electronics, clothingl.
3
Introduction
To study the consumer behavior of online shoppers in Pakistan in order to gain insights into
their attitudes and preferences, decision-making frame work, attributes for store selection and life
styles encouraging online shopping. The target population for this study consists of the urban
consumers who are educated and belong to Upper and upper-middle socio-economic classes
(SEC A and SEC B) who can be divided into two broad segments, first having ages from 16-25
and second with age 25 years and above. The first stated segment is the major segment and
insights about its behavior towards online shopping can provide a sound basis for further
research. A substantial size of this segment comprises of students. An effective presence on
social media websites is necessary and used as a channel to draw more traffic which is another
reason for youth segment for being the majority of consumers. Since this industry is still in its
infancy in Pakistan, the innovators and early adopters who are in bulk at this time mostly belong
to the description above. This consumer segment is experiencing an increase in spending power
which is mostly consumed by purchases of clothing and accessories, food and electronic
products such as cameras, cell phones, tablets, computer or computer related stuff. Thus we see a
resemblance among these products and the product lines of major online shopping sites.
4
The second segment consists of working professionals or business men who have sufficient
income to purchase products online. Their purchases are less both in frequency and quantity as
compared to the former segment.
Methodology
Five In-depth interviews were conducted and the methodology was to select a mix of
people who are frequent online buyers, those who have bought once or twice in past 1 year and a
prospective online shopper for online websites. Interviewing such a blend of interviewee’s
facilitated us in establishing the attributes leading to purchase (switching behavior) and factors
valued the most before making purchase by current online shoppers.
A focus group was also conducted which helped in determining the online shopping
behavior in Pakistan and the key attributes that contribute to the switching behavior. 5
participants from the identified segments were invited to be the partakers.
Lastly, a survey question was modeled on the schematic provided by qualitative input, after
which the researchers went through numerous iterations to come up with the final questionnaire.
Findings
Findings from in depth interviews
The respondents were frequent online shoppers who had prior experience of online
shopping and had a set of preferences that he desired from specific shopping experiences. The
5
respondents generally regarded clothes shopping as a highly involved purchase. In case of online
shopping behavior, the respondents bought products to which they referred to as “standardized’
products1. These included cell phones, laptops and TVs. One of the major reasons that numerous
respondents mentioned for their online purchases was price economy. A frequent online store
that the respondent visited was homeshopping.pk. They found homeshoping.pk to be the most
price-effective as compared to other websites and even to wholesale shops at Saddar2. According
to a respondent, a certain TV was priced at Rs 38,000 at a nearby shop, whereas at Saddar it was
Rs 36,000 and at daraz.pk it was 42,000. The respondent purchased the TV from
homeshopping.pk at Rs 32,000. When questioned about whether lower prices created any doubt
or not, the respondent answered that he had shopped from there before so he was satisfied with
the service and quality. As far as the riskiness of online shopping was concerned, the respondent
said that the cash on delivery factor was instrumental in mitigating that risk. When asked about
other categories, e.g. garments or shoes, the respondent mentioned that he would like to try them
before purchasing. However, when questioned about the possibility, whether a software were to
be developed which would calculate the exact dimension of the shoe size or the shirt size, then
the respondent suggested that he may switch to purchasing these ‘customized’ items online.
The belief statements of some of the respondents are as follows;
1. Price is an important criterion.
2. Homeshopping.pk is price effective.
3. Homeshopping.pk is even cheaper than Saddar.
4. Daraz.pk is overpriced.
5. Service is an important criterion as well.
1 Products which the respondent thought would be the same at every channel, e.g. electronics.
2 Wholesale Electronic Market in Karachi.
6
6. Homeshopping.pk has a good service.
7. Online shopping is convenient.
8. Cash on delivery is highly important for my purchase.
Upon much discussion with the interviewee, it was found that price was a fundamental
factor in their decision for selection of a retail channel, and that price and quality did not
inversely correlate.
The behavioral statements of some of the respondents are as follows;
1. I buy standard products, usually electronics.
2. I bought three cell phones, one television and one laptop.
3. I made all my online purchases from homeshopiping.pk.
4. I would not buy clothes from an online store.
5. I spend 3 to 4 hours on shopping for clothes.
6. I like to try out clothes and feel the fabric before I buy them.
7. If I can somehow get a trial and a good price then I might buy clothes online as well.
8. I confirm the prices from Google, nearby shops and Saddar before I make my purchase
online
9. First I select the products I need, and then I do price comparison.
As seen from the behavior, the interviewees were interested in a certain category if they
decided to make an online purchase. Even after deciding for an online purchase they would do
their research so that they’re certain about the product requirements. And finally after deciding
the price they research on prices and make purchase from wherever they get the best price. Even
though homeshopping.pk gives the convenience the respondents need, the respondents majorly
inclines towards homeshoipnng.pk is because of the high discounts.
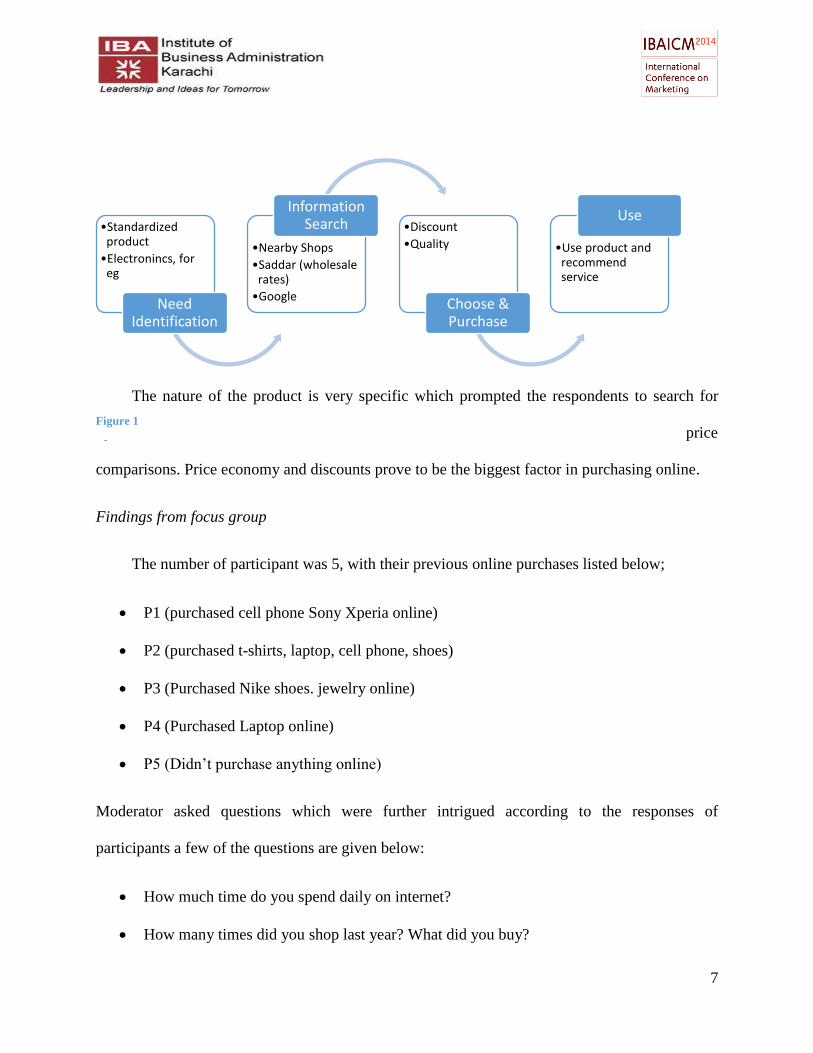
The respondent’s Experience Map can be expressed in figure 1.
7
The nature of the product is very specific which prompted the respondents to search for
options online. The information is searched on traditional channel as well as on the web for price
comparisons. Price economy and discounts prove to be the biggest factor in purchasing online.
Findings from focus group
The number of participant was 5, with their previous online purchases listed below;
P1 (purchased cell phone Sony Xperia online)
P2 (purchased t-shirts, laptop, cell phone, shoes)
P3 (Purchased Nike shoes. jewelry online)
P4 (Purchased Laptop online)
P5 (Didn’t purchase anything online)
Moderator asked questions which were further intrigued according to the responses of
participants a few of the questions are given below:
How much time do you spend daily on internet?
How many times did you shop last year? What did you buy?
•Standardized product
•Electronincs, for eg
Need Identification
•Nearby Shops
•Saddar (wholesale rates)
Information Search •Discount
•Quality
Choose & Purchase
•Use product and recommend service
Use
Figure 1
8
How many times did you purchase online in past year?
What are the attributes that made you buy online?
What is the worst thing about online shopping?
How extensive do you search for the products online?
Comparison of online vs. offline? Why do you prefer one over other?
How much are you willing to spend online?
Out of the members who took part in our study, 2 were professionals and 3 were students.
Their age was between 24-34 years. 1 out of 5 had never purchased online, 1 was frequent buyer
and other 3 had only bought 1-2 things in past year but they ranged Rs. 15000-100000.
All the participants on average said they spend 2-3 hours on internet excluding the
assignments and professional work. When the moderator asked about how many times they had
shopped and what did they buy in last one year, 2 respondents were of the view that they usually
buy clothes 2 times a year but more often go for grocery shopping while 1 of the respondent
mentioned a list of items that he purchased last year which included (cell phone, tablet, clothes,
and shoes). 1 said he only buy clothes whenever he goes for shopping and buys it when it only
when needed.
Next, moderator asked regarding the online shopping in the past year? 1 participant bought
Mobile Sony Xperia; another was heavy online purchaser who had bought in total 5 items in last
year from online shopping (shirt, mobile, laptop cover online). 1 said he has done a lot of online
shopping in America but only once in Pakistan i.e. of branded shoes (Nike). One of the
participants was pro brick & mortar shopper, said his credit card might get misused. Upon asking
about cash on delivery, the respondent said that he did know about this facility but still would
9
prefer offline because in that he could feel the product. He further added that he could compare
easily among the alternatives, so offline is better regardless of the category of product. One of
the respondent disagreed with him and said if it’s a technology oriented product than it is better
to go for online because it’s difficult to trust the Saddar3 mobile market shop, whereas for clothes
offline gives the feel of the product.
When the moderator asked the respondents about the factors that will make them buy
online, one of the respondents said that friend’s recommendation is of much important. Another
respondent mentioned there is no uniformity, even the website’s like eBay and Amazon
sometimes give bad services so some friend’s might have had the bad experience on same site. 2
respondents were of the view that if they buy it directly from company’s website like Dell or
Apple then it would be credible. A Participant mentioned that cash on delivery was the key
element in Pakistani market without which he would not even consider online shopping.
Price was another important factor and according to the respondent, the price that
homeshopping.pk offered was the cheapest. When the moderator further intrigued the
respondents on what would their decision be if the same prices were offered online and offline. 2
respondents said they would prefer online because of convenience. 3 respondents said that they
would prefer brick and mortar. They added that only with large discounts and strong return
policy, they would consider online shopping.
When the moderator asked what the worst thing about online shopping, the all respondents
uniformly agreed that they can’t feel and see the product. One of the respondent mentioned that
availability issues as sometimes there is a stock out.
3 Wholesale electronics market in Karachi
10
When the moderator posed the question, which attributes are most important when you
make a purchase either online or offline, 2 said prices and the reliability. 1 responded that he was
willing to pay premium for the quality and reliability of the source. Another said he wants value
for money. Last one said convenience in the most important factor.
When the respondents were asked to compare brick and mortar with online, on average
according to the participants, brick and mortar was high on experience whereas online was high
on convenience and comparison between the products.
When asked about different categories that participants would consider for online
shopping- all unanimously agreed that they would go for standardized products specifically
electronics like cell phones, laptops, tablets. But one of the respondent said he would go for
clothes because it’s a cheaper item and he wouldn’t want to risk a lot of his money. According to
our in depth analysis, reliability, cash on delivery and warranty were the most important factors
which could motivate a non-buyer to buy from online stores.
Findings from survey questionnaires
Perceptual/Brand Mapping Results
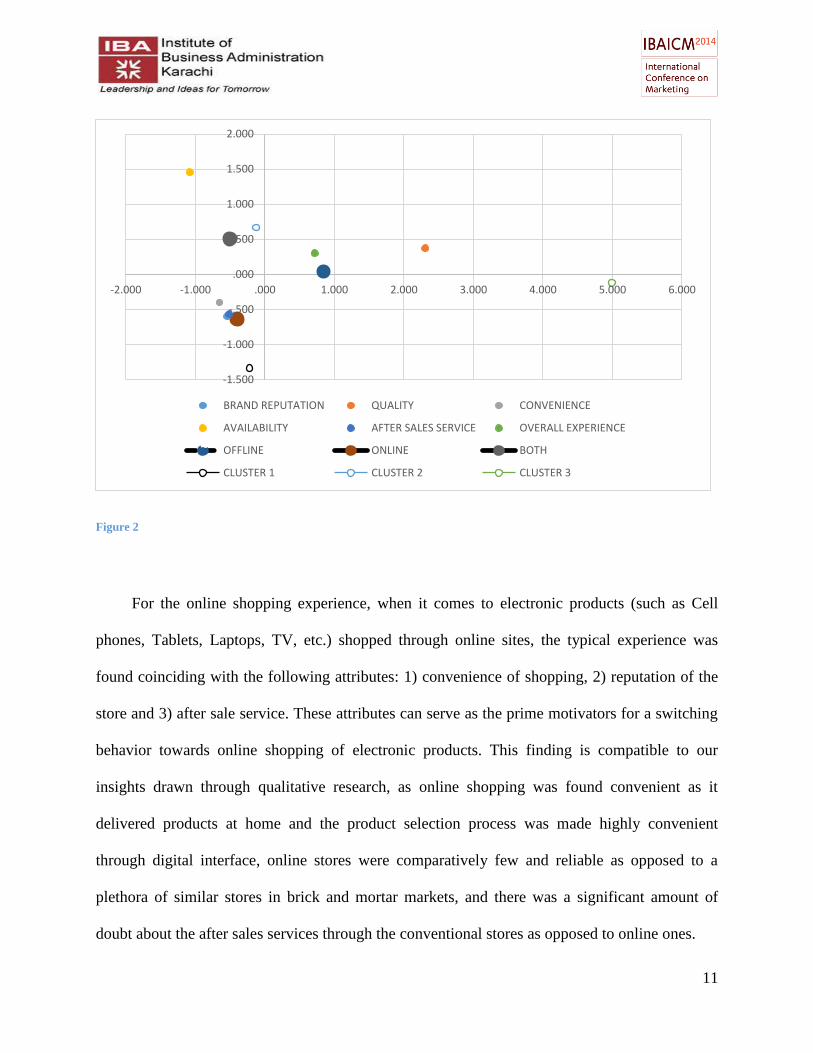
Figure 2 illustrates the perceptual/brand map of electronic products among online shoppers
in Pakistan.
11
Figure 2
For the online shopping experience, when it comes to electronic products (such as Cell
phones, Tablets, Laptops, TV, etc.) shopped through online sites, the typical experience was
found coinciding with the following attributes: 1) convenience of shopping, 2) reputation of the
store and 3) after sale service. These attributes can serve as the prime motivators for a switching
behavior towards online shopping of electronic products. This finding is compatible to our
insights drawn through qualitative research, as online shopping was found convenient as it
delivered products at home and the product selection process was made highly convenient
through digital interface, online stores were comparatively few and reliable as opposed to a
plethora of similar stores in brick and mortar markets, and there was a significant amount of
doubt about the after sales services through the conventional stores as opposed to online ones.
-1.500
-1.000
-.500
.000
.500
1.000
1.500
2.000
-2.000 -1.000 .000 1.000 2.000 3.000 4.000 5.000 6.000
BRAND REPUTATION QUALITY CONVENIENCE
AVAILABILITY AFTER SALES SERVICE OVERALL EXPERIENCE
OFFLINE ONLINE BOTH
CLUSTER 1 CLUSTER 2 CLUSTER 3
12
In terms of the shopping for electronic products through brick and mortar stores it was
found that the following attributes sufficiently described the experience: 1) overall shopping
experience and 2) quality. It seems that brick and mortar stores still define the traditional delight
of shopping which is often enhanced as the shopper is accompanied by friends/or family and
often coupled with food consumption. This type of shopping can easily turn into a fun filled
outing experience plus the provision of testing products at hand can be a firm boost.
Online shopping being a relatively new platform still lacks trust in the eyes of shoppers in
terms of the quality of products. Another reason for this could be the relatively expensive nature
of electronic products which demands higher emphasis on quality and testing before the purchase
decision is made.
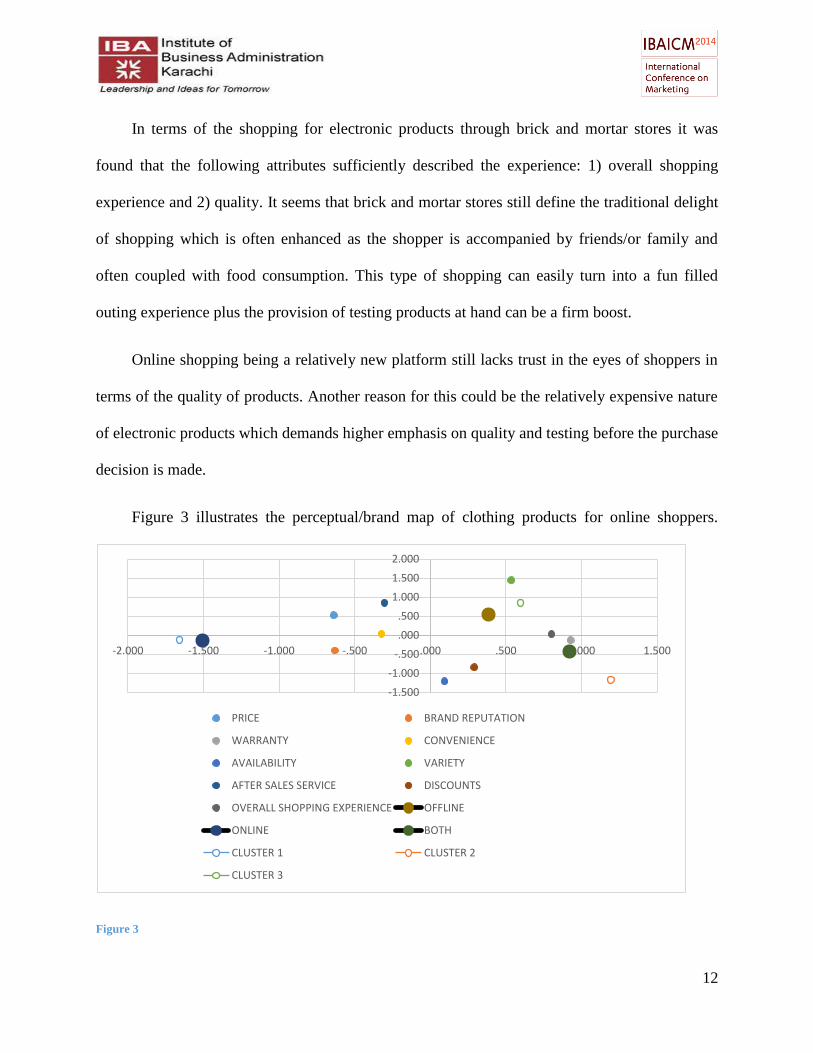
Figure 3 illustrates the perceptual/brand map of clothing products for online shoppers.
Figure 3
-1.500
-1.000
-.500
.000
.500
1.000
1.500
2.000
-2.000 -1.500 -1.000 -.500 .000 .500 1.000 1.500
PRICE BRAND REPUTATION
WARRANTY CONVENIENCE
AVAILABILITY VARIETY
AFTER SALES SERVICE DISCOUNTS
OVERALL SHOPPING EXPERIENCE OFFLINE
ONLINE BOTH
CLUSTER 1 CLUSTER 2
CLUSTER 3
13
The online shopping experience for clothing based products was found related to the
following attributes: 1) price, 2) convenience and 3) company reputation. Since online shopping
is a newer medium, the trust deficit has to be sufficed with a procedure hooked to company
reputation/brand and since the knowledge of online market is limited, the shopping is probably
confined to searching within certain brand portfolios.
Clothing product selection is often based on the best design available and hence selecting
from a physical outlet can be an exhaustive procedure whereas digital interface and search tools
can ease the process. Price is found as an additional attribute relevant to online shopping in
comparison to electronic products as clothing purchases are relatively greater in number and
volume and as opposed to electronic products the portfolio of products within a single brand can
have plenty of options and price ranges which renders price as an important attribute.
The offline shopping experience was found compatible to the following attributes: 1)
overall shopping experience, 2) warranty/ return and 3) variety. Clothing products often involve
a great emphasis on testing prior to purchase which is not seen as a necessity rather fun activity.
In addition to testing, clothing shopping experience can gain immense significance when it is
coincided with shopping for special occasions which can be enhanced through peer/family
opinions. Clothes can sometimes be needed to be returned, which is easier done through brick
and mortar stores than online ones and even if online stores declare such return policies,
consumers might hesitate in doing so as it not only overburdens the company but also is a
lengthy and uncertain process.
14
As clothing brick and mortar stores are often found in clusters/ markets variety is amply
provided as opposed to online sources where the markets are still in their nascent stages of
development. An important psychological barrier involved in this could be that even with sites
including a variety of products/brands, they are still perceived as a super store rather a whole
market of products.
Segments based on perceptual/brand maps
Convenience Seeker: This segment of our consumers were found to have relatively simpler
and selective decision criteria designed to optimize their shopping experience in terms of
convenience. This type of consumer is making decision based on convenience, company
reputation and after sales services. All these attributes seems to be easing the three stages of
shopping, first the company reputation makes the store selection simpler, then the convenient
execution of purchase (probably getting products delivered to home/office) can direct shopping
procedure and then a reliable after sales service ensures that any product issues are dealt
promptly and effectively.
Shopping Enthusiast: These types of consumers were found prioritizing shopping
experience and quality over all other attributes. This hints towards the high involvement of this
type of consumer as he/she is looking for the best source in terms of providing high quality. In
addition to this, the experience of shopping is important as the consumer relishes the shopping as
a pivotal component of his/her lifestyle. Another key ingredient in shopping attributes could be
variety for this segment. As expressed earlier, shopping is a valued experience for them which do
15
get more exciting with more variety available (which probably increases the overall time of
shopping as well and with it the fun in it).
Value Maximizer: These kinds of consumers are trying to make an optimal purchase
decision based on price, convenience and company reputation. They might prefer online
shopping as opposed to brick and mortar since they do look for convenience, yet they are doing
for significant reasons (of may be time shortage is one) but they do appear to maximizing on
price and company reputation as well which suggests that they belong to less affluent financial
backgrounds as opposed to ‘convenience seekers’.
16
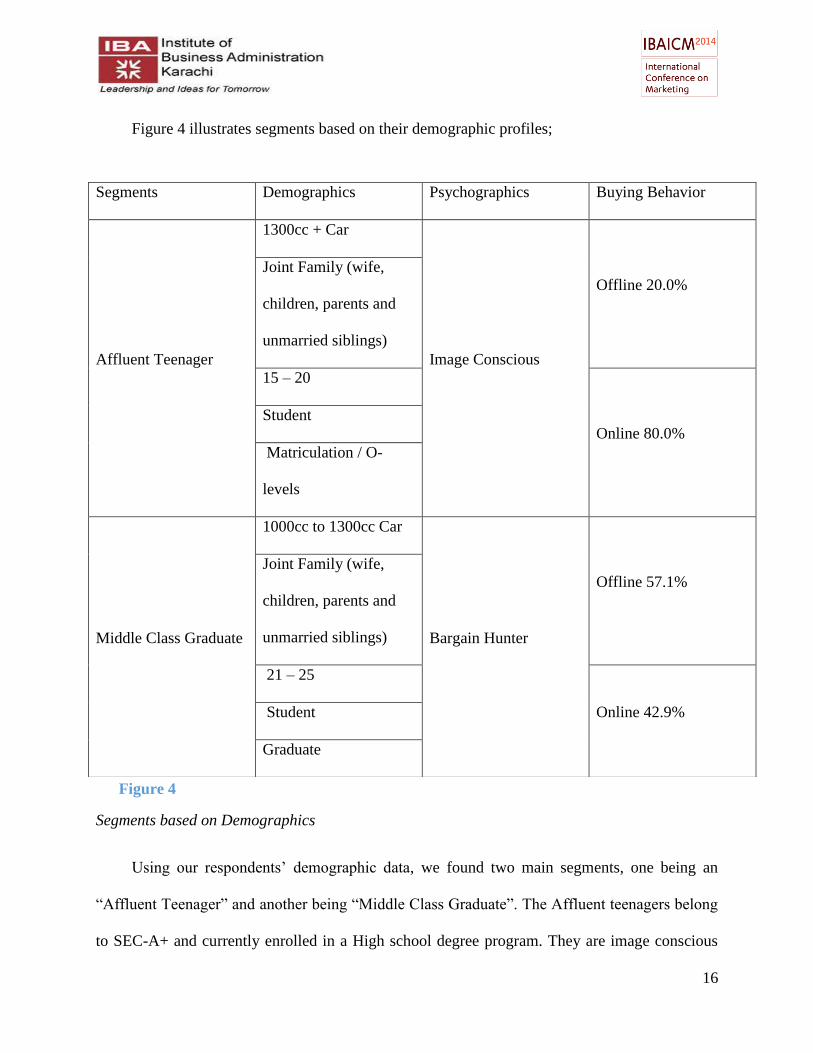
Figure 4 illustrates segments based on their demographic profiles;
Segments based on Demographics
Using our respondents’ demographic data, we found two main segments, one being an
“Affluent Teenager” and another being “Middle Class Graduate”. The Affluent teenagers belong
to SEC-A+ and currently enrolled in a High school degree program. They are image conscious
Segments Demographics Psychographics Buying Behavior
Affluent Teenager
1300cc + Car
Image Conscious
Offline 20.0% Joint Family (wife,
children, parents and
unmarried siblings)
15 – 20
Online 80.0%
Student
Matriculation / O-
levels
Middle Class Graduate
1000cc to 1300cc Car
Bargain Hunter
Offline 57.1% Joint Family (wife,
children, parents and
unmarried siblings)
21 – 25
Online 42.9% Student
Graduate
Figure 4
17
and looking at their behavior patterns, they are more probable to buy products online because of
high convenience or because buying from online sources is important for them to project an
image of being up-to-date on latest shopping trends. On the other hand, the Middle Class
graduate belongs to SEC-A, and is currently enrolled in a graduate degree program. He is more
inclined towards looking for best deals/offers. Belonging to a relatively mature age, this segment
is still more skeptic towards online shopping and probably still believes in the value optimizing
potential of brick & mortar store.
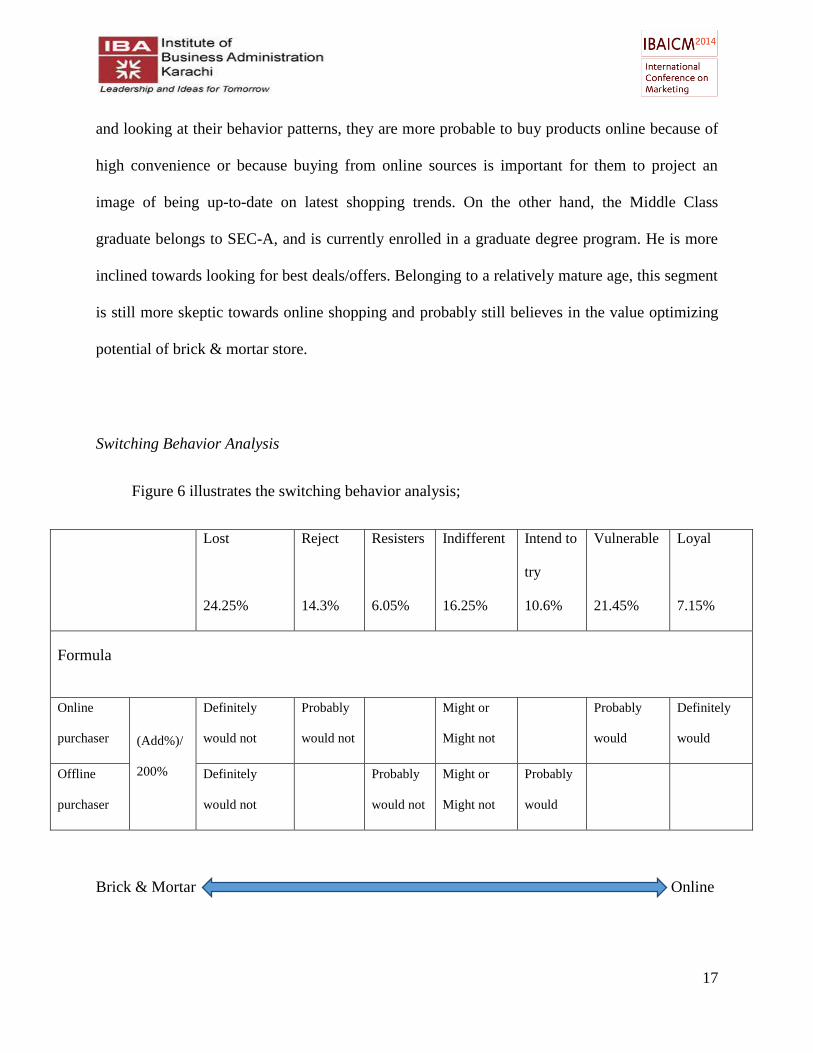
Switching Behavior Analysis
Figure 6 illustrates the switching behavior analysis;
Lost
24.25%
Reject
14.3%
Resisters
6.05%
Indifferent
16.25%
Intend to
try
10.6%
Vulnerable
21.45%
Loyal
7.15%
Formula
Online
purchaser (Add%)/
200%
Definitely
would not
Probably
would not
Might or
Might not
Probably
would
Definitely
would
Offline
purchaser
Definitely
would not
Probably
would not
Might or
Might not
Probably
would
Brick & Mortar Online
18
The analysis for switching behavior suggests that 7.15% of the overall sample is loyal to
online shopping, having bought from online and being completely satisfied from it. While 21.4%
seems vulnerable to switch to brick & mortar stores being less satisfied from online shopping
experience.
10.6% of our sample had been buying products from brick & mortar but suggest that they
do intend to try products online as well. Contrary to that, 6.05% of our sample are found resisting
to switch to online shopping having been buying products from brick & mortar till now.
14.3% of our sample was found rejecting the online shopping being largely discontent from
online shopping experience. 24.25% of our sample has shown strictly negative evaluations for
online shopping either after having tried it or not even willing to try it ever.
Background Working and Statistics
Perceptual/Brand Maps
We have chosen electronic and clothing products to draw brand maps. The reason for
selecting clothing and electronics is that our qualitative research had indicated that most of the
online shopping was done for clothing and electronic products. Secondly, based on our
qualitative research we could estimate that most of the perceptual differences could be aptly
explained represented through these two categories of products.
In order to draw the brand maps (for clothing and electronic products), we first used ‘step-
wise discriminant analysis with dependent categorical variable of ‘current usage’ data and
independent variables of ‘attribute importance’. We used step-wise discriminant analysis to find
19
the attributes that were significant for both clothing and electronics functions. As a result, we had
the coordinate scores for grouping variables as well as attributes.
To find out different segments and plot them on these graphs, we used factor scores of all
respondents and performed cluster analysis. The resultant cluster centers served as ‘ideal vectors’
for the different segments.
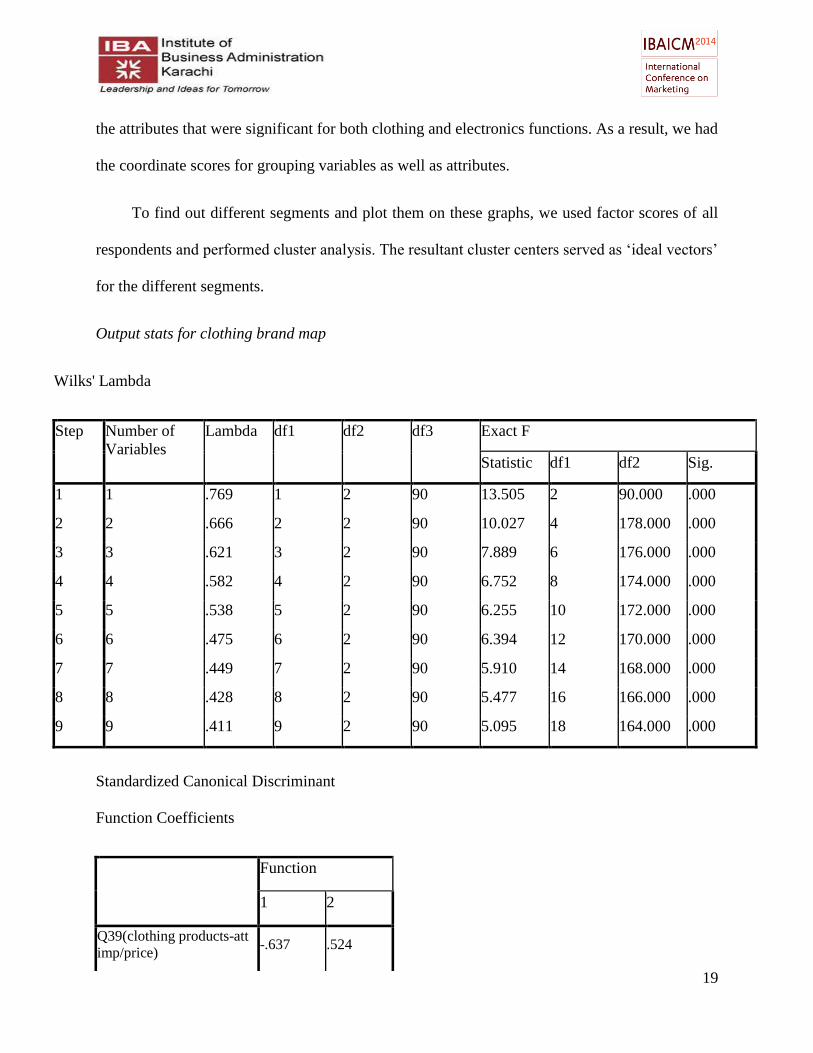
Output stats for clothing brand map
Wilks' Lambda
Step Number of
Variables
Lambda df1 df2 df3 Exact F
Statistic df1 df2 Sig.
1 1 .769 1 2 90 13.505 2 90.000 .000
2 2 .666 2 2 90 10.027 4 178.000 .000
3 3 .621 3 2 90 7.889 6 176.000 .000
4 4 .582 4 2 90 6.752 8 174.000 .000
5 5 .538 5 2 90 6.255 10 172.000 .000
6 6 .475 6 2 90 6.394 12 170.000 .000
7 7 .449 7 2 90 5.910 14 168.000 .000
8 8 .428 8 2 90 5.477 16 166.000 .000
9 9 .411 9 2 90 5.095 18 164.000 .000
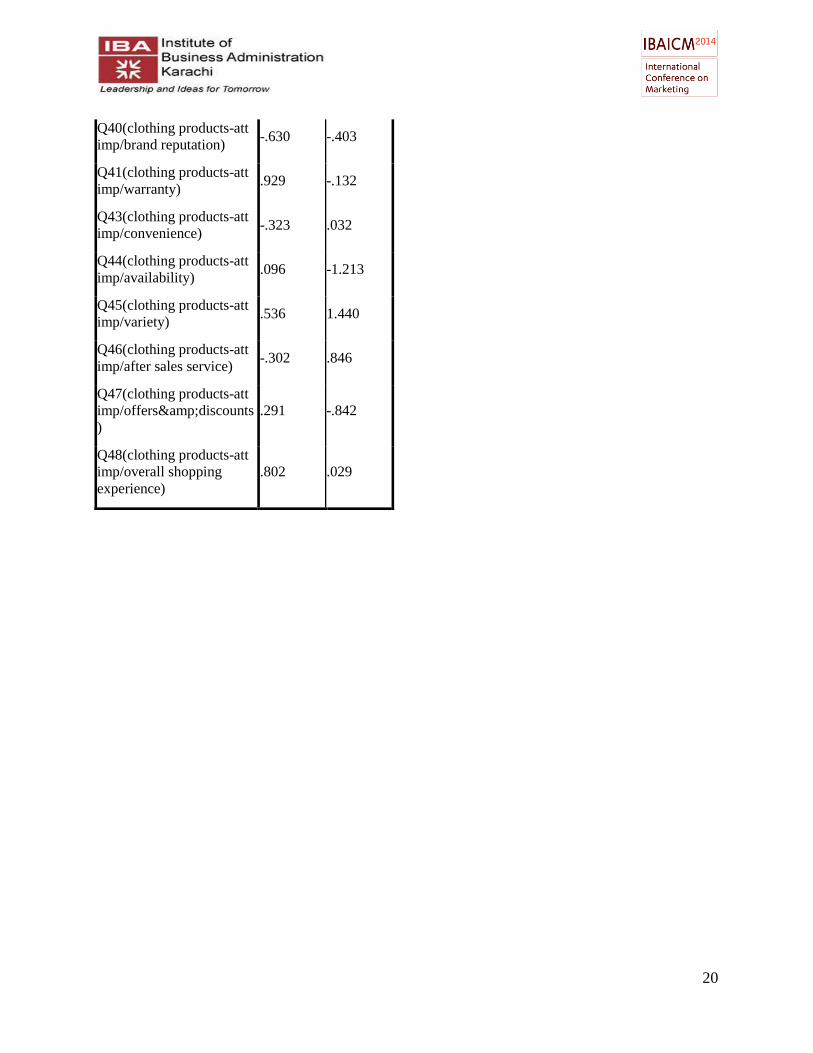
Standardized Canonical Discriminant
Function Coefficients
Function
1 2
Q39(clothing products-att
imp/price) -.637 .524
20
Q40(clothing products-att
imp/brand reputation) -.630 -.403
Q41(clothing products-att
imp/warranty) .929 -.132
Q43(clothing products-att
imp/convenience) -.323 .032
Q44(clothing products-att
imp/availability) .096 -1.213
Q45(clothing products-att
imp/variety) .536 1.440
Q46(clothing products-att
imp/after sales service) -.302 .846
Q47(clothing products-att
imp/offers&discounts
) .291 -.842
Q48(clothing products-att
imp/overall shopping
experience) .802 .029
21
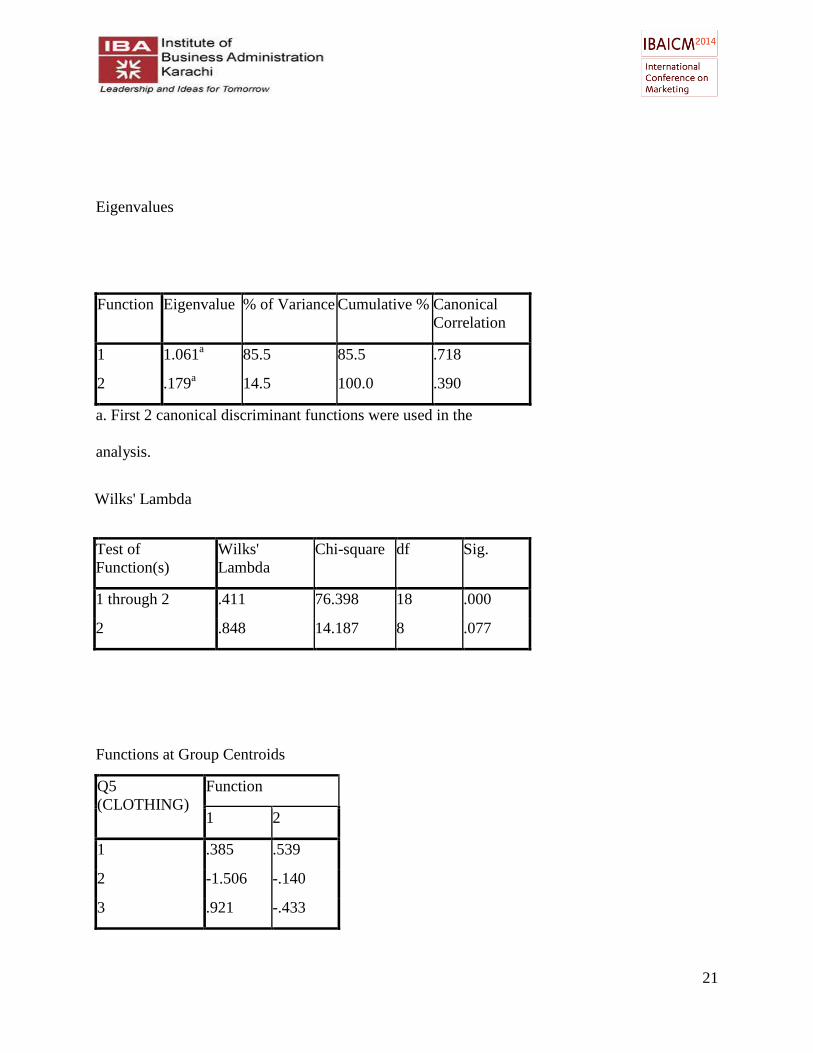
Wilks' Lambda
Test of
Function(s)
Wilks'
Lambda
Chi-square df Sig.
1 through 2 .411 76.398 18 .000
2 .848 14.187 8 .077
Eigenvalues
Function Eigenvalue % of Variance Cumulative % Canonical
Correlation
1 1.061a 85.5 85.5 .718
2 .179a 14.5 100.0 .390
a. First 2 canonical discriminant functions were used in the
analysis.
Functions at Group Centroids
Q5
(CLOTHING)
Function
1 2
1 .385 .539
2 -1.506 -.140
3 .921 -.433
22
Unstandardized canonical
discriminant functions evaluated at
group means
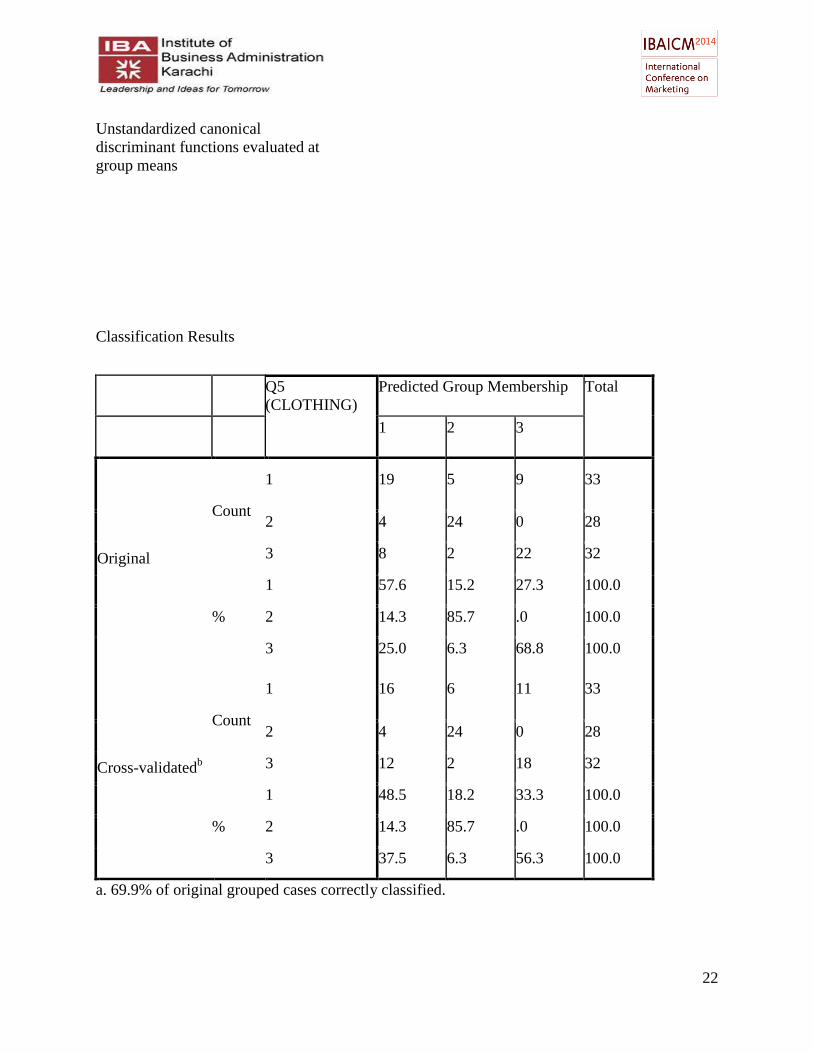
Classification Results
Q5
(CLOTHING)
Predicted Group Membership Total
1 2 3
Original
Count
1 19 5 9 33
2 4 24 0 28
3 8 2 22 32
%
1 57.6 15.2 27.3 100.0
2 14.3 85.7 .0 100.0
3 25.0 6.3 68.8 100.0
Cross-validatedb
Count
1 16 6 11 33
2 4 24 0 28
3 12 2 18 32
%
1 48.5 18.2 33.3 100.0
2 14.3 85.7 .0 100.0
3 37.5 6.3 56.3 100.0
a. 69.9% of original grouped cases correctly classified.
23
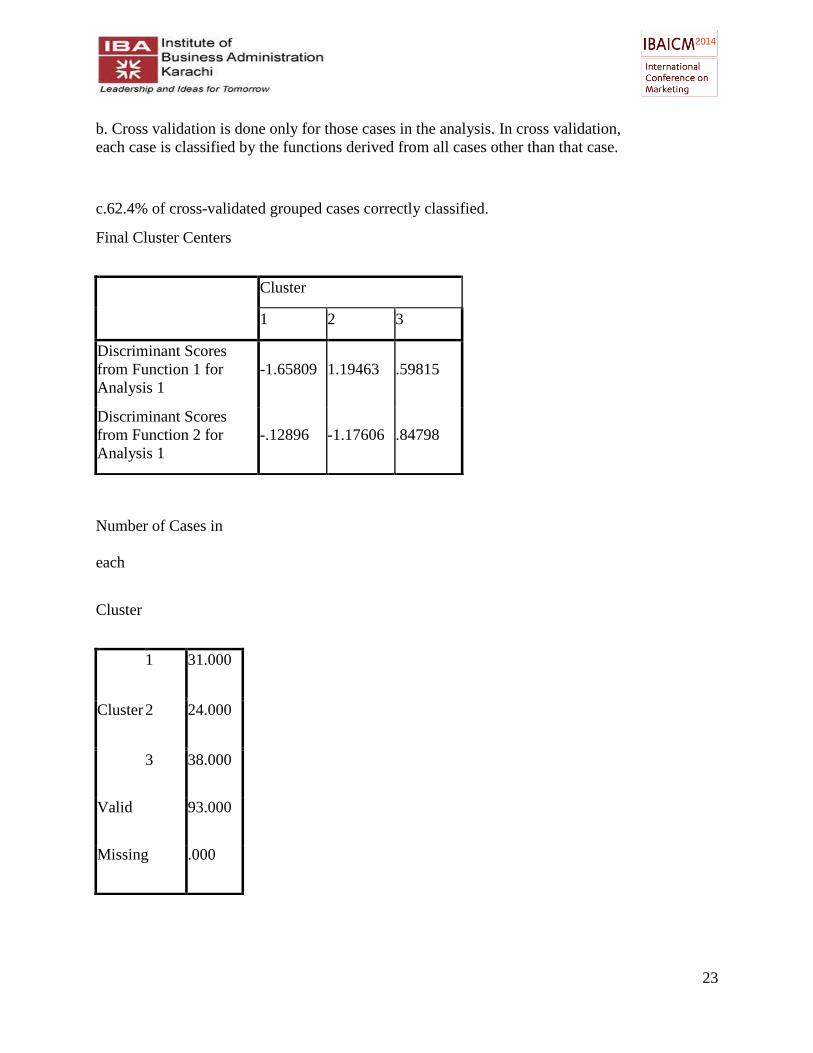
b. Cross validation is done only for those cases in the analysis. In cross validation,
each case is classified by the functions derived from all cases other than that case.
c.62.4% of cross-validated grouped cases correctly classified.
Final Cluster Centers
Cluster
1 2 3
Discriminant Scores
from Function 1 for
Analysis 1
-1.65809 1.19463 .59815
Discriminant Scores
from Function 2 for
Analysis 1
-.12896 -1.17606 .84798
Number of Cases in
each
Cluster
Cluster
1 31.000
2 24.000
3 38.000
Valid 93.000
Missing .000
24
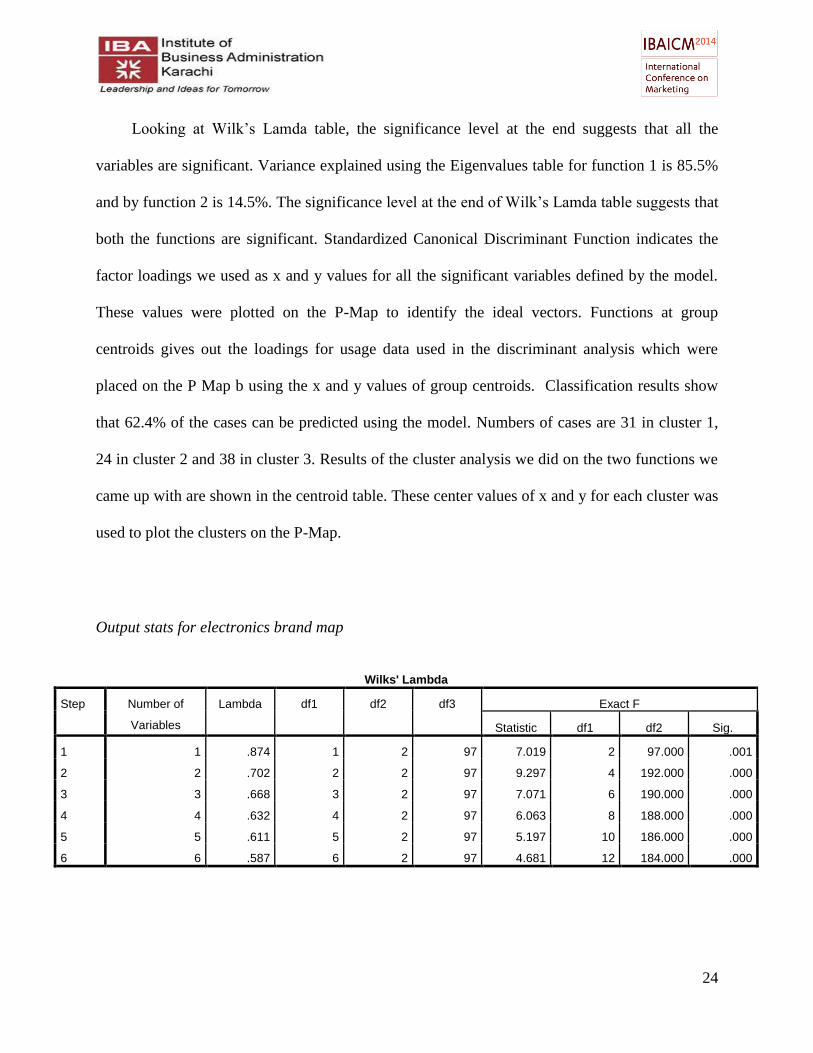
Looking at Wilk’s Lamda table, the significance level at the end suggests that all the
variables are significant. Variance explained using the Eigenvalues table for function 1 is 85.5%
and by function 2 is 14.5%. The significance level at the end of Wilk’s Lamda table suggests that
both the functions are significant. Standardized Canonical Discriminant Function indicates the
factor loadings we used as x and y values for all the significant variables defined by the model.
These values were plotted on the P-Map to identify the ideal vectors. Functions at group
centroids gives out the loadings for usage data used in the discriminant analysis which were
placed on the P Map b using the x and y values of group centroids. Classification results show
that 62.4% of the cases can be predicted using the model. Numbers of cases are 31 in cluster 1,
24 in cluster 2 and 38 in cluster 3. Results of the cluster analysis we did on the two functions we
came up with are shown in the centroid table. These center values of x and y for each cluster was
used to plot the clusters on the P-Map.
Output stats for electronics brand map
Wilks' Lambda
Step Number of
Variables
Lambda df1 df2 df3 Exact F
Statistic df1 df2 Sig.
1 1 .874 1 2 97 7.019 2 97.000 .001
2 2 .702 2 2 97 9.297 4 192.000 .000
3 3 .668 3 2 97 7.071 6 190.000 .000
4 4 .632 4 2 97 6.063 8 188.000 .000
5 5 .611 5 2 97 5.197 10 186.000 .000
6 6 .587 6 2 97 4.681 12 184.000 .000
25
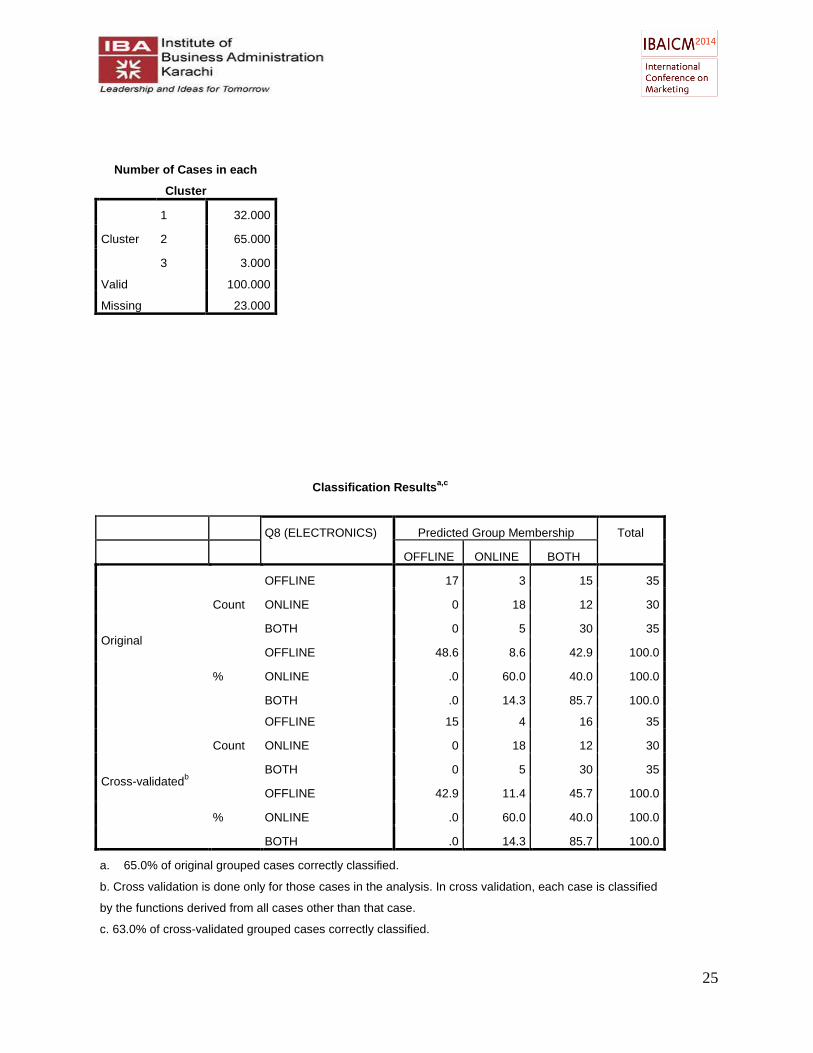
Number of Cases in each
Cluster
Cluster
1 32.000
2 65.000
3 3.000
Valid 100.000
Missing 23.000
Classification Resultsa,c
Q8 (ELECTRONICS) Predicted Group Membership Total
OFFLINE ONLINE BOTH
Original
Count
OFFLINE 17 3 15 35
ONLINE 0 18 12 30
BOTH 0 5 30 35
%
OFFLINE 48.6 8.6 42.9 100.0
ONLINE .0 60.0 40.0 100.0
BOTH .0 14.3 85.7 100.0
Cross-validatedb
Count
OFFLINE 15 4 16 35
ONLINE 0 18 12 30
BOTH 0 5 30 35
%
OFFLINE 42.9 11.4 45.7 100.0
ONLINE .0 60.0 40.0 100.0
BOTH .0 14.3 85.7 100.0
a. 65.0% of original grouped cases correctly classified.
b. Cross validation is done only for those cases in the analysis. In cross validation, each case is classified
by the functions derived from all cases other than that case.
c. 63.0% of cross-validated grouped cases correctly classified.
26
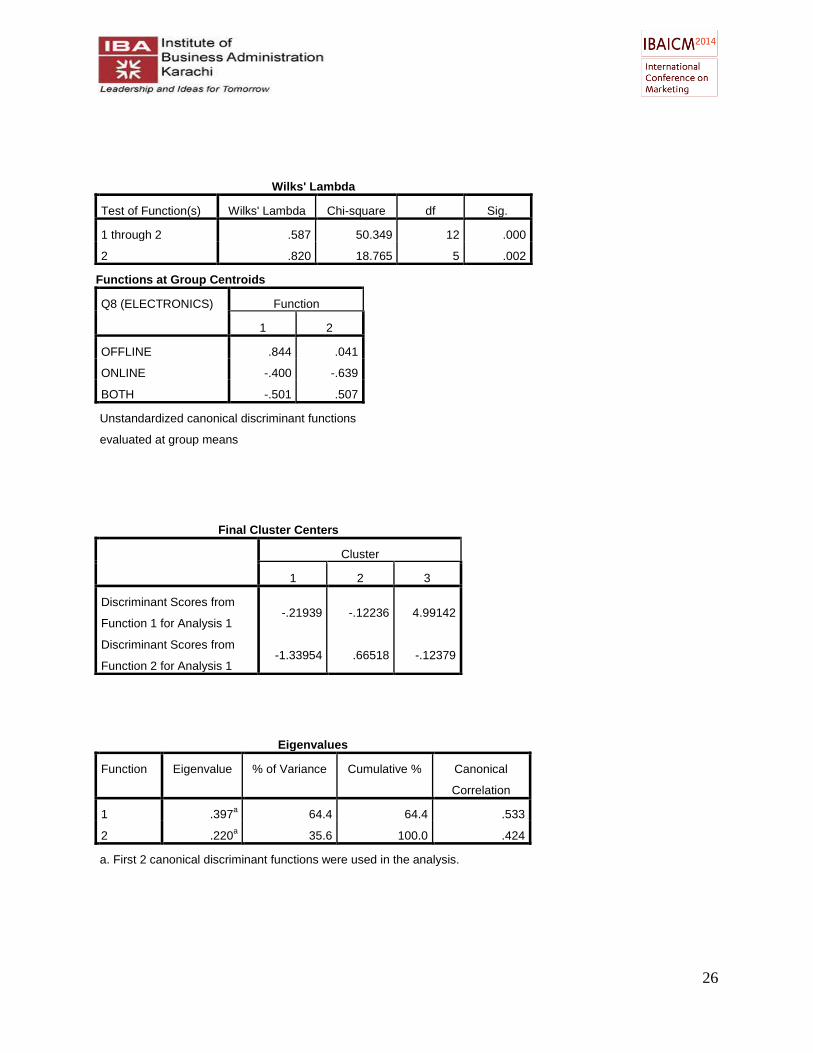
Functions at Group Centroids
Q8 (ELECTRONICS) Function
1 2
OFFLINE .844 .041
ONLINE -.400 -.639
BOTH -.501 .507
Unstandardized canonical discriminant functions
evaluated at group means
Wilks' Lambda
Test of Function(s) Wilks' Lambda Chi-square df Sig.
1 through 2 .587 50.349 12 .000
2 .820 18.765 5 .002
Final Cluster Centers
Cluster
1 2 3
Discriminant Scores from
Function 1 for Analysis 1 -.21939 -.12236 4.99142
Discriminant Scores from
Function 2 for Analysis 1 -1.33954 .66518 -.12379
Eigenvalues
Function Eigenvalue % of Variance Cumulative % Canonical
Correlation
1 .397a 64.4 64.4 .533
2 .220a 35.6 100.0 .424
a. First 2 canonical discriminant functions were used in the analysis.
27
Looking at Wilk’s Lamda table, the significance level at the end suggests that all the
variables are significant. Variance explained using the Eigenvalues table for function 1 is 64.4%
and by function 2 is 35.6%. Looking at Wilk’s Lamda, the significance level at the end suggest
that both the functions are significant. Standardized Canonical Discriminant Function indicates
the factor loadings we used as x and y values for all the significant variables defined by the
model. These values were plotted on the P-Map to identify the ideal vectors. Functions at group
centroids gives out the loadings for usage data used in the discriminant analysis which were
placed on the P Map b using the x and y values of group centroids.
Classification results show that 63% of the cases can be predicted using the model. Results of the
cluster analysis we did on the two functions we came up with are shown in the centroid table.
These center values of x and y for each cluster were used to plot the clusters on the P-Map.
Numbers of cases are 32 in cluster 1, 65 in cluster 2 and 3 in cluster 3.
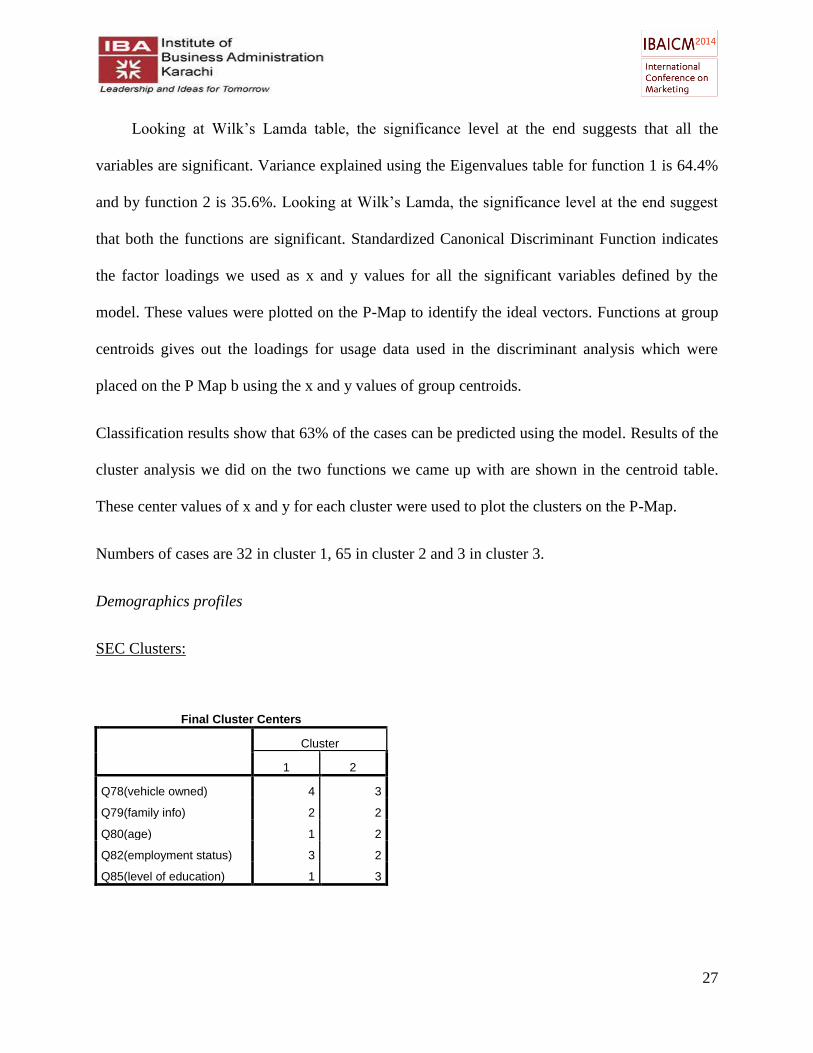
Demographics profiles
SEC Clusters:
Final Cluster Centers
Cluster
1 2
Q78(vehicle owned) 4 3
Q79(family info) 2 2
Q80(age) 1 2
Q82(employment status) 3 2
Q85(level of education) 1 3
28
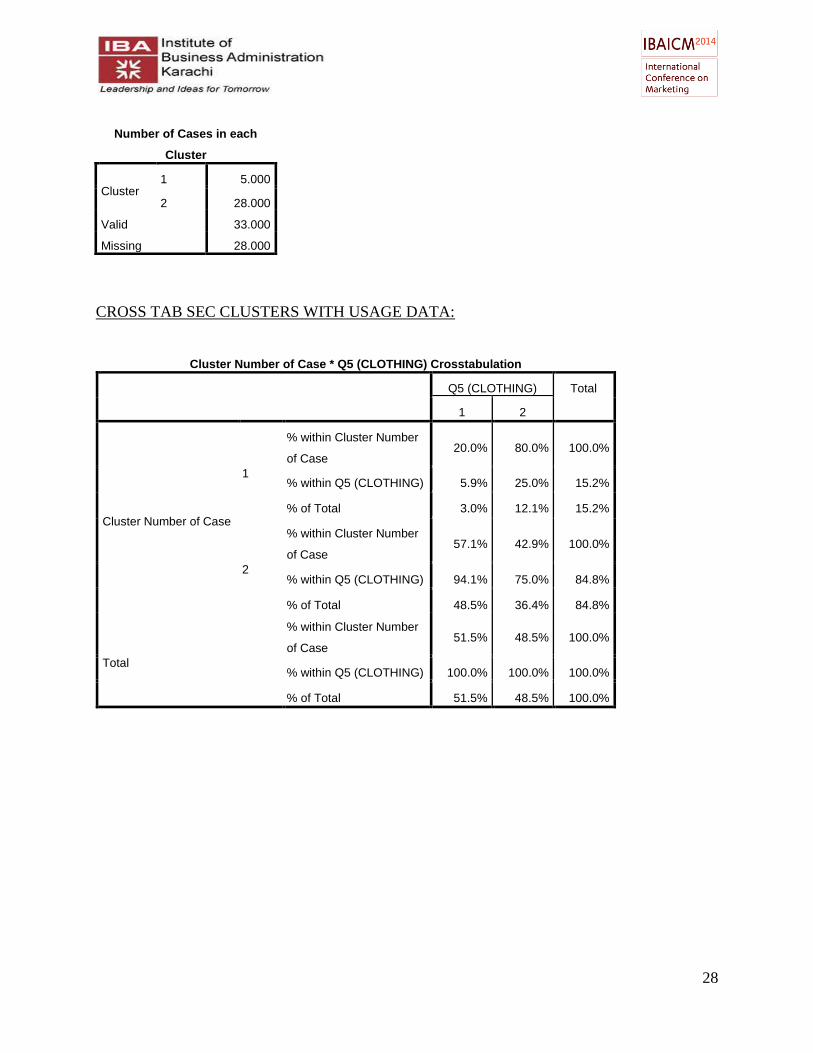
Number of Cases in each
Cluster
Cluster 1 5.000
2 28.000
Valid 33.000
Missing 28.000
CROSS TAB SEC CLUSTERS WITH USAGE DATA:
Cluster Number of Case * Q5 (CLOTHING) Crosstabulation
Q5 (CLOTHING) Total
1 2
Cluster Number of Case
1
% within Cluster Number
of Case 20.0% 80.0% 100.0%
% within Q5 (CLOTHING) 5.9% 25.0% 15.2%
% of Total 3.0% 12.1% 15.2%
2
% within Cluster Number
of Case 57.1% 42.9% 100.0%
% within Q5 (CLOTHING) 94.1% 75.0% 84.8%
% of Total 48.5% 36.4% 84.8%
Total
% within Cluster Number
of Case 51.5% 48.5% 100.0%
% within Q5 (CLOTHING) 100.0% 100.0% 100.0%
% of Total 51.5% 48.5% 100.0%
29
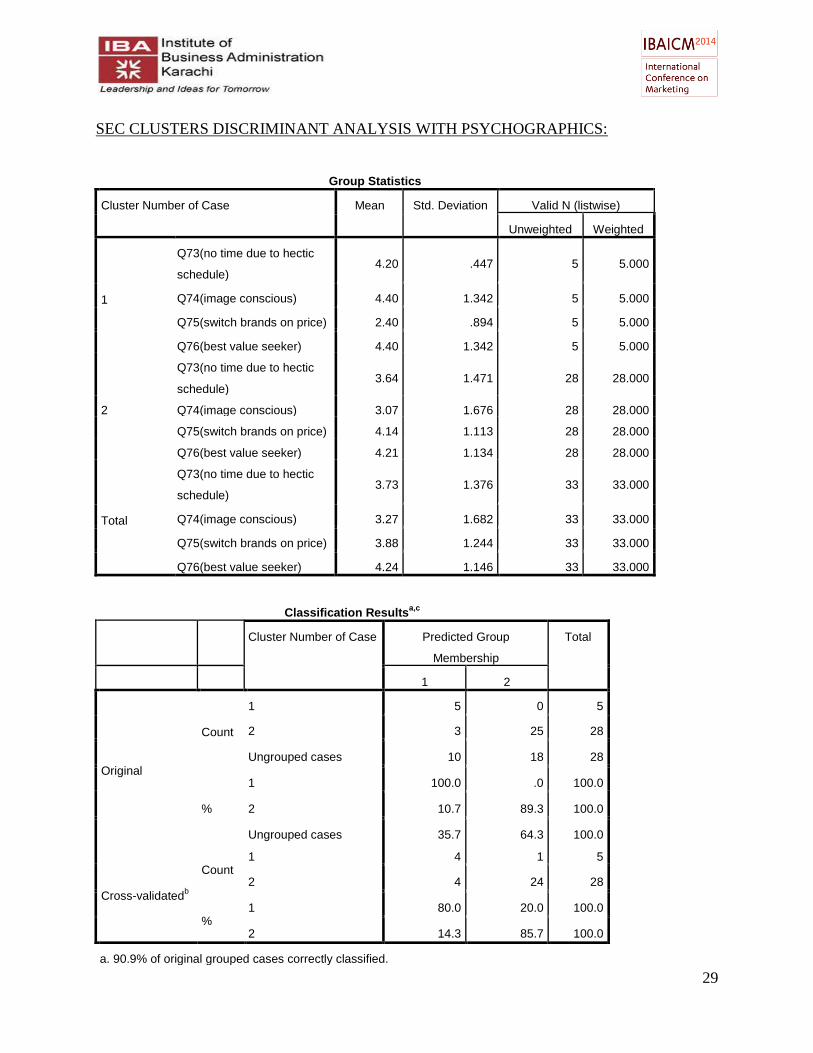
SEC CLUSTERS DISCRIMINANT ANALYSIS WITH PSYCHOGRAPHICS:
Group Statistics
Cluster Number of Case Mean Std. Deviation Valid N (listwise)
Unweighted Weighted
1
Q73(no time due to hectic
schedule) 4.20 .447 5 5.000
Q74(image conscious) 4.40 1.342 5 5.000
Q75(switch brands on price) 2.40 .894 5 5.000
Q76(best value seeker) 4.40 1.342 5 5.000
2
Q73(no time due to hectic
schedule) 3.64 1.471 28 28.000
Q74(image conscious) 3.07 1.676 28 28.000
Q75(switch brands on price) 4.14 1.113 28 28.000
Q76(best value seeker) 4.21 1.134 28 28.000
Total
Q73(no time due to hectic
schedule) 3.73 1.376 33 33.000
Q74(image conscious) 3.27 1.682 33 33.000
Q75(switch brands on price) 3.88 1.244 33 33.000
Q76(best value seeker) 4.24 1.146 33 33.000
Classification Resultsa,c
Cluster Number of Case Predicted Group
Membership
Total
1 2
Original
Count
1 5 0 5
2 3 25 28
Ungrouped cases 10 18 28
%
1 100.0 .0 100.0
2 10.7 89.3 100.0
Ungrouped cases 35.7 64.3 100.0
Cross-validatedb
Count 1 4 1 5
2 4 24 28
% 1 80.0 20.0 100.0
2 14.3 85.7 100.0
a. 90.9% of original grouped cases correctly classified.
30
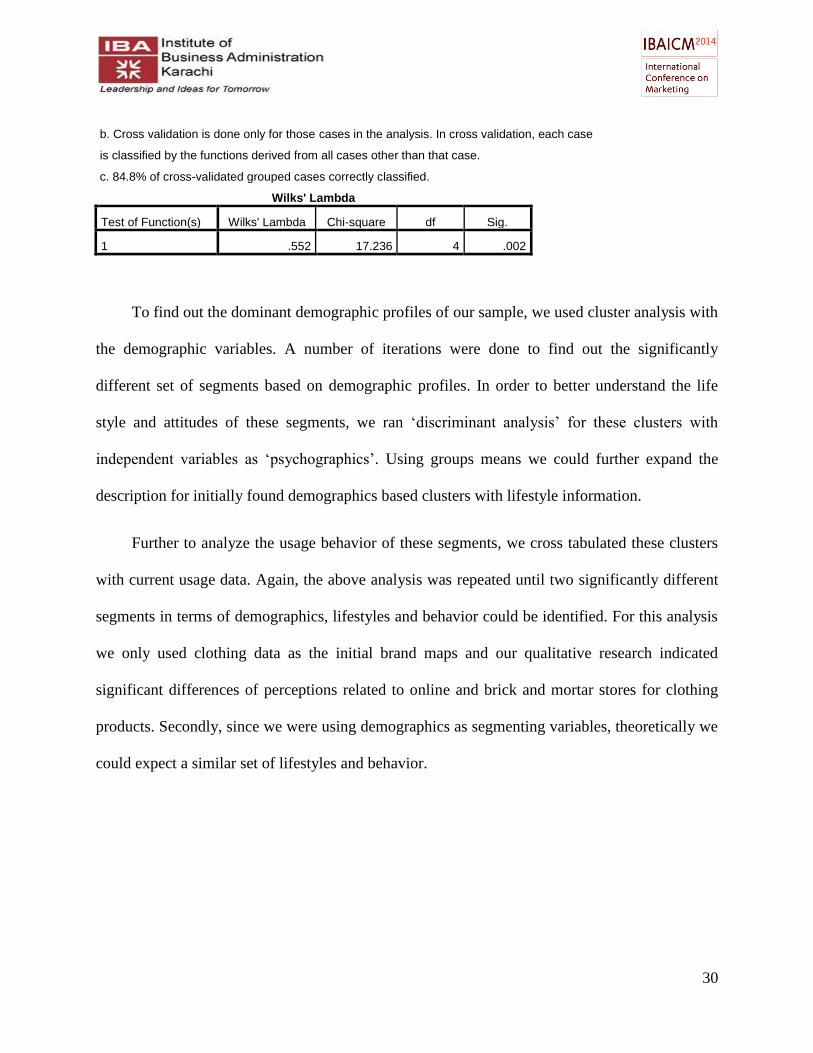
Wilks' Lambda
Test of Function(s) Wilks' Lambda Chi-square df Sig.
1 .552 17.236 4 .002
To find out the dominant demographic profiles of our sample, we used cluster analysis with
the demographic variables. A number of iterations were done to find out the significantly
different set of segments based on demographic profiles. In order to better understand the life
style and attitudes of these segments, we ran ‘discriminant analysis’ for these clusters with
independent variables as ‘psychographics’. Using groups means we could further expand the
description for initially found demographics based clusters with lifestyle information.
Further to analyze the usage behavior of these segments, we cross tabulated these clusters
with current usage data. Again, the above analysis was repeated until two significantly different
segments in terms of demographics, lifestyles and behavior could be identified. For this analysis
we only used clothing data as the initial brand maps and our qualitative research indicated
significant differences of perceptions related to online and brick and mortar stores for clothing
products. Secondly, since we were using demographics as segmenting variables, theoretically we
could expect a similar set of lifestyles and behavior.
b. Cross validation is done only for those cases in the analysis. In cross validation, each case
is classified by the functions derived from all cases other than that case.
c. 84.8% of cross-validated grouped cases correctly classified.
31
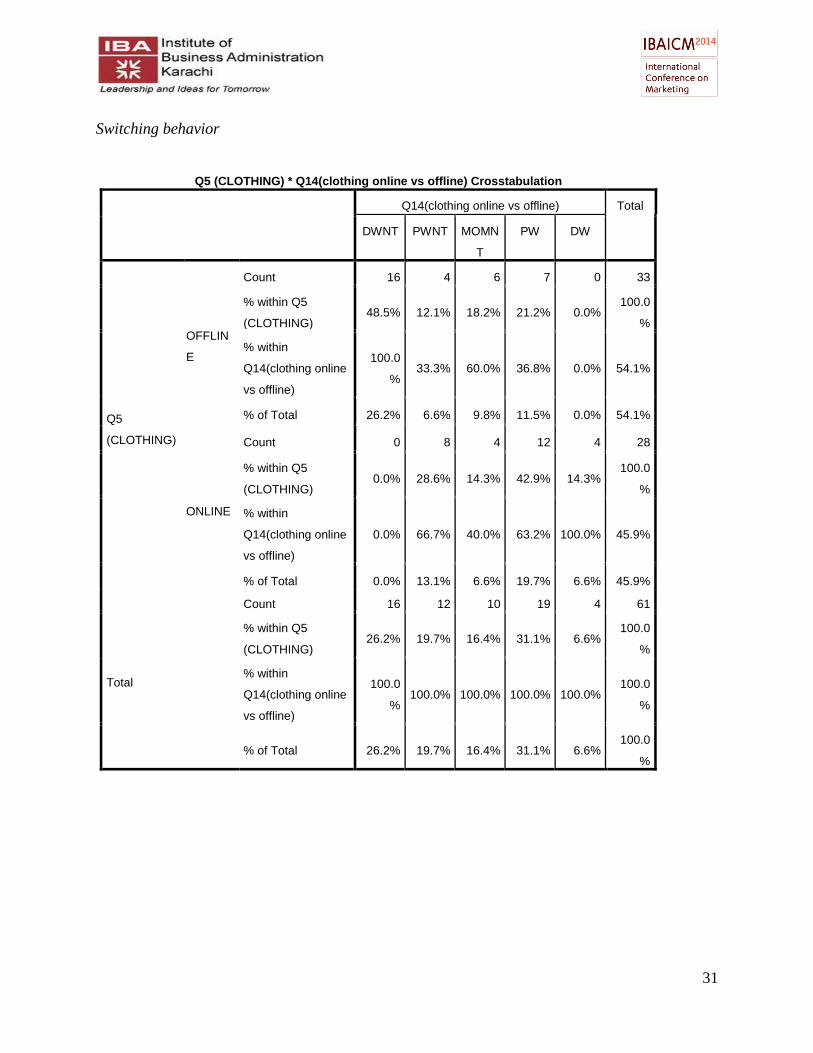
Switching behavior
Q5 (CLOTHING) * Q14(clothing online vs offline) Crosstabulation
Q14(clothing online vs offline) Total
DWNT PWNT MOMN
T
PW DW
Q5
(CLOTHING)
OFFLIN
E
Count 16 4 6 7 0 33
% within Q5
(CLOTHING) 48.5% 12.1% 18.2% 21.2% 0.0%
100.0
%
% within
Q14(clothing online
vs offline)
100.0
% 33.3% 60.0% 36.8% 0.0% 54.1%
% of Total 26.2% 6.6% 9.8% 11.5% 0.0% 54.1%
ONLINE
Count 0 8 4 12 4 28
% within Q5
(CLOTHING) 0.0% 28.6% 14.3% 42.9% 14.3%
100.0
%
% within
Q14(clothing online
vs offline)
0.0% 66.7% 40.0% 63.2% 100.0% 45.9%
% of Total 0.0% 13.1% 6.6% 19.7% 6.6% 45.9%
Total
Count 16 12 10 19 4 61
% within Q5
(CLOTHING) 26.2% 19.7% 16.4% 31.1% 6.6%
100.0
%
% within
Q14(clothing online
vs offline)
100.0
% 100.0% 100.0% 100.0% 100.0%
100.0
%
% of Total 26.2% 19.7% 16.4% 31.1% 6.6% 100.0
%
32
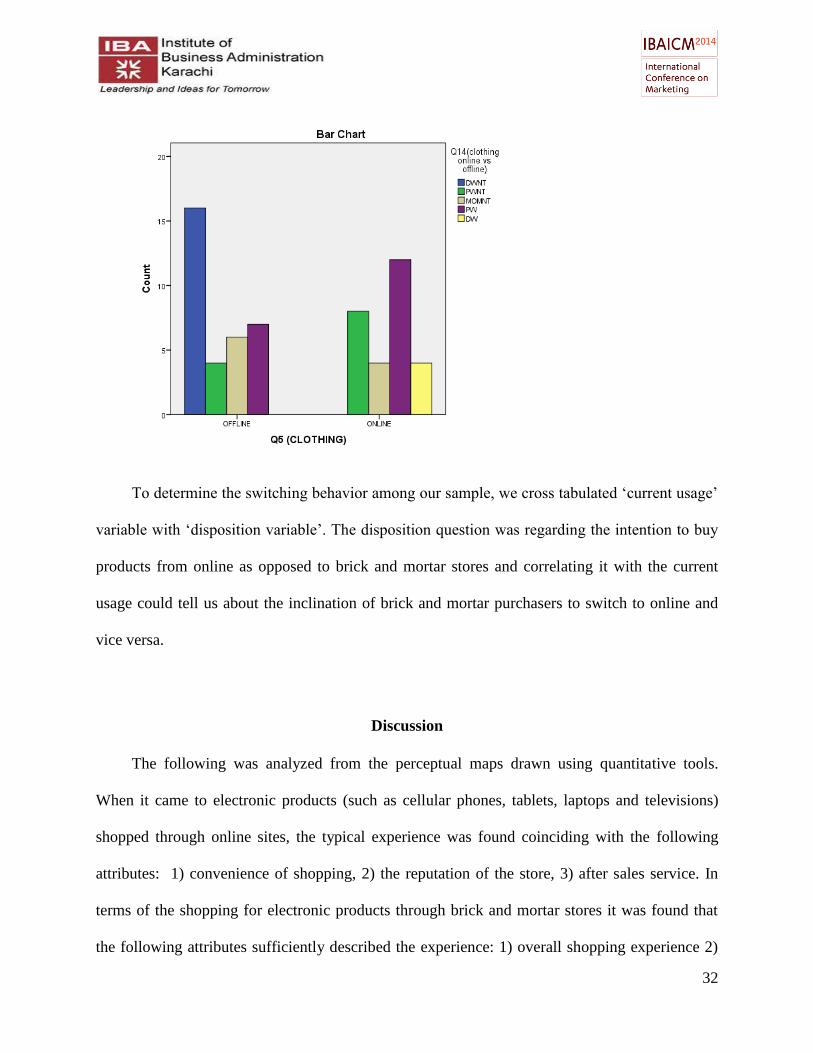
To determine the switching behavior among our sample, we cross tabulated ‘current usage’
variable with ‘disposition variable’. The disposition question was regarding the intention to buy
products from online as opposed to brick and mortar stores and correlating it with the current
usage could tell us about the inclination of brick and mortar purchasers to switch to online and
vice versa.
Discussion
The following was analyzed from the perceptual maps drawn using quantitative tools.
When it came to electronic products (such as cellular phones, tablets, laptops and televisions)
shopped through online sites, the typical experience was found coinciding with the following
attributes: 1) convenience of shopping, 2) the reputation of the store, 3) after sales service. In
terms of the shopping for electronic products through brick and mortar stores it was found that
the following attributes sufficiently described the experience: 1) overall shopping experience 2)
33
quality of purchase. For clothing based products (such as clothes, shoes, and clothing
accessories) the online shopping experience was found related to the following attributes: 1)
price 2) convenience 3) company reputation. The offline shopping experience was found
compatible to the following attributes: 1) overall shopping experience, 2) warranty/ return, 3)
variety.
The segments were divided into two categories, namely affluent teenagers, middle class
graduates. The demographics of the affluent teen was that he/she was a student, aged 15 to 20
years, and had 1300cc+ car at his/her home. On the perceptual map, this segment gave weightage
to attributes like exclusivity and brand image. This segment preferred shopping for electronics
online, but for clothing preferred brick & mortar. The Middle class graduate was mostly working
while studying part-time, was aged 21-25 and had car of 1000cc to 1300cc at his/ her home. This
segment was primarily a bargain hunter because of its relatively lesser disposable income. This
segment also preferred purchasing online as opposed to brick & mortar because online stores
were able to give the best possible price. For clothing, this segment preferred brick & mortar for
the better price.
As per our analysis, the experience expected from both the medium is different. For
purchasing a commodity offline, the customer would rate the overall shopping experience higher
as opposed to convenience. Now we had to establish that what type of goods would be preferred
online as opposed to through brick & mortar, and vice-versa.
34
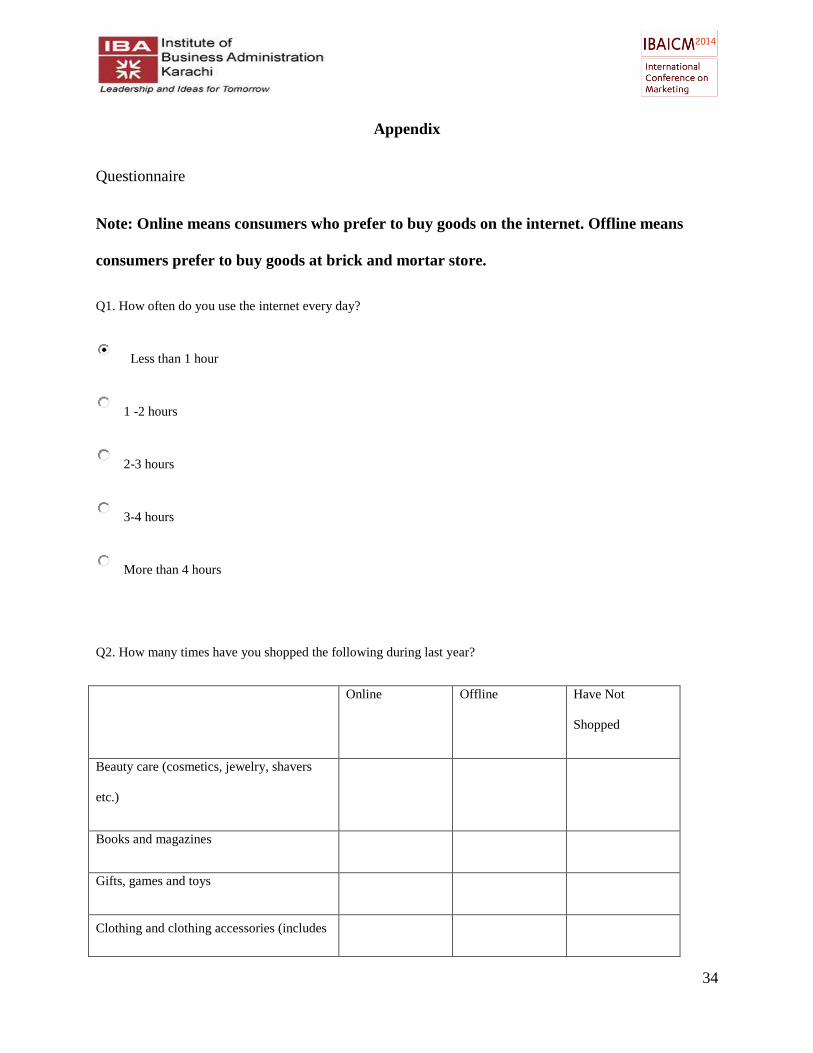
Appendix
Questionnaire
Note: Online means consumers who prefer to buy goods on the internet. Offline means
consumers prefer to buy goods at brick and mortar store.
Q1. How often do you use the internet every day?
Less than 1 hour
1 -2 hours
2-3 hours
3-4 hours
More than 4 hours
Q2. How many times have you shopped the following during last year?
Online Offline Have Not
Shopped
Beauty care (cosmetics, jewelry, shavers
etc.)
Books and magazines
Gifts, games and toys
Clothing and clothing accessories (includes

35
footwear)
Computer Products
Cell phones and tablets
Electronics and home appliances (including
camera and watch)
Replicas (1st copy)
Others
Q3. How often do you use Internet for information prior to a purchase?
Very Often Often Sometimes Rarely Never
Beauty care (cosmetics, jewelry,
shavers etc.)
Books and magazines
Gifts, games and toys
Clothing and clothing accessories
(includes footwear)
Computer Products
Cell phones and tablets
Electronics and home appliances
(including camera and watch)
Replicas (1st copy)
36
Others
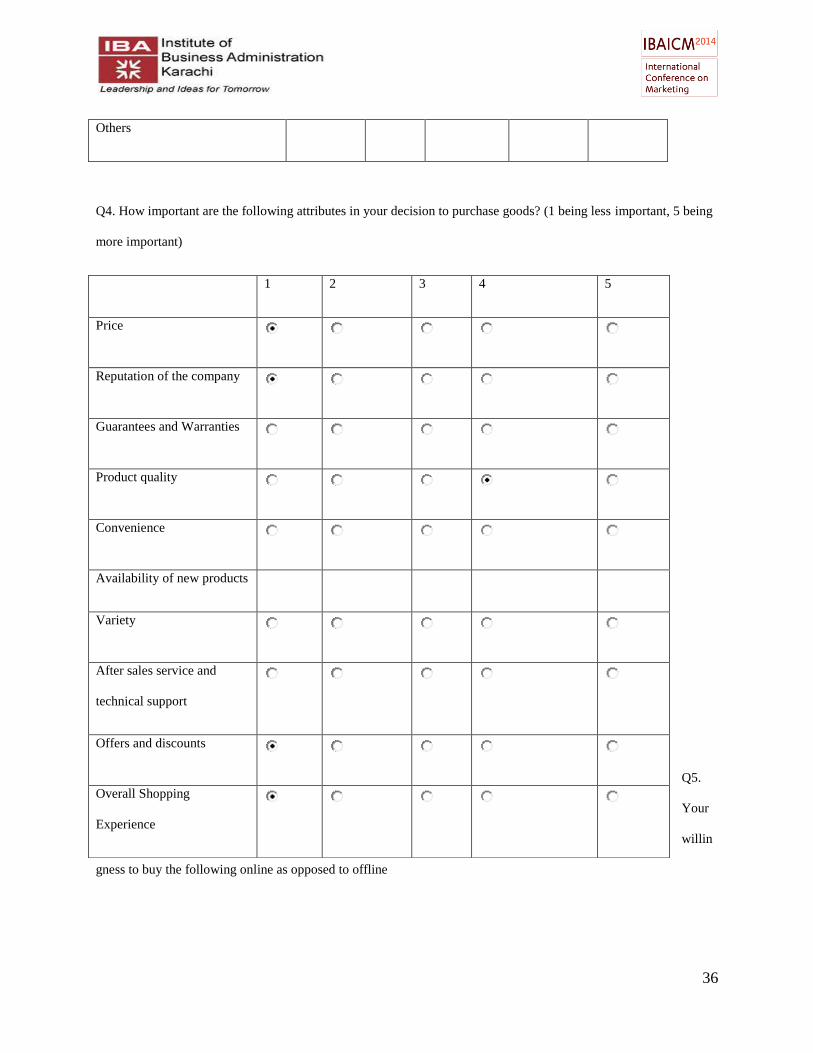
Q4. How important are the following attributes in your decision to purchase goods? (1 being less important, 5 being
more important)
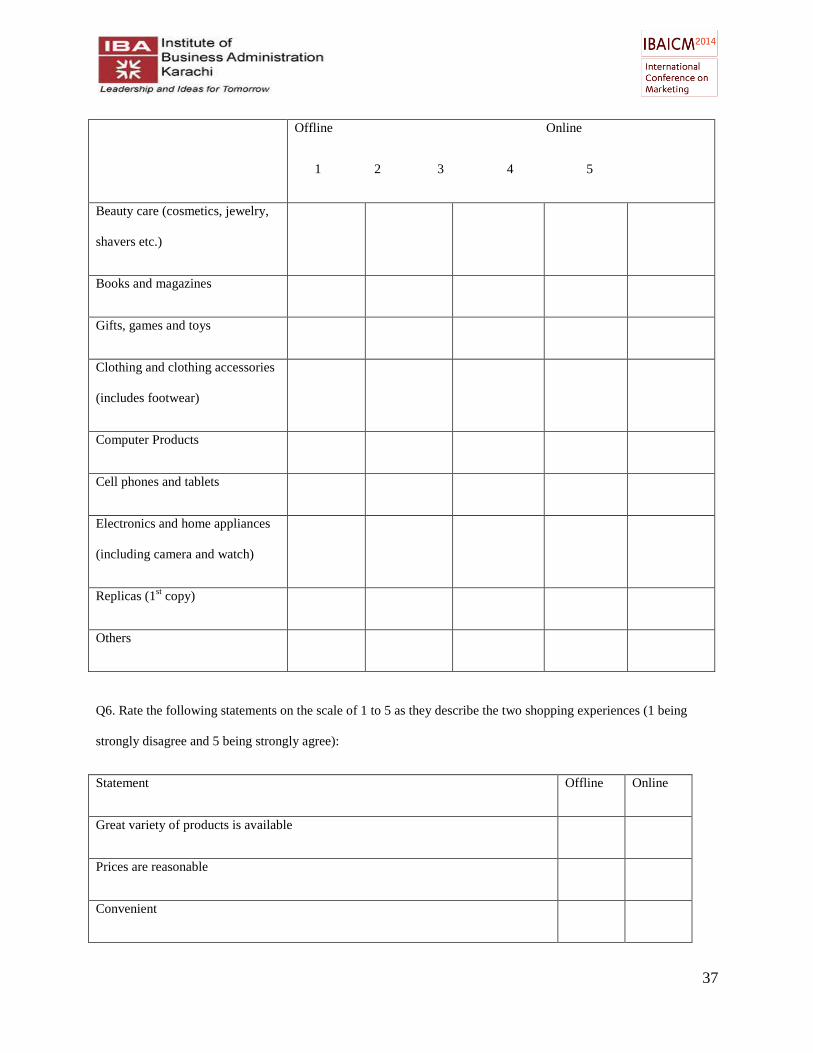
Q5.
Your
willin
gness to buy the following online as opposed to offline
1 2 3 4 5
Price
Reputation of the company
Guarantees and Warranties
Product quality
Convenience
Availability of new products
Variety
After sales service and
technical support
Offers and discounts
Overall Shopping
Experience
37
Offline Online
1 2 3 4 5
Beauty care (cosmetics, jewelry,
shavers etc.)
Books and magazines
Gifts, games and toys
Clothing and clothing accessories
(includes footwear)
Computer Products
Cell phones and tablets
Electronics and home appliances
(including camera and watch)
Replicas (1st copy)
Others
Q6. Rate the following statements on the scale of 1 to 5 as they describe the two shopping experiences (1 being
strongly disagree and 5 being strongly agree):
Statement Offline Online
Great variety of products is available
Prices are reasonable
Convenient
38
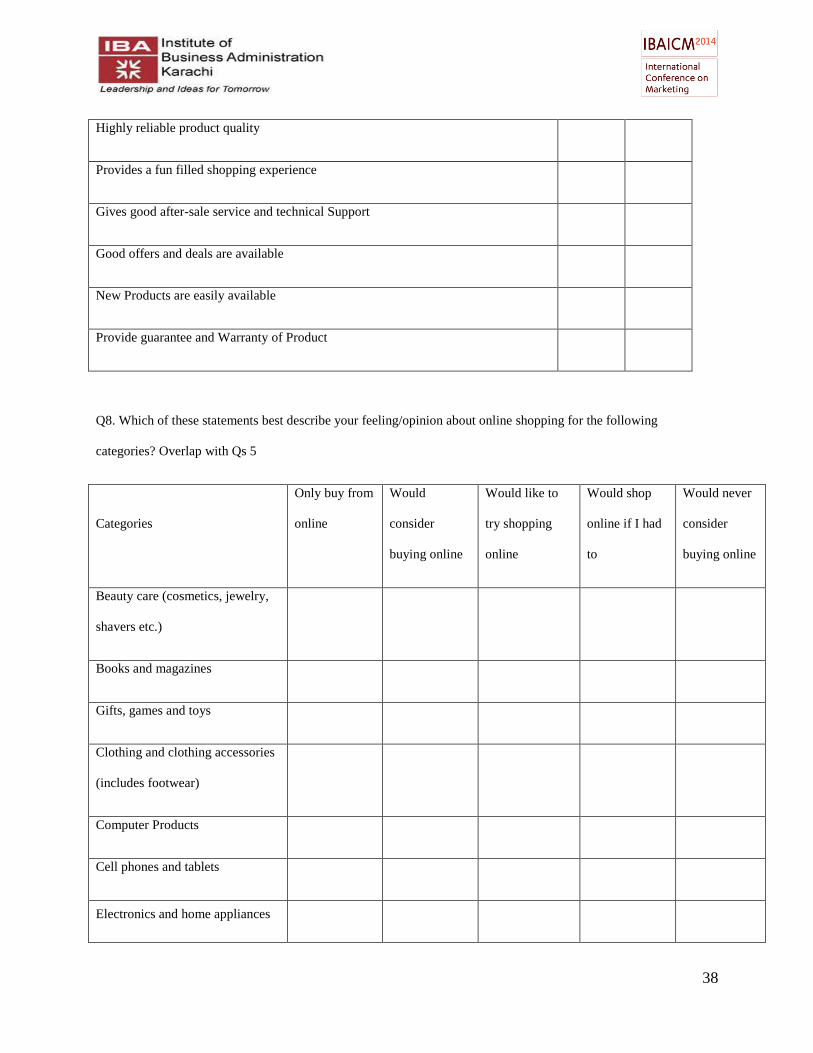
Highly reliable product quality
Provides a fun filled shopping experience
Gives good after-sale service and technical Support
Good offers and deals are available
New Products are easily available
Provide guarantee and Warranty of Product
Q8. Which of these statements best describe your feeling/opinion about online shopping for the following
categories? Overlap with Qs 5
Categories
Only buy from
online
Would
consider
buying online
Would like to
try shopping
online
Would shop
online if I had
to
Would never
consider
buying online
Beauty care (cosmetics, jewelry,
shavers etc.)
Books and magazines
Gifts, games and toys
Clothing and clothing accessories
(includes footwear)
Computer Products
Cell phones and tablets
Electronics and home appliances
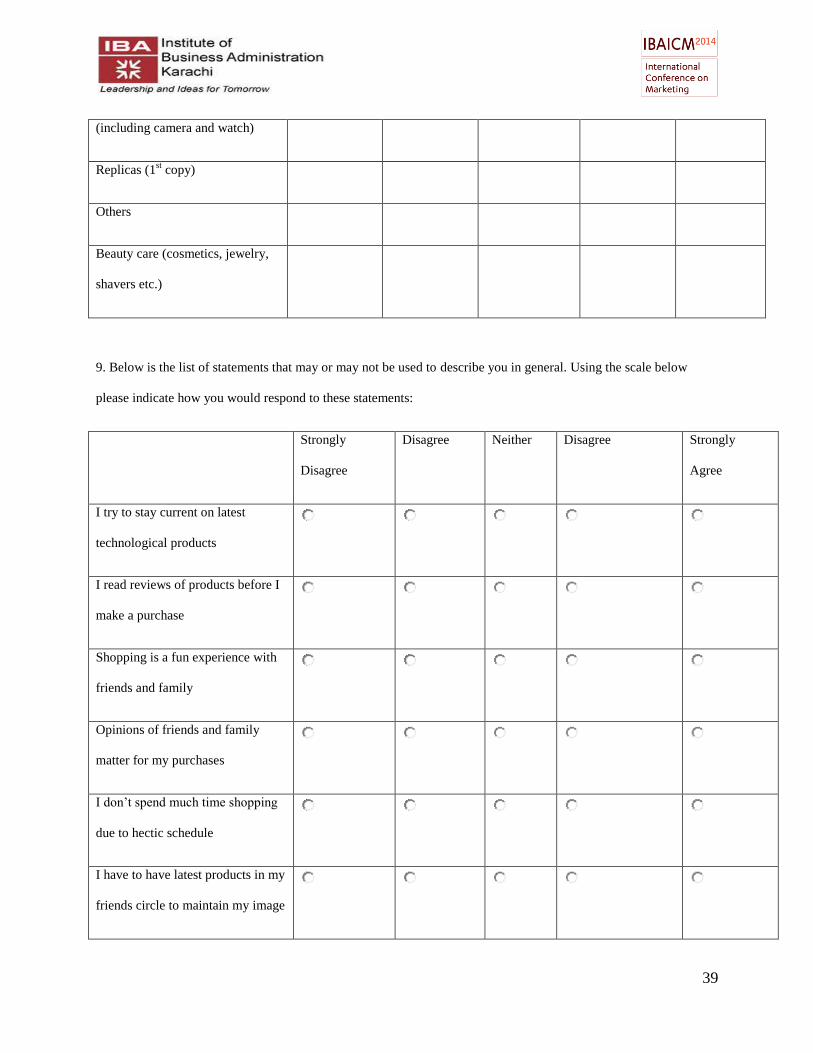
39
(including camera and watch)
Replicas (1st copy)
Others
Beauty care (cosmetics, jewelry,
shavers etc.)
9. Below is the list of statements that may or may not be used to describe you in general. Using the scale below
please indicate how you would respond to these statements:
Strongly
Disagree
Disagree Neither Disagree Strongly
Agree
I try to stay current on latest
technological products
I read reviews of products before I
make a purchase
Shopping is a fun experience with
friends and family
Opinions of friends and family
matter for my purchases
I don’t spend much time shopping
due to hectic schedule
I have to have latest products in my
friends circle to maintain my image
40
I will switch brands based on
prices
I am constantly looking for best
value for moneys
I look for replica products for
highly expensive brands
10. Does anyone in your home own the following (tick as many as apply, and state the quantity):
Motorcycle ___
Up to 1000cc car ___
1300cc or 1300cc+ car ___
11. Family Information
Nuclear Family (wife and children)
Joint Family (wife, children, parents and unmarried siblings)
Extended Family (multiple families and parents)
41
12. Personal Information
AGE:
15 – 20
21 - 25
26-30
31 and Above
12. Gender:
Male
Female
13. Occupation:
Which of the following describes your employment status?
Full - Time
Part - Time
42
Retired
Student
Homemaker
Unemployed
14. Are you:
Single, separated, divorced, widowed
Married, living as married
15. Which of the following best represents the last level of education that you completed:
Matriculation / O-levels
F.Sc./ A-levels (college)
Graduate
Post Graduate