Embed Size (px)
Citation preview
Online Testing: Who’s Doing It & What Are They Doing
IPAC 2011 Conference
Washington, D.C.July 18, 2011
Jason Schaefer, M.B.A., M.A.Clinton Kelly
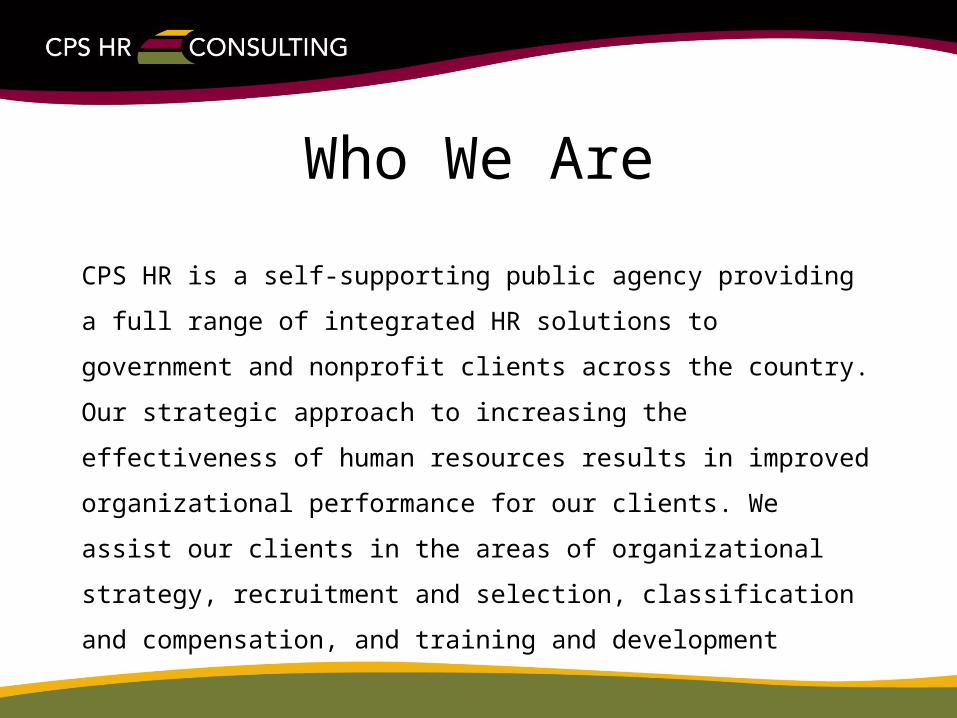
Who We Are
CPS HR is a self-supporting public agency providing a full
range of integrated HR solutions to government and
nonprofit clients across the country. Our strategic
approach to increasing the effectiveness of human
resources results in improved organizational performance
for our clients. We assist our clients in the areas of
organizational strategy, recruitment and selection,
classification and compensation, and training and
development
Presentation Overview
• Background
• Demographics
• Results
• Conclusions
• Questions/Discussion
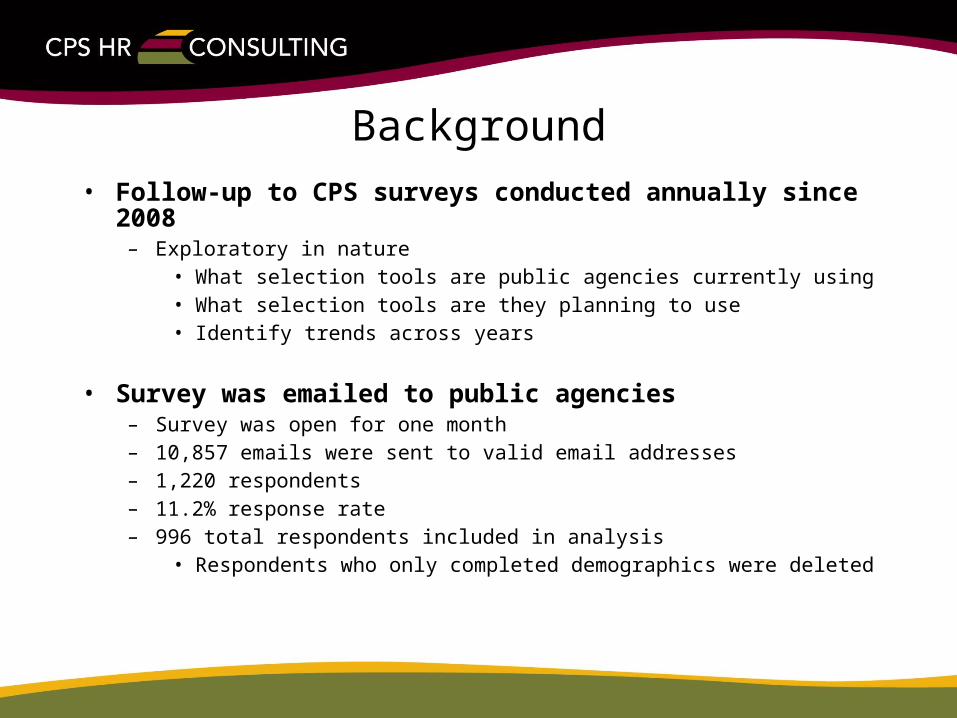
Background• Follow-up to CPS surveys conducted annually
since 2008– Exploratory in nature
• What selection tools are public agencies currently using• What selection tools are they planning to use• Identify trends across years
• Survey was emailed to public agencies– Survey was open for one month– 10,857 emails were sent to valid email addresses– 1,220 respondents– 11.2% response rate– 996 total respondents included in analysis
• Respondents who only completed demographics were deleted
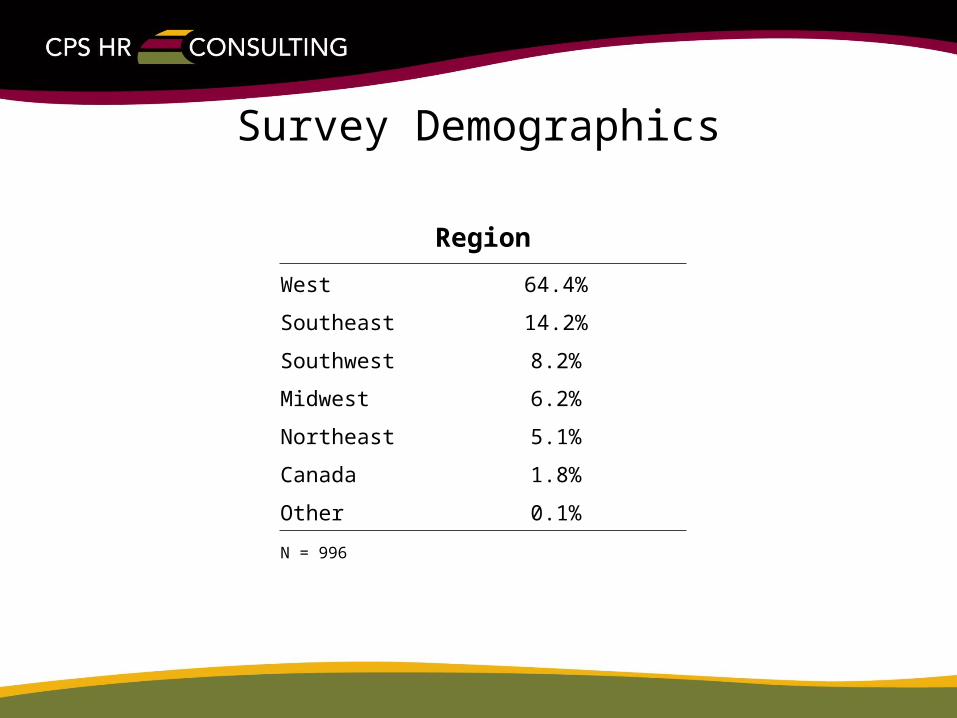
Survey Demographics
Region
West 64.4%
Southeast 14.2%
Southwest 8.2%
Midwest 6.2%
Northeast 5.1%
Canada 1.8%
Other 0.1%
N = 996
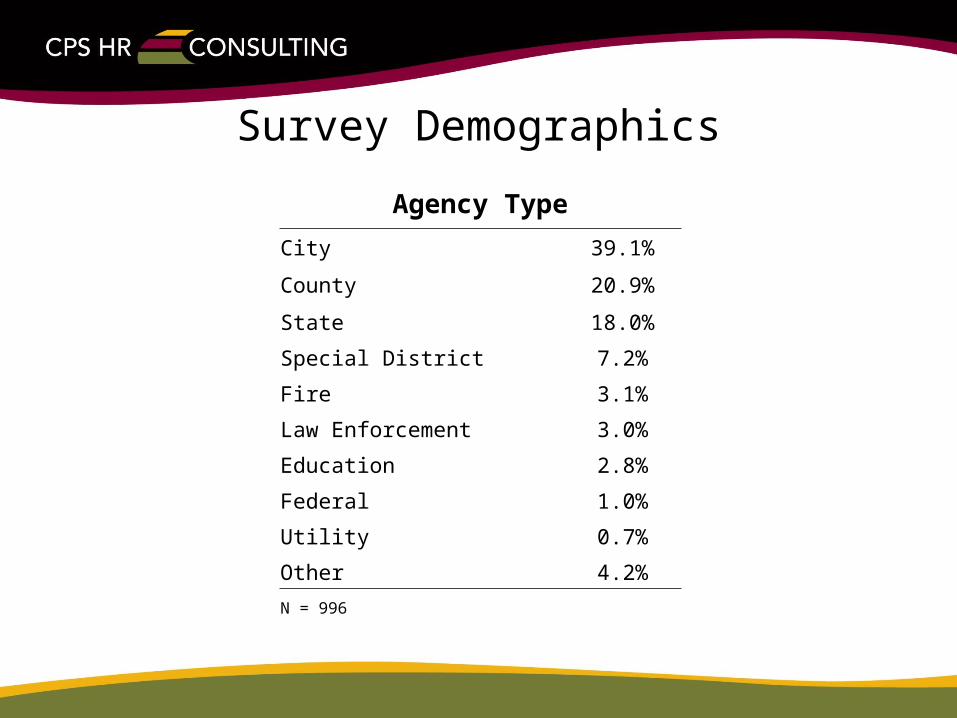
Survey Demographics
Agency Type
City 39.1%
County 20.9%
State 18.0%
Special District 7.2%
Fire 3.1%
Law Enforcement 3.0%
Education 2.8%
Federal 1.0%
Utility 0.7%
Other 4.2%
N = 996
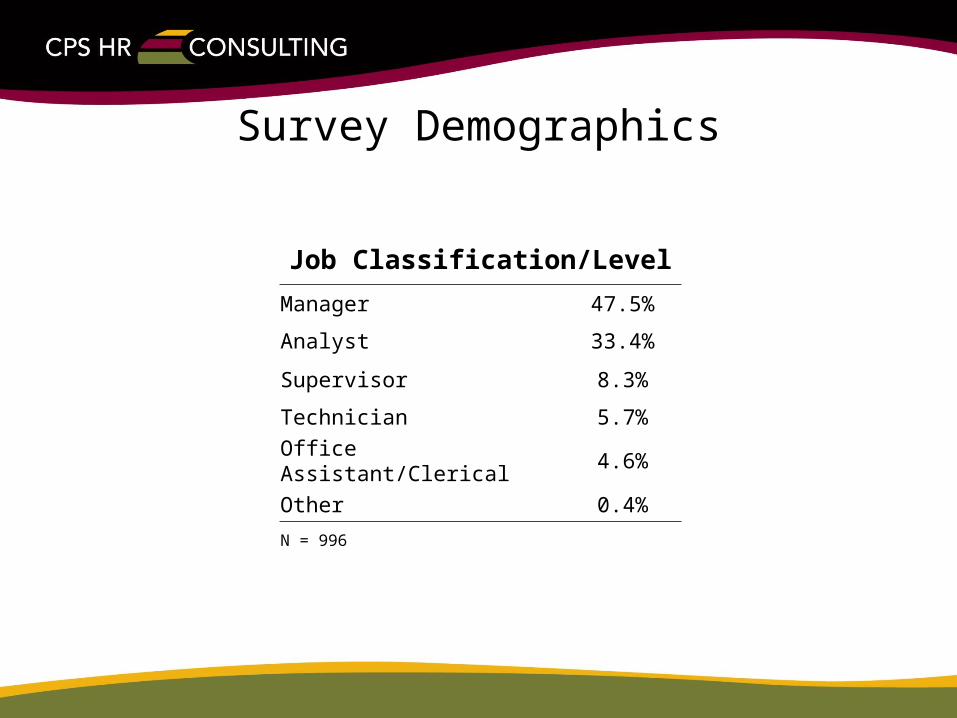
Survey Demographics
Job Classification/Level
Manager 47.5%
Analyst 33.4%
Supervisor 8.3%
Technician 5.7%
Office Assistant/Clerical 4.6%
Other 0.4%
N = 996
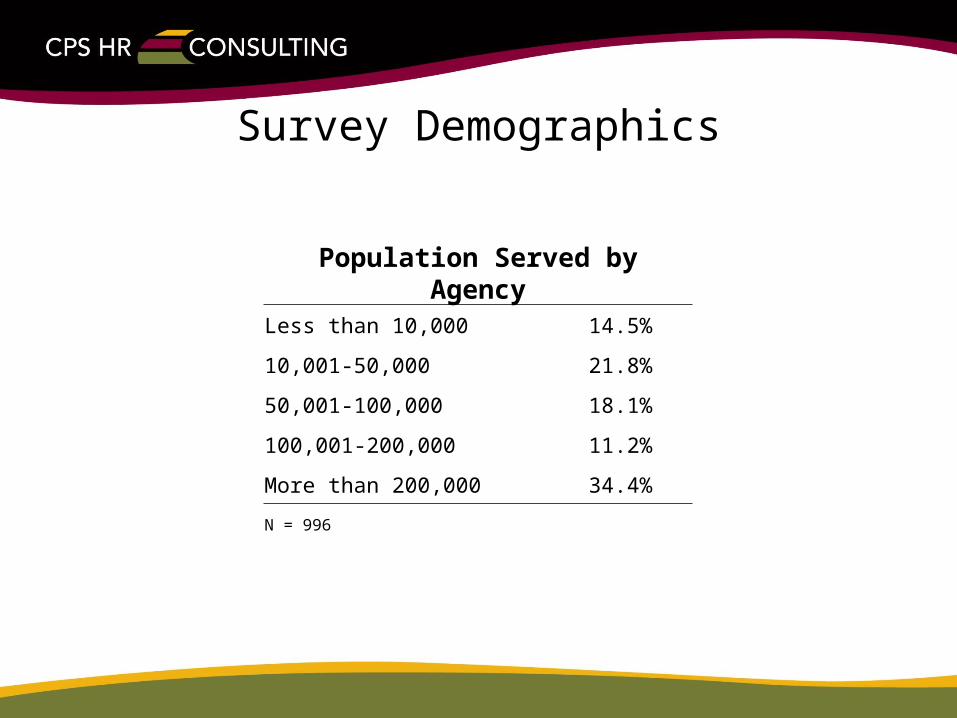
Survey Demographics
Population Served by Agency
Less than 10,000 14.5%
10,001-50,000 21.8%
50,001-100,000 18.1%
100,001-200,000 11.2%
More than 200,000 34.4%
N = 996
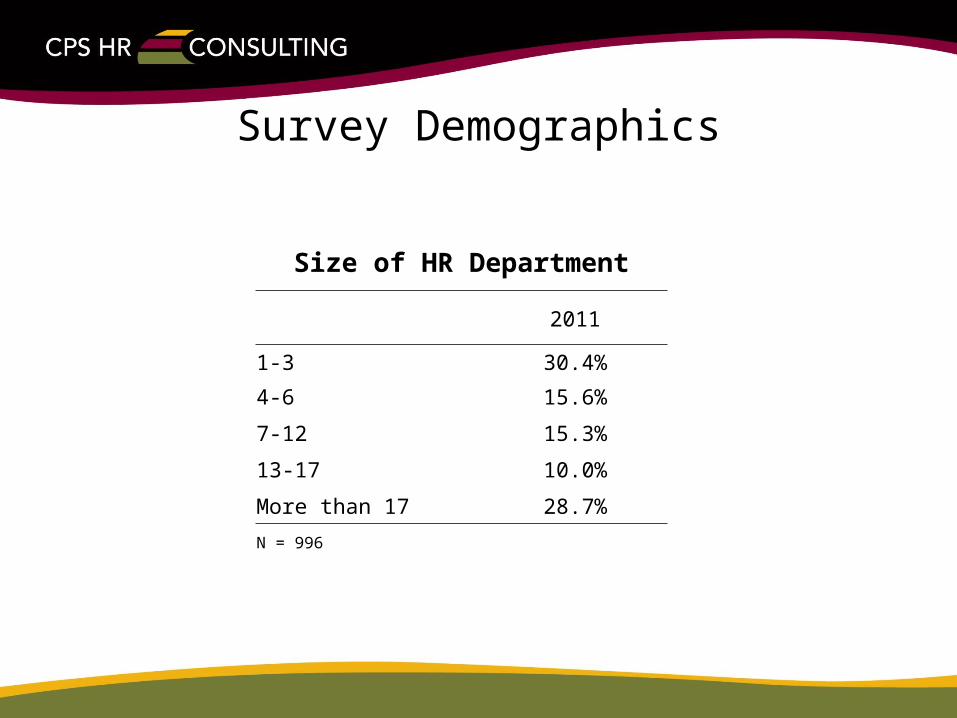
Survey Demographics
Size of HR Department
2011
1-3 30.4%
4-6 15.6%
7-12 15.3%
13-17 10.0%
More than 17 28.7%
N = 996
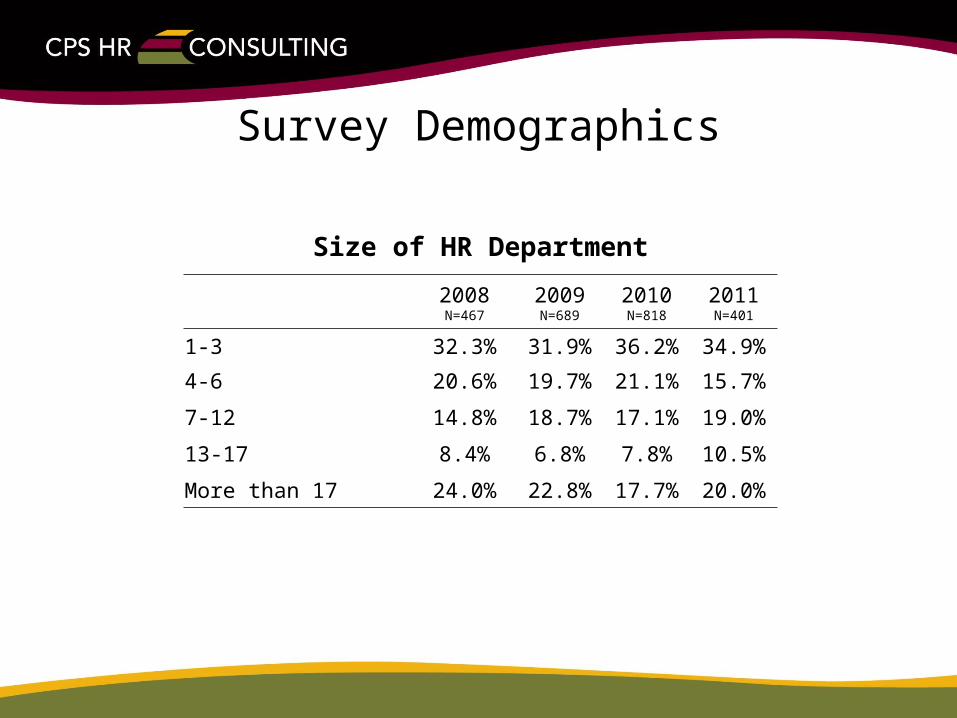
Survey Demographics
Size of HR Department
2008N=467
2009N=689
2010 N=818
2011N=401
1-3 32.3% 31.9% 36.2% 34.9%
4-6 20.6% 19.7% 21.1% 15.7%
7-12 14.8% 18.7% 17.1% 19.0%
13-17 8.4% 6.8% 7.8% 10.5%
More than 17 24.0% 22.8% 17.7% 20.0%
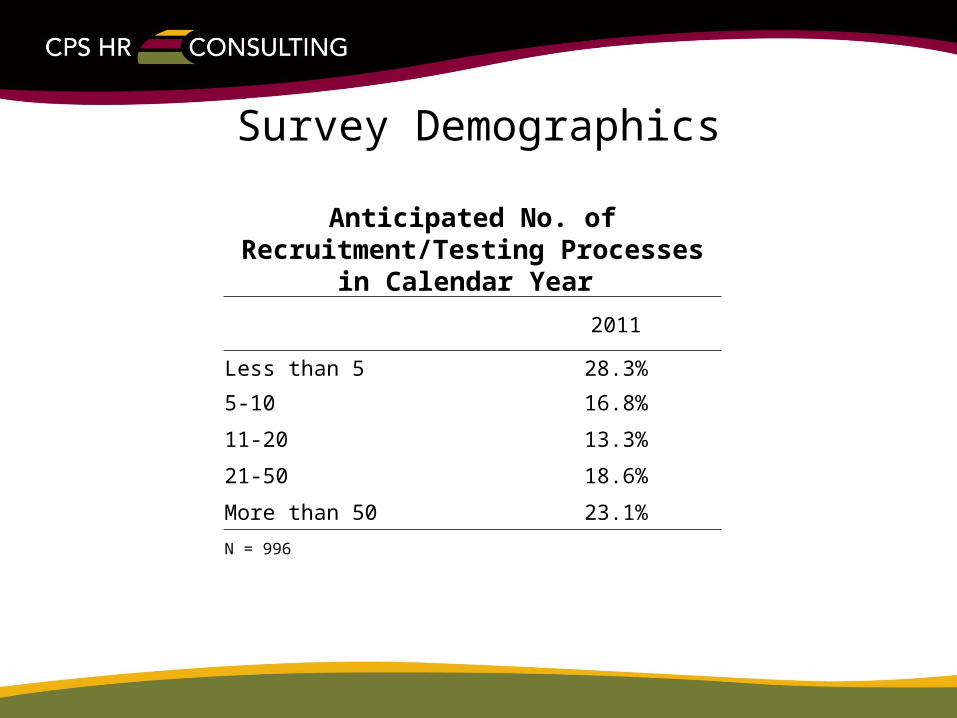
Survey Demographics
Anticipated No. of Recruitment/Testing Processes in Calendar Year
2011
Less than 5 28.3%
5-10 16.8%
11-20 13.3%
21-50 18.6%
More than 50 23.1%
N = 996
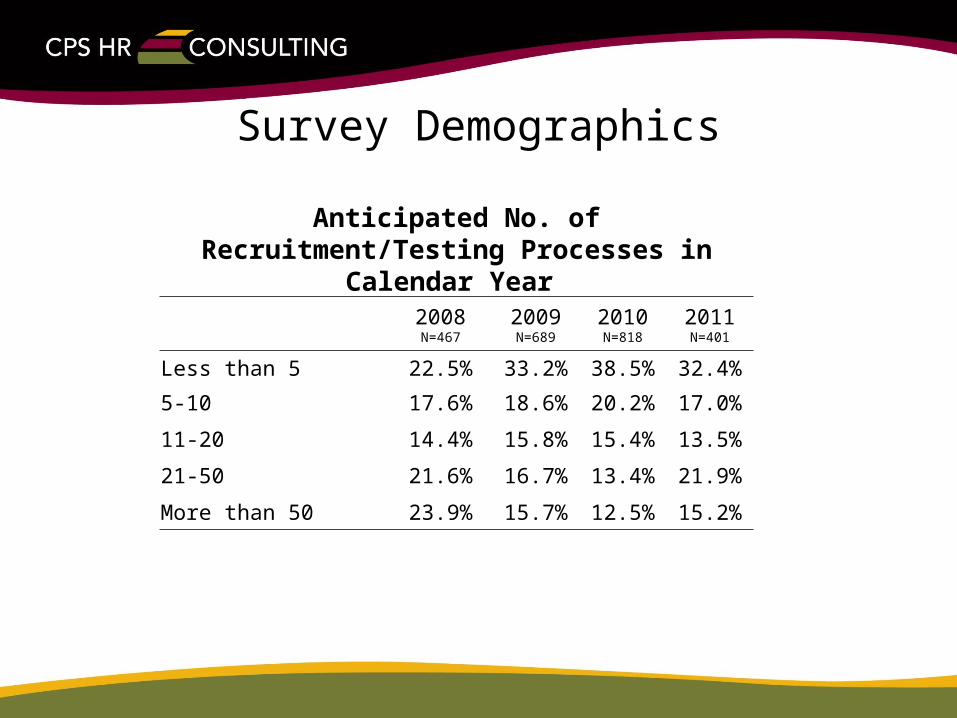
Survey Demographics
Anticipated No. of Recruitment/Testing Processes in Calendar Year
2008N=467
2009N=689
2010 N=818
2011 N=401
Less than 5 22.5% 33.2% 38.5% 32.4%
5-10 17.6% 18.6% 20.2% 17.0%
11-20 14.4% 15.8% 15.4% 13.5%
21-50 21.6% 16.7% 13.4% 21.9%
More than 50 23.9% 15.7% 12.5% 15.2%
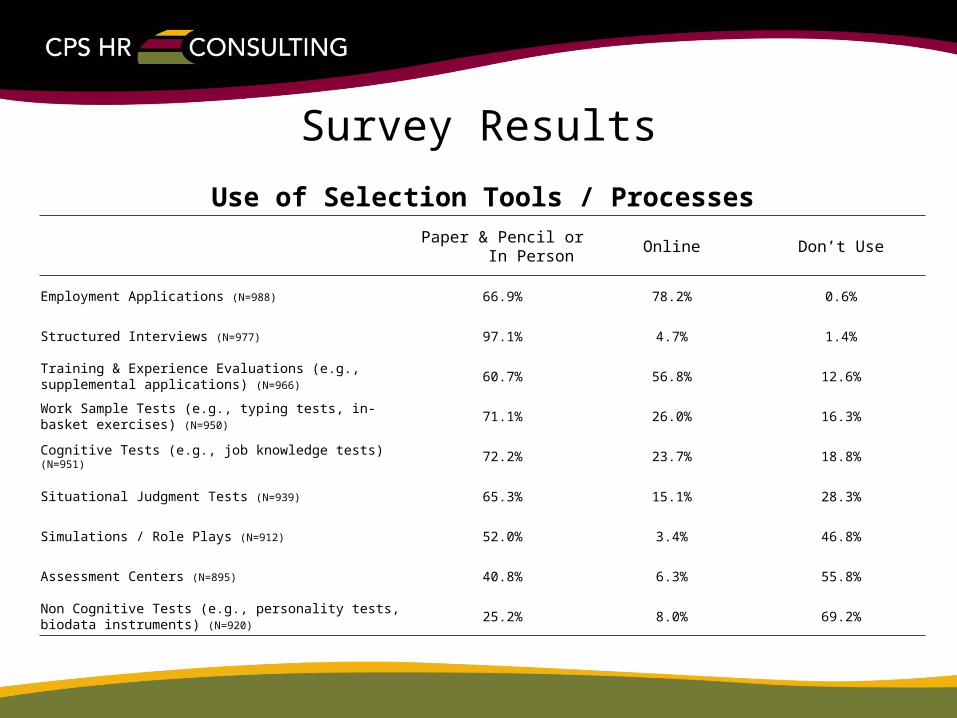
Survey Results
Use of Selection Tools / Processes
Paper & Pencil or
In PersonOnline Don’t Use
Employment Applications (N=988) 66.9% 78.2% 0.6%
Structured Interviews (N=977) 97.1% 4.7% 1.4%
Training & Experience Evaluations (e.g., supplemental applications) (N=966)
60.7% 56.8% 12.6%
Work Sample Tests (e.g., typing tests, in-basket exercises) (N=950)
71.1% 26.0% 16.3%
Cognitive Tests (e.g., job knowledge tests) (N=951) 72.2% 23.7% 18.8%
Situational Judgment Tests (N=939) 65.3% 15.1% 28.3%
Simulations / Role Plays (N=912) 52.0% 3.4% 46.8%
Assessment Centers (N=895) 40.8% 6.3% 55.8%
Non Cognitive Tests (e.g., personality tests, biodata instruments) (N=920)
25.2% 8.0% 69.2%
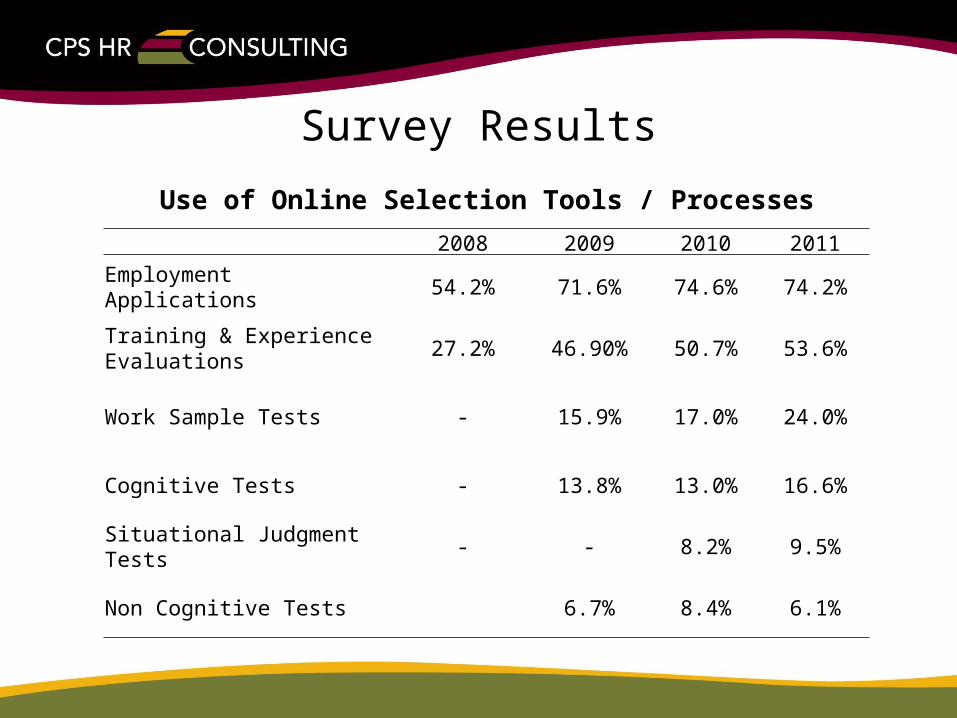
Survey Results
Use of Online Selection Tools / Processes
2008 2009 2010 2011
Employment Applications 54.2% 71.6% 74.6% 74.2%
Training & Experience Evaluations
27.2% 46.90% 50.7% 53.6%
Work Sample Tests - 15.9% 17.0% 24.0%
Cognitive Tests - 13.8% 13.0% 16.6%
Situational Judgment Tests - - 8.2% 9.5%
Non Cognitive Tests 6.7% 8.4% 6.1%
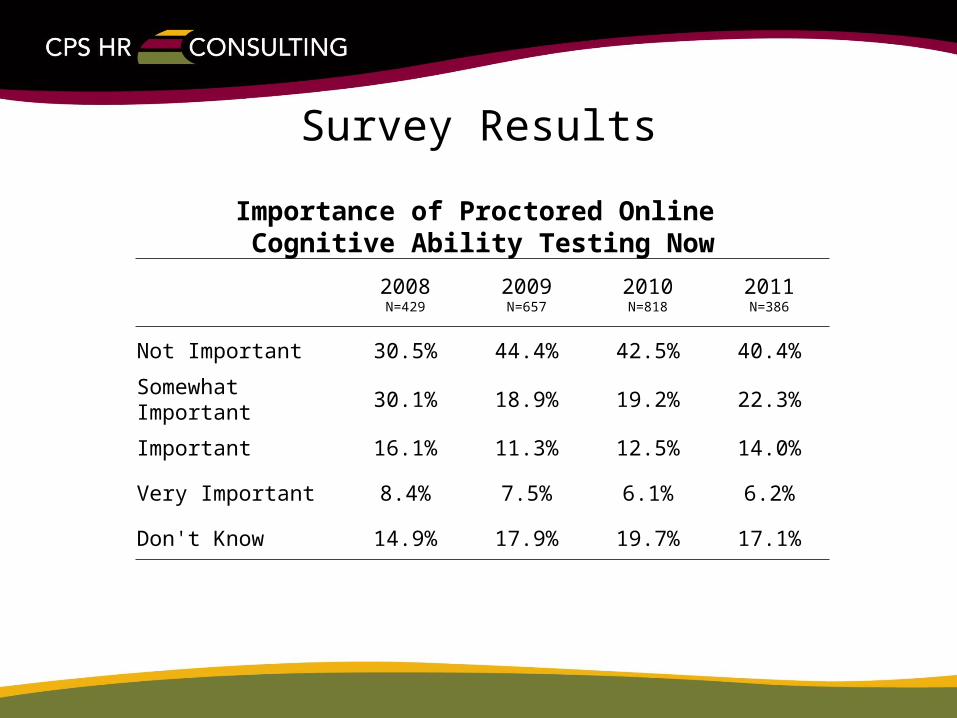
Survey Results
Importance of Proctored Online Cognitive Ability Testing Now
2008N=429
2009N=657
2010N=818
2011N=386
Not Important 30.5% 44.4% 42.5% 40.4%
Somewhat Important 30.1% 18.9% 19.2% 22.3%
Important 16.1% 11.3% 12.5% 14.0%
Very Important 8.4% 7.5% 6.1% 6.2%
Don't Know 14.9% 17.9% 19.7% 17.1%
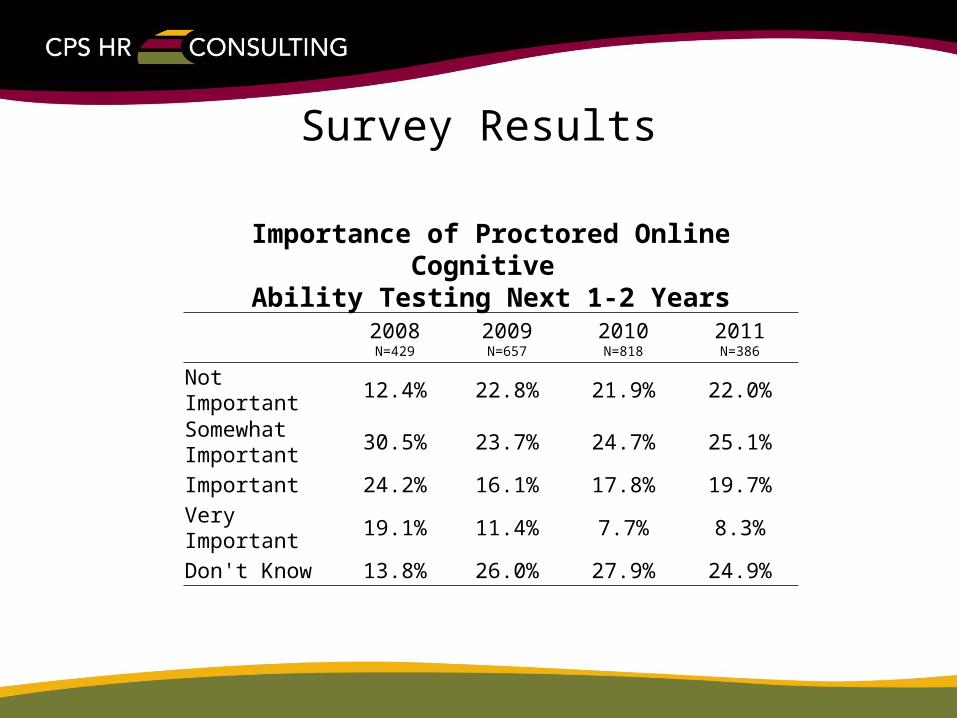
Survey Results
Importance of Proctored Online Cognitive Ability Testing Next 1-2 Years
2008N=429
2009N=657
2010N=818
2011N=386
Not Important 12.4% 22.8% 21.9% 22.0%
Somewhat Important
30.5% 23.7% 24.7% 25.1%
Important 24.2% 16.1% 17.8% 19.7%
Very Important 19.1% 11.4% 7.7% 8.3%
Don't Know 13.8% 26.0% 27.9% 24.9%
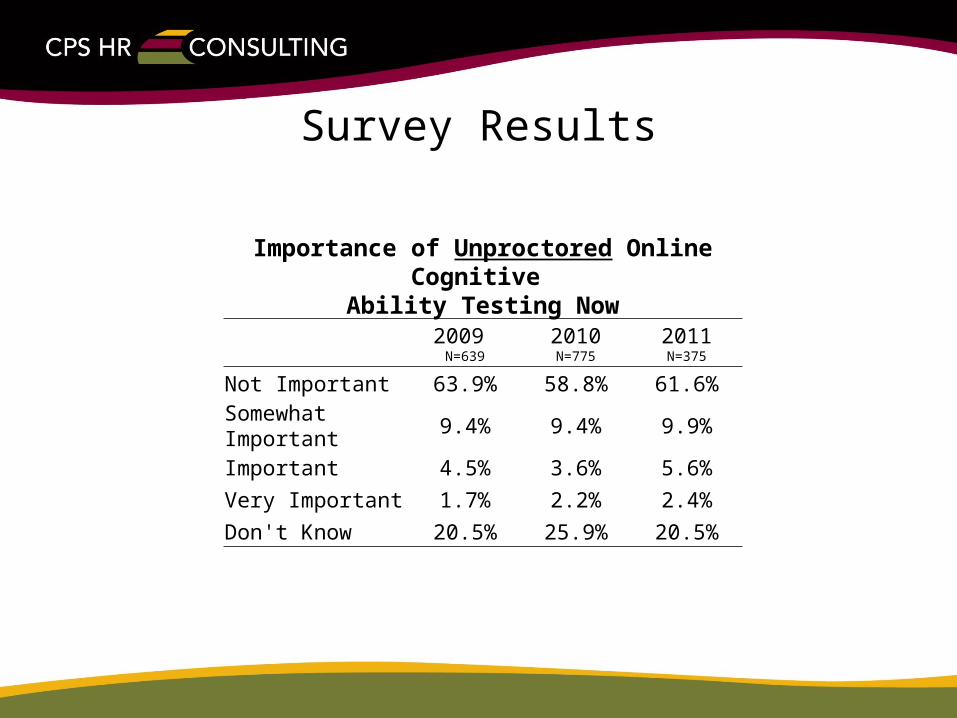
Survey Results
Importance of Unproctored Online Cognitive Ability Testing Now
2009 N=639
2010N=775
2011N=375
Not Important 63.9% 58.8% 61.6%Somewhat Important
9.4% 9.4% 9.9%
Important 4.5% 3.6% 5.6%
Very Important 1.7% 2.2% 2.4%
Don't Know 20.5% 25.9% 20.5%
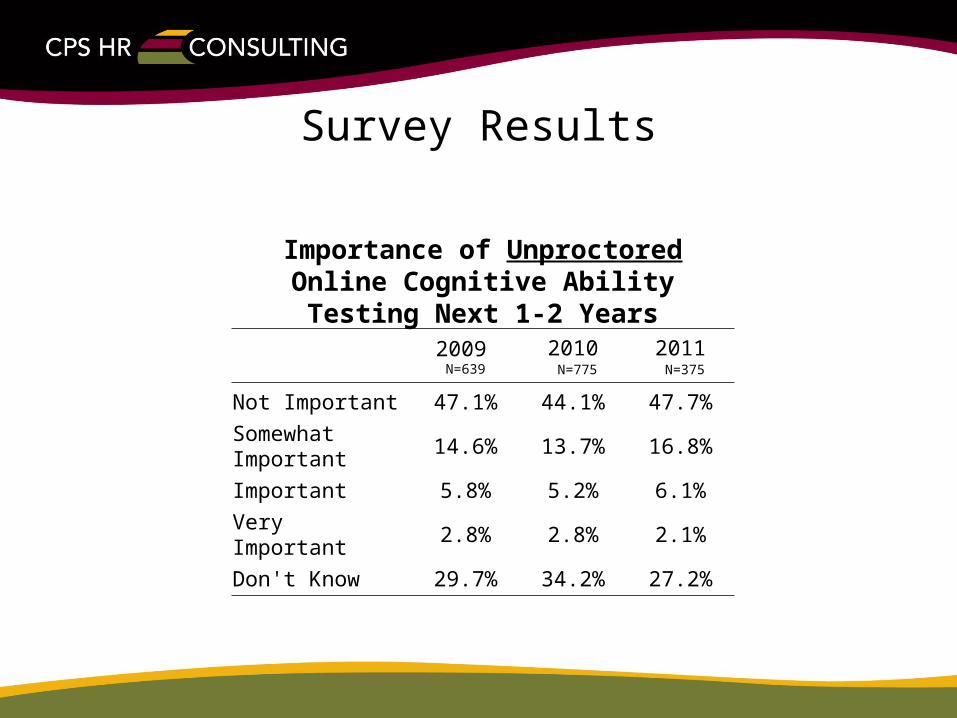
Survey Results
Importance of Unproctored Online Cognitive Ability Testing Next 1-2
Years
2009 N=639
2010 N=775
2011 N=375
Not Important 47.1% 44.1% 47.7%Somewhat Important
14.6% 13.7% 16.8%
Important 5.8% 5.2% 6.1%Very Important 2.8% 2.8% 2.1%Don't Know 29.7% 34.2% 27.2%
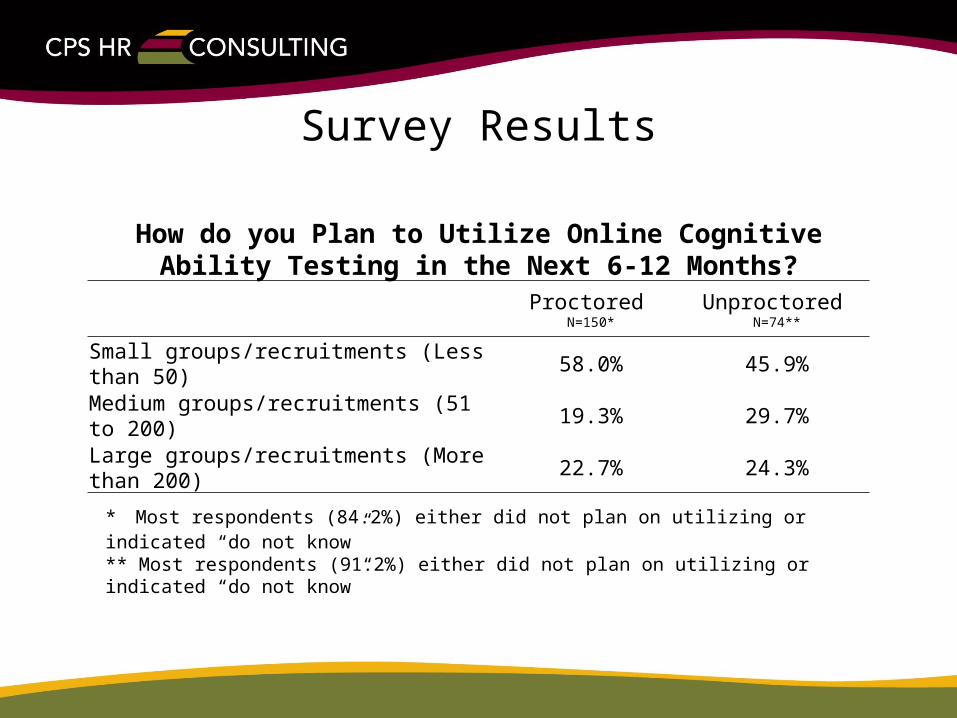
Survey Results
How do you Plan to Utilize Online Cognitive Ability Testing in the Next 6-12 Months?
Proctored N=150*
Unproctored N=74**
Small groups/recruitments (Less than 50) 58.0% 45.9%
Medium groups/recruitments (51 to 200) 19.3% 29.7%
Large groups/recruitments (More than 200) 22.7% 24.3%
* Most respondents (84.2%) either did not plan on utilizing or indicated “do not know”** Most respondents (91.2%) either did not plan on utilizing or indicated “do not know”
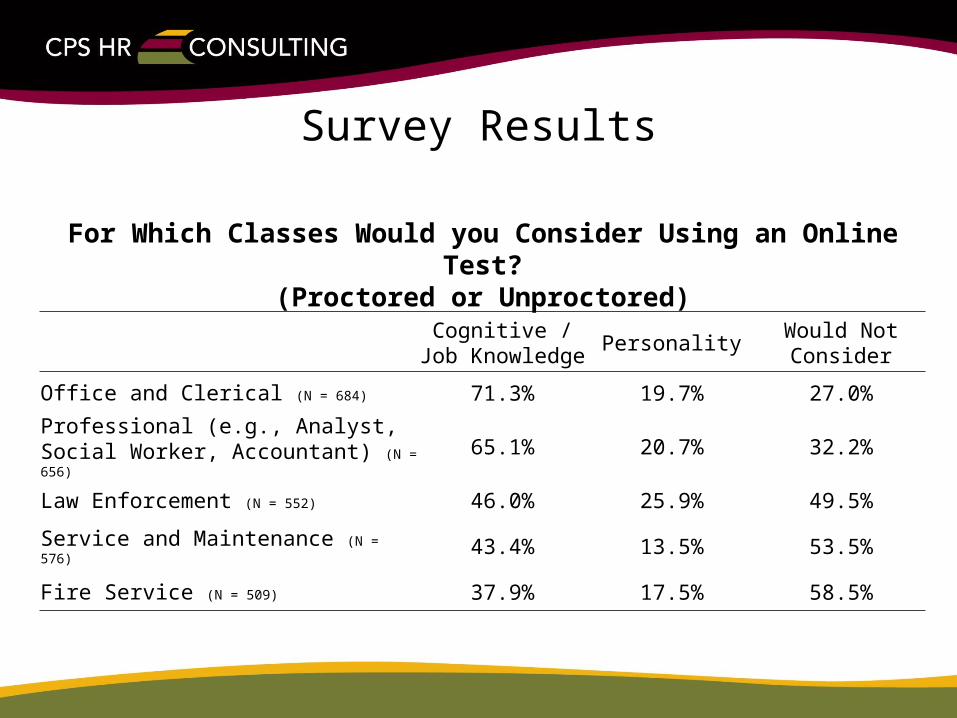
Survey Results
For Which Classes Would you Consider Using an Online Test?(Proctored or Unproctored)
Cognitive / Job
KnowledgePersonality
Would Not Consider
Office and Clerical (N = 684) 71.3% 19.7% 27.0%
Professional (e.g., Analyst, Social Worker, Accountant) (N = 656)
65.1% 20.7% 32.2%
Law Enforcement (N = 552) 46.0% 25.9% 49.5%
Service and Maintenance (N = 576) 43.4% 13.5% 53.5%
Fire Service (N = 509) 37.9% 17.5% 58.5%
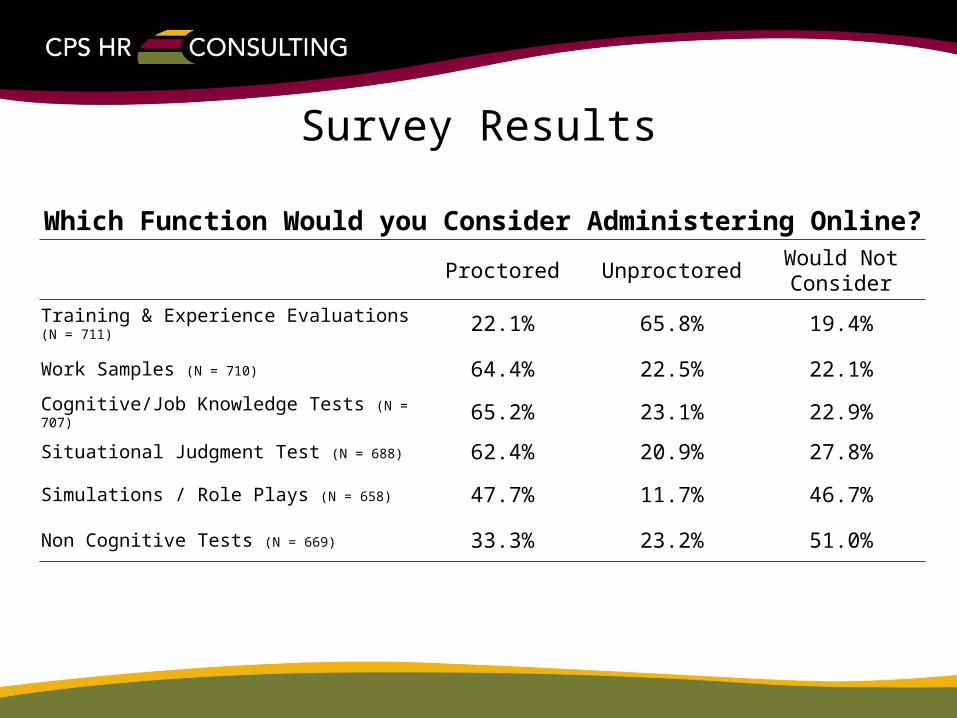
Survey Results
Which Function Would you Consider Administering Online?
Proctored UnproctoredWould Not Consider
Training & Experience Evaluations (N = 711) 22.1% 65.8% 19.4%
Work Samples (N = 710) 64.4% 22.5% 22.1%
Cognitive/Job Knowledge Tests (N = 707) 65.2% 23.1% 22.9%
Situational Judgment Test (N = 688) 62.4% 20.9% 27.8%
Simulations / Role Plays (N = 658) 47.7% 11.7% 46.7%
Non Cognitive Tests (N = 669) 33.3% 23.2% 51.0%
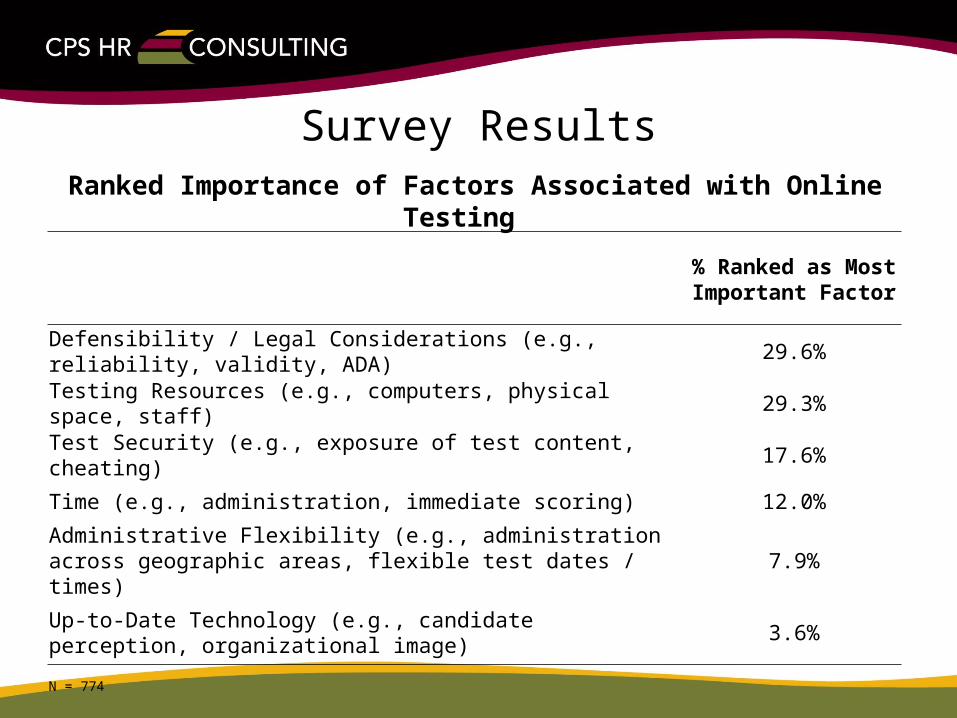
Survey Results
Ranked Importance of Factors Associated with Online Testing
% Ranked as Most Important Factor
Defensibility / Legal Considerations (e.g., reliability, validity, ADA)
29.6%
Testing Resources (e.g., computers, physical space, staff) 29.3%
Test Security (e.g., exposure of test content, cheating) 17.6%
Time (e.g., administration, immediate scoring) 12.0%
Administrative Flexibility (e.g., administration across geographic areas, flexible test dates / times)
7.9%
Up-to-Date Technology (e.g., candidate perception, organizational image)
3.6%
N = 774
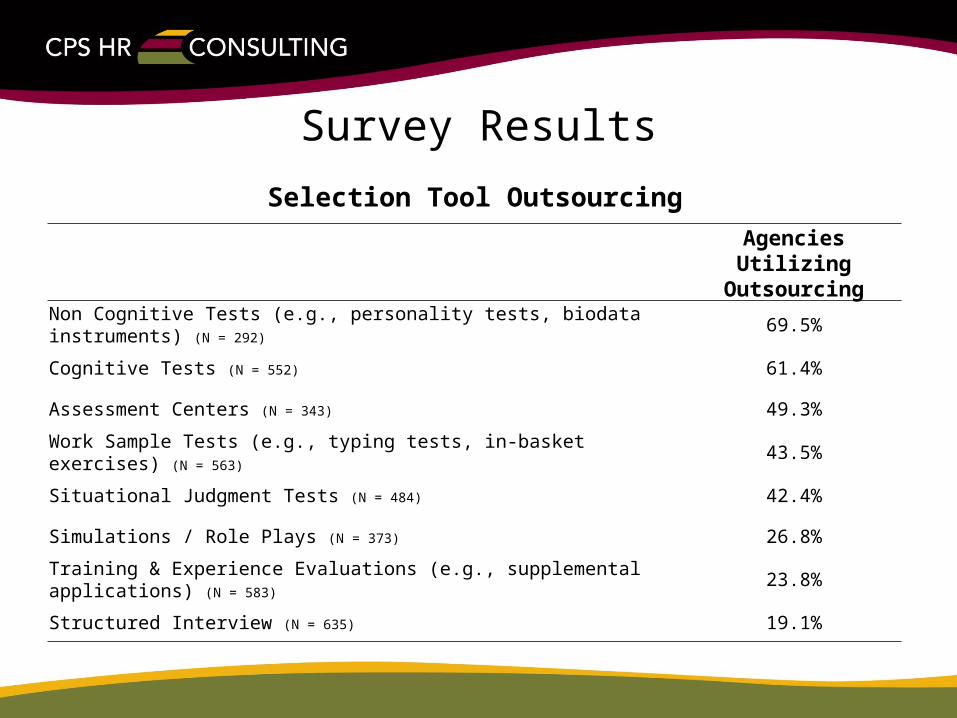
Survey Results
Selection Tool Outsourcing
Agencies Utilizing Outsourcing
Non Cognitive Tests (e.g., personality tests, biodata instruments) (N = 292) 69.5%
Cognitive Tests (N = 552) 61.4%
Assessment Centers (N = 343) 49.3%
Work Sample Tests (e.g., typing tests, in-basket exercises) (N = 563) 43.5%
Situational Judgment Tests (N = 484) 42.4%
Simulations / Role Plays (N = 373) 26.8%
Training & Experience Evaluations (e.g., supplemental applications) (N = 583) 23.8%
Structured Interview (N = 635) 19.1%
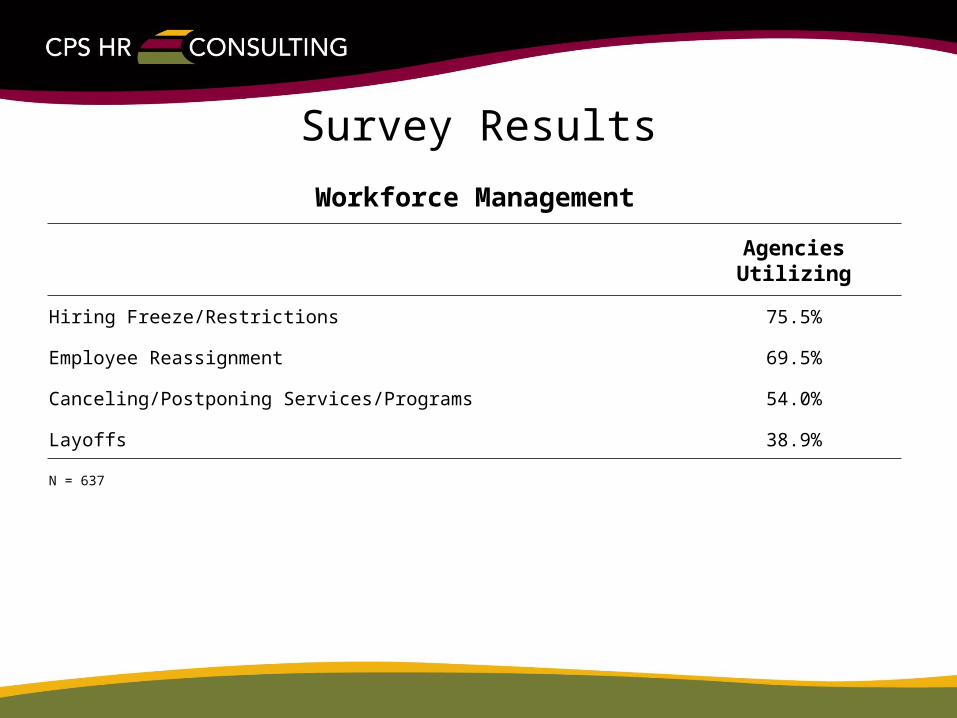
Survey Results
Workforce Management
Agencies Utilizing
Hiring Freeze/Restrictions 75.5%
Employee Reassignment 69.5%
Canceling/Postponing Services/Programs 54.0%
Layoffs 38.9%
N = 637
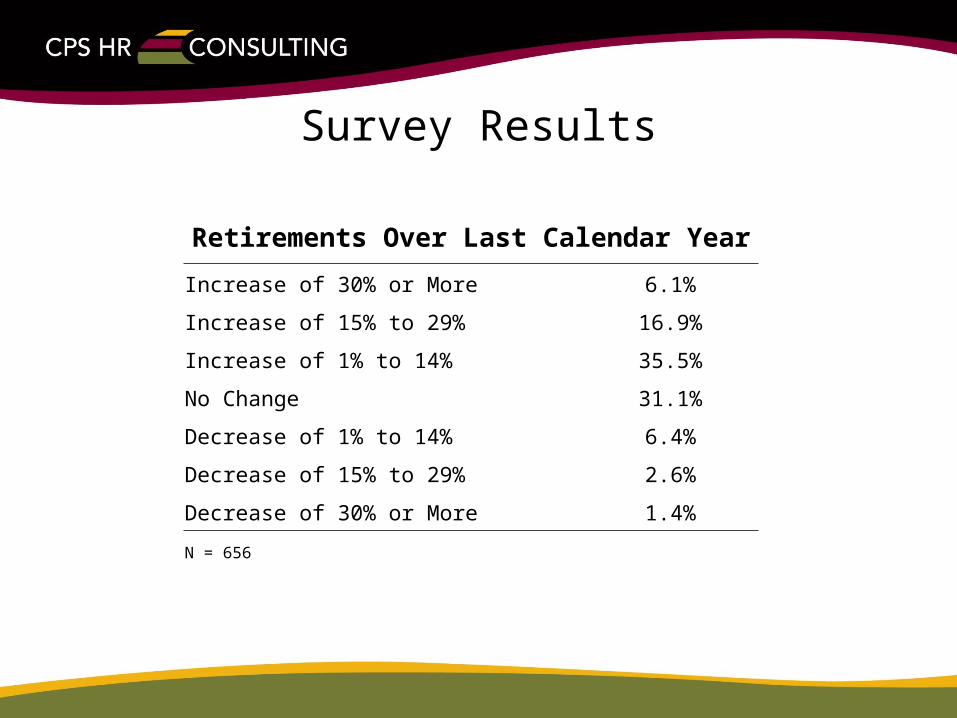
Survey Results
Retirements Over Last Calendar Year
Increase of 30% or More 6.1%
Increase of 15% to 29% 16.9%
Increase of 1% to 14% 35.5%
No Change 31.1%
Decrease of 1% to 14% 6.4%
Decrease of 15% to 29% 2.6%
Decrease of 30% or More 1.4%
N = 656
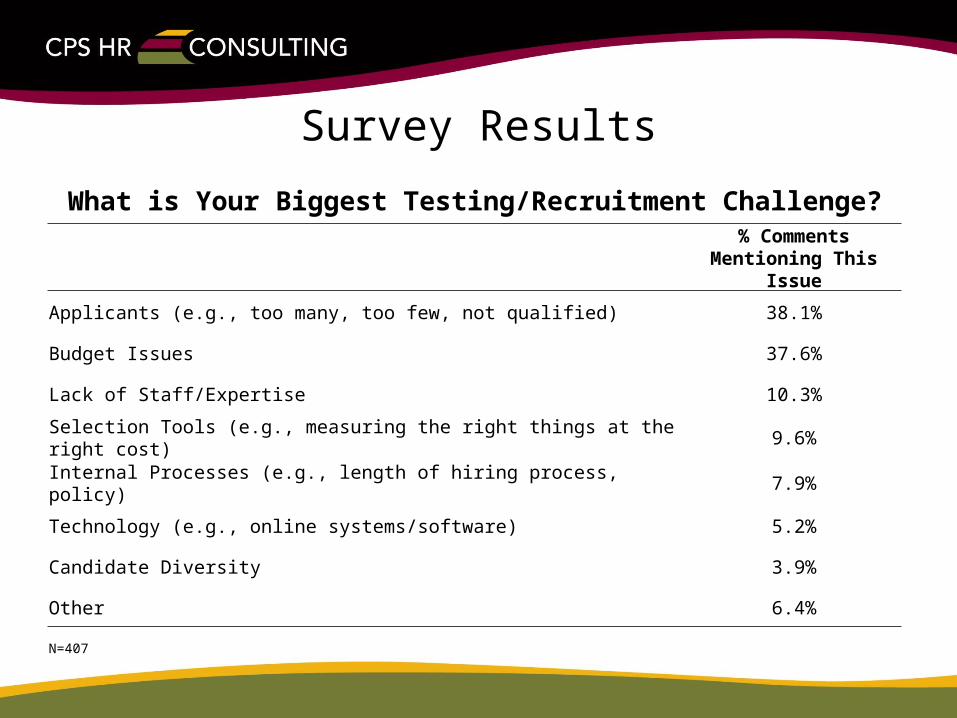
Survey Results
What is Your Biggest Testing/Recruitment Challenge?
% Comments Mentioning This Issue
Applicants (e.g., too many, too few, not qualified) 38.1%
Budget Issues 37.6%
Lack of Staff/Expertise 10.3%
Selection Tools (e.g., measuring the right things at the right cost) 9.6%
Internal Processes (e.g., length of hiring process, policy) 7.9%
Technology (e.g., online systems/software) 5.2%
Candidate Diversity 3.9%
Other 6.4%
N=407
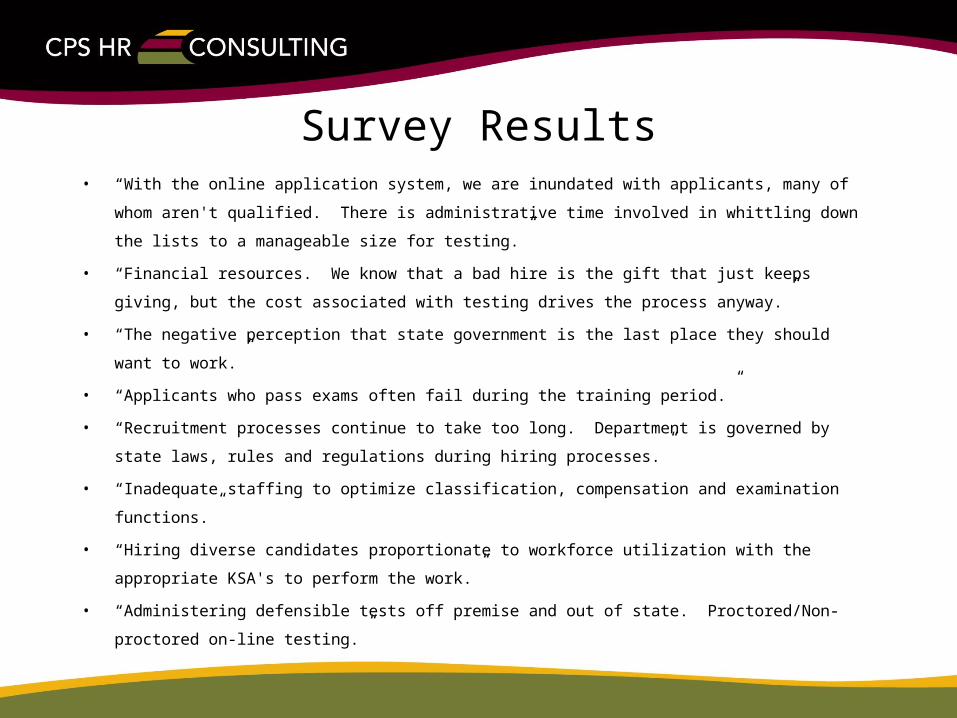
Survey Results• “With the online application system, we are inundated with applicants, many of whom
aren't qualified. There is administrative time involved in whittling down the lists to a
manageable size for testing.”
• “Financial resources. We know that a bad hire is the gift that just keeps giving, but the
cost associated with testing drives the process anyway.”
• “The negative perception that state government is the last place they should want to
work.”
• “Applicants who pass exams often fail during the training period.”
• “Recruitment processes continue to take too long. Department is governed by state
laws, rules and regulations during hiring processes.”
• “Inadequate staffing to optimize classification, compensation and examination functions.”
• “Hiring diverse candidates proportionate to workforce utilization with the appropriate
KSA's to perform the work.”
• “Administering defensible tests off premise and out of state. Proctored/Non-proctored on-
line testing.”
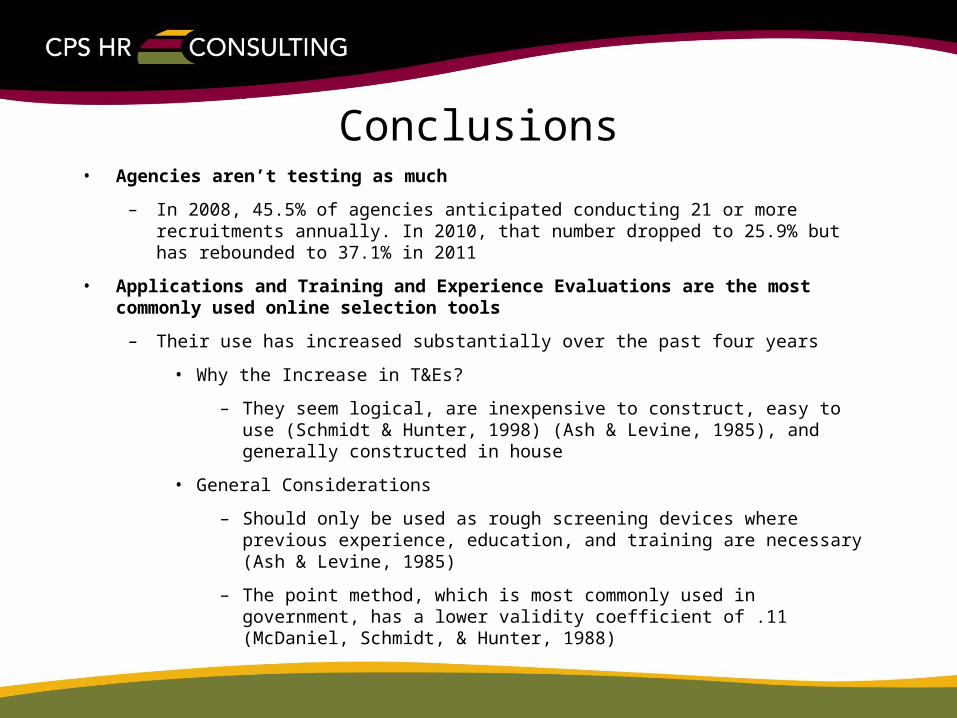
Conclusions• Agencies aren’t testing as much
– In 2008, 45.5% of agencies anticipated conducting 21 or more recruitments annually. In 2010, that number dropped to 25.9% but has rebounded to 37.1% in 2011
• Applications and Training and Experience Evaluations are the most commonly used online selection tools
– Their use has increased substantially over the past four years
• Why the Increase in T&Es?
– They seem logical, are inexpensive to construct, easy to use (Schmidt & Hunter, 1998) (Ash & Levine, 1985), and generally constructed in house
• General Considerations
– Should only be used as rough screening devices where previous experience, education, and training are necessary (Ash & Levine, 1985)
– The point method, which is most commonly used in government, has a lower validity coefficient of .11 (McDaniel, Schmidt, & Hunter, 1988)
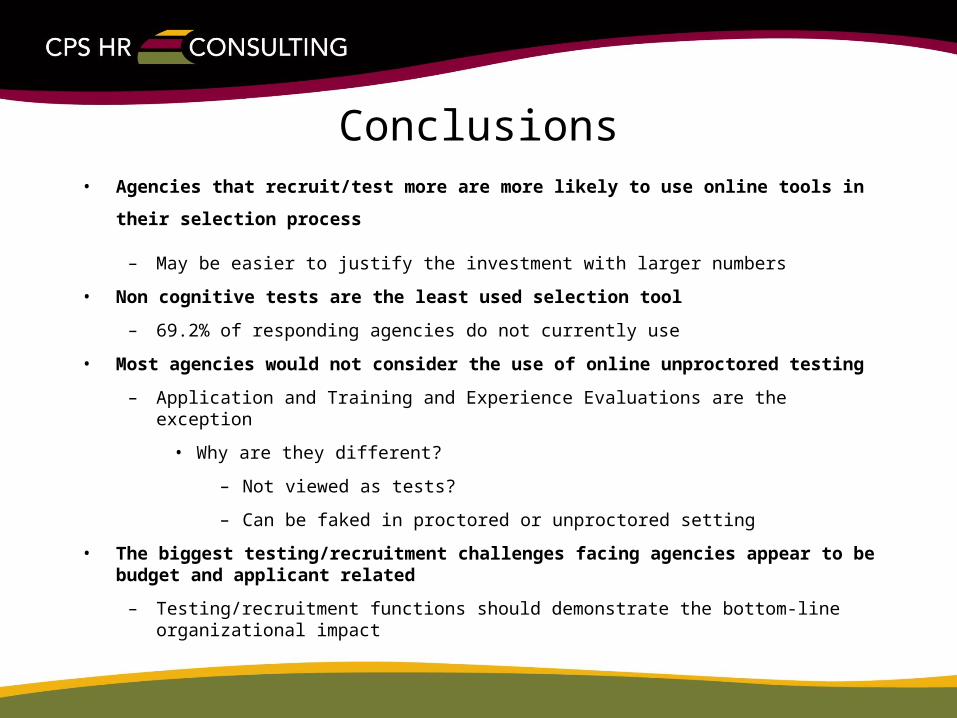
Conclusions• Agencies that recruit/test more are more likely to use online tools in
their selection process
– May be easier to justify the investment with larger numbers
• Non cognitive tests are the least used selection tool
– 69.2% of responding agencies do not currently use
• Most agencies would not consider the use of online unproctored testing
– Application and Training and Experience Evaluations are the exception
• Why are they different?
– Not viewed as tests?
– Can be faked in proctored or unproctored setting
• The biggest testing/recruitment challenges facing agencies appear to be budget and applicant related
– Testing/recruitment functions should demonstrate the bottom-line organizational impact
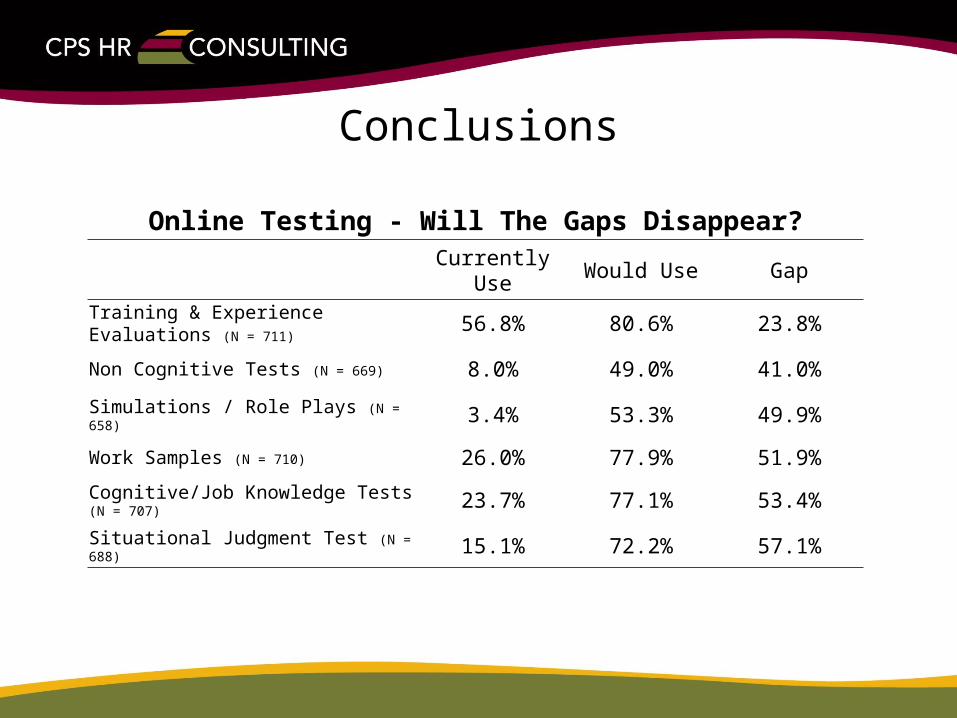
Conclusions
Online Testing - Will The Gaps Disappear?
Currently Use Would Use Gap
Training & Experience Evaluations (N = 711)
56.8% 80.6% 23.8%
Non Cognitive Tests (N = 669) 8.0% 49.0% 41.0%
Simulations / Role Plays (N = 658) 3.4% 53.3% 49.9%
Work Samples (N = 710) 26.0% 77.9% 51.9%
Cognitive/Job Knowledge Tests (N = 707) 23.7% 77.1% 53.4%
Situational Judgment Test (N = 688) 15.1% 72.2% 57.1%
Questions