Embed Size (px)
Citation preview

Online Trade shows Magazines Research(NASDAQ-GS: GSOL)
Investor Presentation

Safe Harbor
This presentation contains forward-looking statements within the meaning of Section 27-A of the Securities Act of 1933, as amended and Section 21-E of the Securities Exchange Act of 1934, as amended. The company's actual results could differ materially from those set forth in the forward-looking statements as a result of the risks associated with the company's business, changes in general economic conditions, and changes in the assumptions used in making such forward-looking statements.
2

Business at a Glance
Revenue Sources*
• Online marketplaces
• Face-to-face and online trade shows
• Digital and print magazines
• Private Sourcing Events
• 97% for marketing services
• By media: 51% online 39% exhibitions 7% print 3% miscellaneous
• 82% China
• Revenue of $224M*
• Adjusted EBITDA of $46M#*
• $96M Cash and Securities**
• No bank or long term debt**
Total Solution
Financial Strength
A leading B2B media company facilitating China trade
• Established 1971• HQ: Hong Kong• 3,000 team members• 60 locations, 40 in
Greater China
* TTM ending March 31, 2013** As of March 31, 2013 # See reconciliation in the appendix
3

Media for Global Trade
Community: More than 250,000 verified and unverified suppliers
Community: More than 1 million active buyers worldwide (certified with Ernst & Young)
18 Consumer Product Categories
4

Media for China Trade
Community: More than 4 million registered online users and magazine readers
Community: Overseas manufacturers of semi-conductors and electronics equipment; luxury consumer brands; domestic suppliers of fashion and electronic products
5

6
Fully Integrated Offering
• Addressing all stages of the sourcing process
• Each media plays a different role. Examples: Online is effective
early – to search and make inquiries
Trade shows & Private Sourcing Events enable negotiation, supplier selection, and ordering
6
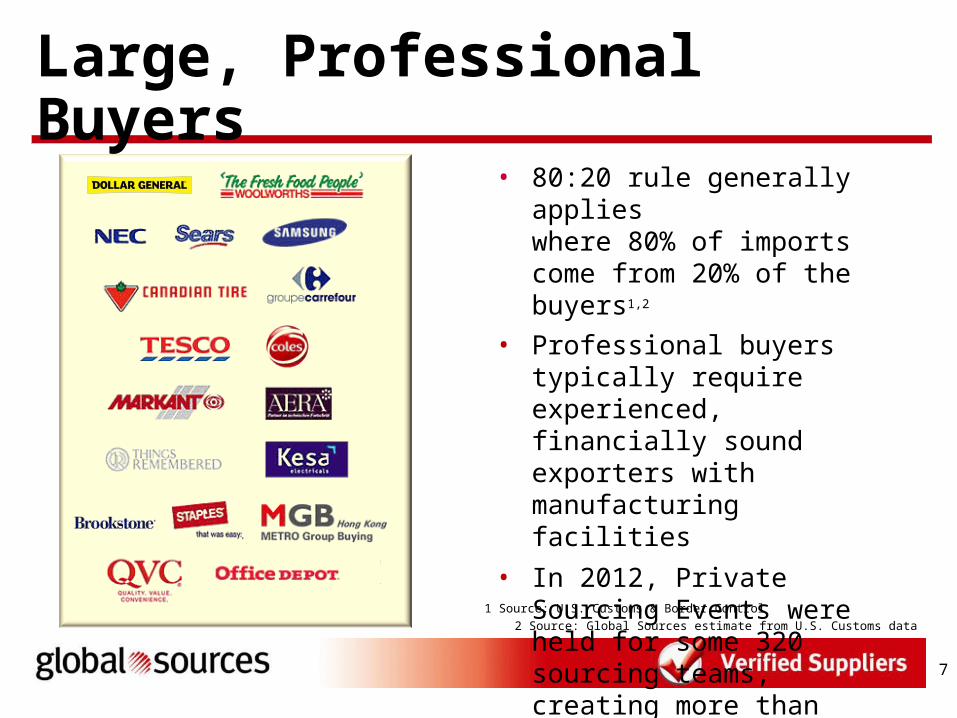
Large, Professional Buyers• 80:20 rule generally
applies where 80% of imports come from 20% of the buyers1,2
• Professional buyers typically require experienced, financially sound exporters with manufacturing facilities
• In 2012, Private Sourcing Events were held for some 320 sourcing teams, creating more than 1,500 high-quality, one-on-one selling opportunities for suppliers
2 Source: Global Sources estimate from U.S. Customs data
1 Source: U.S. Customs & Border Control
7

Income Statement
8
YEAR YEAR(in US$ millions except number of shares and per share data) Q1 2013 Q1 2012 growth % 2012 2011 growth %Revenues
Online 25.0 30.9 (19) 119.0 117.9 1Print 3.0 4.3 (31) 17.1 23.5 (27)Exhibitions 1.5 2.2 (32) 88.8 78.0 14Miscellaneous 1.8 1.5 21 6.9 5.6 22
Total revenue 31.3 38.9 (20) 231.7 225.1 3Operating expenses (30.7) (35.9) 14 (196.8) (193.3) (2)Profit on sale of property 4.5 0.0 100 0.0 0.0 0
Profit from Operations 5.0 3.1 64 35.0 31.7 10Interest income 0.3 0.2 47 1.0 0.4 190Share of loss of associate 0.0 0.0 0 0.0 0.0 0Impairment loss on investment in associate 0.0 0.0 0 (0.3) 0.0 (100)
Profit before Income Taxes 5.3 3.2 63 35.7 32.1 11Income Tax Expense (0.0) (0.2) 84 (2.7) (1.6) (70)Net profit attributable to non-controlling interests 0.3 0.0 100 (0.7) (1.0) 25IFRS Net Profit 5.6 3.1 82 32.2 29.5 9IFRS Net Profit per diluted share 0.16 0.09 78 0.90 0.83 8
Total shares used in diluted net profit per share calculations (IFRS Net Profit) 35,914,192 35,573,189 35,742,495 35,385,218

Strong Balance Sheet
9
$0
$50
$100
$150
$200
$250
$300
$350
2007 2008 2009 2010 2011 2012 March31, 2013
Mill
ions
Total Assets Cash & Securities Deferred income & customer prepayments
Cash, Securities, Deferred Income and Total Assets
• No debt*
• Cash and securities: $96M* 29% of total assets $24m proceed from
the sale of properties received in Q22013
• Deferred income $110M* 49% of TTM
revenue
* As of March 31, 2013
Notes: 1)In Q308, purchased real estate for a sum of $47.9 million, and in Q408 completed a tender offer of 6.25M shares at $8.00 per share. 2)In 2010, completed a tender offer USD 100M at $9.00 per share for 11.2M shares.3)In Q311, purchased Shanghai office space for a sum of $52.2 million.4)As of Dec 31, 2011, the current market value of office properties was approx. $209.8M, and the company reclassified approx. $75M from “Property & Equipment” to “Investment Property” in the balance sheet.5)In Q113, we completed the acquisition of the property in Hong Kong that resulted in a reduction of cash by $24.7 million.

Revenue
10
$0
$50
$100
$150
$200
$250
2007 2008 2009 2010 2011 2012
Millio
ns
Total revenue Online Print Exhibition Other
• Online attributed to 51% of our total revenue in 2012.
• Exhibition continue to grow as a proportion of the total revenue.
• $89M of exhibition revenue for year 2012, 14% YOY growth
Total Revenue & Revenue Mix

Key Trends • Cost pressures on manufacturers
Materials, components, labor, Yuan
• Weakening and shifting demand Weak demand from Europe and
U.S. markets Growing importance of
emerging markets
• Incidents of fraud Heightened appreciation of
quality content and trusted content providers
• Trade shows becoming more digital Serving buyers before, at and
after the physical shows
Trade shows becoming more digital
Cost pressures
on Chinese manufacturers
Fraud & trusted content providers
Weakening and
shifting demand
11
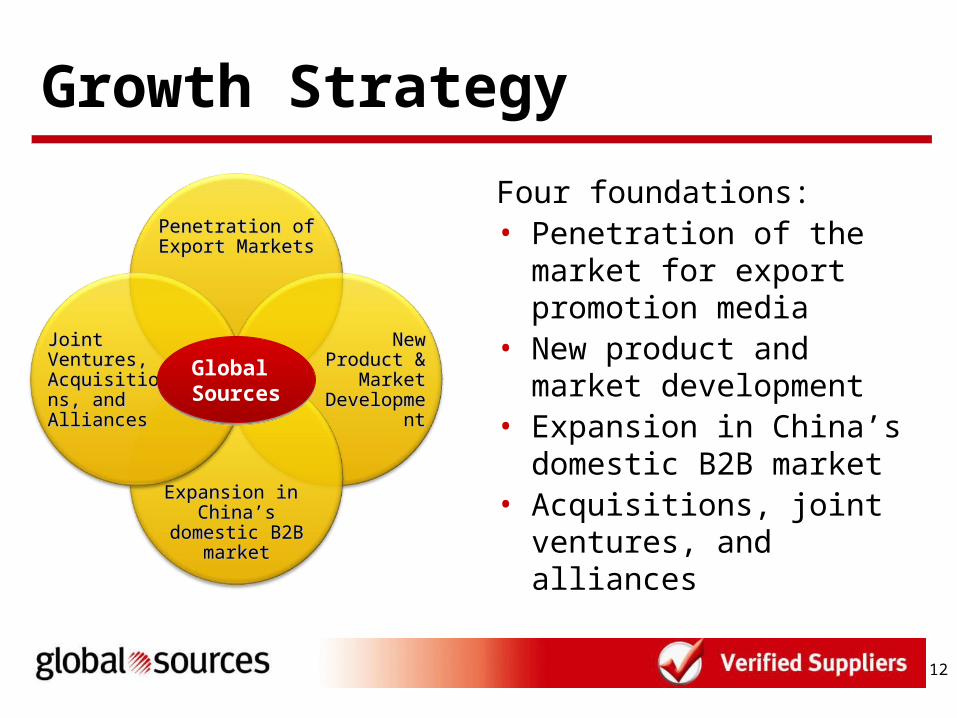
Growth Strategy
Four foundations:• Penetration of the
market for export promotion media
• New product and market development
• Expansion in China’s domestic B2B market
• Acquisitions, joint ventures, and alliances
Penetration of Penetration of Export MarketsExport Markets
New New Product & Product &
Market Market DevelopmDevelopm
entent
Expansion in Expansion in China’s domestic China’s domestic
B2B marketB2B market
Joint Joint Ventures, Ventures, AcquisitionsAcquisitions, and , and AlliancesAlliances
Global SourcesGlobal Sources
12

• Objectives: – Grow suppliers’ usage of one or more of our media– Increase customer base– Help customers penetrate emerging markets
• Continued strength anticipated from GlobalSources.com – and from the China Sourcing Fairs
Export Market Penetration
13
New and Developing Initiatives
• Find Them and Meet Them initiative aims to integrate the best of online media and trade shows.
• 48 export trade shows scheduled in 2013

2013 Export Show Schedule
14

New Product and Market Development
• Plans include increasingly specialized online marketplaces, magazines and trade shows – entries into new geographies – new verticals, and new media formats
New and Developing InitiativesNew and Developing Initiatives
• Held first China Sourcing Fairs in Sao Paolo, Brazil in August 2012
15

Expansion in China’s Domestic Market
• Focused on becoming increasingly involved in China’s domestic B2B markets
• Currently over 4 million registered online users and magazine readers for our Chinese-language media
New and Developing InitiativesNew and Developing Initiatives
• Further development of organic and acquired trade show properties in Shenzhen
16

Acquisitions and/or Alliances
• Strategy to seek complementary businesses, technologies or products that will help us maintain or achieve market leading positions in particular niche markets
• Priorities include acquiring media properties that will extend and enhance existing brands
New and Developing InitiativesNew and Developing Initiatives• 2013: Entered into an agreement to
acquire the Shenzhen International Machinery Manufacturing Industry Exhibition
• 2012: acquired the China (Shenzhen) International Brand Clothing and Accessories Fair
• 2011: acquired EDN-China and EDN-Asia, for approximately US$4 million
• 2009: acquired the China International Optoelectronic Expo
17

Guidance: 1H 2013*
• Revenue $89 M to $91 M
-14%-16% YoY
• IFRS EPS $0.59 to $0.63
Compared to $0.36
• Non-IFRS EPS $0.27 to $0.31
Compared to $0.41
* As compared to 1H 2012
18

Merle HinrichExecutive Chairman
Founder; Member of Board of Trustees of Thunderbird School of Global Management; Board Member of Economic Strategy Institute; Masters Degree in International Trade from Thunderbird; and Honorary Doctorate Degrees from the University of Nebraska and Thunderbird.
Sarah BeneckeDirector
Chief Executive Officer from 1994 to 1999; launched flagship website Global Sources Online; consultant for China Sourcing Fairs launch, development and expansion; and former Vice Chairman of the Hong Kong Exhibition & Convention Industry Association.
Eddie HengDirector
Former Chief Financial Officer; Singapore CPA and Member of Singapore Institute of CPAs; Fellow Member of UK Association of Chartered Certified Accountants; Director and Audit Committee Chairman of Prison Fellowship Singapore; and former Regional Financial Controller of Hitachi Data Systems.
Roderick ChalmersIndependent Director
Member of Audit, Compensation & Executive Sessions Committees; former Asia-Pacific Chairman & Global Management Board Member of PricewaterhouseCoopers; has at various times been a Non-executive Director of Hong Kong Securities & Futures Commission, Member of Hong Kong Takeovers & Mergers Panel, and Chairman of Hong Kong Working Group on Financial Disclosure.
David JonesIndependent Director
Member of Audit, Compensation & Executive Sessions Committees; Managing Director of CHAMP Private Equity; founded and led the development of UBS Capital’s Australian and New Zealand business; former Chairman of Australian Venture Capital Association Limited.
James WatkinsIndependent Director
Member of Audit, Compensation & Executive Sessions Committees; former Partner in Linklaters law firm, London and Hong Kong; former Director & Group General Counsel of Jardine Matheson Group, Hong Kong; Audit Committee Member of Jardine Cycle & Carriage Ltd., MCL Land Ltd. and Asia Satellite Telecommunications Holdings Ltd.; Audit Committee Chairman of Advanced Semiconductor Manufacturing Corporation Ltd.
Peter YamIndependent Director
Former President of Emerson Greater China and Chairman of Emerson Electric (China) Holdings Co., Ltd.; non-executive director of ISG Asia Investment (HK) Ltd.; a director of the Executive Committee of Foreign Investment Companies in Beijing from 2003 to 2008; and a non-executive director of Sun Life Hong Kong Limited and affiliates from 2003 to 2010.
Board of Directors
19

Awards and Indexes
*Best IR Website in China; Certificate of Excellence for Corporate Governance in Greater China; Certificate of Excellence for IR Websites in Asia-Pacific
2006, 2007, 2008, 2009, 2010*, 2011
Forbes Asia’s 200‘Best Under a Billion’
2007Highest listing requirements
Since June 2007
Titanium Award for Corporate Governance & Investor Relations
2009 & 2010
20
Gold Award for Social Responsibility and
Investor Relations 2011

Investment Highlights
• Large and attractive market opportunity primarily focused on China export and domestic B2B market
• Leading provider to the professional market Deep relationships with the largest buyers High quality community of verified suppliers
• Industry’s broadest multi-channel platform of media
• Strong balance sheet and 43 year track record of profitability
21

Online Trade shows Magazines Research(NASDAQ-GS: GSOL)
Thank You

IFRS to Non-IFRS Reconciliation
In U.S. Dollars Thousands, Except Number of Shares and Per Share Data
23
2013 2012 2012 2011
IFRS EPS 0.16$ 0.09$ 0.90$ 0.83$
IFRS Net Profit 5,621$ 3,105$ 32,206$ 29,476$
Non-cash stock based compensation expense (Note 1) 341 364 2,409 2,777
Amortization of intangibles (Note 2) 254 191 751 763
Profit on sale of property (4,457) - - -
Impairment loss on investment in associate - - 302 -
Impairment of goodwill and intangibles - - 1,389 670
Non-IFRS Net Profit 1,759$ 3,660$ 37,057$ 33,686$
Non-IFRS diluted net profit per share 0.05$ 0.10$ 1.04$ 0.95$
Total shares used in non-IFRS diluted net profit per share calculations 35,914,192 35,573,189 35,742,495 35,385,218
Notes:(1) Actual SBC is calculated based on actual share price on date of the awards.(2) Amortization of intangible assets relating to certain non-compete agreements.
Three months ended March 31, Year ended December 31,
Management believes non-IFRS metrics are useful measures of operations and provides IFRS to non-IFRS reconciliation tables at the end of this press release. Global Sources defines non-IFRS net income as net income excluding non-cash, SBC expense or credit, amortization of intangibles as it relates to certain equity compensation plans, profits or losses on acquisitions and investments net of transaction costs and related tax expenses, and/or impairment charges, for all historical and future references to non-IFRS metrics. Non-IFRS EPS is defined as non-IFRS net income divided by the weighted average of diluted common shares outstanding.

EBITDA Reconciliation
In U.S. Dollars Thousands
Adjusted EBITDA is defined as earnings before interest, taxes, depreciation, amortization, stock-based compensation, impairment of goodwill and intangible assets, and profits or losses on acquisitions and investments net of transaction costs and related tax expenses.
24
TTM ending2013 2012 March 31, 2013 2012 2011
IFRS profit from operations 5,029$ 3,064$ 36,936$ 34,971$ 31,720$
Depreciation and amortization 2,270 1,964 9,418 9,112 6,785
EBITDA 7,299 5,028 46,354 44,083 38,505
Non-cash stock based compensation expense 341 364 2,386 2,409 2,777
Profit on sale of property (4,457) - (4,457) - -
Impairment of goodwill and intangibles - - 1,389 1,389 670
Adjusted EBITDA 3,183$ 5,392$ 45,672$ 47,881$ 41,952$
Three months ended March 31, Year ended December 31,


![新ファンドのお知らせ【iFreeNEXT NASDAQ 次世代50】...2020/12/29 · [Rtf —77)' F] NASDAQ Q-50 (È) I I 12 Daiwa Asset Press Release NASDAQ Nasdaq, Inc. Nasdaq, Inc](https://img.pdfslide.net/doc/110x75/60ad0a5669e6fa12ef6df966/fffcifreenext-nasdaq-50-20201229.jpg)