Embed Size (px)
Citation preview

WOODBRIDGE ECONOMY & FINANCE FACTBOOK
WOODBRIDGE ECONOMY & FINANCE
Major FindingsHow to use this document
This fact book provides data, background, and analysis of major trends affecting
Woodbridge’s economy and municipal finances, including employment and workforce
characteristics, incomes, local businesses, and fiscal indicators. This information will help
support decisions and investments that build and enhance the local economy and ensure a
stable financial foundation for the Town’s future.
Unless otherwise noted, economic data is drawn primarily from the US Census Bureau
American Community Survey 2012, with supplemental information and projections drawn
from the following sources:
• Connecticut Department of Labor
• Connecticut Office of Policy and Management
• Dun & Bradstreet, Inc.
Additional design concepts are drawn from the Yale Urban Design Workshop’s Woodbridge
Village District Development Concept Plan.
1. Employment and labor force participation remain below pre-Recession levels
2. Woodbridge residents’ occupations match high educational attainments
3. Incomes far exceed state and national averages
4. Most employers are small businesses
5. Local businesses are well-positioned to drive future job growth in Woodbridge
6. Amity is Woodbridge’s main commercial node
7. Good design and economic competitiveness complement each other in Amity
8. Supportive zoning and high local retail demand enable development opportunities
9. Woodbridge’s financial prospects are healthy
WOODBRIDGE ECONOMY & FINANCEEmployment and labor force participation remain below pre-Recession levels
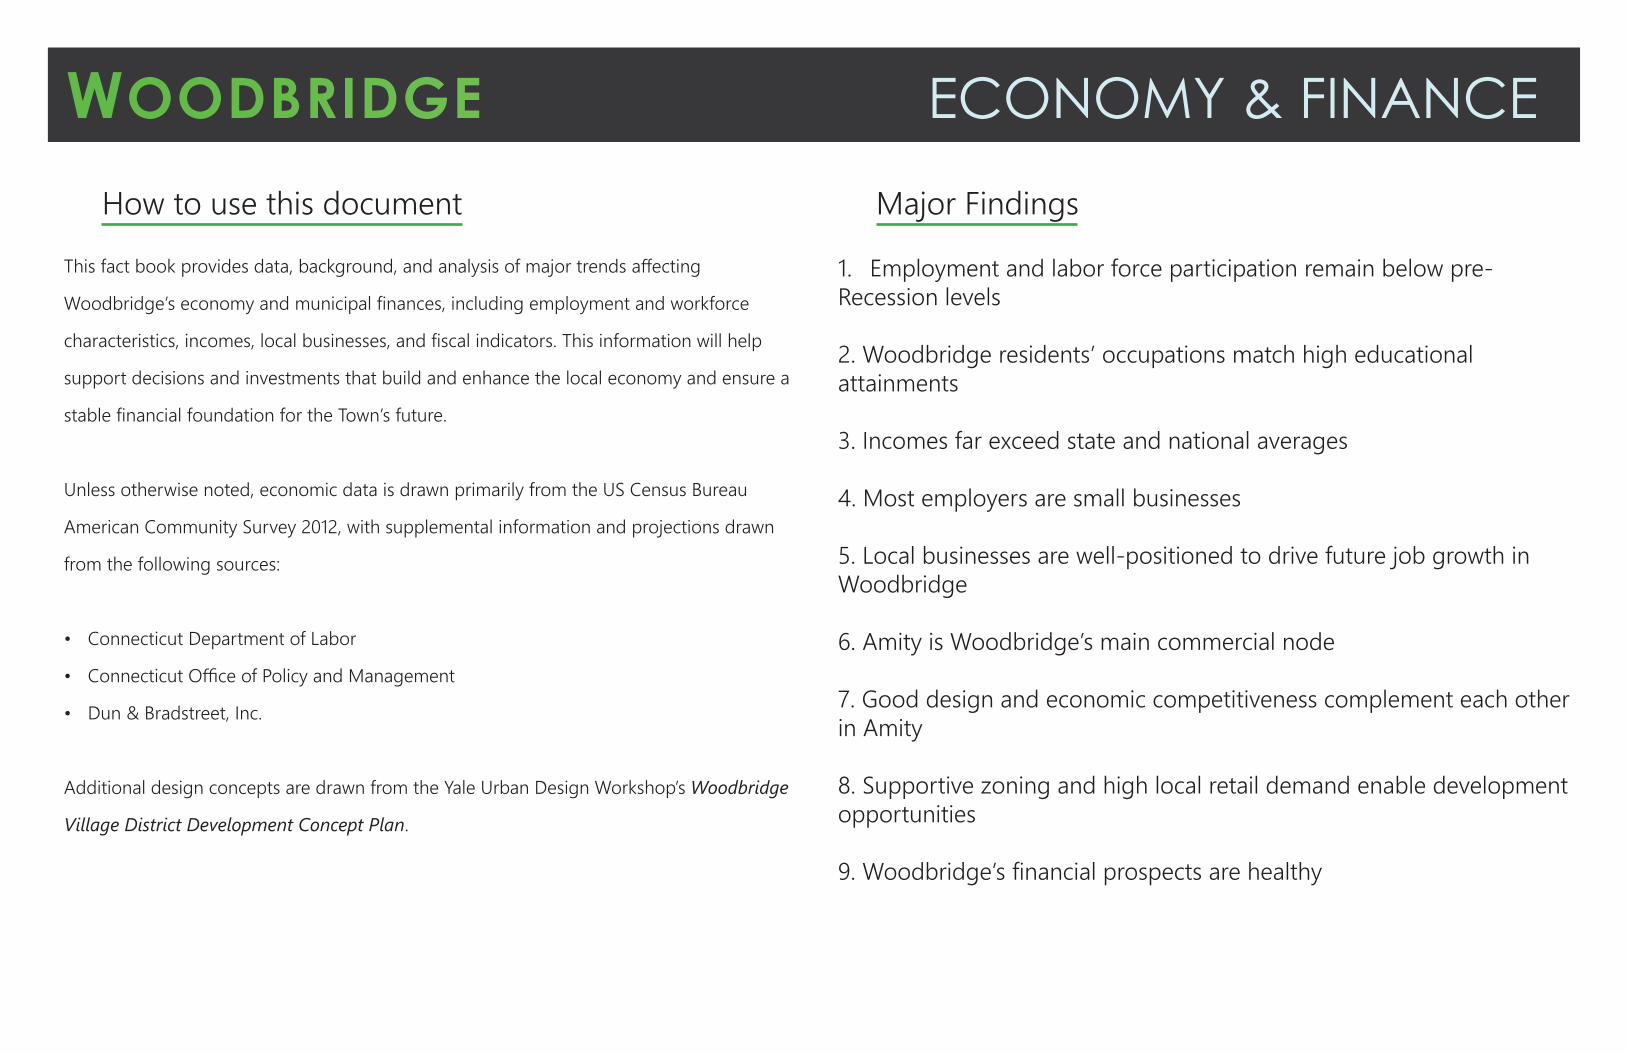
On average during 2013, 5.8% of Woodbridge’s workforce was classified as unemployed. While unemployment
rates are down from a local peak in 2010 at 7.1%, they remain substantially higher than
the mid-3% levels typically experienced in the mid-2000s prior to the Great Recession.
Woodbridge has, however, maintained a substantially lower rate of unemployment than New
Haven County and the State of Connecticut, which saw peak unemployment rates in 2010 of
10.3% and 9.3%, respectively.
While unemployment in Woodbridge has declined since 2010, a steady decline in the size
of the workforce has occured alongside the improvement in unemployment statistics.
Nearly 300 workers have retired or dropped out of the labor market since 2008. Accordingly, actual employment numbers have
dropped from a peak of 4,740 in 2008 to approximately 4,372 in 2013.
The Town’s population dynamics between 2000 and 2010 (discussed in greater detail in the
Demographic Fact Book) lend perspective to these changes. As the number of working-
age adults decrease while older adults at or near retirement age increase, a shrinking
workforce and employed population is a natural consequence. However, this transition did
not begin taking place until 2008, suggesting that job losses during the Recession may have
encouraged older newly-unemployeds to withdraw from the labor market.
1.
0.0%
1.0%
2.0%
3.0%
4.0%
5.0%
6.0%
7.0%
44504500455046004650470047504800485049004950
2004 2005 2006 2007 2008 2009 2010 2011 2012 2013
Labor Force & Unemployment
Labor Force % Unemployed
4000
4200
4400
4600
4800
5000
2004 2005 2006 2007 2008 2009 2010 2011 2012 2013
Labor Force and Employees
Labor Force Employed
0.02.04.06.08.0
10.012.0
2004 2005 2006 2007 2008 2009 2010 2011 2012 2013
Local, Regional, and State Unemployment
Woodbridge Unemployment % New Haven County Unemployment % Connecticut Unemployment %
Source: Connecticut Department of Labor
WOODBRIDGE ECONOMY & FINANCEWoodbridge residents’ occupations match high educational attainments
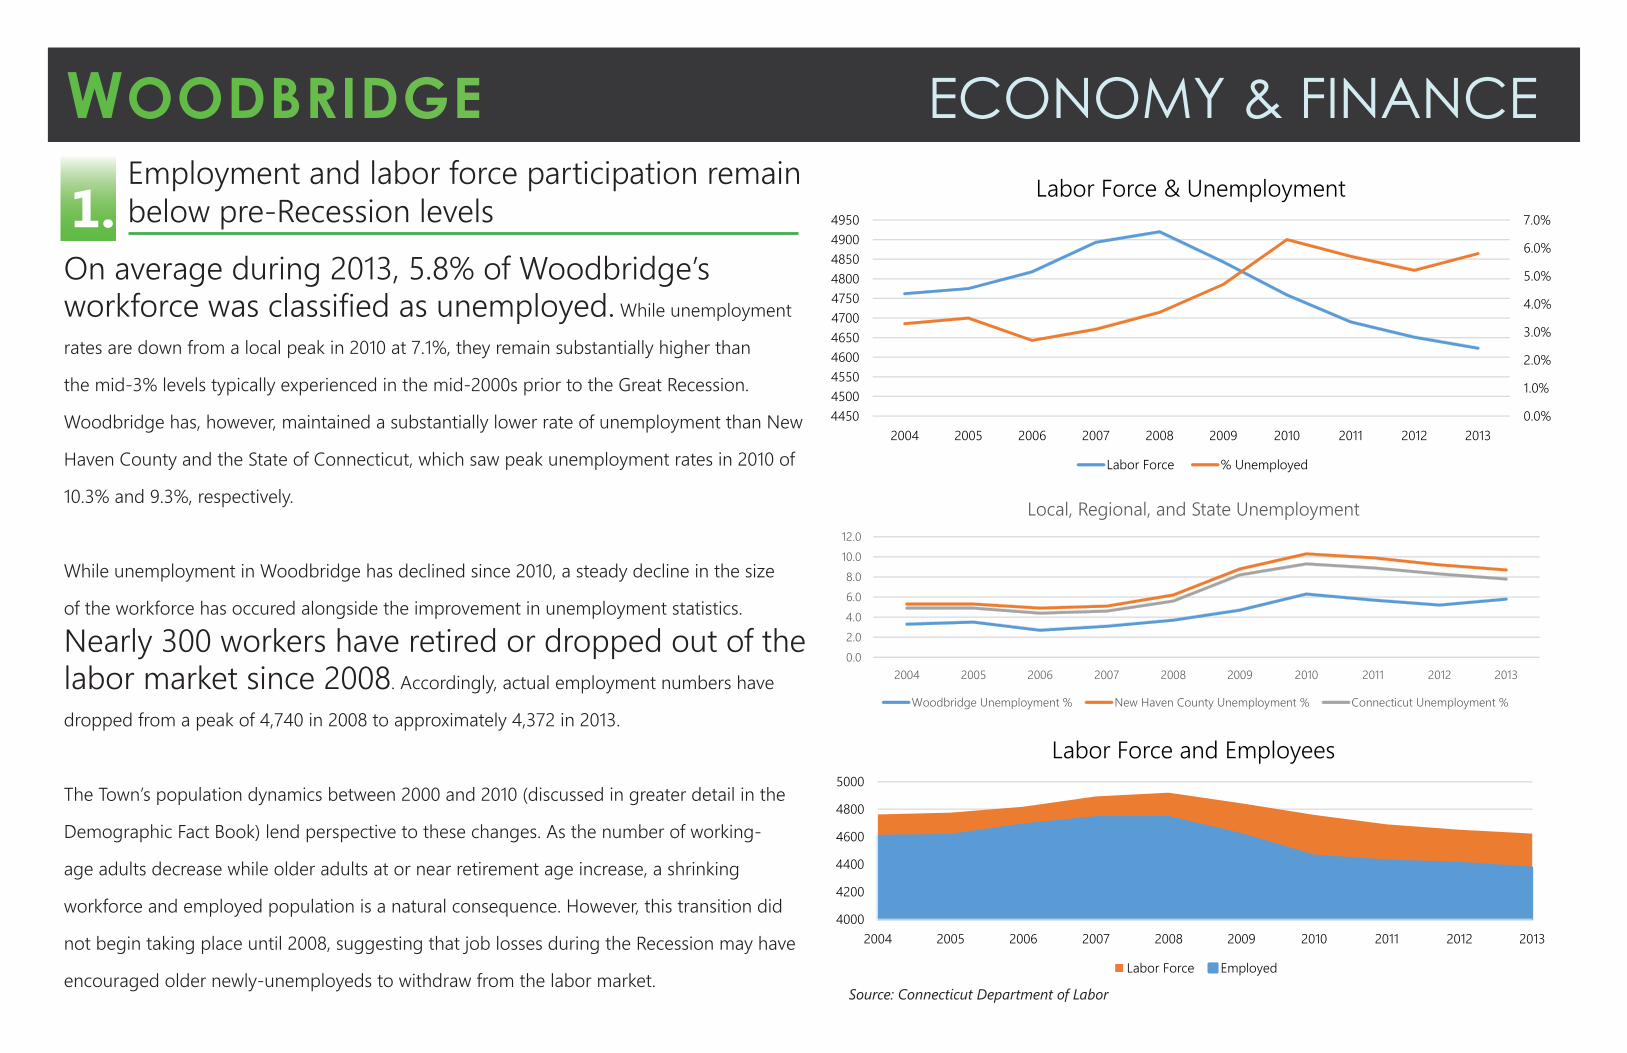
Woodbridge’s residents work in a variety of industries and fields primarily within the service
and professional sectors. 72.3% of the population 25 years of age and older holds at least
a bachelor’s degree, and 41.2% hold a graduate or professional degree—the highest share
of advanced degrees of any town in Connecticut. Accordingly, management, business, science, and arts occupations make up the majority of the jobs Woodbridge’s highly educated workforce hold. Sales and office occupations also make up a substantial share of
Woodbridge’s jobs.
2. A closer examination of the industries Woodbridge residents work in reveals a high
concentration of the workforce in education, healthcare, and social assistance professions.
This category includes many employees of Yale University, the University of New Haven, Yale-
New Haven Hospital, and social assistance organizations within the greater New Haven area.
Yale and associated research centers and businesses also provide significant employment in
the professional, scientific, management, and administrative professions, the Town’s second-
largest source of employment. Together, these high-skill groups of occupations account for over 2,400 jobs held by Woodbridge residents.
0200400600800
1,0001,2001,4001,6001,800
Employment by Industry Group
Source: American Community Survey 2012
Source: US Census ZIP Code Business Patterns
61%9%
22%
5% 3%Labor Force by
Occupational Sector
Management, business, science, and arts occupations
Service occupations
Sales and office occupations
Natural resources, construction, and maintenance occupations
Production, transportation, and material moving occupations
WOODBRIDGE ECONOMY & FINANCE
Most employers are small businesses291 businesses in Woodbridge employed 4,071 people in 2012, providing a moderate base
of employment for residents and the broader region. Industry categories that had the
largest numbers of businesses included professional, scientific, and technical services; health
care and social assistance; other services (except public administration); and construction.
Woodbridge’s largest employers include Marrakech Incorporated, the Professional Parenting
Program, Crest Dodge, Advantage Cleaning LLC, and Amity Regional High School. While
these employers constitute a large share of employment, the majority of local businesses are
small: over three quarters of Woodbridge businesses have fewer than 10 employees.
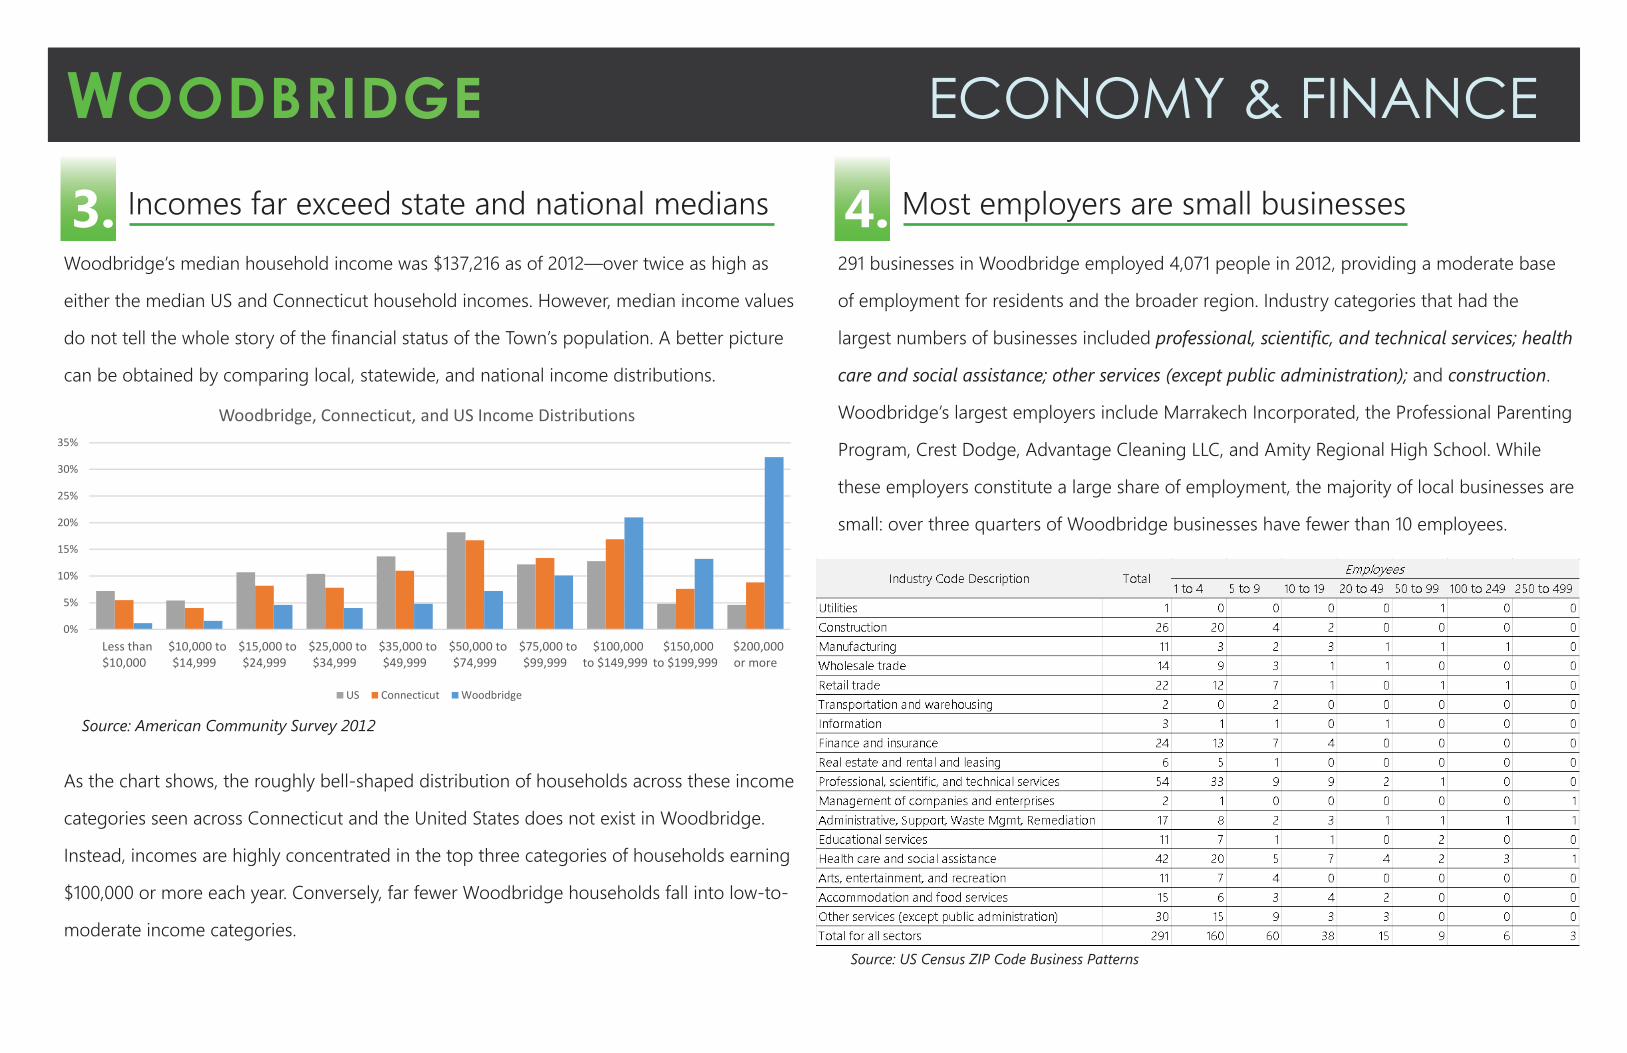
4.Incomes far exceed state and national mediansWoodbridge’s median household income was $137,216 as of 2012—over twice as high as
either the median US and Connecticut household incomes. However, median income values
do not tell the whole story of the financial status of the Town’s population. A better picture
can be obtained by comparing local, statewide, and national income distributions.
3.
As the chart shows, the roughly bell-shaped distribution of households across these income
categories seen across Connecticut and the United States does not exist in Woodbridge.
Instead, incomes are highly concentrated in the top three categories of households earning
$100,000 or more each year. Conversely, far fewer Woodbridge households fall into low-to-
moderate income categories.
Source: American Community Survey 2012
Source: US Census ZIP Code Business Patterns
0%
5%
10%
15%
20%
25%
30%
35%
Less than$10,000
$10,000 to$14,999
$15,000 to$24,999
$25,000 to$34,999
$35,000 to$49,999
$50,000 to$74,999
$75,000 to$99,999
$100,000to $149,999
$150,000to $199,999
$200,000or more
Woodbridge, Connecticut, and US Income Distributions
US Connecticut Woodbridge
WOODBRIDGE ECONOMY & FINANCE
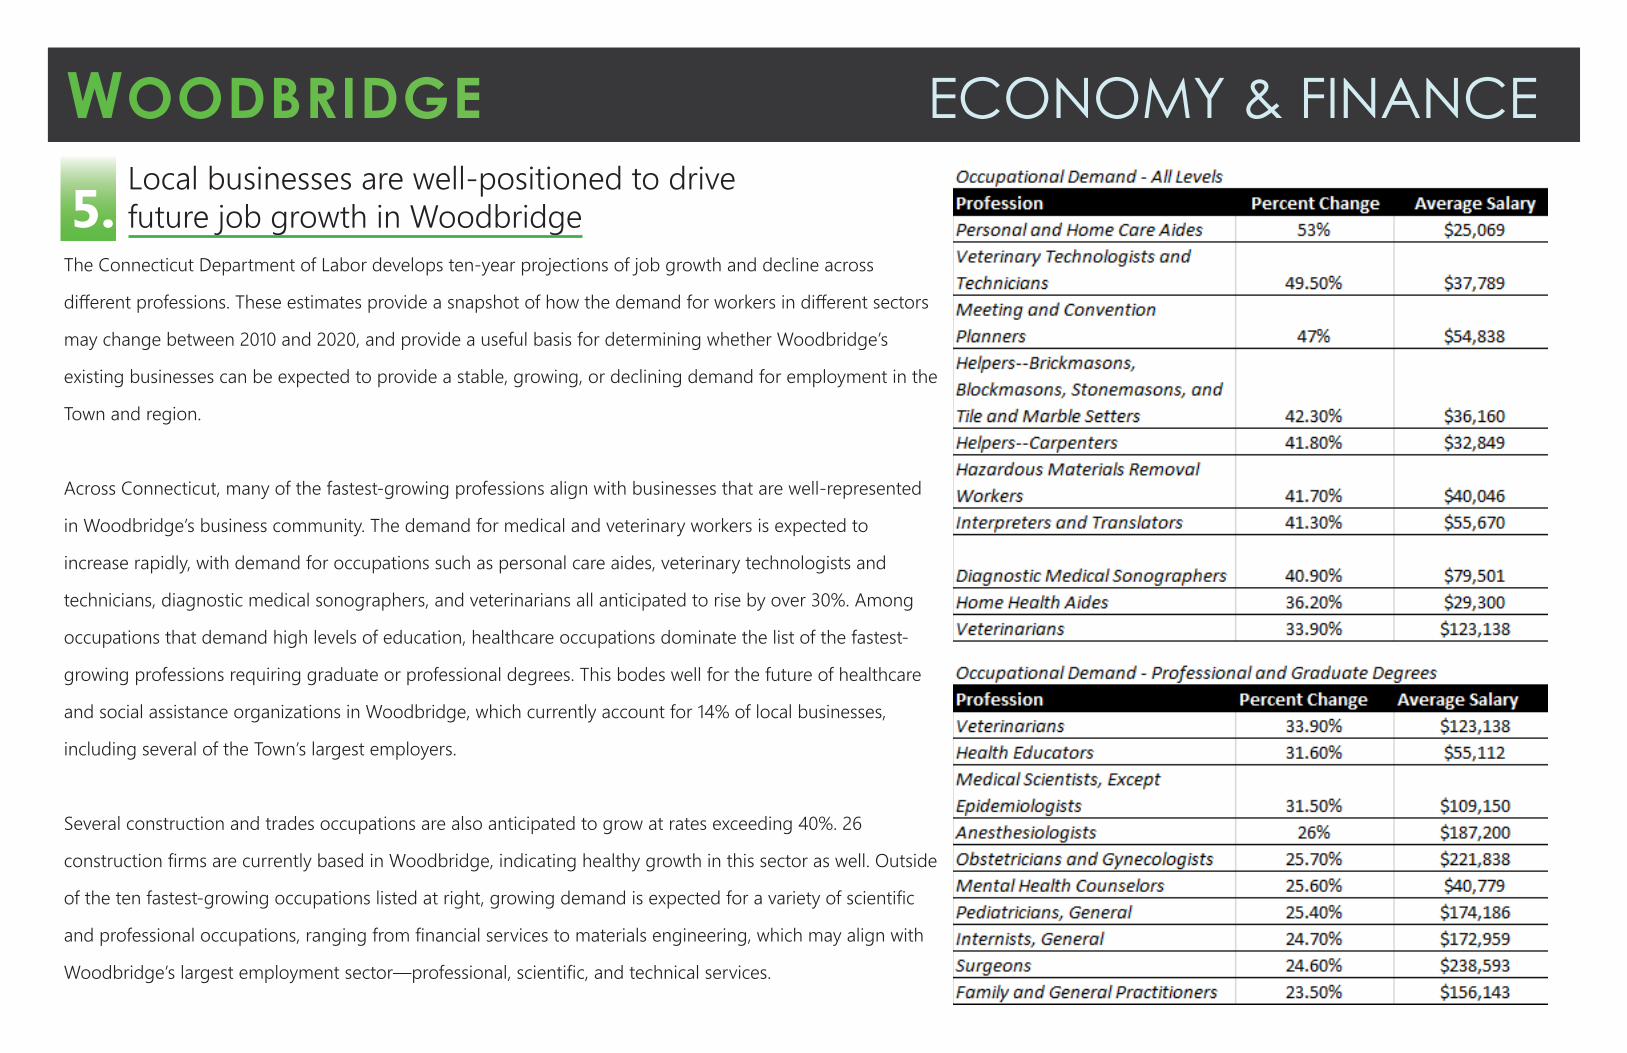
The Connecticut Department of Labor develops ten-year projections of job growth and decline across
different professions. These estimates provide a snapshot of how the demand for workers in different sectors
may change between 2010 and 2020, and provide a useful basis for determining whether Woodbridge’s
existing businesses can be expected to provide a stable, growing, or declining demand for employment in the
Town and region.
Across Connecticut, many of the fastest-growing professions align with businesses that are well-represented
in Woodbridge’s business community. The demand for medical and veterinary workers is expected to
increase rapidly, with demand for occupations such as personal care aides, veterinary technologists and
technicians, diagnostic medical sonographers, and veterinarians all anticipated to rise by over 30%. Among
occupations that demand high levels of education, healthcare occupations dominate the list of the fastest-
growing professions requiring graduate or professional degrees. This bodes well for the future of healthcare
and social assistance organizations in Woodbridge, which currently account for 14% of local businesses,
including several of the Town’s largest employers.
Several construction and trades occupations are also anticipated to grow at rates exceeding 40%. 26
construction firms are currently based in Woodbridge, indicating healthy growth in this sector as well. Outside
of the ten fastest-growing occupations listed at right, growing demand is expected for a variety of scientific
and professional occupations, ranging from financial services to materials engineering, which may align with
Woodbridge’s largest employment sector—professional, scientific, and technical services.
5.Local businesses are well-positioned to drivefuture job growth in Woodbridge
WOODBRIDGE ECONOMY & FINANCE
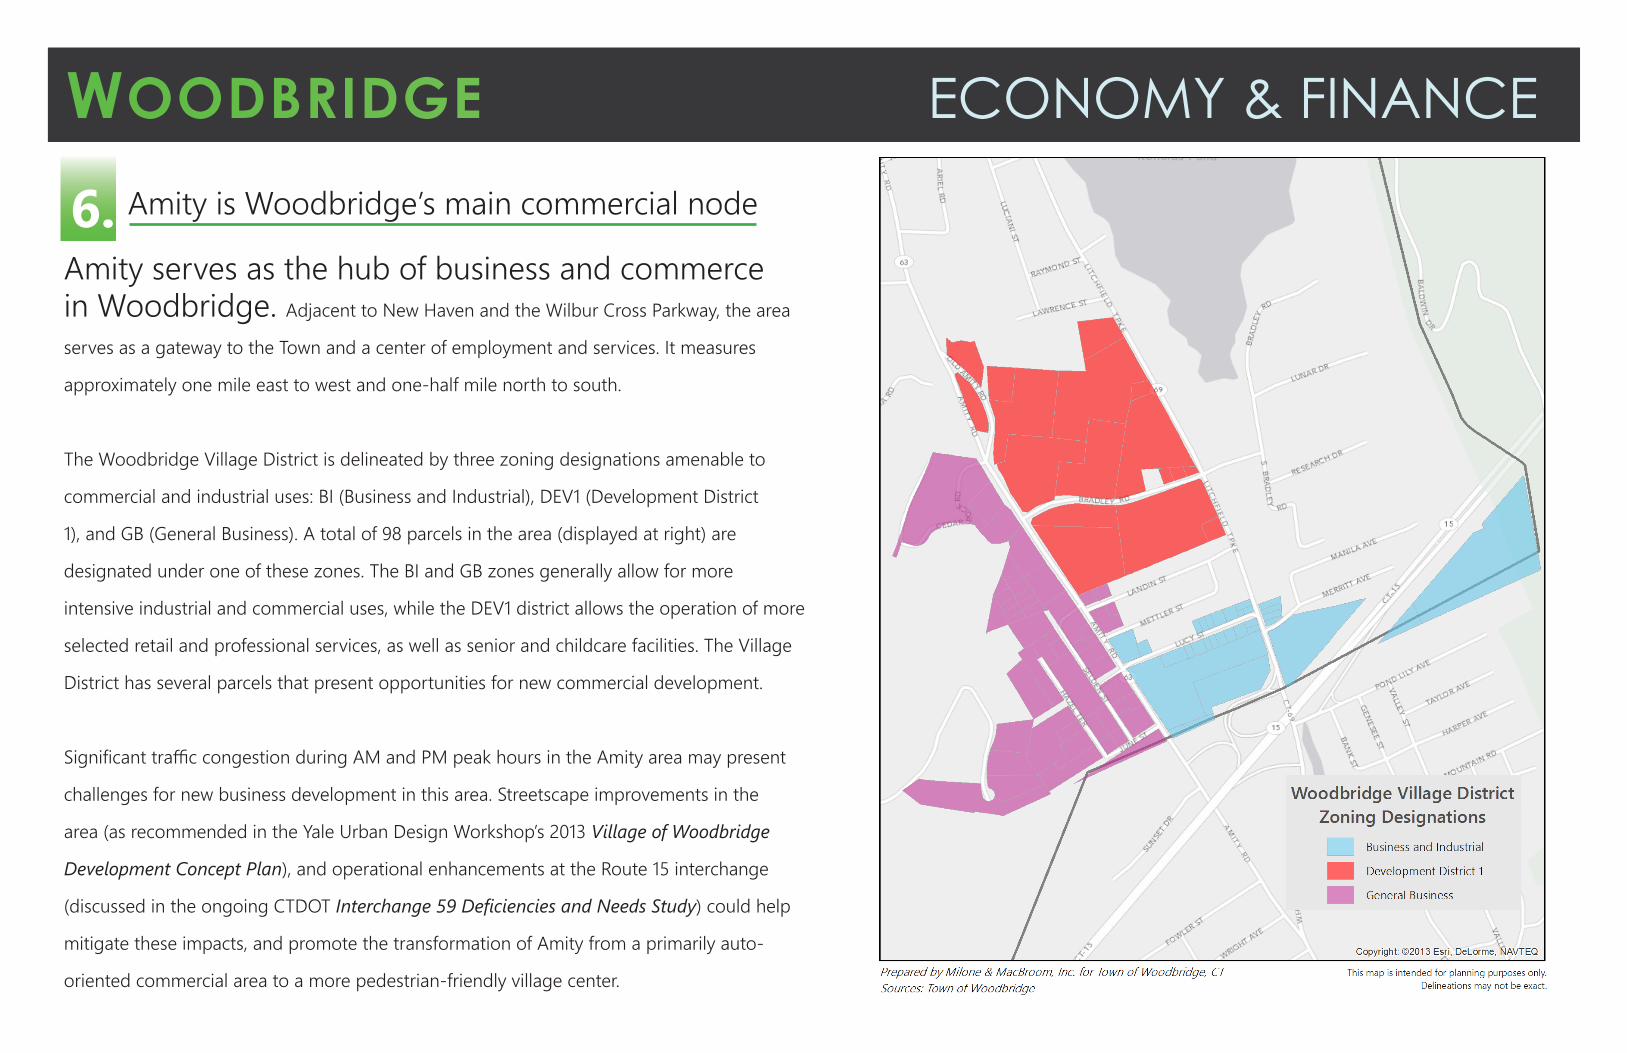
Amity serves as the hub of business and commerce in Woodbridge. Adjacent to New Haven and the Wilbur Cross Parkway, the area
serves as a gateway to the Town and a center of employment and services. It measures
approximately one mile east to west and one-half mile north to south.
The Woodbridge Village District is delineated by three zoning designations amenable to
commercial and industrial uses: BI (Business and Industrial), DEV1 (Development District
1), and GB (General Business). A total of 98 parcels in the area (displayed at right) are
designated under one of these zones. The BI and GB zones generally allow for more
intensive industrial and commercial uses, while the DEV1 district allows the operation of more
selected retail and professional services, as well as senior and childcare facilities. The Village
District has several parcels that present opportunities for new commercial development.
Significant traffic congestion during AM and PM peak hours in the Amity area may present
challenges for new business development in this area. Streetscape improvements in the
area (as recommended in the Yale Urban Design Workshop’s 2013 Village of Woodbridge
Development Concept Plan), and operational enhancements at the Route 15 interchange
(discussed in the ongoing CTDOT Interchange 59 Deficiencies and Needs Study) could help
mitigate these impacts, and promote the transformation of Amity from a primarily auto-
oriented commercial area to a more pedestrian-friendly village center.
Amity is Woodbridge’s main commercial node6.
WOODBRIDGE ECONOMY & FINANCEGood design and economic competitiveness compliment each other in Amity
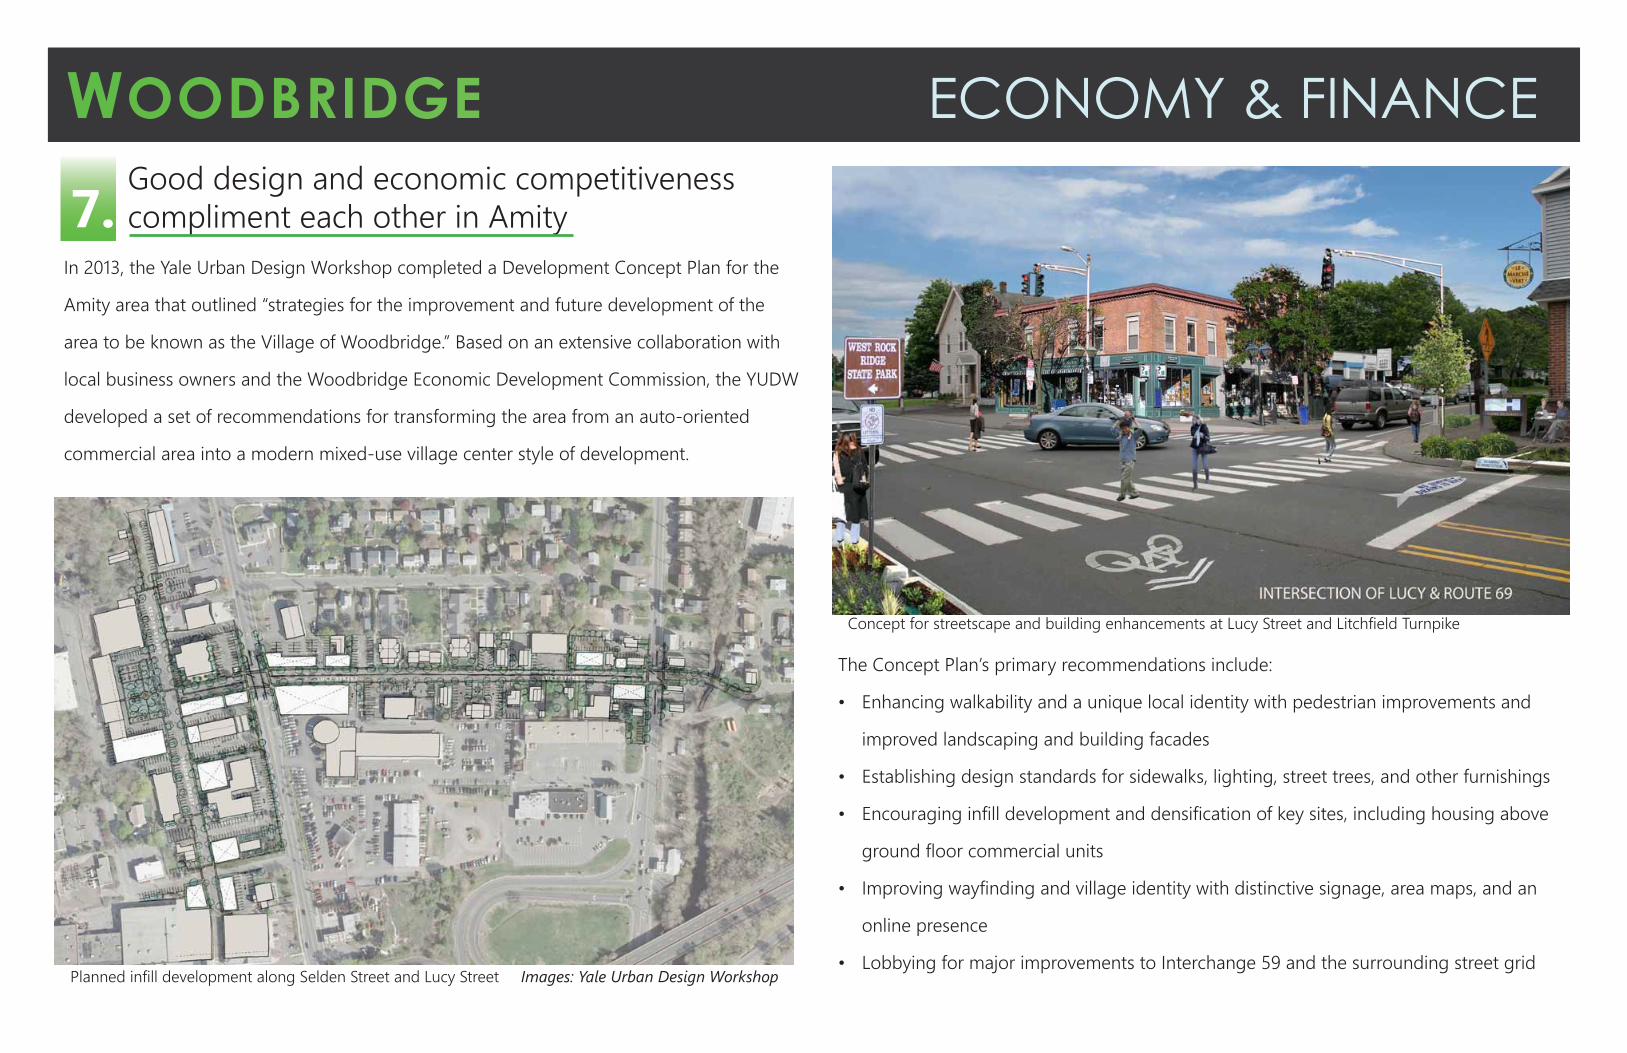
In 2013, the Yale Urban Design Workshop completed a Development Concept Plan for the
Amity area that outlined “strategies for the improvement and future development of the
area to be known as the Village of Woodbridge.” Based on an extensive collaboration with
local business owners and the Woodbridge Economic Development Commission, the YUDW
developed a set of recommendations for transforming the area from an auto-oriented
commercial area into a modern mixed-use village center style of development.
7.
Planned infill development along Selden Street and Lucy Street Images: Yale Urban Design Workshop
The Concept Plan’s primary recommendations include:
• Enhancing walkability and a unique local identity with pedestrian improvements and
improved landscaping and building facades
• Establishing design standards for sidewalks, lighting, street trees, and other furnishings
• Encouraging infill development and densification of key sites, including housing above
ground floor commercial units
• Improving wayfinding and village identity with distinctive signage, area maps, and an
online presence
• Lobbying for major improvements to Interchange 59 and the surrounding street grid
Concept for streetscape and building enhancements at Lucy Street and Litchfield Turnpike
WOODBRIDGE ECONOMY & FINANCE
With a median household disposable income of nearly $100,000 and few retailers located
in town, Woodbridge is a community where demand for goods and services dramatically
outpaces what local establishments offer.
According to retail marketplace data provided by business information provider Dun &
Bradstreet, total demand exceeded $200 million in 2012, while retailers and food and
drink establishments posted sales of just $28.7 million. While courting new business in
some categories, such as department stores and electronics retailers, is infeasible given
Woodbridge’s size, location, and character, many other opportunities exist to meet local
needs. Unmet demand for retail food and beverage sales exceeds $30 million a year, clothing
and accessories exceeds $12 million a year, and restaurants and bars near $18 million a year.
Available parcels in the Amity area on Lucy Street, Amity Road, and Hazel Terrace might all
be prime locations for new businesses in these categories.
Another business opportunity that plays well to Woodbridge’s unique local character is
tourism. In addition to the Town’s proximity to New Haven, its bountiful supply of open
space and trails and the accessibility to West Rock State Park create the potential for creating
revenue streams around outdoor recreation in the area.
8. Supportive zoning and high local retail demand enable development opportunities
Industrial land uses in Woodbridge are located primarily in Development District 2 in the
area of Amity east of the Litchfield Turnpike. Under current land use regulations, both
Development Districts 1 and 2 allow for office, laboratory, and high-value manufacturing.
The largest currently undeveloped site in Amity falls under the Development District 1
designation, which would theoretically allow for light industrial use. Undeveloped parcels in
the Development District 2 area are constrained by steep topography.
While prospects for substantial new industrial uses are limited, strategically promoting the
inclusion of office space in mixed-use developments could provide opportunities for small
and professional enterprises to locate in Woodbridge. Professional, financial, and commercial
offices are currently allowed under all non-residential zones (Business Industrial, General
Business, and both Development Districts), and approximately 260,000 square feet of office
space is currently available. A commercial buildout analysis suggests that nearly 440,000
square feet of commercial space (including office uses) could be developed on vacant
commercial properties in the Town. These districts allow for two to three story buildings with
lot coverages ranging from 25% to 70%, resulting in floor area ratios between 0.75 to 2.1,
although in practice the average FAR achieved is approximately 0.26.
WOODBRIDGE ECONOMY & FINANCE
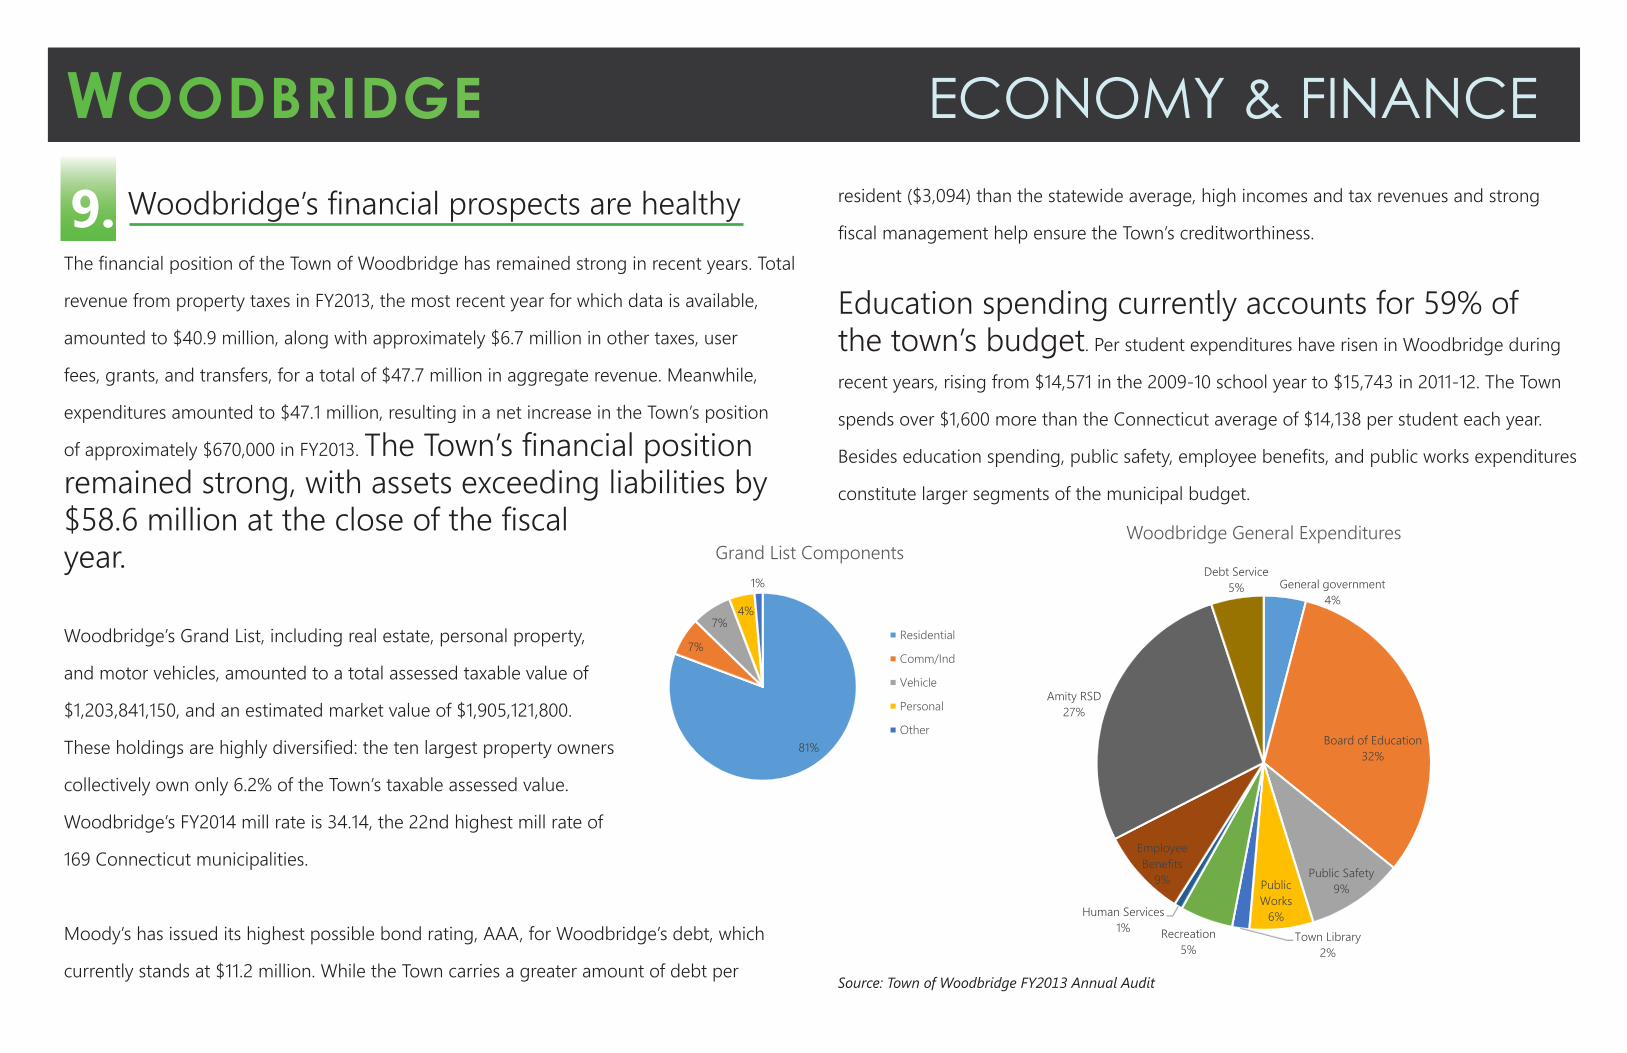
Woodbridge’s financial prospects are healthyThe financial position of the Town of Woodbridge has remained strong in recent years. Total
revenue from property taxes in FY2013, the most recent year for which data is available,
amounted to $40.9 million, along with approximately $6.7 million in other taxes, user
fees, grants, and transfers, for a total of $47.7 million in aggregate revenue. Meanwhile,
expenditures amounted to $47.1 million, resulting in a net increase in the Town’s position
of approximately $670,000 in FY2013. The Town’s financial position remained strong, with assets exceeding liabilities by $58.6 million at the close of the fiscal year.
Woodbridge’s Grand List, including real estate, personal property,
and motor vehicles, amounted to a total assessed taxable value of
$1,203,841,150, and an estimated market value of $1,905,121,800.
These holdings are highly diversified: the ten largest property owners
collectively own only 6.2% of the Town’s taxable assessed value.
Woodbridge’s FY2014 mill rate is 34.14, the 22nd highest mill rate of
169 Connecticut municipalities.
Moody’s has issued its highest possible bond rating, AAA, for Woodbridge’s debt, which
currently stands at $11.2 million. While the Town carries a greater amount of debt per
9.
81%
7%
7%4%
1%
Grand List Components
Residential
Comm/Ind
Vehicle
Personal
Other
resident ($3,094) than the statewide average, high incomes and tax revenues and strong
fiscal management help ensure the Town’s creditworthiness.
Education spending currently accounts for 59% of the town’s budget. Per student expenditures have risen in Woodbridge during
recent years, rising from $14,571 in the 2009-10 school year to $15,743 in 2011-12. The Town
spends over $1,600 more than the Connecticut average of $14,138 per student each year.
Besides education spending, public safety, employee benefits, and public works expenditures
constitute larger segments of the municipal budget.
General government4%
Board of Education32%
Public Safety9%Public
Works6%
Town Library2%
Recreation5%
Human Services1%
Employee Benefits
9%
Amity RSD27%
Debt Service5%
Woodbridge General Expenditures
Source: Town of Woodbridge FY2013 Annual Audit