Embed Size (px)
Citation preview
OOnnlliinnee LLeeaarrnniinngg
FFaacctt BBooookk
22001155--22001166
OOffffiiccee ooff IInnssttiittuuttiioonnaall RReesseeaarrcchh
PPhhoonnee:: ((771188)) 999900--11886699
iirr@@ssttjjoohhnnss..eedduu
ssttjjoohhnnss..eedduu//aabboouutt//iirr
AAnndd
OOffffiiccee ooff OOnnlliinnee LLeeaarrnniinngg aanndd SSeerrvviicceess
PPhhoonnee:: ((771188)) 999900--22778866
oonnlliinneelleeaarrnniinngg@@ssttjjoohhnnss..eedduu
wwwwww..ssttjjoohhnnss..eedduu//aaccaaddeemmiiccss//oonnlliinnee--lleeaarrnniinngg
Overview…………………………………………………………………………………………...………...1
History………………………………………………………………………………………………...……...2
Online Degree Programs.……………………………………………………………………...……….…3
All Online Course Registrants Data……………………………………………………………………..4
Total Number of Online Courses and Course Registrants UG/G by Year 5
Total Number of Online Courses and Registrants UG/G by Term 6
Number of Online Course Sections UG/G – Line Graphs 7
Total Number of Online Course Sections – Line Graph 8
Number of Online Registrants UG/G – Line Graphs 9
Total Number of Online Registrants – Line Graph 10
Online Courses Taught by School: Trend 2008-2009 to 2015-2016 11
Online Course Registrants Taught by School: Trend 2008-2009 to 2015-2016 12
Number of Online Instructors 13
Total Credits Taught Online 14
One Year Bac/PharmD Degree Seeking Freshman Retention Rate 15
Unduplicated Headcount of Students UG/G taking Online Courses 16
Online Degree Students Only…………………………………………………………………………..17
Online Learning by Gender and Ethnicity 18
Online Learning by Religion and Status 19
Demographic Characteristic for Online Learning – Graphs 20
Online Learning Trends 2006-2015 21
Online Learning by Geographical Distribution 22
US News Online Ranking……………………………………………………………………………23-25
Tabl
e of
Con
tent
s
Online Learning Fact Book
2015-16
Table of Contents
Source: http://www.stjohns.edu/academics/online-learning/about-online-learning/accreditation-and-state-regulation-authorizations
Retrieved on 4/26/16
Accredited Online Degrees
Since 1870, St. John’s University has educated over 140,000 students from all walks of life for
rewarding personal and professional lives through our outstanding undergraduate and
graduate degree programs. Accredited by the Middle States Commission on Higher Education and
registered with the New York State Education Department, St. John’s online degree and certificate
programs enable adult learners to get a high-quality education in a flexible and convenient format.
Quality, Flexibility and Convenience
Our online courses are of the same high caliber and as academically challenging as those taught in
our classrooms, and the credits earned are identical. The majority of St. John’s online courses are
taught by full-time faculty, and all online instructors are certified to teach in this format. Guided by
Quality Matters (QM), a nationally recognized quality assurance program for online courses, St.
John’s employs the highest standards for the design and development of online curricula and
faculty training in online teaching and learning.
US News & World Report has ranked St. John’s graduate business, graduate education, and
undergraduate online programs in the top 100 nationwide in their respective categories and in the
category of Best Online Programs for Veterans.
A Fully Supported Education
All of our online learning programs are supported by a full range of online student services such as
online registration; advisement; financial aid; library resources; tutoring; bookstore; campus ministry
and more. Our staff is trained to understand the complexities of being an adult, online learner and
offers outstanding resources and support to our online students.
State Authorization
Regulations in states other than New York may limit the ability of St. John’s University to offer
online opportunities to some out-of-state students interested in pursuing distance education degree
programs and/or courses.
At this time, St. John’s University is able to accept applications for online programs from residents
of Alaska; Arizona; California; Colorado; Connecticut; Delaware; District of Columbia; Florida;
Hawaii; Idaho; Illinois; Indiana; Iowa; Kentucky; Louisiana; Maine; Maryland; Massachusetts;
Michigan; Mississippi; Missouri; Montana; Nebraska; Nevada; New Hampshire; New Jersey; New
Mexico; New York; North Carolina; North Dakota; Ohio; Oklahoma; Pennsylvania; Rhode Island;
South Carolina; South Dakota; Tennessee; Texas; Utah; Vermont; Virginia; Washington; West
Virginia, and Wyoming. We will continue to monitor developments in states other than New York,
pursue appropriate approvals or exemptions, and provide updates when available.
Onl
ine
Lear
ning
St. John’s University Online Learning:
Overview
Online Learning Fact Book
1
Source: Online Learning & Services (OLS)
Based on data as of Spring 2016
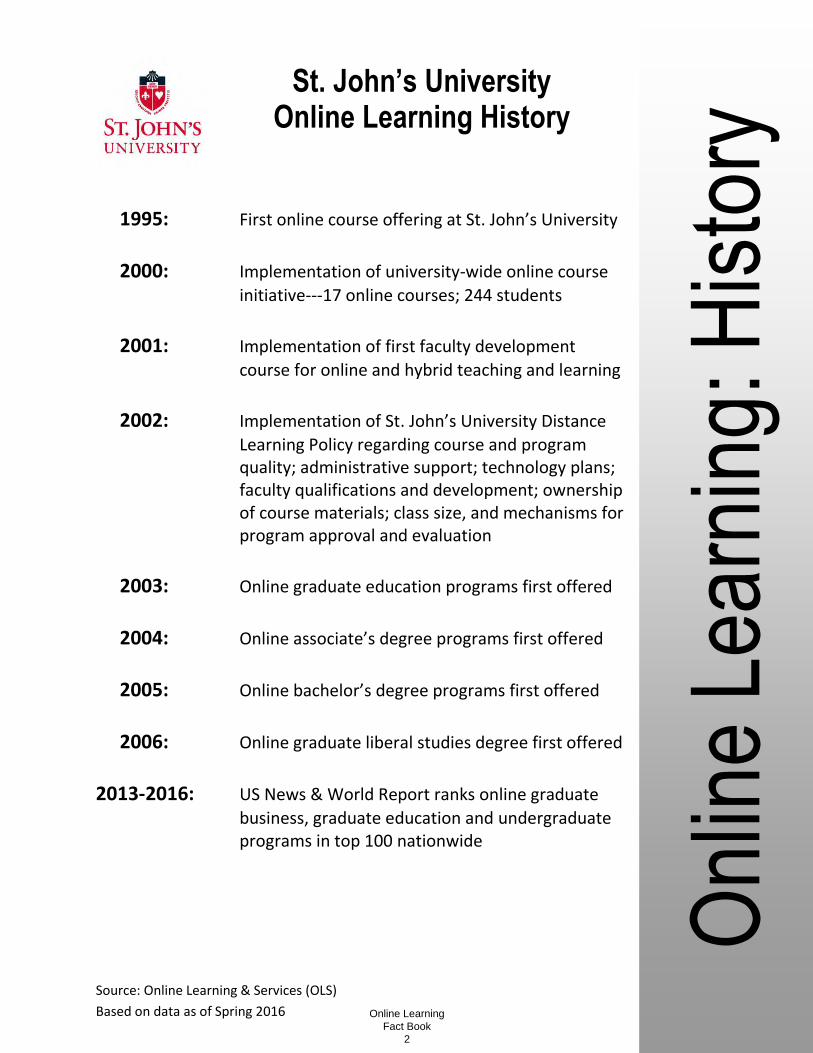
1995: First online course offering at St. John’s University
2000: Implementation of university-wide online course
initiative---17 online courses; 244 students
2001: Implementation of first faculty development
course for online and hybrid teaching and learning
2002: Implementation of St. John’s University Distance
Learning Policy regarding course and program quality; administrative support; technology plans; faculty qualifications and development; ownership of course materials; class size, and mechanisms for program approval and evaluation
2003: Online graduate education programs first offered 2004: Online associate’s degree programs first offered 2005: Online bachelor’s degree programs first offered
2006: Online graduate liberal studies degree first offered
2013-2016: US News & World Report ranks online graduate
business, graduate education and undergraduate programs in top 100 nationwide
Onl
ine
Lear
ning
: His
tory
St. John’s University Online Learning History
Online Learning Fact Book
2
Source: Online Learning & Services (OLA)
Based on Data as of Spring 2016
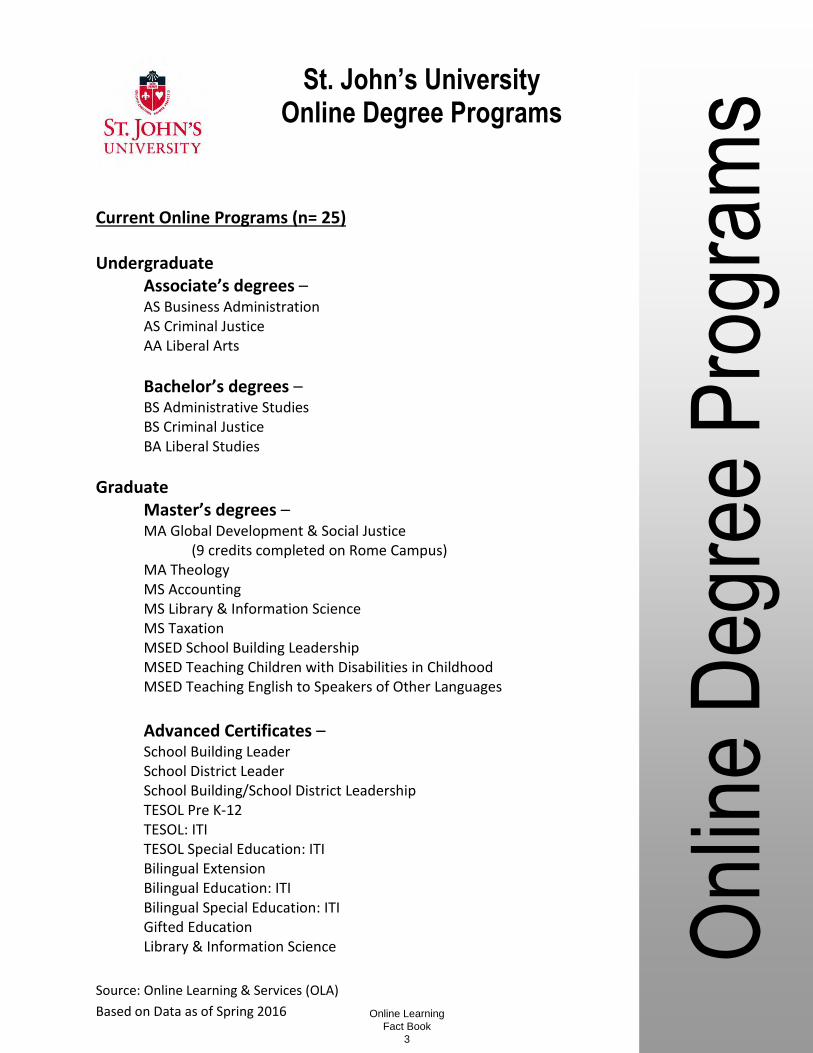
Current Online Programs (n= 25) Undergraduate
Associate’s degrees – AS Business Administration AS Criminal Justice AA Liberal Arts
Bachelor’s degrees – BS Administrative Studies BS Criminal Justice BA Liberal Studies
Graduate Master’s degrees – MA Global Development & Social Justice
(9 credits completed on Rome Campus) MA Theology
MS Accounting MS Library & Information Science MS Taxation MSED School Building Leadership MSED Teaching Children with Disabilities in Childhood MSED Teaching English to Speakers of Other Languages
Advanced Certificates – School Building Leader School District Leader School Building/School District Leadership TESOL Pre K-12 TESOL: ITI TESOL Special Education: ITI Bilingual Extension Bilingual Education: ITI Bilingual Special Education: ITI Gifted Education Library & Information Science
Onl
ine
Deg
ree
Pro
gram
s St. John’s University Online Degree Programs
Online Learning Fact Book
3
About This Section
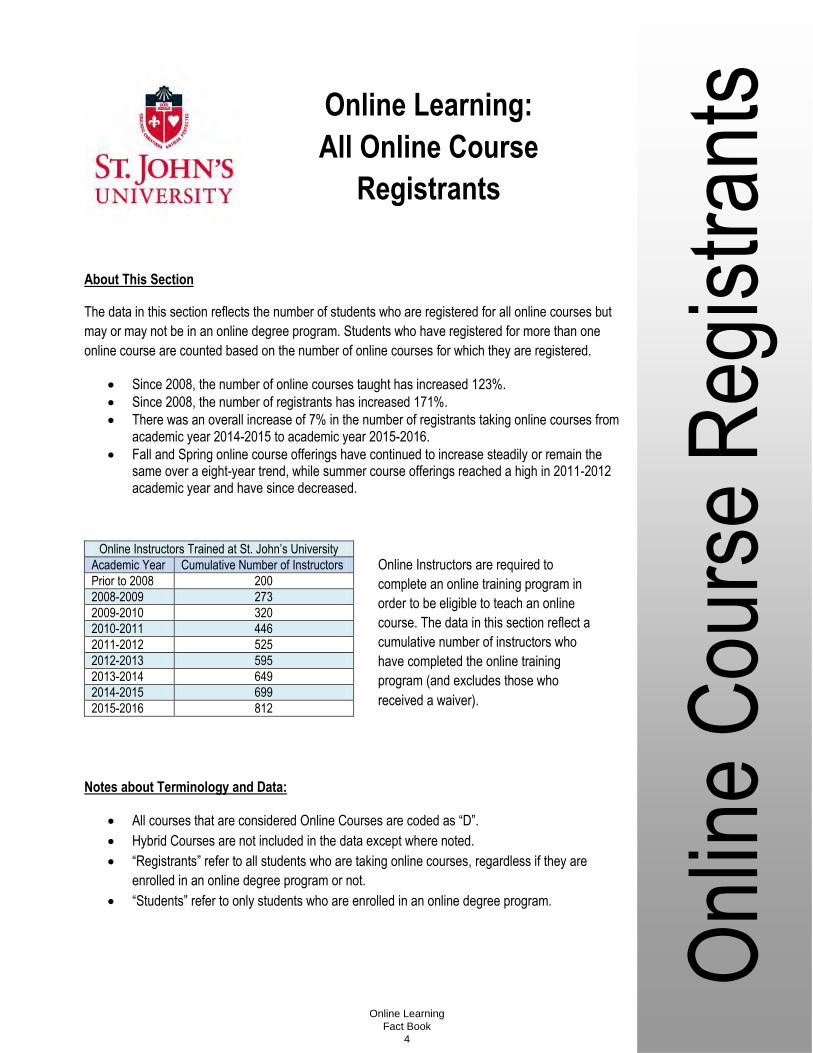
The data in this section reflects the number of students who are registered for all online courses but
may or may not be in an online degree program. Students who have registered for more than one
online course are counted based on the number of online courses for which they are registered.
Since 2008, the number of online courses taught has increased 123%.
Since 2008, the number of registrants has increased 171%.
There was an overall increase of 7% in the number of registrants taking online courses from academic year 2014-2015 to academic year 2015-2016.
Fall and Spring online course offerings have continued to increase steadily or remain the same over a eight-year trend, while summer course offerings reached a high in 2011-2012 academic year and have since decreased.
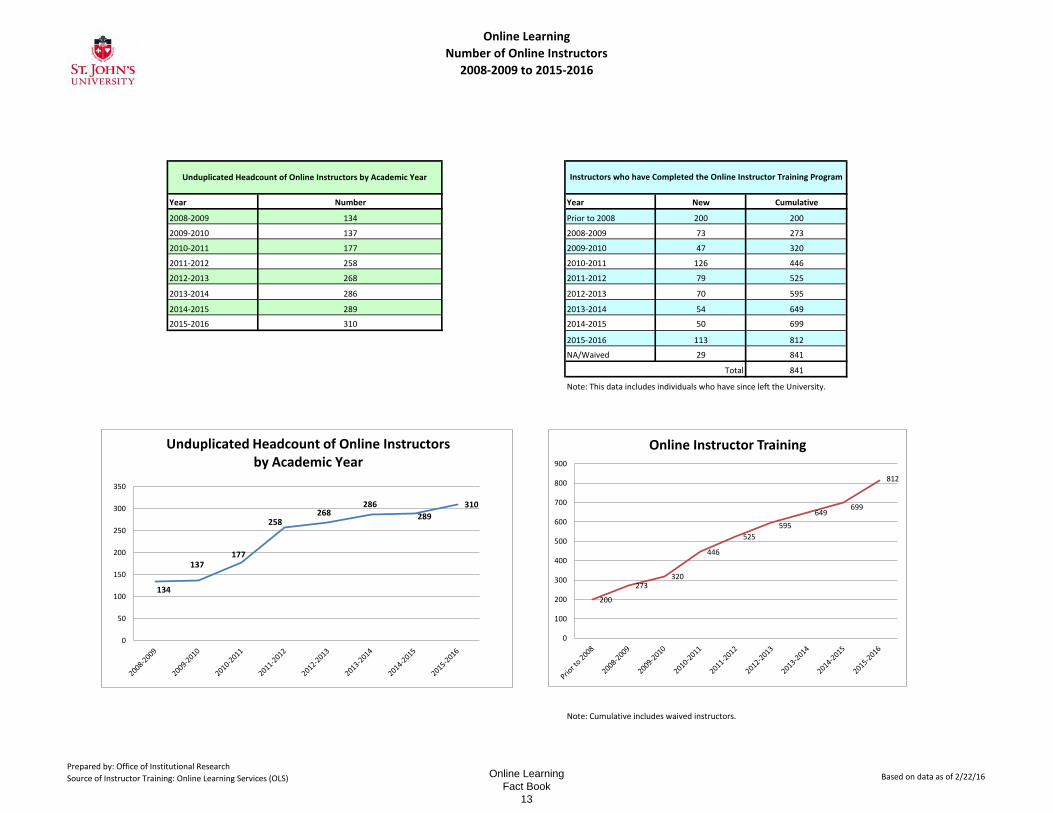
Online Instructors Trained at St. John’s University
Academic Year Cumulative Number of Instructors
Prior to 2008 200
2008-2009 273
2009-2010 320
2010-2011 446
2011-2012 525
2012-2013 595
2013-2014 649
2014-2015 699
2015-2016 812
Notes about Terminology and Data:
All courses that are considered Online Courses are coded as “D”.
Hybrid Courses are not included in the data except where noted.
“Registrants” refer to all students who are taking online courses, regardless if they are
enrolled in an online degree program or not.
“Students” refer to only students who are enrolled in an online degree program.
Onl
ine
Cou
rse
Reg
istr
ants
Online Learning:
All Online Course
Registrants
Online Instructors are required to
complete an online training program in
order to be eligible to teach an online
course. The data in this section reflect a
cumulative number of instructors who
have completed the online training
program (and excludes those who
received a waiver).
Online Learning Fact Book
4
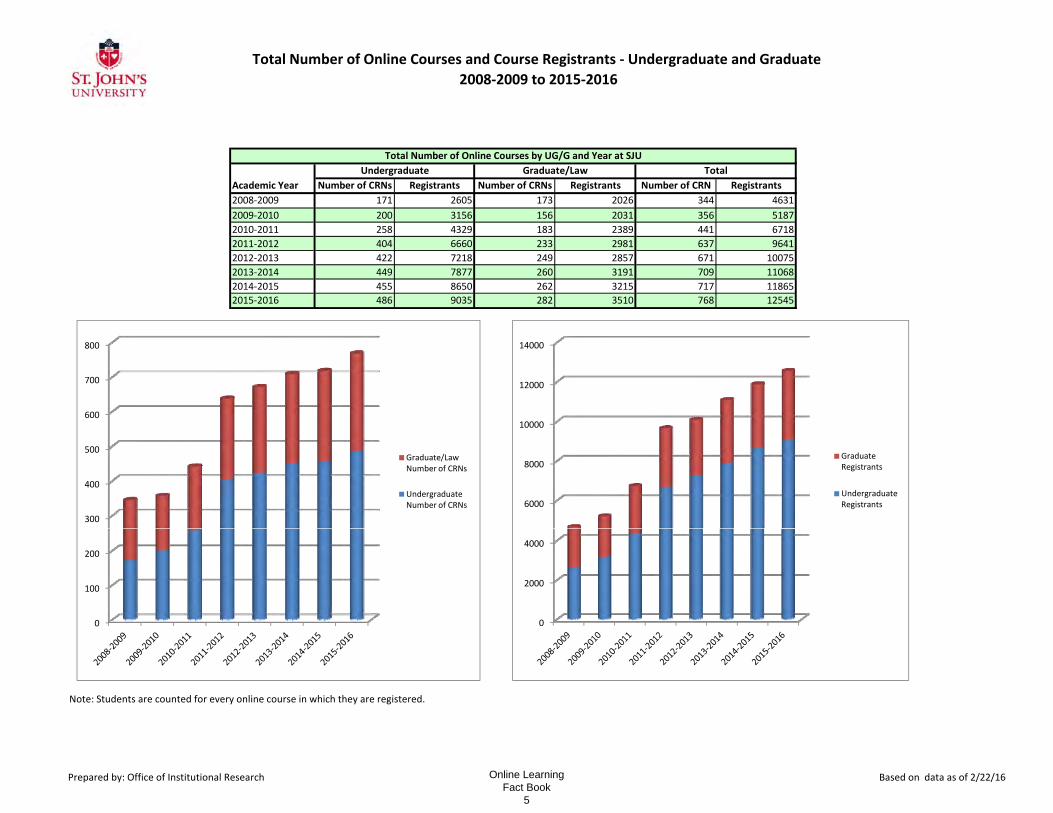
Total Number of Online Courses and Course Registrants ‐ Undergraduate and Graduate 2008‐2009 to 2015‐2016
Number of CRNs Registrants Number of CRNs Registrants Number of CRN Registrants2008‐2009 171 2605 173 2026 344 4631
2009‐2010 200 3156 156 2031 356 5187
2010‐2011 258 4329 183 2389 441 6718
2011‐2012 404 6660 233 2981 637 9641
2012‐2013 422 7218 249 2857 671 10075
2013‐2014 449 7877 260 3191 709 11068
2014‐2015 455 8650 262 3215 717 11865
2015‐2016 486 9035 282 3510 768 12545
Total Number of Online Courses by UG/G and Year at SJUUndergraduate Graduate/Law Total
Academic Year
300
400
500
600
700
800
Graduate/Law Number of CRNs
Undergraduate Number of CRNs 6000
8000
10000
12000
14000
Graduate Registrants
Undergraduate Registrants
Note: Students are counted for every online course in which they are registered.
0
100
200
0
2000
4000
Prepared by: Office of Institutional Research Based on data as of 2/22/16Online Learning Fact Book
5
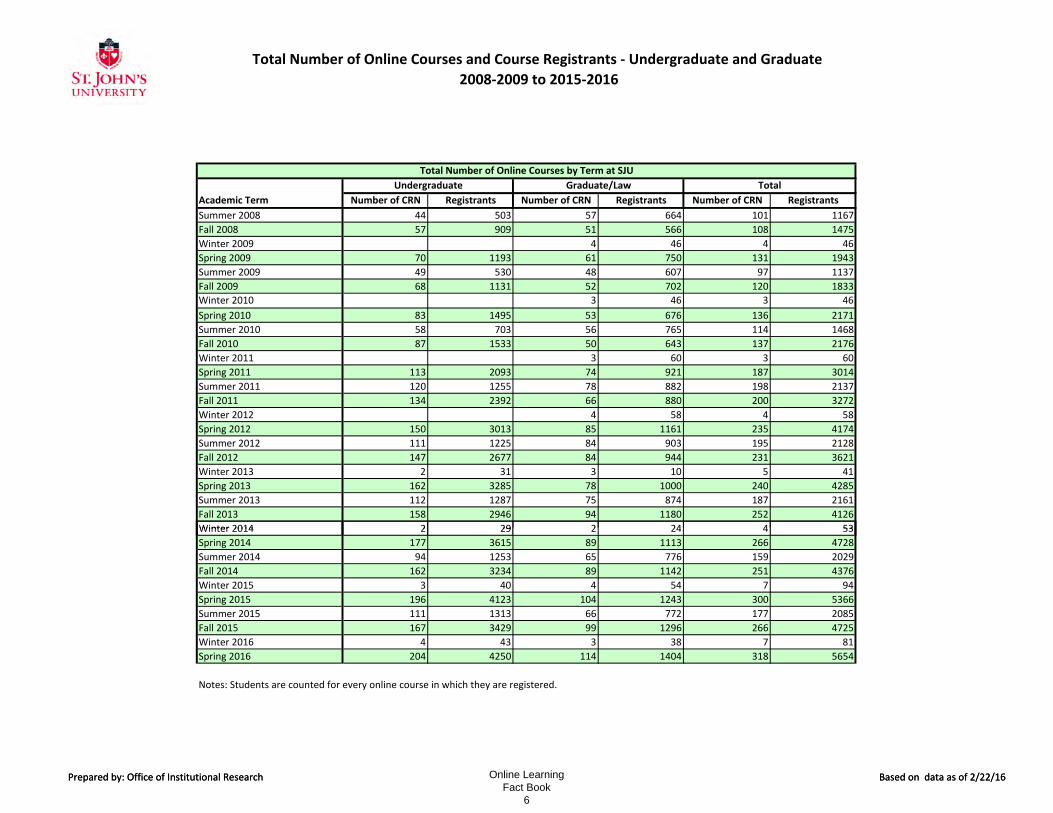
Total Number of Online Courses and Course Registrants ‐ Undergraduate and Graduate 2008‐2009 to 2015‐2016
Number of CRN Registrants Number of CRN Registrants Number of CRN RegistrantsSummer 2008 44 503 57 664 101 1167
Fall 2008 57 909 51 566 108 1475
Winter 2009 4 46 4 46
Spring 2009 70 1193 61 750 131 1943
Summer 2009 49 530 48 607 97 1137
Fall 2009 68 1131 52 702 120 1833
Winter 2010 3 46 3 46
Spring 2010 83 1495 53 676 136 2171
Summer 2010 58 703 56 765 114 1468
Fall 2010 87 1533 50 643 137 2176
Winter 2011 3 60 3 60
Spring 2011 113 2093 74 921 187 3014
Summer 2011 120 1255 78 882 198 2137
Fall 2011 134 2392 66 880 200 3272
Winter 2012 4 58 4 58
Spring 2012 150 3013 85 1161 235 4174
Summer 2012 111 1225 84 903 195 2128
Fall 2012 147 2677 84 944 231 3621
Winter 2013 2 31 3 10 5 41
Spring 2013 162 3285 78 1000 240 4285
Summer 2013 112 1287 75 874 187 2161
Fall 2013 158 2946 94 1180 252 4126
Winter 2014 2 29 2 24 4 53
Total Number of Online Courses by Term at SJU
Academic TermUndergraduate Graduate/Law Total
Prepared by: Office of Institutional Research Based on data as of 2/22/16
Winter 2014 2 29 2 24 4 53
Spring 2014 177 3615 89 1113 266 4728
Summer 2014 94 1253 65 776 159 2029
Fall 2014 162 3234 89 1142 251 4376
Winter 2015 3 40 4 54 7 94
Spring 2015 196 4123 104 1243 300 5366
Summer 2015 111 1313 66 772 177 2085
Fall 2015 167 3429 99 1296 266 4725
Winter 2016 4 43 3 38 7 81
Spring 2016 204 4250 114 1404 318 5654
Notes: Students are counted for every online course in which they are registered.
Prepared by: Office of Institutional Research Based on data as of 2/22/16Online Learning Fact Book
6
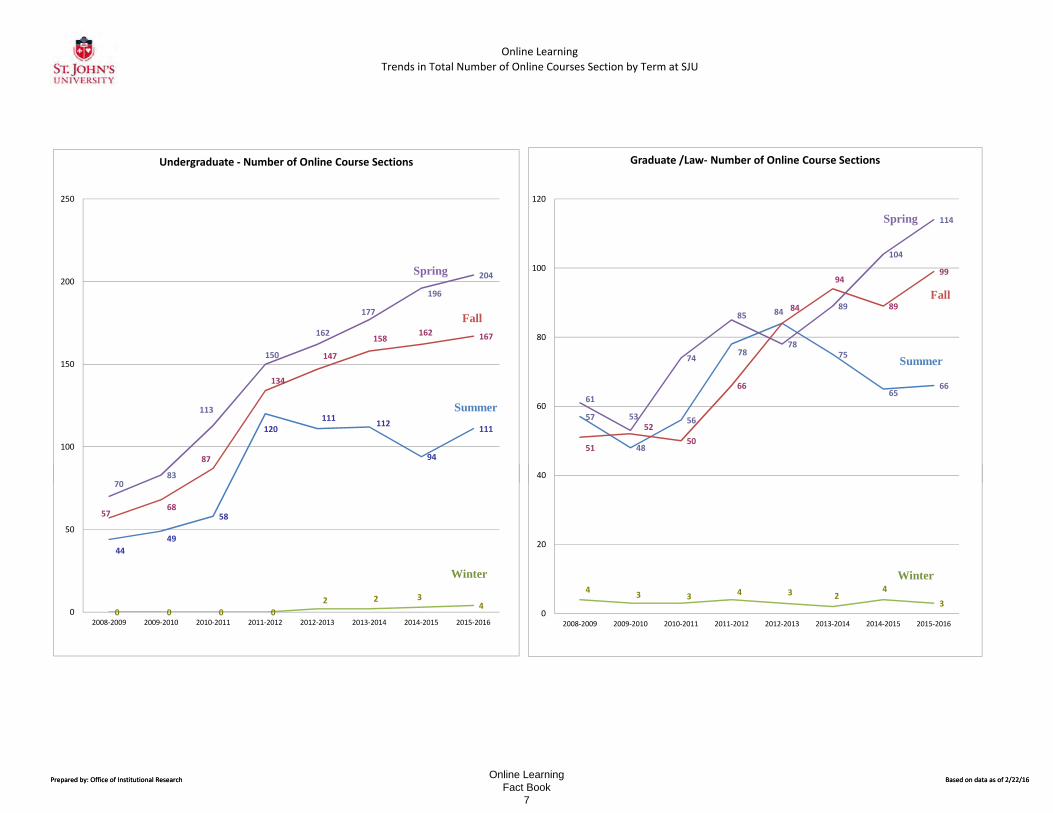
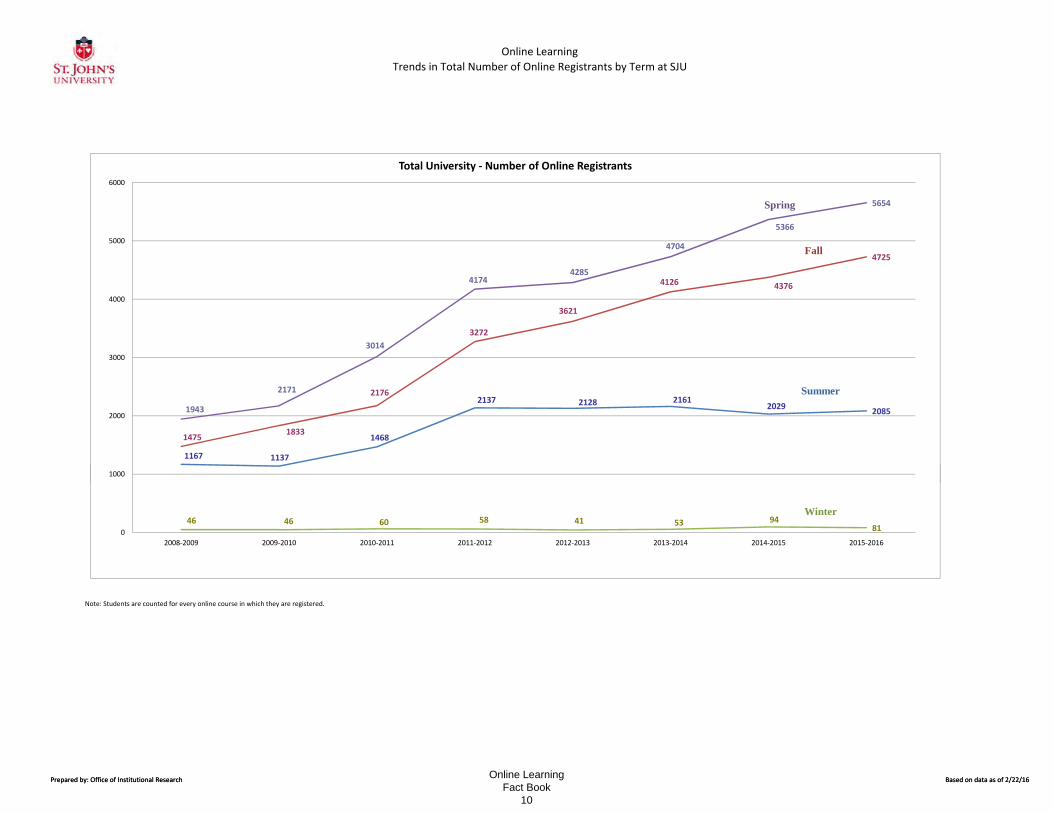
Online Learning
Trends in Total Number of Online Courses Section by Term at SJU
120111 112
94
111
87
134
147
158162 167
7083
113
150
162
177
196
204
100
150
200
250
Undergraduate ‐ Number of Online Course Sections
Summer
Spring
Fall
57
48
56
78
84
75
6566
51
5250
66
84
94
89
99
61
53
74
85
78
89
104
114
40
60
80
100
120
Graduate /Law‐ Number of Online Course Sections
Spring
Fall
Summer
Prepared by: Office of Institutional Research Based on data as of 2/22/16
4449
585768
0 0 0 02 2 3
4
7083
0
50
2008‐2009 2009‐2010 2010‐2011 2011‐2012 2012‐2013 2013‐2014 2014‐2015 2015‐2016
Winter4 3 3 4 3 2
4
30
20
40
2008‐2009 2009‐2010 2010‐2011 2011‐2012 2012‐2013 2013‐2014 2014‐2015 2015‐2016
Winter
Prepared by: Office of Institutional Research Based on data as of 2/22/16Online Learning
Fact Book 7
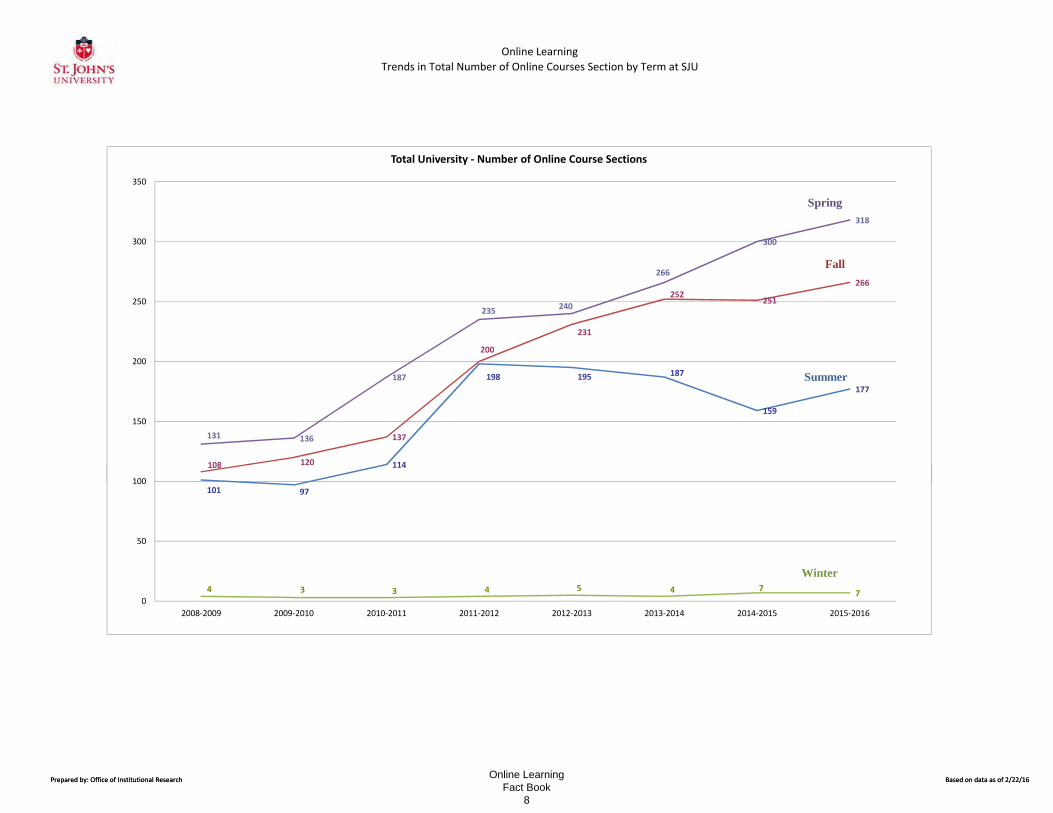
Online Learning
Trends in Total Number of Online Courses Section by Term at SJU
114
198 195 187
159
177
108 120
137
200
231
252251
266
131 136
187
235 240
266
300
318
100
150
200
250
300
350
Total University ‐ Number of Online Course Sections
Spring
Fall
Summer
Prepared by: Office of Institutional Research Based on data as of 2/22/16
101 97
114108 120
4 3 3 4 5 4 7 70
50
100
2008‐2009 2009‐2010 2010‐2011 2011‐2012 2012‐2013 2013‐2014 2014‐2015 2015‐2016
Winter
Prepared by: Office of Institutional Research Based on data as of 2/22/16Online Learning
Fact Book 8
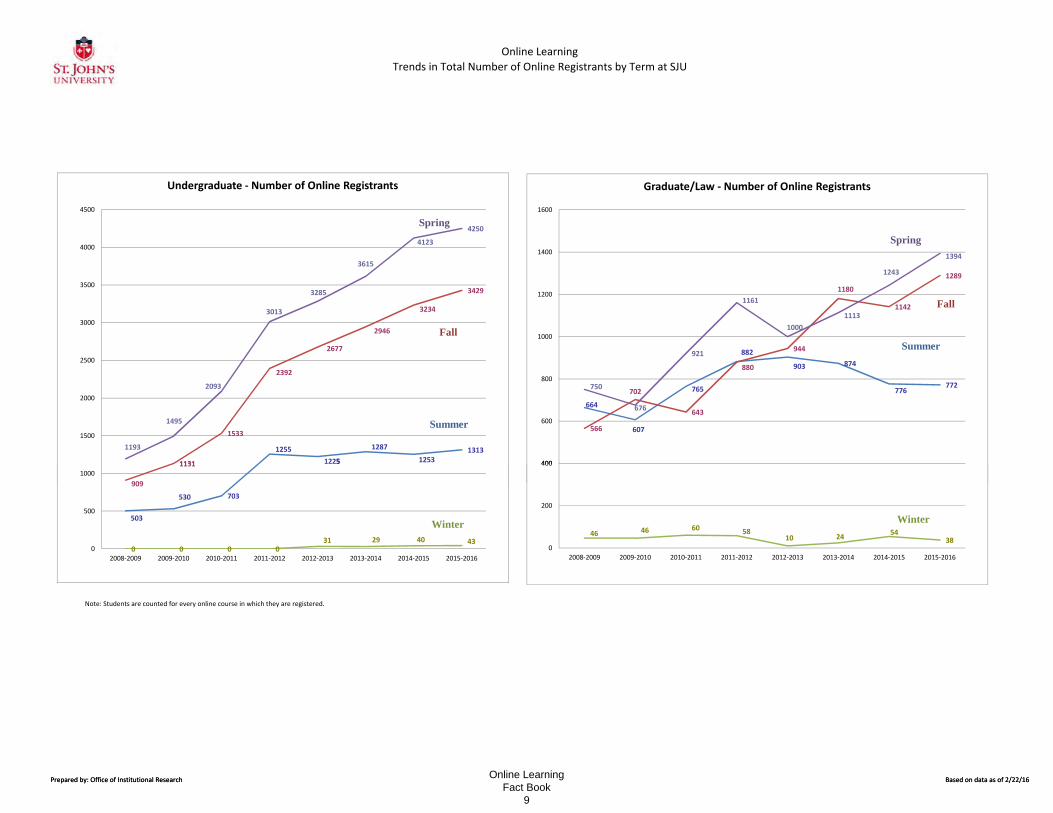
Online Learning
Trends in Total Number of Online Registrants by Term at SJU
12551225
1287
12531313
909
1131
1533
2392
2677
2946
3234
3429
1193
1495
2093
3013
3285
3615
4123
4250
1000
1500
2000
2500
3000
3500
4000
4500
Undergraduate ‐ Number of Online Registrants
Fall
Summer
Spring
664
607
765
882
903 874
776772
566
702
643
880
944
1180
1142
1289
750
676
921
1161
10001113
1243
1394
400
600
800
1000
1200
1400
1600
Graduate/Law ‐ Number of Online Registrants
Fall
Spring
Summer
Prepared by: Office of Institutional Research Based on data as of 2/22/16
Note: Students are counted for every online course in which they are registered.
503
530 703
5
909
1131
0 0 0 031 29 40 43
0
500
1000
2008‐2009 2009‐2010 2010‐2011 2011‐2012 2012‐2013 2013‐2014 2014‐2015 2015‐2016
Winter46 46 60 58
10 24 5438
0
200
400
2008‐2009 2009‐2010 2010‐2011 2011‐2012 2012‐2013 2013‐2014 2014‐2015 2015‐2016
Winter
Prepared by: Office of Institutional Research Based on data as of 2/22/16Online Learning
Fact Book 9
Online Learning
Trends in Total Number of Online Registrants by Term at SJU
1167 1137
1468
2137 2128 21612029 2085
1475 1833
2176
3272
3621
4126 4376
4725
1943
2171
3014
41744285
4704
5366
5654
1000
2000
3000
4000
5000
6000
Total University ‐ Number of Online Registrants
Fall
Summer
Spring
Prepared by: Office of Institutional Research Based on data as of 2/22/16
Note: Students are counted for every online course in which they are registered.
46 46 60 58 41 53 94810
1000
2008‐2009 2009‐2010 2010‐2011 2011‐2012 2012‐2013 2013‐2014 2014‐2015 2015‐2016
Winter
Prepared by: Office of Institutional Research Based on data as of 2/22/16Online Learning
Fact Book 10
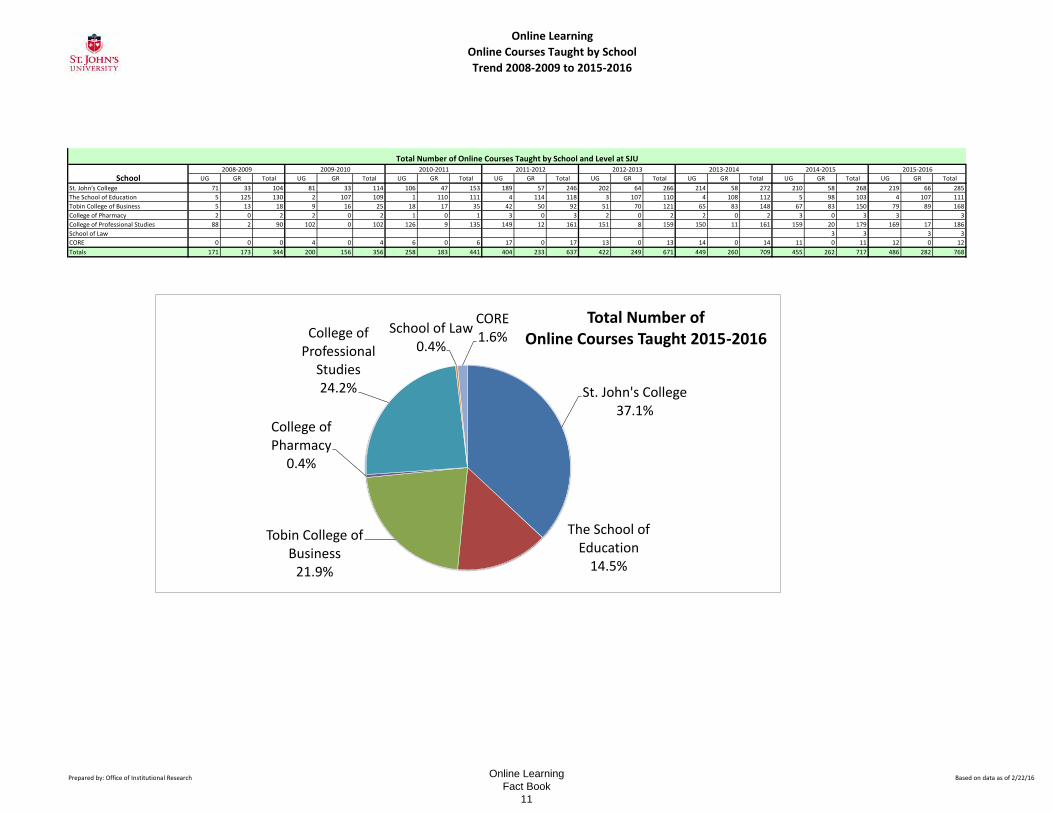
Online Learning
Online Courses Taught by School
Trend 2008-2009 to 2015-2016
UG GR Total UG GR Total UG GR Total UG GR Total UG GR Total UG GR Total UG GR Total UG GR Total
St. John's College 71 33 104 81 33 114 106 47 153 189 57 246 202 64 266 214 58 272 210 58 268 219 66 285
The School of Education 5 125 130 2 107 109 1 110 111 4 114 118 3 107 110 4 108 112 5 98 103 4 107 111
Tobin College of Business 5 13 18 9 16 25 18 17 35 42 50 92 51 70 121 65 83 148 67 83 150 79 89 168
College of Pharmacy 2 0 2 2 0 2 1 0 1 3 0 3 2 0 2 2 0 2 3 0 3 3 3
College of Professional Studies 88 2 90 102 0 102 126 9 135 149 12 161 151 8 159 150 11 161 159 20 179 169 17 186
School of Law 3 3 3 3
CORE 0 0 0 4 0 4 6 0 6 17 0 17 13 0 13 14 0 14 11 0 11 12 0 12
Totals 171 173 344 200 156 356 258 183 441 404 233 637 422 249 671 449 260 709 455 262 717 486 282 768
Total Number of Online Courses Taught by School and Level at SJU2015-20162014-20152012-2013 2013-2014
School2008-2009 2009-2010 2010-2011 2011-2012
St. John's College 37.1%
The School of Education
14.5%
Tobin College of Business
21.9%
College of Pharmacy
0.4%
College of Professional
Studies 24.2%
School of Law 0.4%
CORE 1.6%
Total Number of Online Courses Taught 2015-2016
Prepared by: Office of Institutional Research Based on data as of 2/22/16 Online Learning Fact Book
11
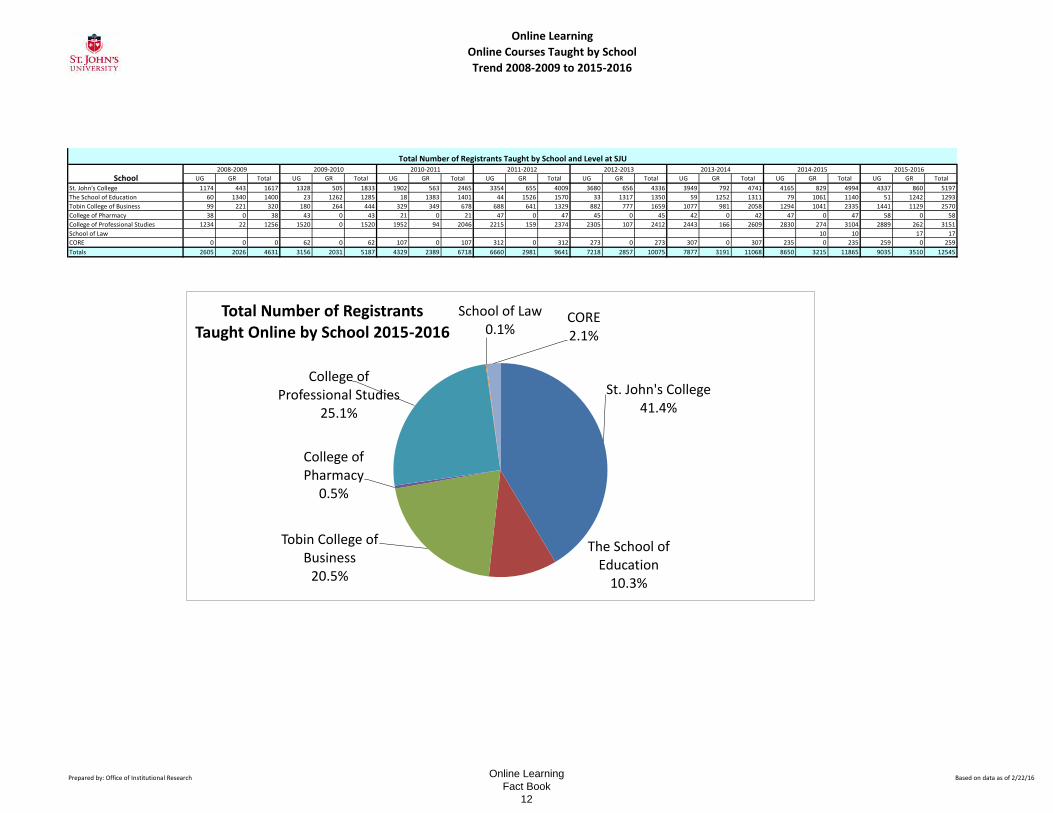
Online Learning
Online Courses Taught by School
Trend 2008-2009 to 2015-2016
UG GR Total UG GR Total UG GR Total UG GR Total UG GR Total UG GR Total UG GR Total UG GR Total
St. John's College 1174 443 1617 1328 505 1833 1902 563 2465 3354 655 4009 3680 656 4336 3949 792 4741 4165 829 4994 4337 860 5197
The School of Education 60 1340 1400 23 1262 1285 18 1383 1401 44 1526 1570 33 1317 1350 59 1252 1311 79 1061 1140 51 1242 1293
Tobin College of Business 99 221 320 180 264 444 329 349 678 688 641 1329 882 777 1659 1077 981 2058 1294 1041 2335 1441 1129 2570
College of Pharmacy 38 0 38 43 0 43 21 0 21 47 0 47 45 0 45 42 0 42 47 0 47 58 0 58
College of Professional Studies 1234 22 1256 1520 0 1520 1952 94 2046 2215 159 2374 2305 107 2412 2443 166 2609 2830 274 3104 2889 262 3151
School of Law 10 10 17 17
CORE 0 0 0 62 0 62 107 0 107 312 0 312 273 0 273 307 0 307 235 0 235 259 0 259
Totals 2605 2026 4631 3156 2031 5187 4329 2389 6718 6660 2981 9641 7218 2857 10075 7877 3191 11068 8650 3215 11865 9035 3510 12545
2015-2016
Total Number of Registrants Taught by School and Level at SJU
School2008-2009 2009-2010 2010-2011 2011-2012 2012-2013 2013-2014 2014-2015
St. John's College 41.4%
The School of Education
10.3%
Tobin College of Business
20.5%
College of Pharmacy
0.5%
College of Professional Studies
25.1%
School of Law 0.1%
CORE 2.1%
Total Number of Registrants Taught Online by School 2015-2016
Prepared by: Office of Institutional Research Based on data as of 2/22/16 Online Learning Fact Book
12
Online Learning
Number of Online Instructors
2008-2009 to 2015-2016
Year Number Year New Cumulative
2008-2009 134 Prior to 2008 200 200
2009-2010 137 2008-2009 73 273
2010-2011 177 2009-2010 47 320
2011-2012 258 2010-2011 126 446
2012-2013 268 2011-2012 79 525
2013-2014 286 2012-2013 70 595
2014-2015 289 2013-2014 54 649
2015-2016 310 2014-2015 50 699
2015-2016 113 812
NA/Waived 29 841
841
Note: This data includes individuals who have since left the University.
Note: Cumulative includes waived instructors.
Unduplicated Headcount of Online Instructors by Academic Year Instructors who have Completed the Online Instructor Training Program
Total
200
273 320
446
525
595
649 699
812
0
100
200
300
400
500
600
700
800
900
Online Instructor Training
134
137 177
258 268
286
289
310
0
50
100
150
200
250
300
350
Unduplicated Headcount of Online Instructors by Academic Year
Prepared by: Office of Institutional Research
Source of Instructor Training: Online Learning Services (OLS) Based on data as of 2/22/16Online Learning Fact Book
13
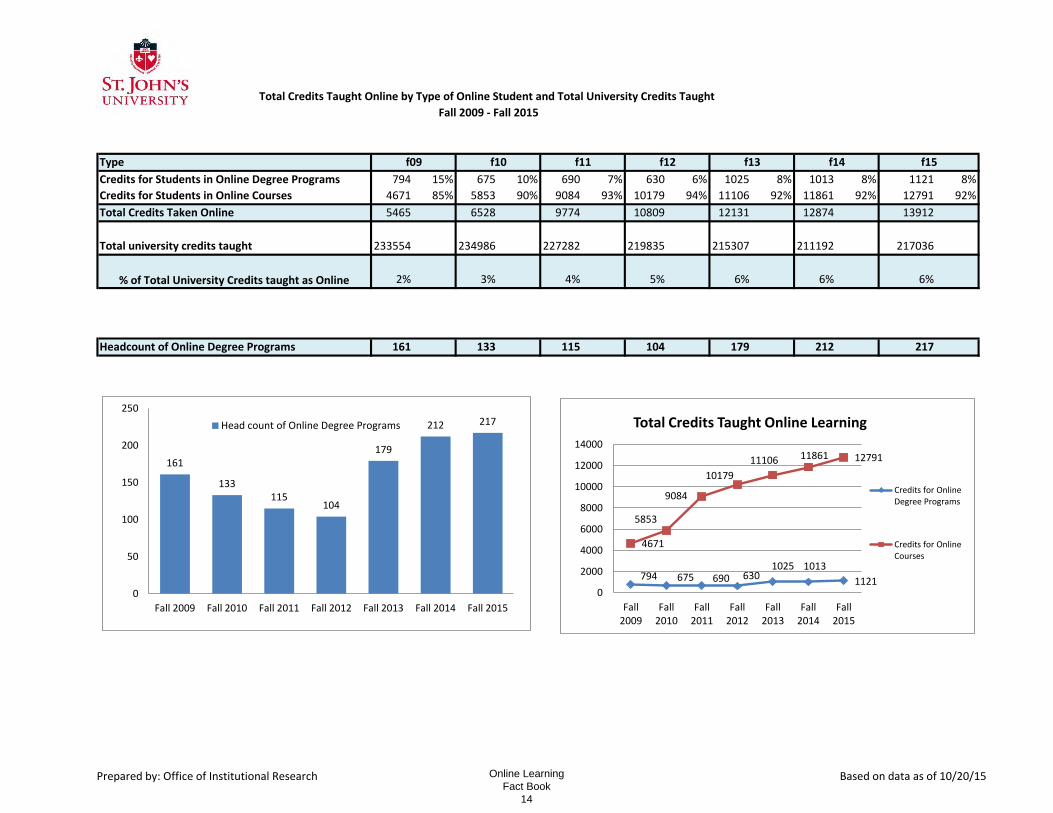
Type
Credits for Students in Online Degree Programs 794 15% 675 10% 690 7% 630 6% 1025 8% 1013 8% 1121 8%
Credits for Students in Online Courses 4671 85% 5853 90% 9084 93% 10179 94% 11106 92% 11861 92% 12791 92%
Total Credits Taken Online 5465 6528 9774 10809 12131 12874 13912
Total university credits taught 233554 234986 227282 219835 215307 211192 217036
2% 3% 4% 5% 6% 6% 6%
Headcount of Online Degree Programs 161 133 115 104 179 212 217
% of Total University Credits taught as Online
f09 f10 f11 f12 f13 f15f14
Total Credits Taught Online by Type of Online Student and Total University Credits Taught
Fall 2009 - Fall 2015
161
133 115
104
179
212 217
0
50
100
150
200
250
Fall 2009 Fall 2010 Fall 2011 Fall 2012 Fall 2013 Fall 2014 Fall 2015
Head count of Online Degree Programs
794 675 690 630 1025 1013
1121
4671
5853
9084
10179
11106 11861 12791
0
2000
4000
6000
8000
10000
12000
14000
Fall 2009
Fall 2010
Fall 2011
Fall 2012
Fall 2013
Fall 2014
Fall 2015
Total Credits Taught Online Learning
Credits for Online Degree Programs
Credits for Online Courses
Prepared by: Office of Institutional Research Based on data as of 10/20/15Online Learning Fact Book
14
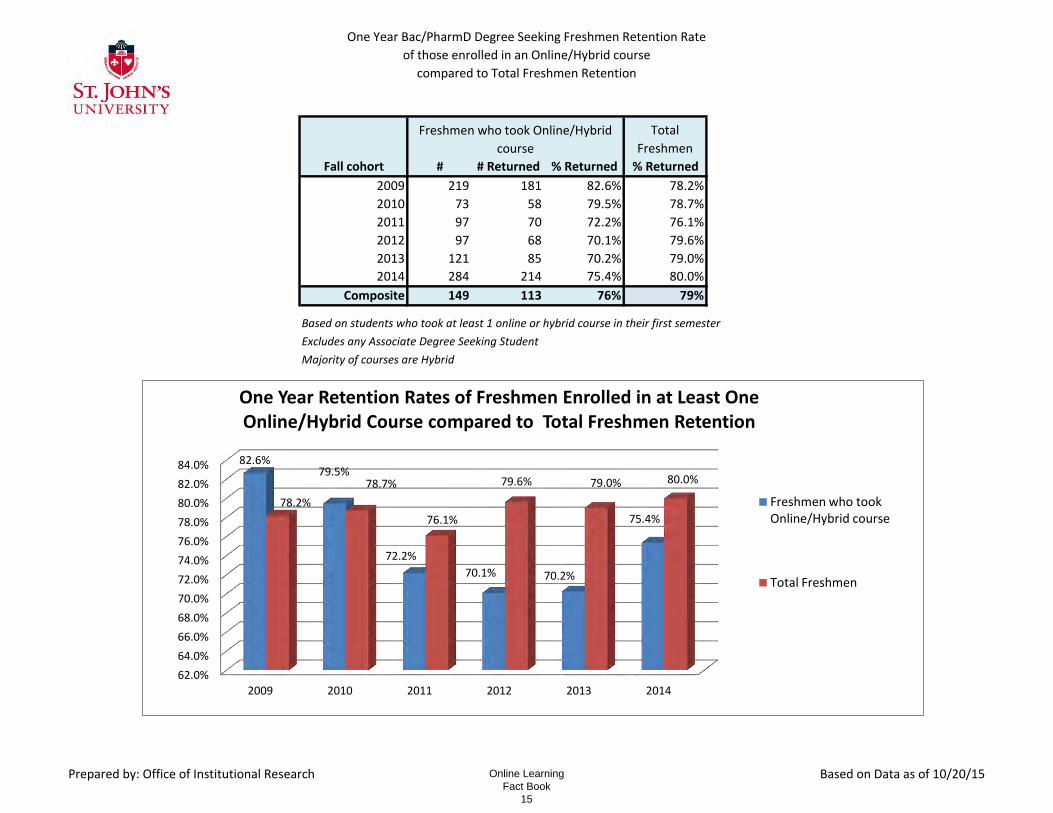
One Year Bac/PharmD Degree Seeking Freshmen Retention Rate
of those enrolled in an Online/Hybrid course
compared to Total Freshmen Retention
Total
Freshmen
Fall cohort # # Returned % Returned % Returned
2009 219 181 82.6% 78.2%
2010 73 58 79.5% 78.7%
2011 97 70 72.2% 76.1%
2012 97 68 70.1% 79.6%
2013 121 85 70.2% 79.0%
2014 284 214 75.4% 80.0%
Composite 149 113 76% 79%
Based on students who took at least 1 online or hybrid course in their first semester
Excludes any Associate Degree Seeking Student
Majority of courses are Hybrid
Freshmen who took Online/Hybrid
course
62.0%
64.0%
66.0%
68.0%
70.0%
72.0%
74.0%
76.0%
78.0%
80.0%
82.0%
84.0%
2009 2010 2011 2012 2013 2014
82.6% 79.5%
72.2%
70.1% 70.2%
75.4%
78.2%
78.7%
76.1%
79.6% 79.0% 80.0%
One Year Retention Rates of Freshmen Enrolled in at Least One Online/Hybrid Course compared to Total Freshmen Retention
Freshmen who took Online/Hybrid course
Total Freshmen
Prepared by: Office of Institutional Research Based on Data as of 10/20/15Online Learning Fact Book
15
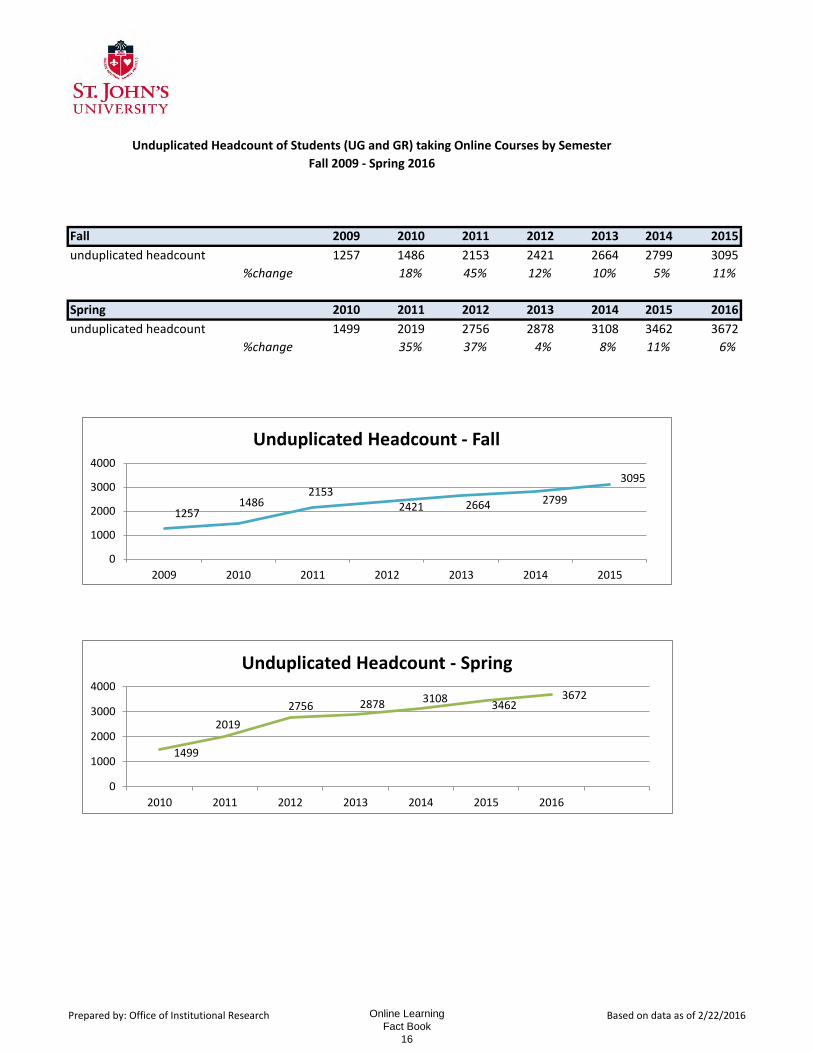
Fall 2009 2010 2011 2012 2013 2014 2015
unduplicated headcount 1257 1486 2153 2421 2664 2799 3095
%change 18% 45% 12% 10% 5% 11%
Spring 2010 2011 2012 2013 2014 2015 2016
unduplicated headcount 1499 2019 2756 2878 3108 3462 3672
%change 35% 37% 4% 8% 11% 6%
Unduplicated Headcount of Students (UG and GR) taking Online Courses by Semester
Fall 2009 - Spring 2016
1257 1486
2153 2421 2664 2799
3095
0
1000
2000
3000
4000
2009 2010 2011 2012 2013 2014 2015
Unduplicated Headcount - Fall
1499
2019
2756 2878 3108 3462
3672
0
1000
2000
3000
4000
2010 2011 2012 2013 2014 2015 2016
Unduplicated Headcount - Spring
Prepared by: Office of Institutional Research Based on data as of 2/22/2016Online Learning Fact Book
16
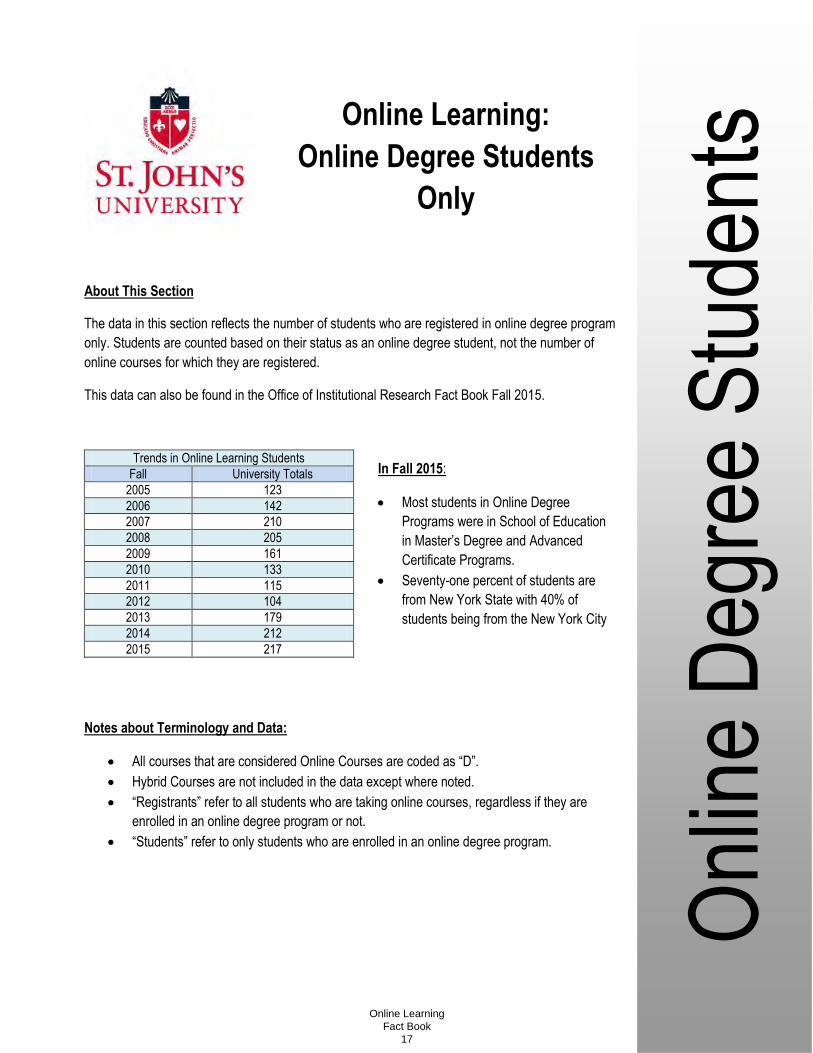
About This Section
The data in this section reflects the number of students who are registered in online degree program
only. Students are counted based on their status as an online degree student, not the number of
online courses for which they are registered.
This data can also be found in the Office of Institutional Research Fact Book Fall 2015.
Trends in Online Learning Students
Fall University Totals
2005 123
2006 142
2007 210
2008 205
2009 161
2010 133
2011 115
2012 104
2013 179
2014 212
2015 217
Notes about Terminology and Data:
All courses that are considered Online Courses are coded as “D”.
Hybrid Courses are not included in the data except where noted.
“Registrants” refer to all students who are taking online courses, regardless if they are
enrolled in an online degree program or not.
“Students” refer to only students who are enrolled in an online degree program.
Onl
ine
Deg
ree
Stu
dent
s Online Learning:
Online Degree Students
Only
In Fall 2015:
Most students in Online Degree
Programs were in School of Education
in Master’s Degree and Advanced
Certificate Programs.
Seventy-one percent of students are
from New York State with 40% of
students being from the New York City
rea.
Online Learning Fact Book
17
Online Learning - Fall 2015
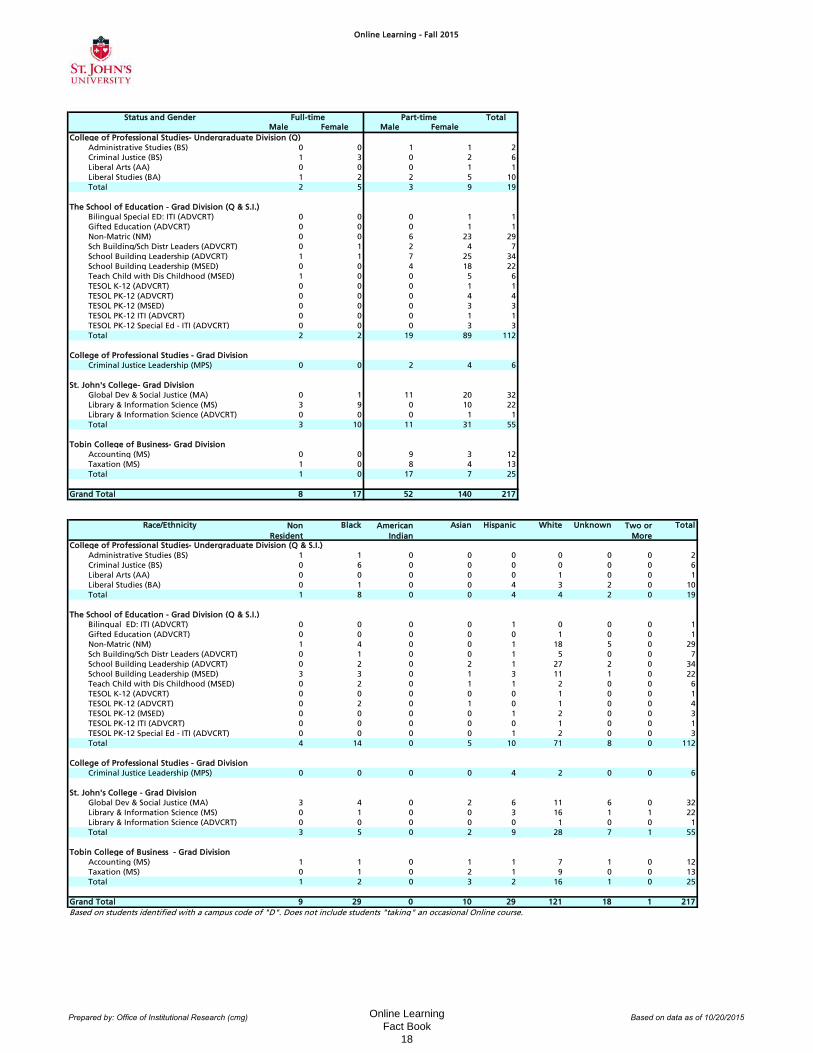
Total
Male Female Male Female
College of Professional Studies- Undergraduate Division (Q)
Administrative Studies (BS) 0 0 1 1 2
Criminal Justice (BS) 1 3 0 2 6
Liberal Arts (AA) 0 0 0 1 1
Liberal Studies (BA) 1 2 2 5 10
Total 2 5 3 9 19
The School of Education - Grad Division (Q & S.I.)
Bilingual Special ED: ITI (ADVCRT) 0 0 0 1 1
Gifted Education (ADVCRT) 0 0 0 1 1
Non-Matric (NM) 0 0 6 23 29
Sch Building/Sch Distr Leaders (ADVCRT) 0 1 2 4 7
School Building Leadership (ADVCRT) 1 1 7 25 34
School Building Leadership (MSED) 0 0 4 18 22
Teach Child with Dis Childhood (MSED) 1 0 0 5 6
TESOL K-12 (ADVCRT) 0 0 0 1 1
TESOL PK-12 (ADVCRT) 0 0 0 4 4
TESOL PK-12 (MSED) 0 0 0 3 3
TESOL PK-12 ITI (ADVCRT) 0 0 0 1 1
TESOL PK-12 Special Ed - ITI (ADVCRT) 0 0 0 3 3
Total 2 2 19 89 112
College of Professional Studies - Grad Division
Criminal Justice Leadership (MPS) 0 0 2 4 6
St. John's College- Grad Division
Global Dev & Social Justice (MA) 0 1 11 20 32
Library & Information Science (MS) 3 9 0 10 22
Library & Information Science (ADVCRT) 0 0 0 1 1
Total 3 10 11 31 55
Tobin College of Business- Grad Division
Accounting (MS) 0 0 9 3 12
Taxation (MS) 1 0 8 4 13
Total 1 0 17 7 25
Grand Total 8 17 52 140 217
Black Asian Hispanic White Unknown Total
College of Professional Studies- Undergraduate Division (Q & S.I.)
Administrative Studies (BS) 1 1 0 0 0 0 0 0 2
Criminal Justice (BS) 0 6 0 0 0 0 0 0 6
Liberal Arts (AA) 0 0 0 0 0 1 0 0 1
Liberal Studies (BA) 0 1 0 0 4 3 2 0 10
Total 1 8 0 0 4 4 2 0 19
The School of Education - Grad Division (Q & S.I.)
Bilingual ED: ITI (ADVCRT) 0 0 0 0 1 0 0 0 1
Gifted Education (ADVCRT) 0 0 0 0 0 1 0 0 1
Non-Matric (NM) 1 4 0 0 1 18 5 0 29
Sch Building/Sch Distr Leaders (ADVCRT) 0 1 0 0 1 5 0 0 7
School Building Leadership (ADVCRT) 0 2 0 2 1 27 2 0 34
School Building Leadership (MSED) 3 3 0 1 3 11 1 0 22
Teach Child with Dis Childhood (MSED) 0 2 0 1 1 2 0 0 6
TESOL K-12 (ADVCRT) 0 0 0 0 0 1 0 0 1
TESOL PK-12 (ADVCRT) 0 2 0 1 0 1 0 0 4
TESOL PK-12 (MSED) 0 0 0 0 1 2 0 0 3
TESOL PK-12 ITI (ADVCRT) 0 0 0 0 0 1 0 0 1
TESOL PK-12 Special Ed - ITI (ADVCRT) 0 0 0 0 1 2 0 0 3
Total 4 14 0 5 10 71 8 0 112
College of Professional Studies - Grad Division
Criminal Justice Leadership (MPS) 0 0 0 0 4 2 0 0 6
St. John's College - Grad Division
Global Dev & Social Justice (MA) 3 4 0 2 6 11 6 0 32
Library & Information Science (MS) 0 1 0 0 3 16 1 1 22
Library & Information Science (ADVCRT) 0 0 0 0 0 1 0 0 1
Total 3 5 0 2 9 28 7 1 55
Tobin College of Business - Grad Division
Accounting (MS) 1 1 0 1 1 7 1 0 12
Taxation (MS) 0 1 0 2 1 9 0 0 13
Total 1 2 0 3 2 16 1 0 25
Grand Total 9 29 0 10 29 121 18 1 217
Based on students identified with a campus code of "D". Does not include students "taking" an occasional Online course.
Two or
More
Status and Gender Full-time Part-time
Race/Ethnicity Non
Resident
American
Indian
Prepared by: Office of Institutional Research (cmg) Based on data as of 10/20/2015Online Learning Fact Book
18
Online Learning - Fall 2015
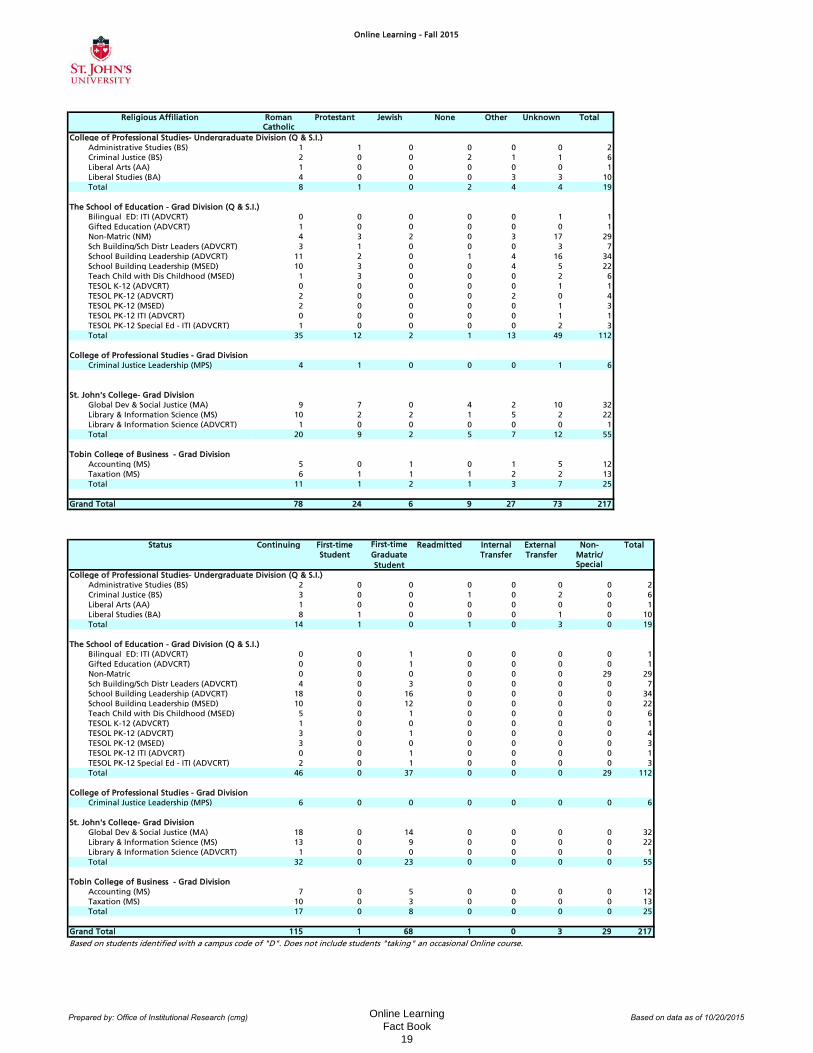
Roman Protestant Jewish None Other Unknown Total
Catholic
College of Professional Studies- Undergraduate Division (Q & S.I.)
Administrative Studies (BS) 1 1 0 0 0 0 2
Criminal Justice (BS) 2 0 0 2 1 1 6
Liberal Arts (AA) 1 0 0 0 0 0 1
Liberal Studies (BA) 4 0 0 0 3 3 10
Total 8 1 0 2 4 4 19
The School of Education - Grad Division (Q & S.I.)
Bilingual ED: ITI (ADVCRT) 0 0 0 0 0 1 1
Gifted Education (ADVCRT) 1 0 0 0 0 0 1
Non-Matric (NM) 4 3 2 0 3 17 29
Sch Building/Sch Distr Leaders (ADVCRT) 3 1 0 0 0 3 7
School Building Leadership (ADVCRT) 11 2 0 1 4 16 34
School Building Leadership (MSED) 10 3 0 0 4 5 22
Teach Child with Dis Childhood (MSED) 1 3 0 0 0 2 6
TESOL K-12 (ADVCRT) 0 0 0 0 0 1 1
TESOL PK-12 (ADVCRT) 2 0 0 0 2 0 4
TESOL PK-12 (MSED) 2 0 0 0 0 1 3
TESOL PK-12 ITI (ADVCRT) 0 0 0 0 0 1 1
TESOL PK-12 Special Ed - ITI (ADVCRT) 1 0 0 0 0 2 3
Total 35 12 2 1 13 49 112
College of Professional Studies - Grad Division
Criminal Justice Leadership (MPS) 4 1 0 0 0 1 6
St. John's College- Grad Division
Global Dev & Social Justice (MA) 9 7 0 4 2 10 32
Library & Information Science (MS) 10 2 2 1 5 2 22
Library & Information Science (ADVCRT) 1 0 0 0 0 0 1
Total 20 9 2 5 7 12 55
Tobin College of Business - Grad Division
Accounting (MS) 5 0 1 0 1 5 12
Taxation (MS) 6 1 1 1 2 2 13
Total 11 1 2 1 3 7 25
Grand Total 78 24 6 9 27 73 217
Continuing First-time Readmitted Internal External Non- Total
Student Transfer Transfer Matric/Special
College of Professional Studies- Undergraduate Division (Q & S.I.)
Administrative Studies (BS) 2 0 0 0 0 0 0 2
Criminal Justice (BS) 3 0 0 1 0 2 0 6
Liberal Arts (AA) 1 0 0 0 0 0 0 1
Liberal Studies (BA) 8 1 0 0 0 1 0 10
Total 14 1 0 1 0 3 0 19
The School of Education - Grad Division (Q & S.I.)
Bilingual ED: ITI (ADVCRT) 0 0 1 0 0 0 0 1
Gifted Education (ADVCRT) 0 0 1 0 0 0 0 1
Non-Matric 0 0 0 0 0 0 29 29
Sch Building/Sch Distr Leaders (ADVCRT) 4 0 3 0 0 0 0 7
School Building Leadership (ADVCRT) 18 0 16 0 0 0 0 34
School Building Leadership (MSED) 10 0 12 0 0 0 0 22
Teach Child with Dis Childhood (MSED) 5 0 1 0 0 0 0 6
TESOL K-12 (ADVCRT) 1 0 0 0 0 0 0 1
TESOL PK-12 (ADVCRT) 3 0 1 0 0 0 0 4
TESOL PK-12 (MSED) 3 0 0 0 0 0 0 3
TESOL PK-12 ITI (ADVCRT) 0 0 1 0 0 0 0 1
TESOL PK-12 Special Ed - ITI (ADVCRT) 2 0 1 0 0 0 0 3
Total 46 0 37 0 0 0 29 112
College of Professional Studies - Grad Division
Criminal Justice Leadership (MPS) 6 0 0 0 0 0 0 6
St. John's College- Grad Division
Global Dev & Social Justice (MA) 18 0 14 0 0 0 0 32
Library & Information Science (MS) 13 0 9 0 0 0 0 22
Library & Information Science (ADVCRT) 1 0 0 0 0 0 0 1
Total 32 0 23 0 0 0 0 55
Tobin College of Business - Grad Division
Accounting (MS) 7 0 5 0 0 0 0 12
Taxation (MS) 10 0 3 0 0 0 0 13
Total 17 0 8 0 0 0 0 25
Grand Total 115 1 68 1 0 3 29 217
Based on students identified with a campus code of "D". Does not include students "taking" an occasional Online course.
Religious Affiliation
Status First-time
Graduate
Student
Prepared by: Office of Institutional Research (cmg) Based on data as of 10/20/2015Online Learning Fact Book
19
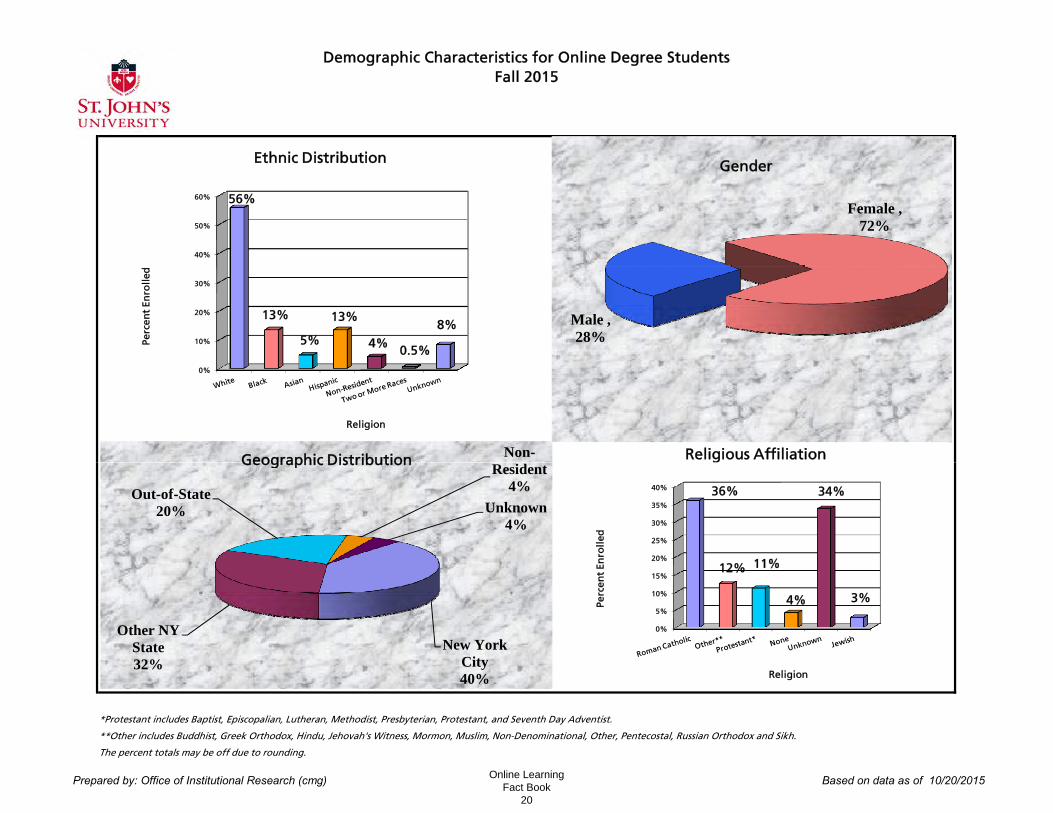
Demographic Characteristics for Online Degree StudentsFall 2015
Male , 28%
Female , 72%
Gender
Religious AffiliationNon-Geographic Distribution
0%
10%
20%
30%
40%
50%
60% 56%
13%
5%
13%
4% 0.5%
8%
Perc
ent
Enro
lled
Religion
Ethnic Distribution
*Protestant includes Baptist, Episcopalian, Lutheran, Methodist, Presbyterian, Protestant, and Seventh Day Adventist.
**Other includes Buddhist, Greek Orthodox, Hindu, Jehovah's Witness, Mormon, Muslim, Non-Denominational, Other, Pentecostal, Russian Orthodox and Sikh.
The percent totals may be off due to rounding.
0%
5%
10%
15%
20%
25%
30%
35%
40% 36%
12% 11%
4%
34%
3%Perc
ent
Enro
lled
Religion
New York City40%
Other NY State32%
Out-of-State20%
Resident4%
Unknown4%
Geographic Distribution
Prepared by: Office of Institutional Research (cmg) Based on data as of 10/20/2015Online Learning Fact Book
20
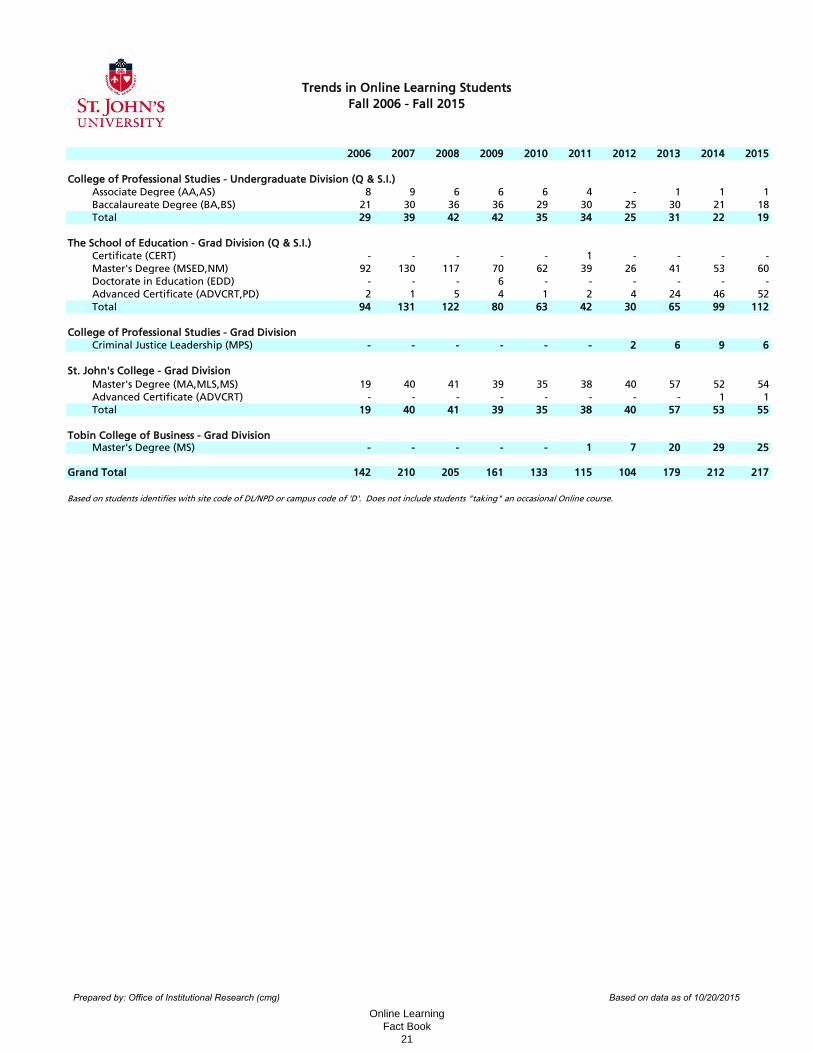
Trends in Online Learning Students
Fall 2006 - Fall 2015
2006 2007 2008 2009 2010 2011 2012 2013 2014 2015
College of Professional Studies - Undergraduate Division (Q & S.I.)
Associate Degree (AA,AS) 8 9 6 6 6 4 - 1 1 1
Baccalaureate Degree (BA,BS) 21 30 36 36 29 30 25 30 21 18
Total 29 39 42 42 35 34 25 31 22 19
The School of Education - Grad Division (Q & S.I.)
Certificate (CERT) - - - - - 1 - - - -
Master's Degree (MSED,NM) 92 130 117 70 62 39 26 41 53 60
Doctorate in Education (EDD) - - - 6 - - - - - -
Advanced Certificate (ADVCRT,PD) 2 1 5 4 1 2 4 24 46 52
Total 94 131 122 80 63 42 30 65 99 112
College of Professional Studies - Grad Division
Criminal Justice Leadership (MPS) - - - - - - 2 6 9 6
St. John's College - Grad Division
Master's Degree (MA,MLS,MS) 19 40 41 39 35 38 40 57 52 54
Advanced Certificate (ADVCRT) - - - - - - - - 1 1
Total 19 40 41 39 35 38 40 57 53 55
Tobin College of Business - Grad DivisionMaster's Degree (MS) - - - - - 1 7 20 29 25
Grand Total 142 210 205 161 133 115 104 179 212 217
Based on students identifies with site code of DL/NPD or campus code of 'D'. Does not include students "taking" an occasional Online course.
Prepared by: Office of Institutional Research (cmg) Based on data as of 10/20/2015
Online Learning Fact Book
21
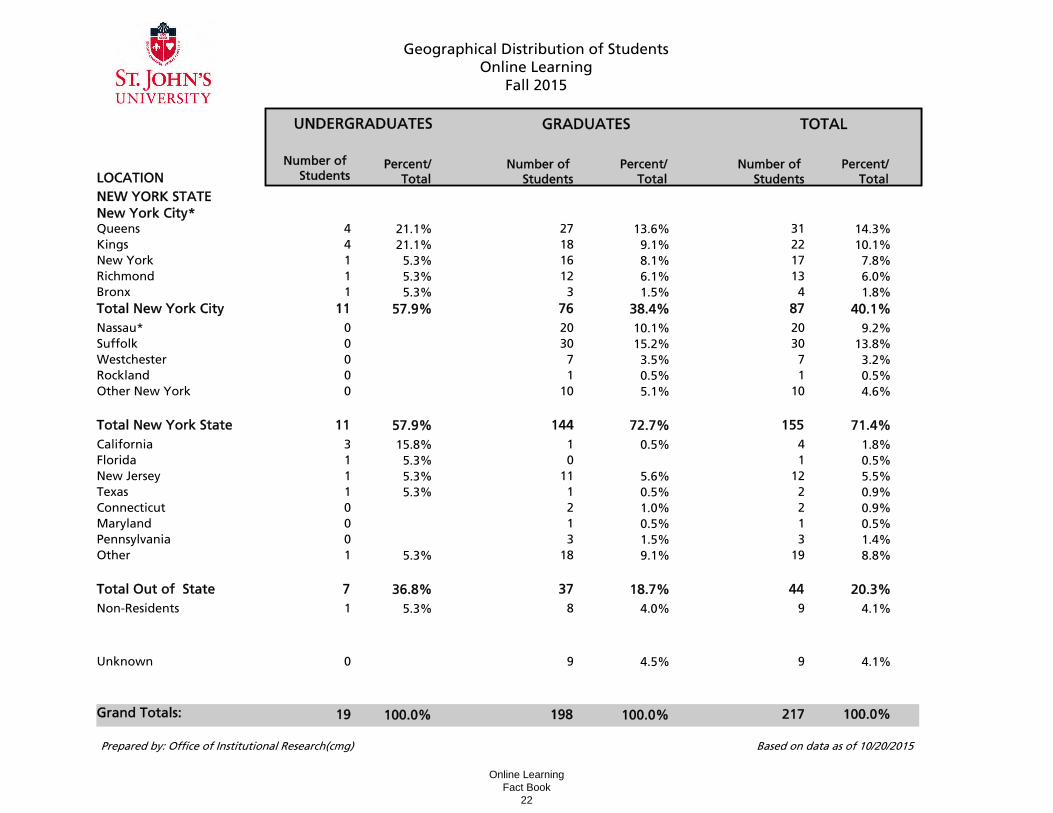
GRADUATES
Geographical Distribution of StudentsOnline Learning
Fall 2015
UNDERGRADUATES
Percent/Total
Number of Students
NEW YORK STATENew York City*
Number of StudentsLOCATION
Number of Students
TOTAL
Percent/Total
Percent/Total
Queens 4 27 3121.1% 13.6% 14.3%Kings 4 18 2221.1% 9.1% 10.1%New York 1 16 175.3% 8.1% 7.8%Richmond 1 12 135.3% 6.1% 6.0%Bronx 1 3 45.3% 1.5% 1.8%
11 76Total New York City 57.9% 38.4% 87 40.1%Nassau* 0 20 200.0% 10.1% 9.2%Suffolk 0 30 300.0% 15.2% 13.8%Westchester 0 7 70.0% 3.5% 3.2%Rockland 0 1 10.0% 0.5% 0.5%Other New York 0 10 100.0% 5.1% 4.6%
0.0% 0.0% 0.0%11 14457.9% 72.7%Total New York State 155 71.4%
California 3 1 415.8% 0.5% 1.8%Florida 1 0 15.3% 0.0% 0.5%New Jersey 1 11 125.3% 5.6% 5.5%Texas 1 1 25.3% 0.5% 0.9%Connecticut 0 2 20.0% 1.0% 0.9%Maryland 0 1 10.0% 0.5% 0.5%Pennsylvania 0 3 30.0% 1.5% 1.4%Other 1 18 195.3% 9.1% 8.8%
0.0% 0.0% 0.0%7 3736.8% 18.7%Total Out of State 44 20.3%
Non-Residents 1 8 95.3% 4.0% 4.1%0.0% 0.0% 0.0%0.0% 0.0% 0.0%
Unknown 0 9 90.0% 4.5% 4.1%0.0% 0.0% 0.0%0.0% 0.0% 0.0%
100.0%100.0% 19819Grand Totals: 217 100.0%
Prepared by: Office of Institutional Research(cmg) Based on data as of 10/20/2015
Online Learning Fact Book
22
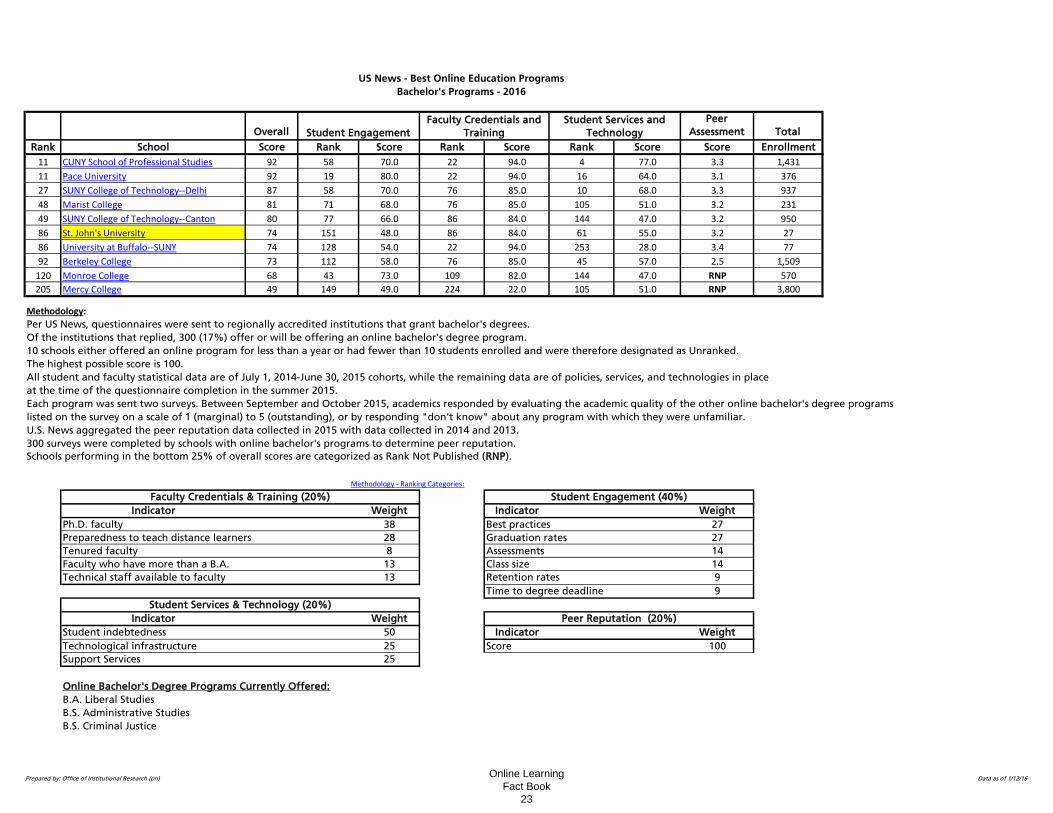
Overall
Peer
Assessment Total
Rank School Score Rank Score Rank Score Rank Score Score Enrollment
11 CUNY School of Professional Studies 92 58 70.0 22 94.0 4 77.0 3.3 1,431
11 Pace University 92 19 80.0 22 94.0 16 64.0 3.1 376
27 SUNY College of Technology--Delhi 87 58 70.0 76 85.0 10 68.0 3.3 937
48 Marist College 81 71 68.0 76 85.0 105 51.0 3.2 231
49 SUNY College of Technology--Canton 80 77 66.0 86 84.0 144 47.0 3.2 950
86 St. John's University 74 151 48.0 86 84.0 61 55.0 3.2 27
86 University at Buffalo--SUNY 74 128 54.0 22 94.0 253 28.0 3.4 77
92 Berkeley College 73 112 58.0 76 85.0 45 57.0 2.5 1,509
120 Monroe College 68 43 73.0 109 82.0 144 47.0 RNP 570
205 Mercy College 49 149 49.0 224 22.0 105 51.0 RNP 3,800
Per US News, questionnaires were sent to regionally accredited institutions that grant bachelor's degrees.
Of the institutions that replied, 300 (17%) offer or will be offering an online bachelor's degree program.
10 schools either offered an online program for less than a year or had fewer than 10 students enrolled and were therefore designated as Unranked.
The highest possible score is 100.
All student and faculty statistical data are of July 1, 2014-June 30, 2015 cohorts, while the remaining data are of policies, services, and technologies in place
at the time of the questionnaire completion in the summer 2015.
Each program was sent two surveys. Between September and October 2015, academics responded by evaluating the academic quality of the other online bachelor's degree programs
listed on the survey on a scale of 1 (marginal) to 5 (outstanding), or by responding "don't know" about any program with which they were unfamiliar.
U.S. News aggregated the peer reputation data collected in 2015 with data collected in 2014 and 2013.
300 surveys were completed by schools with online bachelor's programs to determine peer reputation.
Schools performing in the bottom 25% of overall scores are categorized as Rank Not Published (RNP).
Indicator Weight Indicator Weight
Ph.D. faculty 38 Best practices 27
28 Graduation rates 27
Tenured faculty 8 Assessments 14
Faculty who have more than a B.A. 13 Class size 14
Technical staff available to faculty 13 Retention rates 9
Time to degree deadline 9
Indicator Weight
Student indebtedness 50 Indicator Weight
Technological infrastructure 25 Score 100
Support Services 25
Online Bachelor's Degree Programs Currently Offered:
B.A. Liberal Studies
B.S. Administrative Studies
B.S. Criminal Justice
US News - Best Online Education Programs
Bachelor's Programs - 2016
Student Engagement
Faculty Credentials and
Training
Student Services and
Technology
Methodology - Ranking Categories:
Faculty Credentials & Training (20%) Student Engagement (40%)
Preparedness to teach distance learners
Student Services & Technology (20%)
Peer Reputation (20%)
Methodology:
Prepared by: Office of Institutional Research (pn) Data as of 1/12/16Online Learning
Fact Book 23
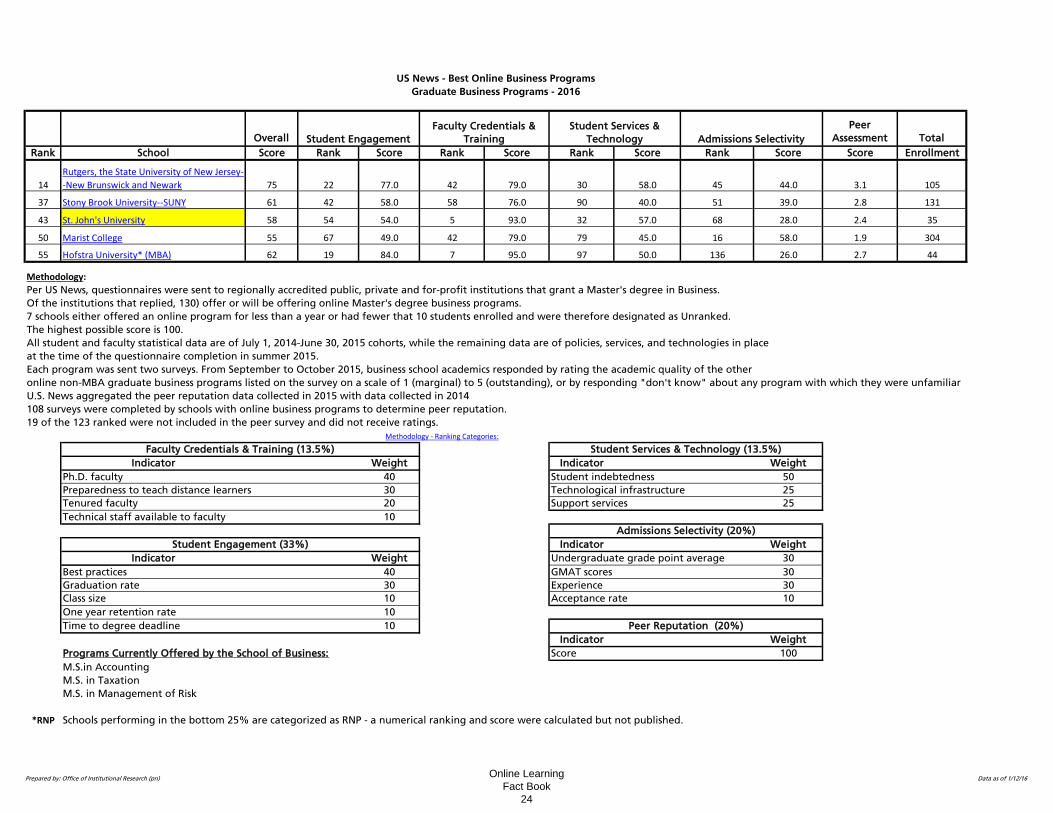
Overall
Peer
Assessment Total
Rank School Score Rank Score Rank Score Rank Score Rank Score Score Enrollment
37 Stony Brook University--SUNY 61 42 58.0 58 76.0 90 40.0 51 39.0 2.8 131
43 St. John's University 58 54 54.0 5 93.0 32 57.0 68 28.0 2.4 35
50 Marist College 55 67 49.0 42 79.0 79 45.0 16 58.0 1.9 304
55 Hofstra University* (MBA) 62 19 84.0 7 95.0 97 50.0 136 26.0 2.7 44
Per US News, questionnaires were sent to regionally accredited public, private and for-profit institutions that grant a Master's degree in Business.
Of the institutions that replied, 130) offer or will be offering online Master's degree business programs.
7 schools either offered an online program for less than a year or had fewer that 10 students enrolled and were therefore designated as Unranked.
The highest possible score is 100.
All student and faculty statistical data are of July 1, 2014-June 30, 2015 cohorts, while the remaining data are of policies, services, and technologies in place
at the time of the questionnaire completion in summer 2015.
Each program was sent two surveys. From September to October 2015, business school academics responded by rating the academic quality of the other
online non-MBA graduate business programs listed on the survey on a scale of 1 (marginal) to 5 (outstanding), or by responding "don't know" about any program with which they were unfamiliar
U.S. News aggregated the peer reputation data collected in 2015 with data collected in 2014
108 surveys were completed by schools with online business programs to determine peer reputation.
19 of the 123 ranked were not included in the peer survey and did not receive ratings.
Indicator Weight Indicator Weight
Ph.D. faculty 40 Student indebtedness 50
Preparedness to teach distance learners 30 Technological infrastructure 25
Tenured faculty 20 Support services 25
Technical staff available to faculty 10
Indicator Weight
Indicator Weight Undergraduate grade point average 30
Best practices 40 GMAT scores 30
Graduation rate 30 Experience 30
Class size 10 Acceptance rate 10
One year retention rate 10
Time to degree deadline 10
Indicator Weight
Programs Currently Offered by the School of Business: Score 100
M.S.in Accounting
M.S. in Taxation
M.S. in Management of Risk
*RNP Schools performing in the bottom 25% are categorized as RNP - a numerical ranking and score were calculated but not published.
1053.1
US News - Best Online Business Programs
Graduate Business Programs - 2016
Student Engagement
Faculty Credentials &
Training
Student Services &
Technology Admissions Selectivity
14
Rutgers, the State University of New Jersey-
-New Brunswick and Newark 75 22 77.0 42 79.0 30 58.0 44.0
Methodology - Ranking Categories:
Faculty Credentials & Training (13.5%) Student Services & Technology (13.5%)
Admissions Selectivity (20%)
Methodology:
Peer Reputation (20%)
Student Engagement (33%)
45
Prepared by: Office of Institutional Research (pn) Data as of 1/12/16Online Learning
Fact Book 24
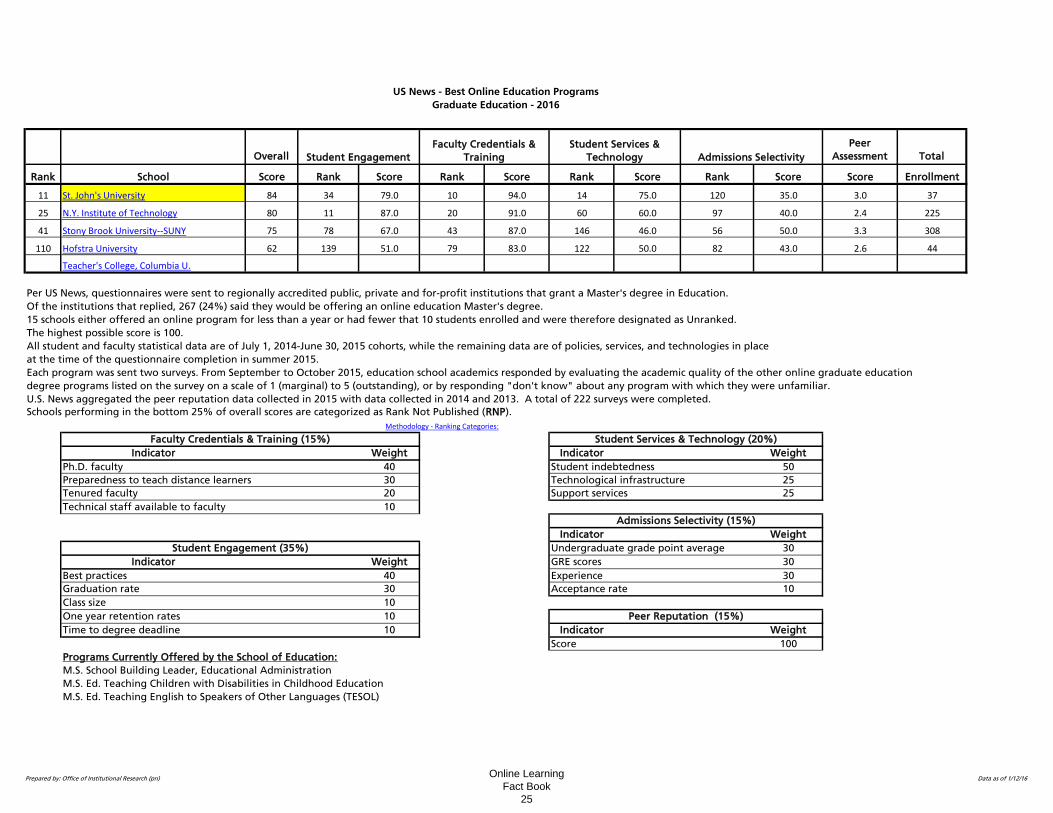
Overall
Peer
Assessment Total
Rank School Score Rank Score Rank Score Rank Score Rank Score Score Enrollment
11 St. John's University 84 34 79.0 10 94.0 14 75.0 120 35.0 3.0 37
25 N.Y. Institute of Technology 80 11 87.0 20 91.0 60 60.0 97 40.0 2.4 225
41 Stony Brook University--SUNY 75 78 67.0 43 87.0 146 46.0 56 50.0 3.3 308
110 Hofstra University 62 139 51.0 79 83.0 122 50.0 82 43.0 2.6 44
Teacher's College, Columbia U.
Per US News, questionnaires were sent to regionally accredited public, private and for-profit institutions that grant a Master's degree in Education.
Of the institutions that replied, 267 (24%) said they would be offering an online education Master's degree.
15 schools either offered an online program for less than a year or had fewer that 10 students enrolled and were therefore designated as Unranked.
The highest possible score is 100.
All student and faculty statistical data are of July 1, 2014-June 30, 2015 cohorts, while the remaining data are of policies, services, and technologies in place
at the time of the questionnaire completion in summer 2015.
Each program was sent two surveys. From September to October 2015, education school academics responded by evaluating the academic quality of the other online graduate education
degree programs listed on the survey on a scale of 1 (marginal) to 5 (outstanding), or by responding "don't know" about any program with which they were unfamiliar.
U.S. News aggregated the peer reputation data collected in 2015 with data collected in 2014 and 2013. A total of 222 surveys were completed.
Schools performing in the bottom 25% of overall scores are categorized as Rank Not Published (RNP).
Indicator Weight Indicator Weight
Ph.D. faculty 40 Student indebtedness 50
Preparedness to teach distance learners 30 Technological infrastructure 25
Tenured faculty 20 Support services 25
Technical staff available to faculty 10
Indicator Weight
Undergraduate grade point average 30
Indicator Weight GRE scores 30
Best practices 40 Experience 30
Graduation rate 30 Acceptance rate 10
Class size 10
One year retention rates 10
Time to degree deadline 10 Indicator Weight
Score 100
Programs Currently Offered by the School of Education:
M.S. School Building Leader, Educational Administration
M.S. Ed. Teaching Children with Disabilities in Childhood Education
M.S. Ed. Teaching English to Speakers of Other Languages (TESOL)
Peer Reputation (15%)
Student Engagement
Faculty Credentials &
Training
Student Services &
Technology Admissions Selectivity
Methodology - Ranking Categories:
Faculty Credentials & Training (15%) Student Services & Technology (20%)
Admissions Selectivity (15%)
Student Engagement (35%)
US News - Best Online Education Programs
Graduate Education - 2016
Prepared by: Office of Institutional Research (pn) Data as of 1/12/16Online Learning
Fact Book 25