Embed Size (px)
Citation preview

ECE 4363/5363Optical Engineering
Spring 2013
Lecture 1427 March 2013

Last class…• Semiconductor Photodetectors• Optical Receivers
Today…• Point-to-point link power budget analysis• Optical Amplifiers• Test and measurement

Point-to-Point Digital Transmission Links
• Link Requirements:– Transmission Distance– Data Rate or Bandwidth
A designer has the choice of the following:

1) Fiber -Multimode or single-modeCore size and refractive index profileAttenuationNumerical aperture

2) Source -Laser diode or LEDEmission wavelengthSpectral widthOutput powerSpeed (bandwidth)Effective emitting areaEmission pattern

3) Detector –Sensitivity (or responsivity)Speed (bandwidth)Operating λ
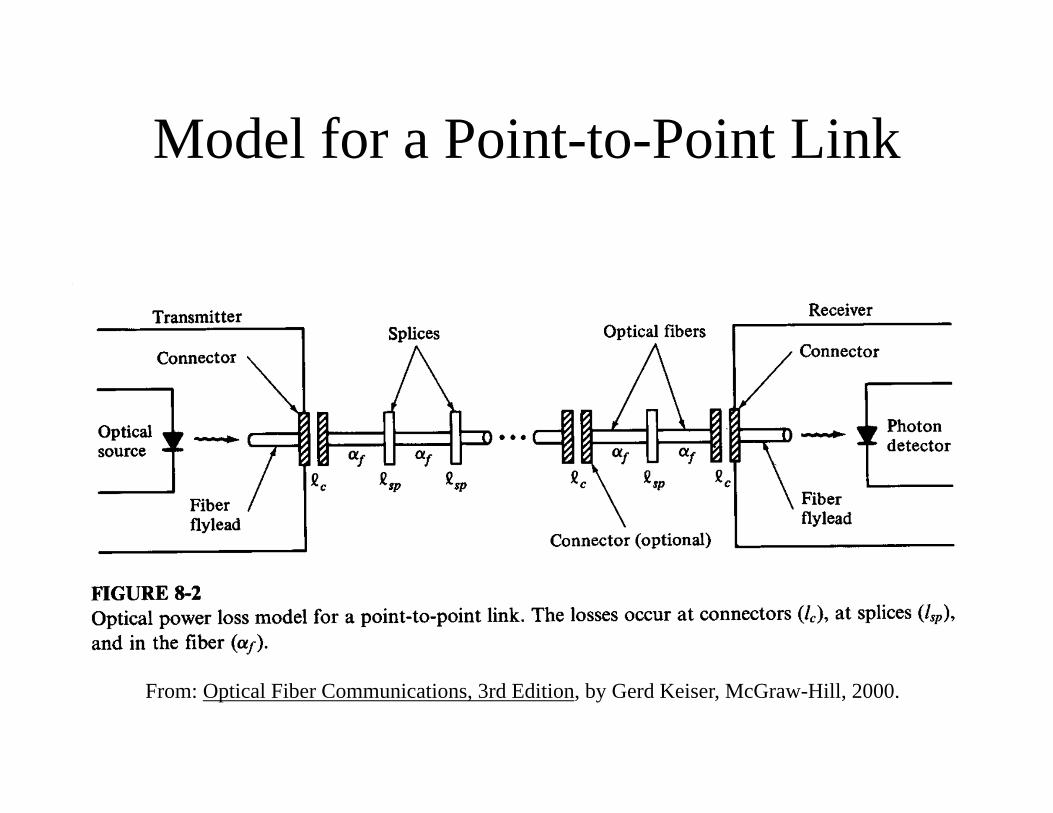
Model for a Point-to-Point Link
From: Optical Fiber Communications, 3rd Edition, by Gerd Keiser, McGraw-Hill, 2000.

Link Power Budget Analysis
PS - PR ≥ [ αf L + m(lc) + n(lsp) + system margin ]
where αf = fiber attenuation (dB/km)L = fiber length (km)m = number of connectorslc = loss per connector (dB)n = number of spliceslsp = loss per splice (dB)PS = source output power (dBm)PR = receiver sensitivity (dBm)

System Margin
• System margin is typically specified at 6 to 8 dB to allow for new components, component aging, and temperature fluctuations.

Link Rise Time Budget
• One accepted method for determining the dispersion limitiation of a fiber optic transmission system is to calculate the system rise time, tsys, and ensure that it does not exceed 70% of the NRZ bit period.
tsys = [ ( ttx)2 + ( tGVD)2 + ( tmod)2 + ( trx)2 ]1/2
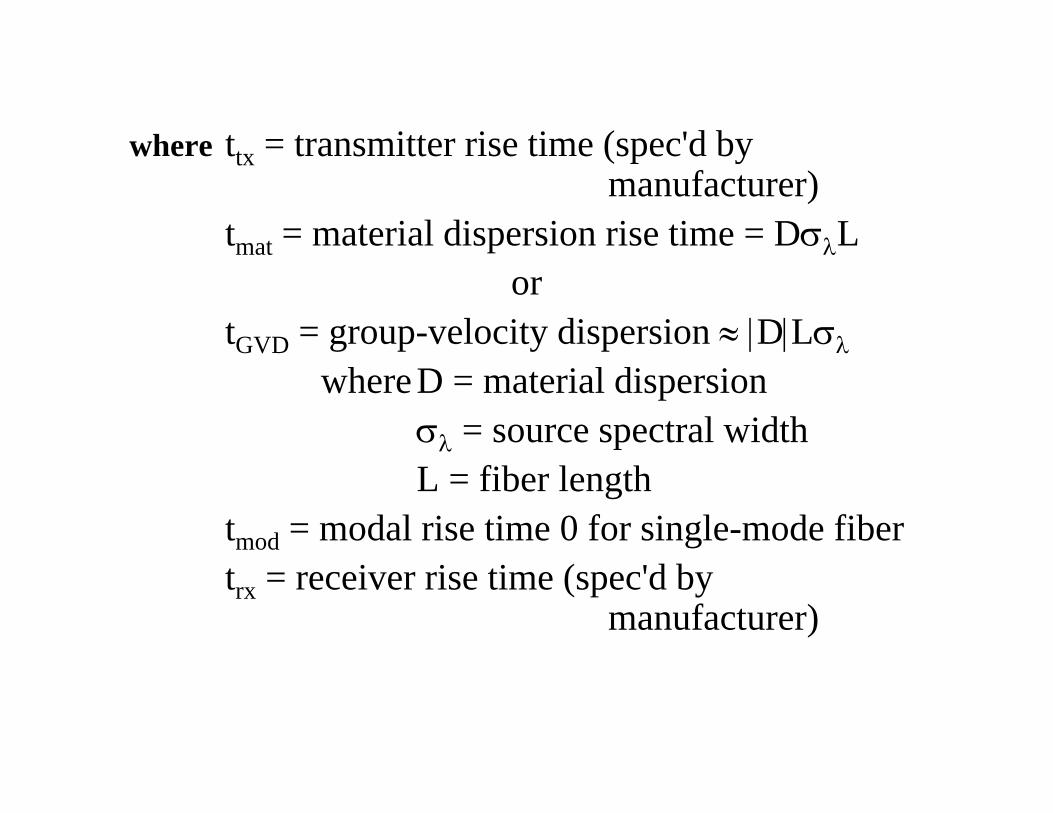
where ttx = transmitter rise time (spec'd by manufacturer)
tmat = material dispersion rise time = DσλLor
tGVD = group-velocity dispersion ≈ |D|Lσλ
where D = material dispersionσλ = source spectral widthL = fiber length
tmod = modal rise time 0 for single-mode fibertrx = receiver rise time (spec'd by
manufacturer)

Purposes of Timing
• To allow the signal to be sampled by the receiver at the time when the SNR is at a maximum
• To maintain proper pulse spacing• To indicate the start and end of each timing
interval

Signal Coding
From: Optical Networks: A Practical Perspective, R. Ramaswami and K. N. Kumar, Morgan Kaufmann Publishers, Inc., 1998.

Signal Coding
From: Optical Fiber Communications, 3rd Edition, by Gerd Keiser, McGraw-Hill, 2000.

Example
A 1550 nm single-mode digital fiber optic link needs to operate at 622 Mb/s over 80 km without amplifiers. A single-mode InGaAsP laser launches an average optical power of 0 dBm into the fiber. The fiber has a loss of 0.25 dB/km, and there is a splice with a loss of 0.1 dB every km. The coupling loss at the receiver is 0.5 dB, and the receiver uses an InGaAs APD with a sensitivity of –39 dBm.
a) Find the system margin.b) Find the system margin at 2.5 Gb/s with an APD
sensitivity of –31 dBm.

SolutionPS - PR ≥ [ αf L + m(lc) + n(lsp) + system margin ]
so we can calculate the system margin fromsystem margin ≤ PS - PR - αf L - m(lc) - n(lsp)
where PS = 0 dBmαf = 0.25 dB/kmL = 80 kmm = 1lc = 0.5 dBn = 79lsp = 0.1 dB

Solution (continued)a) PR = –39 dBm for a data rate of 622 Mb/ssystem margin ≤ 0 dBm – (-39 dBm) – (0.25 dB/km)(80 km)
– (1)(0.5 dB) – (79)(0.1 dB)system margin ≤ 10.6 dB, which is very respectable
b) PR = –31 dBm for a data rate of 2.5 Gb/ssystem margin ≤ 0 dBm – (-31 dBm) – (0.25 dB/km)(80 km)
– (1)(0.5 dB) – (79)(0.1 dB)system margin ≤ 2.6 dB, which is really not good enough to
ensure long-term, problem-free operation of the link
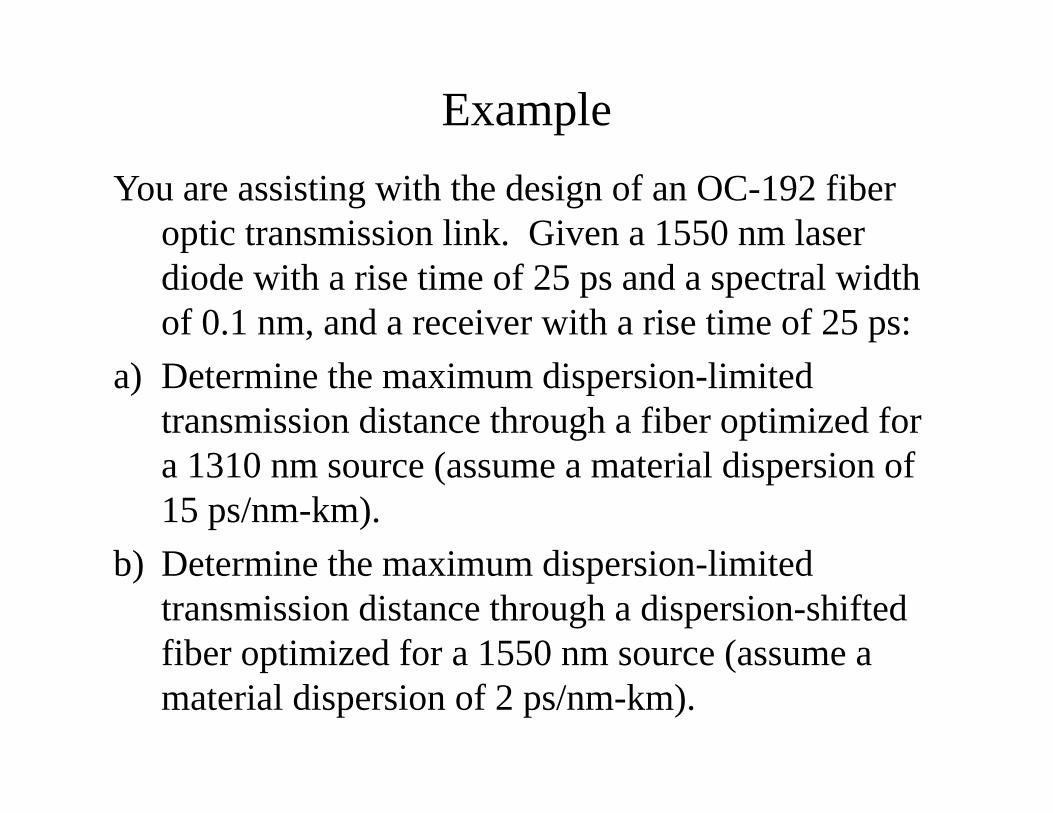
ExampleYou are assisting with the design of an OC-192 fiber
optic transmission link. Given a 1550 nm laser diode with a rise time of 25 ps and a spectral width of 0.1 nm, and a receiver with a rise time of 25 ps:
a) Determine the maximum dispersion-limited transmission distance through a fiber optimized for a 1310 nm source (assume a material dispersion of 15 ps/nm-km).
b) Determine the maximum dispersion-limited transmission distance through a dispersion-shifted fiber optimized for a 1550 nm source (assume a material dispersion of 2 ps/nm-km).

Solution
( ) ( ) ( ) ( )
( ) ( ) ( ) ( )
( ) ( ) ( ) ( )
12 2 2 2 2
mod
12 22 2 2
mod
12 22 2 2
mod
substituting for
and solving for
sys tx GVD rx
GVD
sys tx rx
sys tx rx
t t t t t
t D L
t t D L t t
L
t t t tL
D
λ
λ
λ
σ
σ
σ
⎡ ⎤= + + +⎣ ⎦=
⎡ ⎤= + + +⎣ ⎦
⎡ ⎤− − −⎢ ⎥⎣ ⎦=

Solution (continued)From the problem statement,
ttx = 25 pstmod ≈ 0trx = 25 psσλ = 0.1 nm
For an OC-192, the data rate is approximately 10 Gb/s, so the NRZ bit period isTb= 1x10⁻¹⁰ s = 100 ps. Thus, tsys should not exceed 70% of Tb, so set tsys=70 ps.

Solution (continued)
( ) ( ) ( )( )( )
12 2 2 2
max
max
a) transmission through a fiber optimized for a 1310 nm source with 15 / .
70 25 25
15 / 0.1
40.28
b) transmission through a dispersion-shifted fiberoptimized for
D ps nm km
ps ps psL
ps nm km nm
L km
= ⋅
⎡ ⎤− −⎣ ⎦=⋅
=
( ) ( ) ( )( )( )
12 2 2 2
max
max
a 1550 nm source with 2 / - .
70 25 25
2 / 0.1
302.08
D ps nm km
ps ps psL
ps nm km nm
L km
=
⎡ ⎤− −⎣ ⎦=⋅
=

Optical Amplifiers

From: Optical Fiber Communications, 3rd Edition, by Gerd Keiser, McGraw-Hill, 2000.

Basic Operation
From: Optical Fiber Communications, 3rd Edition, by Gerd Keiser, McGraw-Hill, 2000.
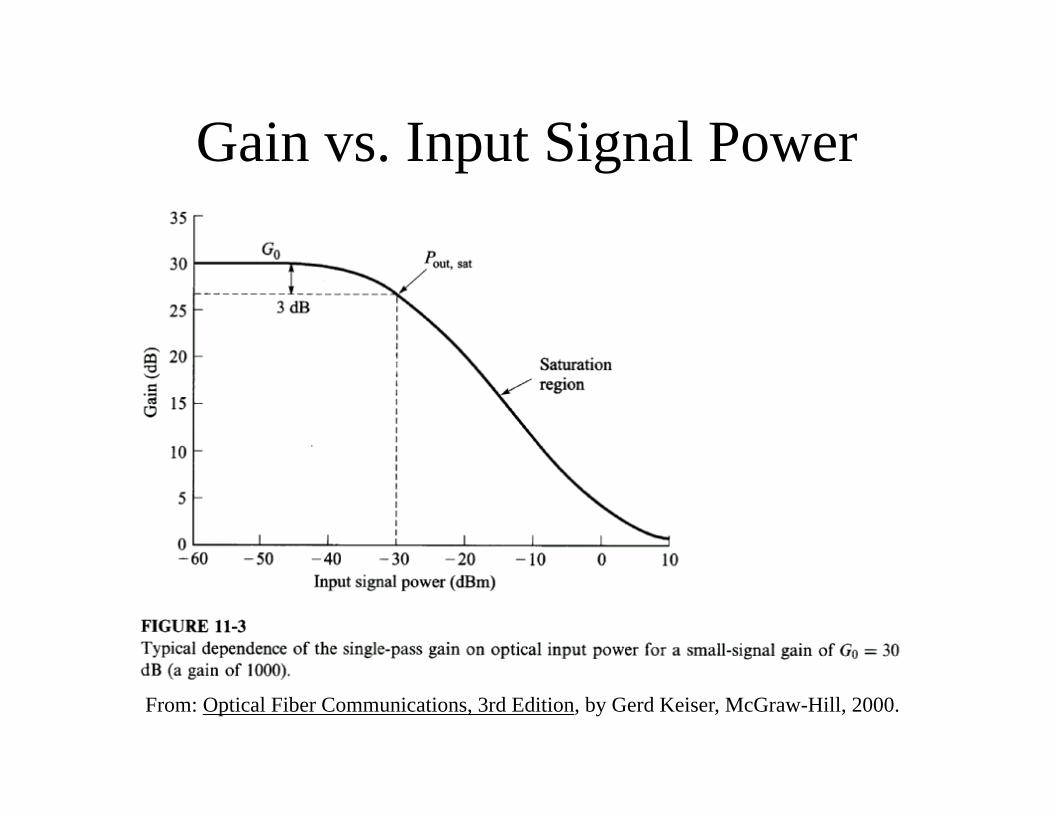
Gain vs. Input Signal Power
From: Optical Fiber Communications, 3rd Edition, by Gerd Keiser, McGraw-Hill, 2000.

Energy-levels for EDFAs
From: Optical Fiber Communications, 3rd Edition, by Gerd Keiser, McGraw-Hill, 2000.

From: Optical Fiber Communications, 3rd Edition, by Gerd Keiser, McGraw-Hill, 2000.

From: Optical Fiber Communications, 3rd Edition, by Gerd Keiser, McGraw-Hill, 2000.

Gain Behavior
From: Optical Fiber Communications, 3rd Edition, by Gerd Keiser, McGraw-Hill, 2000.

Amplified-Spontaneous-Emission (ASE) Noise
From: Optical Fiber Communications, 3rd Edition, by Gerd Keiser, McGraw-Hill, 2000.

ASE vs. Pump Power
From: Optical Fiber Communications, 3rd Edition, by Gerd Keiser, McGraw-Hill, 2000.

EDFA Noise
From: Optical Fiber Communications, 3rd Edition, by Gerd Keiser, McGraw-Hill, 2000.

Amplifier Cascades
From: Optical Networks: A Practical Perspective, R. Ramaswami andK. N. Kumar, Morgan Kaufmann Publishers, Inc., 1998.
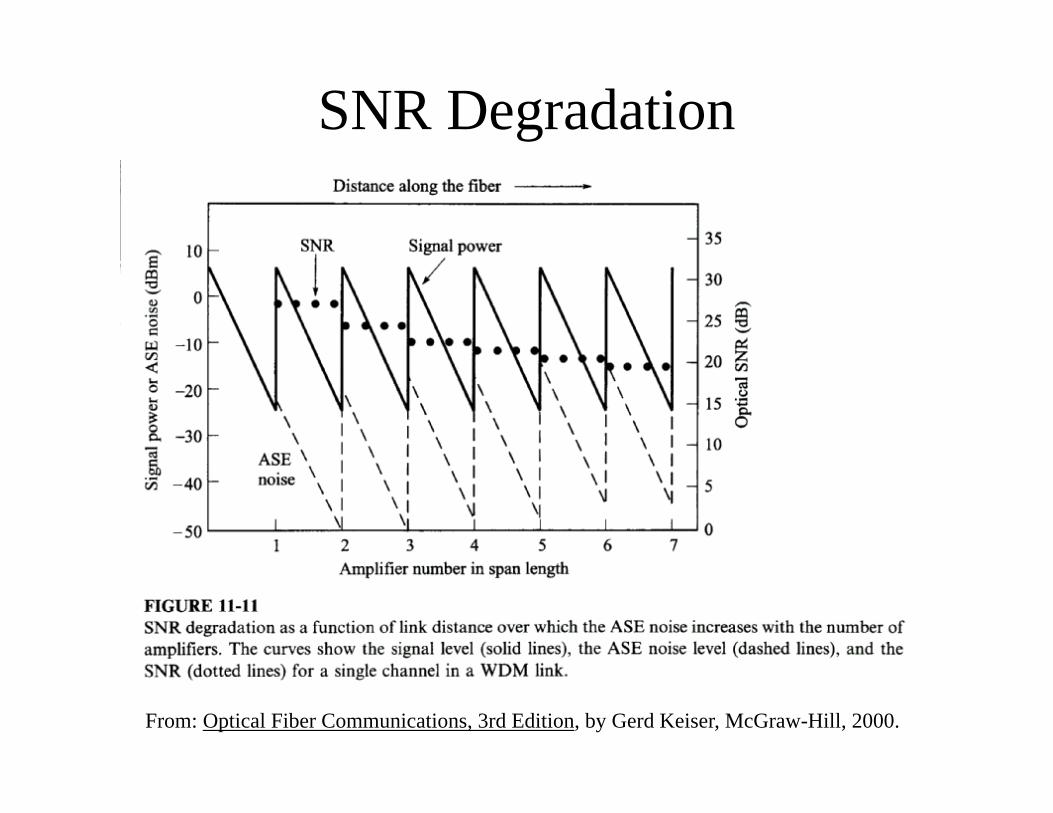
SNR Degradation
From: Optical Fiber Communications, 3rd Edition, by Gerd Keiser, McGraw-Hill, 2000.

Power vs. Amplifier Spacing
From: Optical Networks: A Practical Perspective, R. Ramaswami and K. N. Kumar, Morgan Kaufmann Publishers, Inc., 1998.

From: Optical Fiber Communications, 3rd Edition, by Gerd Keiser, McGraw-Hill, 2000.

Gain Equalization
From: Optical Networks: A Practical Perspective, R. Ramaswami and K. N. Kumar, Morgan Kaufmann Publishers, Inc., 1998.

Automatic Gain Control (AGC)
From: Optical Networks: A Practical Perspective, R. Ramaswami and K. N. Kumar, Morgan Kaufmann Publishers, Inc., 1998.

Optical Supervisory Channel
From: Optical Networks: A Practical Perspective, R. Ramaswami and K. N. Kumar, Morgan Kaufmann Publishers, Inc., 1998.

Test & Measurement

Typical Problems
Low Levels
RXTXFiber Optic Cable
Dirty Connectors
Connectors not seated properly
Pinched Fibers
Tight bending radius’s
Bad Patchcords
Patchcord Patchcord
Low Transmit Levels
Ferrule Must be Clean
Key/Keyway must be engaged in mating
hardware
Avoid Tight Bending Radius’s
Avoid Stress Points Tie wrap Cinched Tight, Must
be Loose
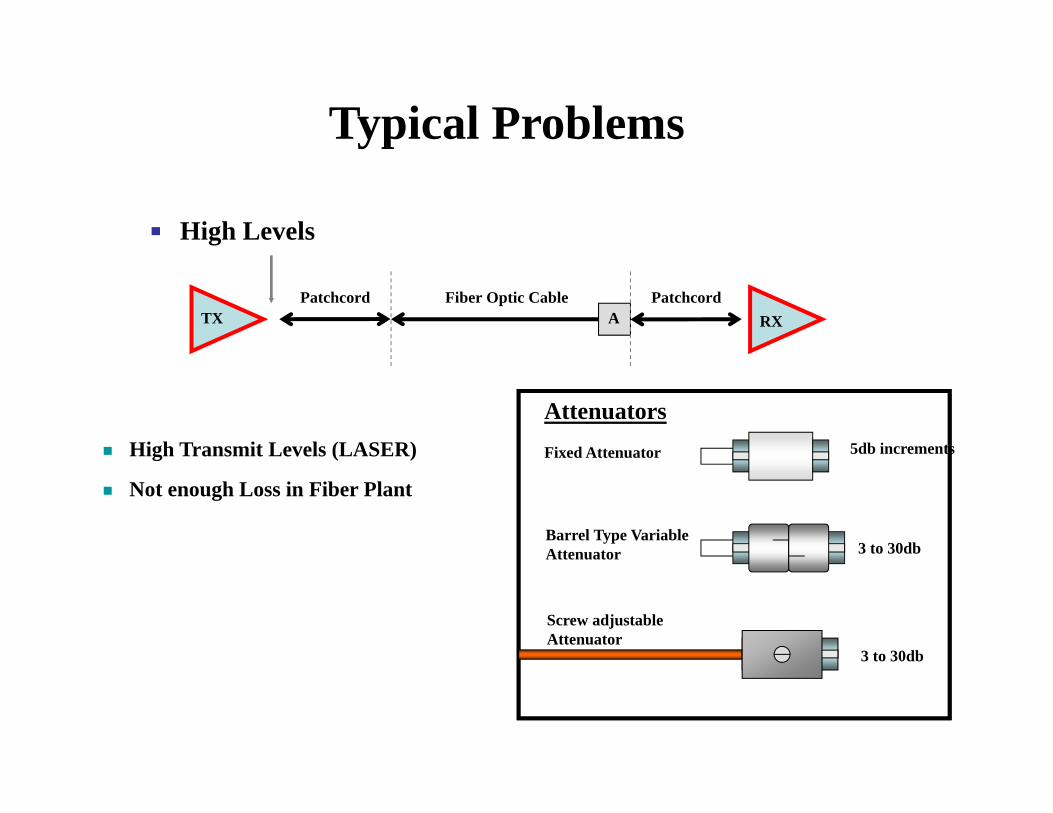
Typical Problems
High Levels
RXTXFiber Optic Cable
Not enough Loss in Fiber Plant
Patchcord Patchcord
High Transmit Levels (LASER) Fixed Attenuator
Barrel Type Variable Attenuator
Screw adjustable Attenuator
5db increments
3 to 30db
3 to 30db
A
Attenuators

Typical Problems
No Receive Level
RXTXFiber Optic Cable
Dirty Connectors
Connectors not seated properly
Bad Patchcord (Open)
No Transmit Output
Wrong Fiber
Patchcord Patchcord
Ferrule Must be Clean
Key/Keyway must be engaged in mating
hardware
Avoid Tight Bending Radius’s
Avoid Stress Points Tie wrap Cinched Tight, Must
be Loose

Optical Loss Measurements
Patchcord PatchcordBulkhead
Connection
Power MeterLight Source
Reference Measurement
Relative Reference Measurement
-15.0dBmRef-0.00dBm
850nm
850nmReceived Level

Patchcord Patchcord
Bulkhead Connection
Power MeterLight Source
Attenuation Measurement ---Forward Direction
Loss
-5.00dBm
Bulkhead Connection
Fiber under test
850nm
850nm
Fiber Loss
Optical Loss Measurements

Optical Loss Measurements
Patchcord Patchcord
Bulkhead Connection
Power Meter Light Source
Attenuation Measurement ---Reverse Direction
Loss
-4.80dBm
Bulkhead Connection
Fiber under test
850nm
Fiber Loss850nm

Optical Time-Domain Reflectometry
From: Optical Fiber Communications, 3rd Edition, by Gerd Keiser, McGraw-Hill, 2000.

OTDR Measurements
OTDR DEAD ZONES
Near End or
Attenuation DZ Splice DZ
Connector DZ
End of Cable

OTDR Measurements
Optical Return Loss
Large Reflection
Large Reflection
Small Reflection
Cleaved Fiber -14.5db
Flat Finish -14.5db
PC Finish - 45db
Dirty Connectors also cause Reflections
Increases Bit Error Rates
Increases Noise in Analog Systems
Optical Return Loss ---- Problems with Reflections
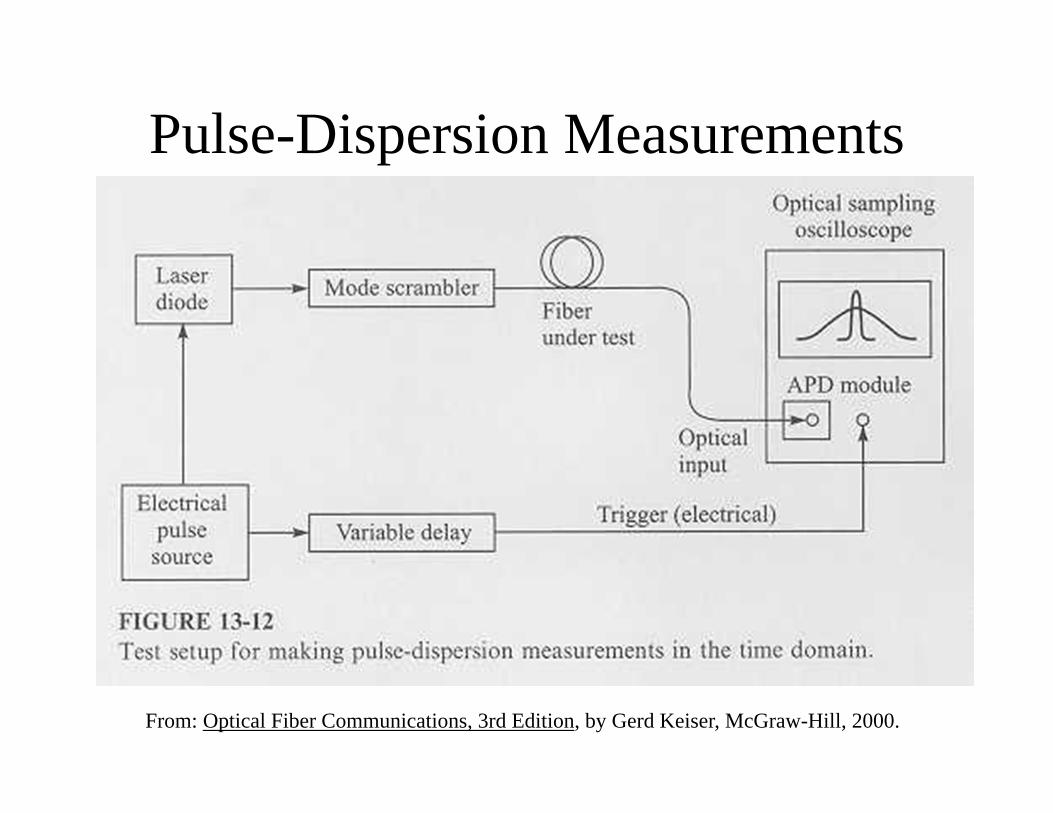
Pulse-Dispersion Measurements
From: Optical Fiber Communications, 3rd Edition, by Gerd Keiser, McGraw-Hill, 2000.

Chromatic Dispersion Measurement(phase-shift method)
From: Optical Fiber Communications, 3rd Edition, by Gerd Keiser, McGraw-Hill, 2000.

Optical Spectrum Analyzers
• Characterization of optical sources• EDFA gain and noise measurements

From: Optical Fiber Communications, 3rd Edition, by Gerd Keiser, McGraw-Hill, 2000.

From: Optical Fiber Communications, 3rd Edition, by Gerd Keiser, McGraw-Hill, 2000.

From: Optical Fiber Communications, 3rd Edition, by Gerd Keiser, McGraw-Hill, 2000.
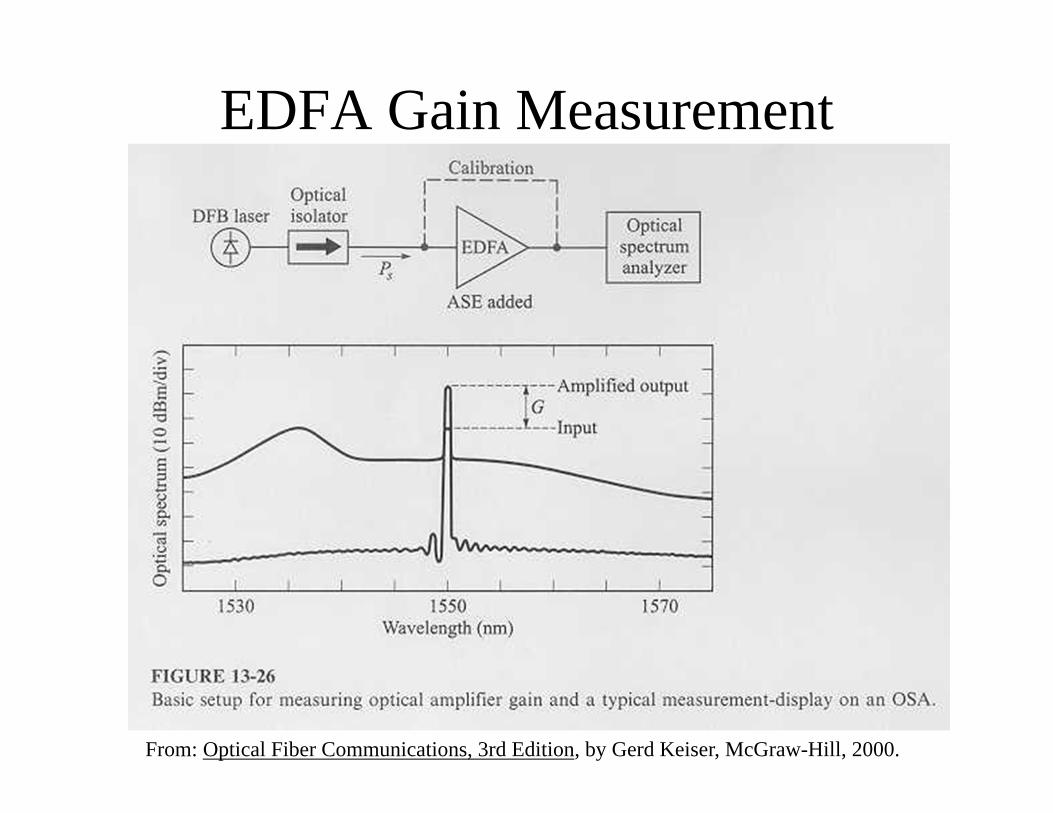
EDFA Gain Measurement
From: Optical Fiber Communications, 3rd Edition, by Gerd Keiser, McGraw-Hill, 2000.

EDFA Noise Measurement
From: Optical Fiber Communications, 3rd Edition, by Gerd Keiser, McGraw-Hill, 2000.

Eye-Pattern Measurement
From: Optical Fiber Communications, 3rd Edition, by Gerd Keiser, McGraw-Hill, 2000.

Eye-Pattern Key Features
• Opening (height) and width of the eye• 20-80% rise and fall times for fiber systems
(10-90% times are often obscured by noise and jitter effects)
• Overshoot on logic ones and zeros• Undershoot on logic zero• Jitter in the eye pattern

From: Optical Fiber Communications, 3rd Edition, by Gerd Keiser, McGraw-Hill, 2000.

3-bit Long NRZ Combinations
From: Optical Fiber Communications, 3rd Edition, by Gerd Keiser, McGraw-Hill, 2000.

Eye Pattern Performance Parameters
From: Optical Fiber Communications, 3rd Edition, by Gerd Keiser, McGraw-Hill, 2000.

• Width and height of the eye opening defines best sampling time
• Noise margin (%) = (V1/V2)x100%• Slope of the eye-pattern sides determines
sensitivity to timing errors• Timing jitter (%) = (ΔT/Tb)x100%• Nonlinearities of the channel transfer
characteristics will create asymmetry in the eye-pattern

Next class …
• Geometrical optics• Optical instruments