Embed Size (px)
Citation preview
op5 Monitor 3.20
Manual
April 8, 2008
Contents
1 Getting Started 11.1 Using op5 Monitor . . . . . . . . . . . . . . . . . . . . . 11.2 Start page . . . . . . . . . . . . . . . . . . . . . . . . . . 1
2 About the Main Menu 32.1 About . . . . . . . . . . . . . . . . . . . . . . . . . . . . 32.2 Simple menu or Advanced menu . . . . . . . . . . . . 3
3 Viewing Current Monitoring Information 53.1 Tactical Overview . . . . . . . . . . . . . . . . . . . . . 53.2 Host Detail and Service Detail . . . . . . . . . . . . . . 9
3.2.1 Host Detail . . . . . . . . . . . . . . . . . . . . . 93.3 Service Detail . . . . . . . . . . . . . . . . . . . . . . . . 15
3.3.1 op5 Monitor Simple Graphs . . . . . . . . . . . 163.3.2 Extended service Information . . . . . . . . . . 163.3.3 Service commands . . . . . . . . . . . . . . . . . 18
3.4 Filtering . . . . . . . . . . . . . . . . . . . . . . . . . . . 203.5 Host group Summary, Overview and Grid . . . . . . . 21
3.5.1 Host group Summary . . . . . . . . . . . . . . . 213.5.2 Host group Overview . . . . . . . . . . . . . . . . 223.5.3 Host group Grid . . . . . . . . . . . . . . . . . . 22
3.6 Service group Summary, Overview and Grid . . . . . . 233.6.1 Service group Summary . . . . . . . . . . . . . . 233.6.2 Service group Overview . . . . . . . . . . . . . . 233.6.3 Service group Grid . . . . . . . . . . . . . . . . . 24
4 Presentation Using Maps 254.1 Status Map . . . . . . . . . . . . . . . . . . . . . . . . . 254.2 Network Map . . . . . . . . . . . . . . . . . . . . . . . . 28
4.2.1 View host group . . . . . . . . . . . . . . . . . . 294.2.2 View custom map (default) . . . . . . . . . . . . 30
II
op5 Monitor 3.2 Manual
4.2.3 Edit host group . . . . . . . . . . . . . . . . . . . 304.2.4 Edit custom map . . . . . . . . . . . . . . . . . . 31
4.3 Hyper Map . . . . . . . . . . . . . . . . . . . . . . . . . 32
5 Problem Views for Work Flow 335.1 Network Outages . . . . . . . . . . . . . . . . . . . . . . 335.2 Host Problems . . . . . . . . . . . . . . . . . . . . . . . 345.3 Service Problems . . . . . . . . . . . . . . . . . . . . . . 355.4 Unhandled Problems . . . . . . . . . . . . . . . . . . . 355.5 Show Host . . . . . . . . . . . . . . . . . . . . . . . . . 355.6 Comments . . . . . . . . . . . . . . . . . . . . . . . . . 365.7 Downtime . . . . . . . . . . . . . . . . . . . . . . . . . . 36
6 Runtime Status 386.1 Process Info . . . . . . . . . . . . . . . . . . . . . . . . . 38
6.1.1 The process information . . . . . . . . . . . . . 386.1.2 Process Commands . . . . . . . . . . . . . . . . 39
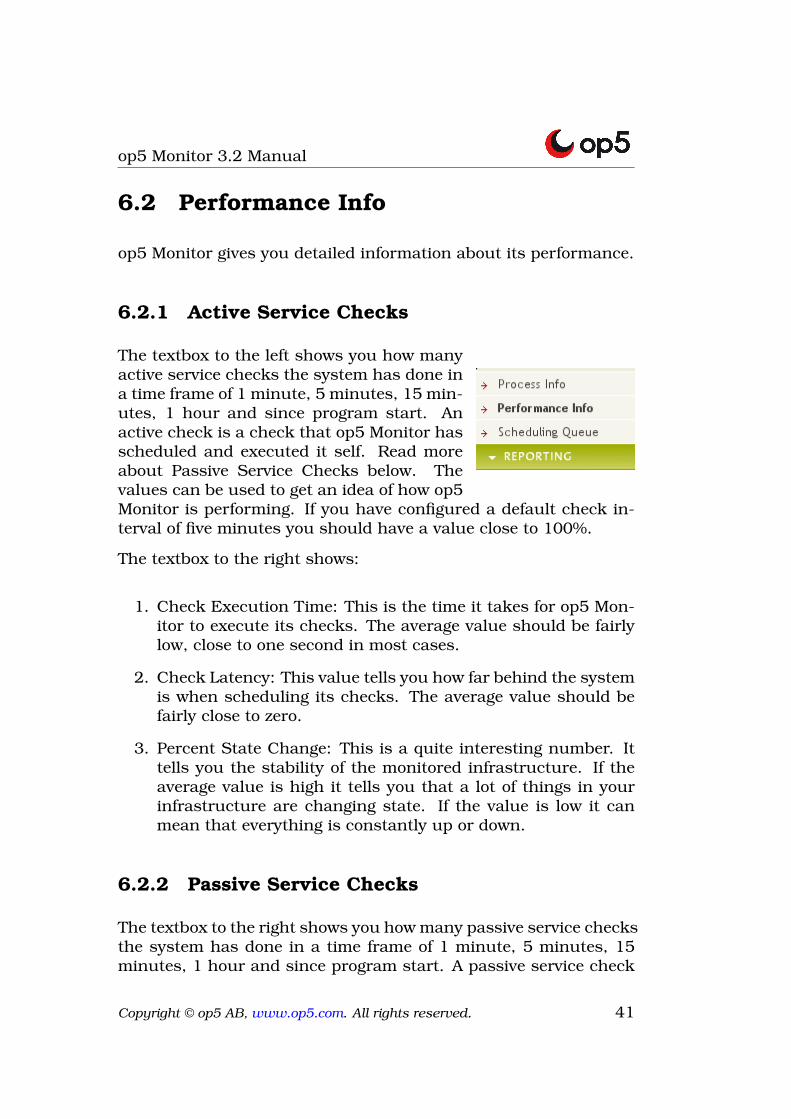
6.2 Performance Info . . . . . . . . . . . . . . . . . . . . . . 416.2.1 Active Service Checks . . . . . . . . . . . . . . . 416.2.2 Passive Service Checks . . . . . . . . . . . . . . 416.2.3 Active Host Checks . . . . . . . . . . . . . . . . 426.2.4 Passive Host Checks . . . . . . . . . . . . . . . . 42
6.3 Scheduling Queue . . . . . . . . . . . . . . . . . . . . . 43
7 Reporting Web Menu 447.0.1 Reporting . . . . . . . . . . . . . . . . . . . . . . 44
7.1 Trends . . . . . . . . . . . . . . . . . . . . . . . . . . . . 447.2 Availability . . . . . . . . . . . . . . . . . . . . . . . . . 477.3 Old Availability . . . . . . . . . . . . . . . . . . . . . . . 517.4 SLA Reporting . . . . . . . . . . . . . . . . . . . . . . . 547.5 Alert History . . . . . . . . . . . . . . . . . . . . . . . . 577.6 Alert Summary . . . . . . . . . . . . . . . . . . . . . . . 58
7.6.1 Top 25 Hard Service Alert Producers . . . . . . 607.7 Notifications . . . . . . . . . . . . . . . . . . . . . . . . 607.8 Event Log . . . . . . . . . . . . . . . . . . . . . . . . . . 617.9 Schedule Reports . . . . . . . . . . . . . . . . . . . . . 61
8 Configuration Web Menu 638.0.1 View Config . . . . . . . . . . . . . . . . . . . . . 63
8.1 Change Password . . . . . . . . . . . . . . . . . . . . . 648.2 Backup / Restore . . . . . . . . . . . . . . . . . . . . . 64
Copyright © op5 AB, www.op5.com. All rights reserved. III
op5 Monitor 3.2 Manual
8.2.1 Create a backup . . . . . . . . . . . . . . . . . . 648.2.2 Restore a backup . . . . . . . . . . . . . . . . . . 65
8.3 Configure . . . . . . . . . . . . . . . . . . . . . . . . . . 668.3.1 Configuration basics . . . . . . . . . . . . . . . . 688.3.2 New Hosts . . . . . . . . . . . . . . . . . . . . . . 688.3.3 Hosts . . . . . . . . . . . . . . . . . . . . . . . . . 738.3.4 Services for host . . . . . . . . . . . . . . . . . . 818.3.5 Dependencies . . . . . . . . . . . . . . . . . . . . 838.3.6 Escalations . . . . . . . . . . . . . . . . . . . . . 848.3.7 Extras . . . . . . . . . . . . . . . . . . . . . . . . 858.3.8 Advanced . . . . . . . . . . . . . . . . . . . . . . 858.3.9 Templates . . . . . . . . . . . . . . . . . . . . . . 898.3.10Host Groups . . . . . . . . . . . . . . . . . . . . 898.3.11Service Groups . . . . . . . . . . . . . . . . . . . 908.3.12Contacts . . . . . . . . . . . . . . . . . . . . . . . 928.3.13Contact Groups . . . . . . . . . . . . . . . . . . 948.3.14Check Commands . . . . . . . . . . . . . . . . . 948.3.15Time Periods . . . . . . . . . . . . . . . . . . . . 958.3.16Access Rights . . . . . . . . . . . . . . . . . . . . 968.3.17Assign Group Rights . . . . . . . . . . . . . . . . 988.3.18Export hosts to statistics . . . . . . . . . . . . . 98
A Customizing Views 100
B Profiles and Cloning 102B.1 Overview . . . . . . . . . . . . . . . . . . . . . . . . . . 102B.2 Profiles . . . . . . . . . . . . . . . . . . . . . . . . . . . 103
B.2.1 Creating a Profile . . . . . . . . . . . . . . . . . . 103B.2.2 Cloning from a Profile . . . . . . . . . . . . . . . 103B.2.3 Cloning from an Existing Host . . . . . . . . . . 103
C Basing Work Flows around Monitor 104C.1 Getting the Contacts Right . . . . . . . . . . . . . . . . 104C.2 Tuning Alerts . . . . . . . . . . . . . . . . . . . . . . . . 105C.3 Updating Monitor . . . . . . . . . . . . . . . . . . . . . 105C.4 Handling Alerts . . . . . . . . . . . . . . . . . . . . . . . 106
C.4.1 Acknowledging Alerts . . . . . . . . . . . . . . . 106C.5 Service Groups . . . . . . . . . . . . . . . . . . . . . . . 107
D Table of Icons 108
Copyright © op5 AB, www.op5.com. All rights reserved. IV

op5 Monitor 3.2 Manual
E Index 110
Copyright © op5 AB, www.op5.com. All rights reserved. V
op5 Monitor 3.2 Manual
Introduction
op5 Monitor is a highly flexible monitoring system for monitoring ofIT infrastructure. op5 Monitor is based on the widely known opensource monitoring system Nagios.
This manual includes information on how to use and configure op5Monitor and its components.
Using This Manual
This manual is written using the same structure as the Web Inter-face – so as to function as a reference manual where you can easilyfind the answers to the specific part of Monitor you are looking for.
If you can not find what you are looking for, please read throughthe index for any possible keywords, or look at the table of contentsfor the appendixes.
Targeted Audience
This manual is targeted for a technical audience. The manual cov-ers how to use and configure op5 Monitor through its web interface.For configuration using direct console access or SSH, see the op5System manual.
Copyright © op5 AB, www.op5.com. All rights reserved. VI
op5 Monitor 3.2 Manual
Chapter 1
Getting Started
1.1 Using op5 Monitor
op5 Monitor is used and configured in a web inter-face using any standard browser. The most commonbrowsers Explorer and Firefox have been tested.
The interface is protected by using both authentication– you need to specify a username and password to getaccess – and by SSL 1 which enables a secure mannerfor accessing the web interface using encryption.
1.2 Start page
The start page is the first page that you access by typing https://a.b.c.d/in your browser. Change a.b.c.d to the IP address of your op5 Mon-itor system.
This will show general information about the system, what versionof monitor that is installed, shortcuts to monitor, support informa-tion and more.
To access op5 Monitor simply click on the op5 Monitor logo.
1Secure Socket Layer
Copyright © op5 AB, www.op5.com. All rights reserved. 1

op5 Monitor 3.2 Manual
This will direct you to the /monitor/ page which is the direct linkto op5 Monitor. You can bookmark this link to get directly to op5Monitor without having to go through the start page.
Copyright © op5 AB, www.op5.com. All rights reserved. 2
op5 Monitor 3.2 Manual
Chapter 2
About the Main Menu
2.1 About
The about link gets you right back to the op5 Systemstart page. The start page gives you information aboutthe installed products, how to get support and most im-portant of all – an easy way to check for updates.
Simply click on the ”Check for Updates” button. This willsend version information to op5 Support web and gener-ate a unique list of available updates for your system.
Since op5 System 3.0 you can update all your op5 Soft-ware using yum – more information on this is availablein op5 System manual.
2.2 Simple menu or Advanced menu
There are two modes for the navigation menu, an ad-vanced mode with the full set of selections in the menuand a simple mode with a limited set of selections.
When you log on to op5 Monitor for the first time theside menu will be displayed in simple mode. Just clickon the Advanced menu link to change mode to advanced
Copyright © op5 AB, www.op5.com. All rights reserved. 3

op5 Monitor 3.2 Manual
mode. The menu will show a full set of selections and theAdvanced menu item will change name to Simple menu. To returnto simple mode just click on the Simple menu link.
Copyright © op5 AB, www.op5.com. All rights reserved. 4
op5 Monitor 3.2 Manual
Chapter 3
Viewing Current MonitoringInformation
The monitoring section in the web menu is related to problem man-agement and status of your network.
3.1 Tactical Overview
The Tactical Overview window enables the user to get a summa-rized picture of the overall network health. It also displays statusof the system and gives you the possibility to enable and disablesome functions on a system wide basis.
Copyright © op5 AB, www.op5.com. All rights reserved. 5
op5 Monitor 3.2 Manual
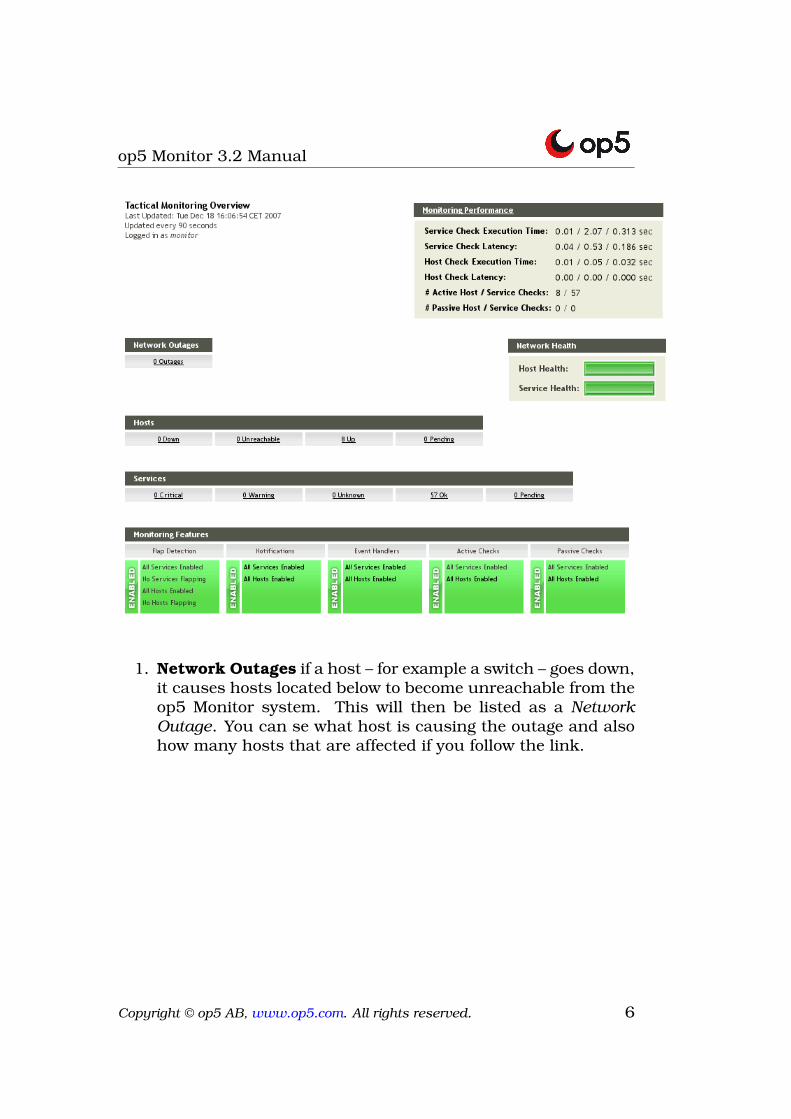
1. Network Outages if a host – for example a switch – goes down,it causes hosts located below to become unreachable from theop5 Monitor system. This will then be listed as a NetworkOutage. You can se what host is causing the outage and alsohow many hosts that are affected if you follow the link.
Copyright © op5 AB, www.op5.com. All rights reserved. 6
op5 Monitor 3.2 Manual
2. Hosts gives you a summarized view of the host and their sta-tus. There are four different states:
(a) Down the host is not responding.
(b) Unreachable. The host is unreachable for the system dueto a network outage (see network outage)
(c) Up the host is working fine.
(d) Pending the host has not yet been checked; the check ofthe host is in a queue about to be executed.
3. Services gives you a summarized view of the service status.There are five different states:
(a) Critical the service check responds with a value that iswithin the configured critical level.
(b) Warning the service check responds with a value that iswithin the configured warning level.
(c) Unknown the service of a host does not respond correctlyto a service check, or the service check is misconfigured.
(d) Ok the service is working fine.
(e) Pending the service has not been checked yet. The checkis queued, about to be executed or is configured to neverbe executed.
Copyright © op5 AB, www.op5.com. All rights reserved. 7
op5 Monitor 3.2 Manual
4. Main configuration Commands You have the possibility toenable and disable some functionality on global basis. Just byclicking on the enabled icon you can change the configuration.
(a) Flap Detection. If a host or a service is changing state be-tween an ok and a non-ok state with high frequency, thehost or service is flapping and the alarms are suppressed.Monitor has the ability to detect flapping. Flap Detectioncan be enabled or disabled in this menu.
(b) Notifications. All status changes, from an ok to a non okand vice versa is a status change. All status changes cancreate notification to the configured contacts via emailor sms. In this menu the notifications can enabled ordisabled for the whole system.
(c) Event Handlers. Event handler is a function that enablesthe execution of commands whenever a state change oc-curs, one possible use for this is to automatically restarta process that has died. This is normally not used in op5Monitor. These can be enabled or disabled in this menu.
(d) Active Checks. When determining if a host or a serviceis ok Monitor performs an active check is. I.e. a plugin is executed for that host or service. This menu choiceenables or disables that function.
(e) Passive Check. Monitor has the ability to receive checkresults from the outside where the check initially was notperformed by Monitor. An example is SNMP traps whichare sent from a host. This menu choice enables or dis-ables the processing of these check results.
5. Monitoring Performance. This information box gives you in-formation about the op5 Monitor performance. For more in-formation se, Performance Info.
6. Network Health. This information box displays an overallsystem status for hosts and services. It changes color betweengreen and red depending on how good or bad the status is.
Copyright © op5 AB, www.op5.com. All rights reserved. 8
op5 Monitor 3.2 Manual
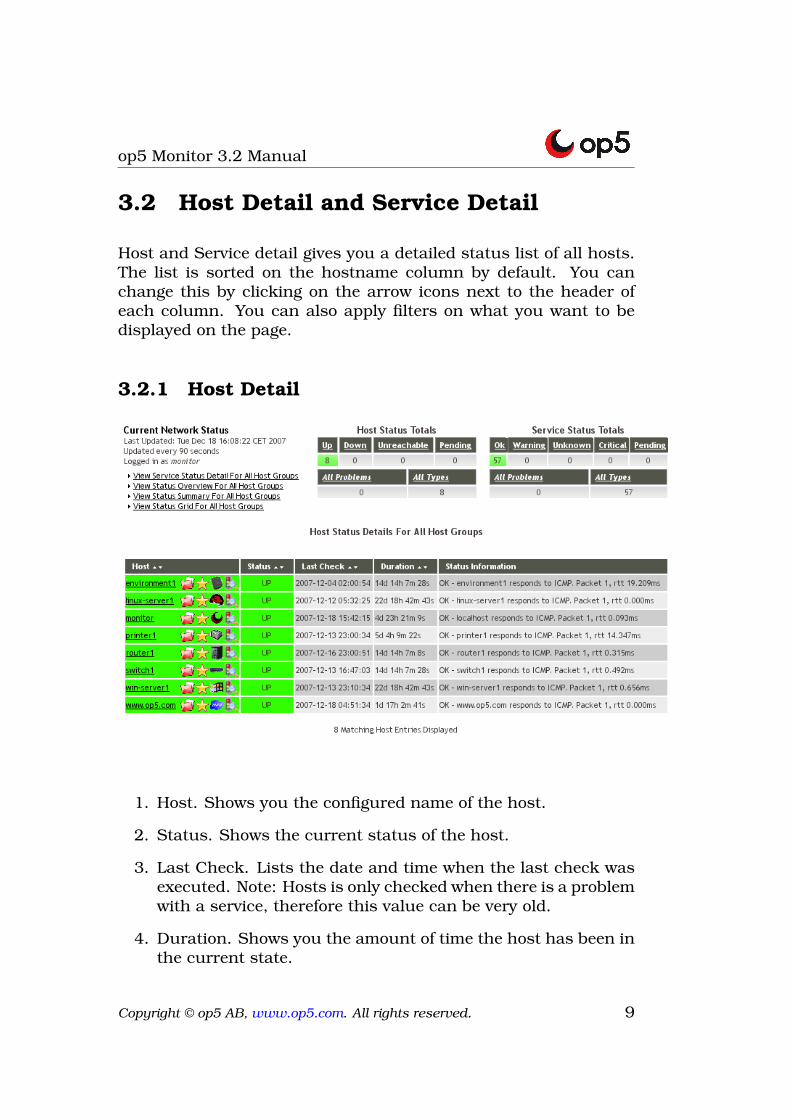
3.2 Host Detail and Service Detail
Host and Service detail gives you a detailed status list of all hosts.The list is sorted on the hostname column by default. You canchange this by clicking on the arrow icons next to the header ofeach column. You can also apply filters on what you want to bedisplayed on the page.
3.2.1 Host Detail
1. Host. Shows you the configured name of the host.
2. Status. Shows the current status of the host.
3. Last Check. Lists the date and time when the last check wasexecuted. Note: Hosts is only checked when there is a problemwith a service, therefore this value can be very old.
4. Duration. Shows you the amount of time the host has been inthe current state.
Copyright © op5 AB, www.op5.com. All rights reserved. 9

op5 Monitor 3.2 Manual
5. Status Information. Shows you the output of the host check.
Copyright © op5 AB, www.op5.com. All rights reserved. 10
op5 Monitor 3.2 Manual
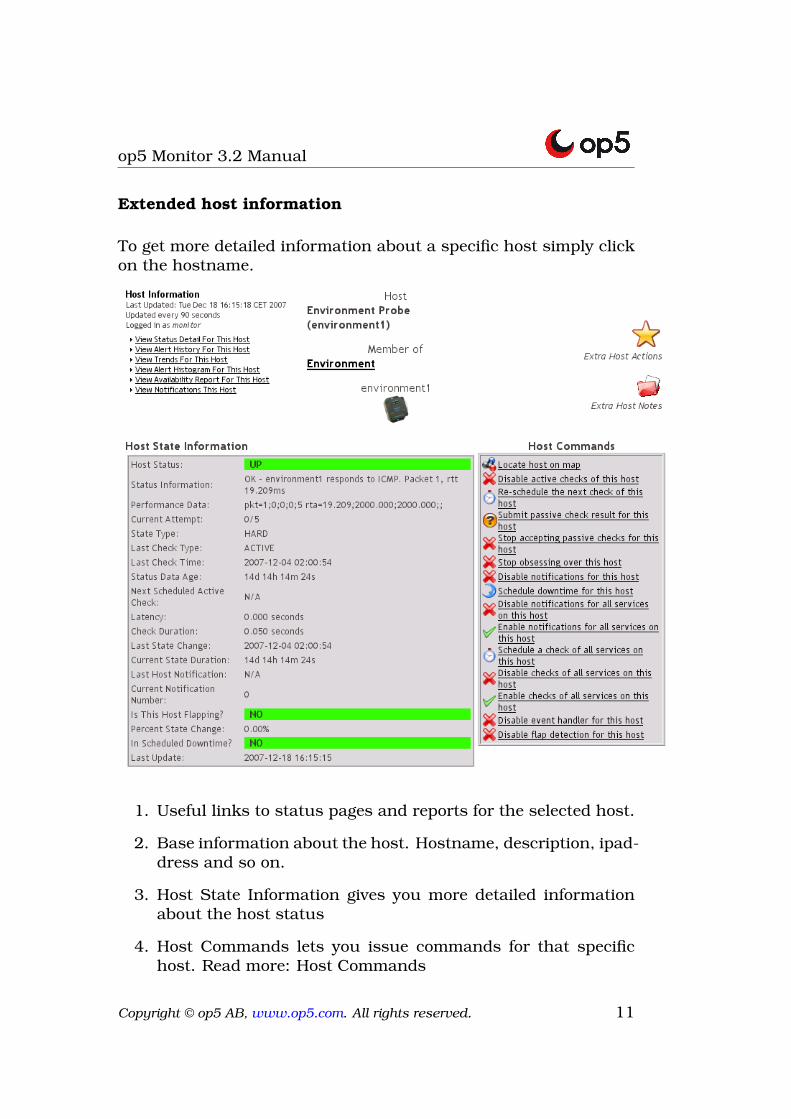
Extended host information
To get more detailed information about a specific host simply clickon the hostname.
1. Useful links to status pages and reports for the selected host.
2. Base information about the host. Hostname, description, ipad-dress and so on.
3. Host State Information gives you more detailed informationabout the host status
4. Host Commands lets you issue commands for that specifichost. Read more: Host Commands
Copyright © op5 AB, www.op5.com. All rights reserved. 11

op5 Monitor 3.2 Manual
5. Host Comments lets you add a comment for that specific host,it also lists all comments if there are any.
Copyright © op5 AB, www.op5.com. All rights reserved. 12
op5 Monitor 3.2 Manual
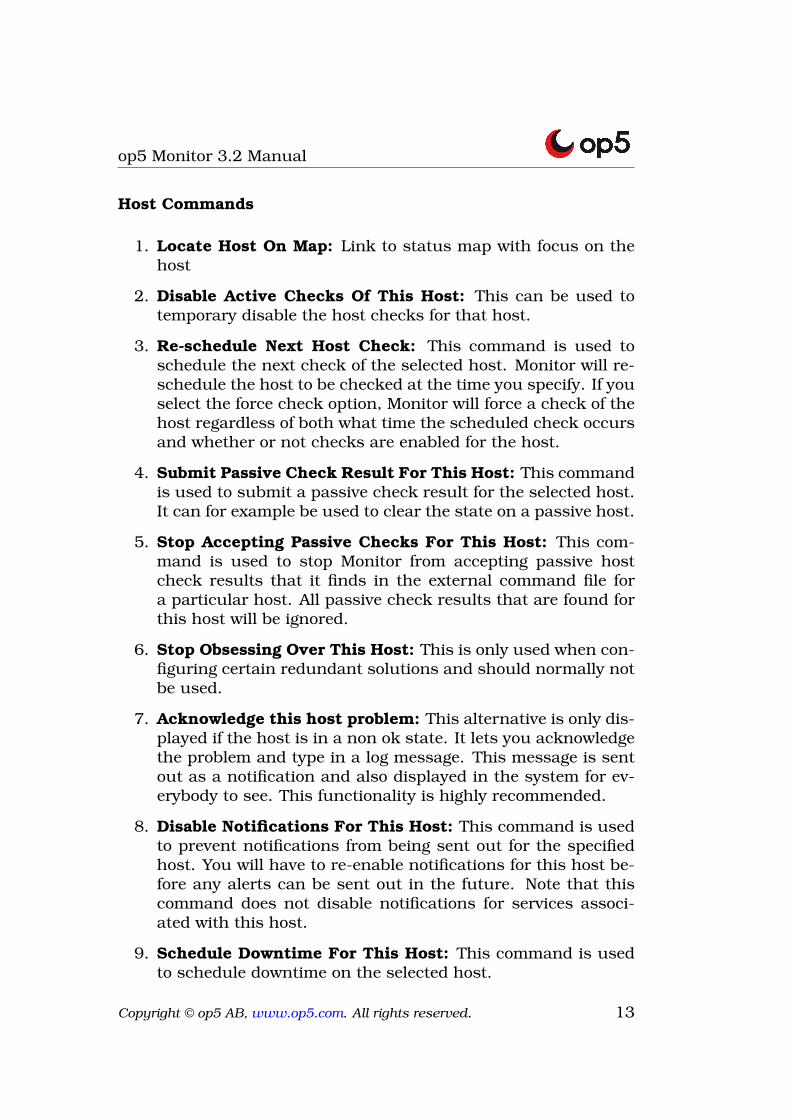
Host Commands
1. Locate Host On Map: Link to status map with focus on thehost
2. Disable Active Checks Of This Host: This can be used totemporary disable the host checks for that host.
3. Re-schedule Next Host Check: This command is used toschedule the next check of the selected host. Monitor will re-schedule the host to be checked at the time you specify. If youselect the force check option, Monitor will force a check of thehost regardless of both what time the scheduled check occursand whether or not checks are enabled for the host.
4. Submit Passive Check Result For This Host: This commandis used to submit a passive check result for the selected host.It can for example be used to clear the state on a passive host.
5. Stop Accepting Passive Checks For This Host: This com-mand is used to stop Monitor from accepting passive hostcheck results that it finds in the external command file fora particular host. All passive check results that are found forthis host will be ignored.
6. Stop Obsessing Over This Host: This is only used when con-figuring certain redundant solutions and should normally notbe used.
7. Acknowledge this host problem: This alternative is only dis-played if the host is in a non ok state. It lets you acknowledgethe problem and type in a log message. This message is sentout as a notification and also displayed in the system for ev-erybody to see. This functionality is highly recommended.
8. Disable Notifications For This Host: This command is usedto prevent notifications from being sent out for the specifiedhost. You will have to re-enable notifications for this host be-fore any alerts can be sent out in the future. Note that thiscommand does not disable notifications for services associ-ated with this host.
9. Schedule Downtime For This Host: This command is usedto schedule downtime on the selected host.
Copyright © op5 AB, www.op5.com. All rights reserved. 13
op5 Monitor 3.2 Manual
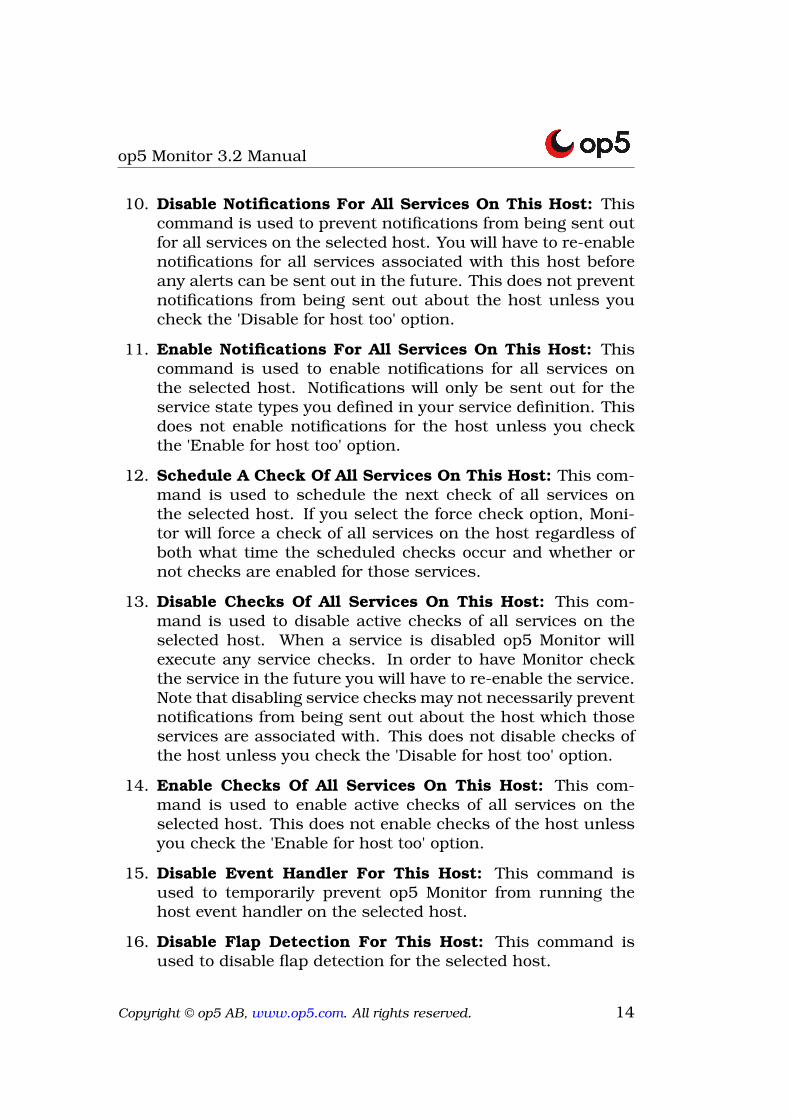
10. Disable Notifications For All Services On This Host: Thiscommand is used to prevent notifications from being sent outfor all services on the selected host. You will have to re-enablenotifications for all services associated with this host beforeany alerts can be sent out in the future. This does not preventnotifications from being sent out about the host unless youcheck the 'Disable for host too' option.
11. Enable Notifications For All Services On This Host: Thiscommand is used to enable notifications for all services onthe selected host. Notifications will only be sent out for theservice state types you defined in your service definition. Thisdoes not enable notifications for the host unless you checkthe 'Enable for host too' option.
12. Schedule A Check Of All Services On This Host: This com-mand is used to schedule the next check of all services onthe selected host. If you select the force check option, Moni-tor will force a check of all services on the host regardless ofboth what time the scheduled checks occur and whether ornot checks are enabled for those services.
13. Disable Checks Of All Services On This Host: This com-mand is used to disable active checks of all services on theselected host. When a service is disabled op5 Monitor willexecute any service checks. In order to have Monitor checkthe service in the future you will have to re-enable the service.Note that disabling service checks may not necessarily preventnotifications from being sent out about the host which thoseservices are associated with. This does not disable checks ofthe host unless you check the 'Disable for host too' option.
14. Enable Checks Of All Services On This Host: This com-mand is used to enable active checks of all services on theselected host. This does not enable checks of the host unlessyou check the 'Enable for host too' option.
15. Disable Event Handler For This Host: This command isused to temporarily prevent op5 Monitor from running thehost event handler on the selected host.
16. Disable Flap Detection For This Host: This command isused to disable flap detection for the selected host.
Copyright © op5 AB, www.op5.com. All rights reserved. 14
op5 Monitor 3.2 Manual
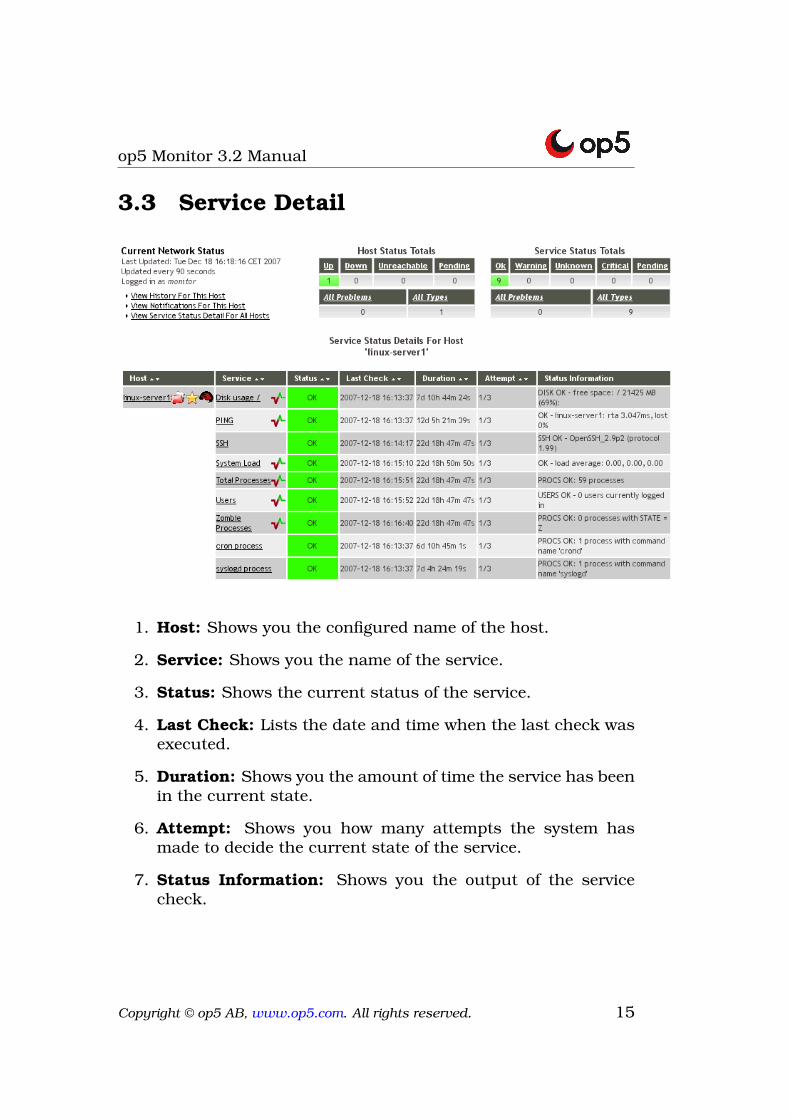
3.3 Service Detail
1. Host: Shows you the configured name of the host.
2. Service: Shows you the name of the service.
3. Status: Shows the current status of the service.
4. Last Check: Lists the date and time when the last check wasexecuted.
5. Duration: Shows you the amount of time the service has beenin the current state.
6. Attempt: Shows you how many attempts the system hasmade to decide the current state of the service.
7. Status Information: Shows you the output of the servicecheck.
Copyright © op5 AB, www.op5.com. All rights reserved. 15
op5 Monitor 3.2 Manual
3.3.1 op5 Monitor Simple Graphs
The output data from service checks can be parsed and displayedas graphs. Click on the graph icon that is displayed next to theservice name to see the graphs.
There are four graphs displayed – daily, weekly, monthly and yearly.
The graphs are generated using nagiosgraph from the performancedata output from the plugins. If you try running a plugin suchas /opt/plugins/check http manually, you will see that there is thedata that is presented in the webgui, followed by a pipe and moredetailed numbers.
It is these detailed numbers to the right of the pipe that is saved asperformance data, and later used to generate graphs.
If you wish to enable your own plugins to create graphs, you canlook at our map definitions in /opt/monitor/op5/nagiosgraph/mapand put your own defintions in the directory map custom/.
3.3.2 Extended service Information
To get more detailed information about a specific service simplyclick on the service name.
Copyright © op5 AB, www.op5.com. All rights reserved. 16
op5 Monitor 3.2 Manual
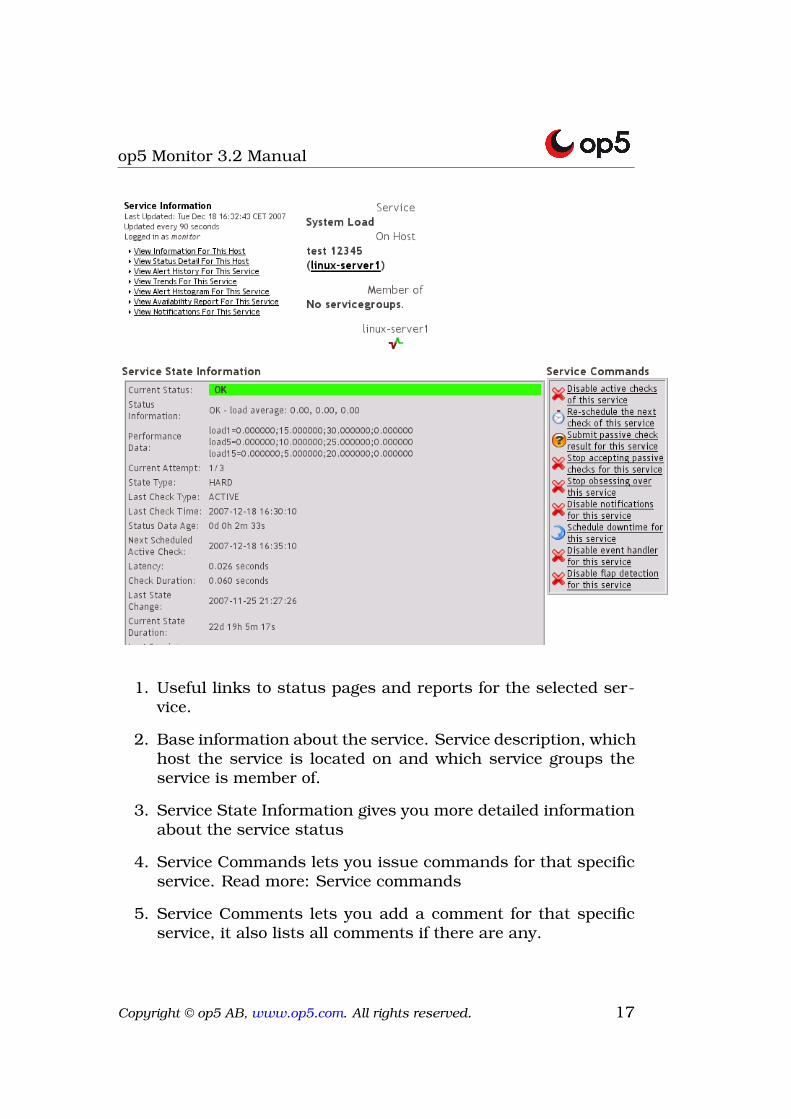
1. Useful links to status pages and reports for the selected ser-vice.
2. Base information about the service. Service description, whichhost the service is located on and which service groups theservice is member of.
3. Service State Information gives you more detailed informationabout the service status
4. Service Commands lets you issue commands for that specificservice. Read more: Service commands
5. Service Comments lets you add a comment for that specificservice, it also lists all comments if there are any.
Copyright © op5 AB, www.op5.com. All rights reserved. 17
op5 Monitor 3.2 Manual
3.3.3 Service commands
1. Disable Active Checks Of This Service: This can be used totemporary disable the checks for that service.
2. Re-schedule Next Service Check: This command is used toreschedule the next check of the selected service. op5 Moni-tor will re-schedule the service to be checked at the time youspecify. If you select the force check option, op5 Monitor willforce a check of the service regardless of both what time thescheduled check occurs and whether or not checks are en-abled.
3. Submit Passive Check Result For This Service: This com-mand is used to submit a passive check result for the selectedservice. It can for example be used to clear the state on a pas-sive service.
4. Stop Accepting Passive Checks For This Service: This com-mand is used to stop op5 Monitor from accepting passivecheck results for the selected service. All passive check re-sults that are found for service will be ignored.
5. Stop Obsessing Over This Service: This is only used whenconfiguring certain redundant solutions and should normallynot be used.
6. Acknowledge This Service Problem: This alternative is onlydisplayed if the host is in a non ok state. It lets you acknowl-edge the problem and type in a log message. This message issent out as a notification and also displayed in the system foreverybody to see. This functionality is highly recommended.
7. Disable Notifications For This Service: This command isused to prevent notifications from being sent out for the se-lected service. You will have to re-enable notifications for thisservice before any alerts can be sent out in the future. Thisdoes not prevent notifications from being sent out about thehost unless you check the 'Disable for host too' option.
8. Delay Next Service Notification: This command lets you de-lay the time until next notification is sent out. Normally op5Monitor is configured to only send out one notification when
Copyright © op5 AB, www.op5.com. All rights reserved. 18
op5 Monitor 3.2 Manual
a problem occurs but if you have configured reoccurring noti-fications you can use this command.
9. Schedule Downtime For This Service: This command isused to schedule downtime on the selected service.
10. Disable Event Handler For This Service: This command isused to temporarily prevent op5 Monitor from running thehost event handler on the selected service.
11. Disable Flap Detection For This Service: This command isused to disable flap detection for the selected host.
Copyright © op5 AB, www.op5.com. All rights reserved. 19
op5 Monitor 3.2 Manual
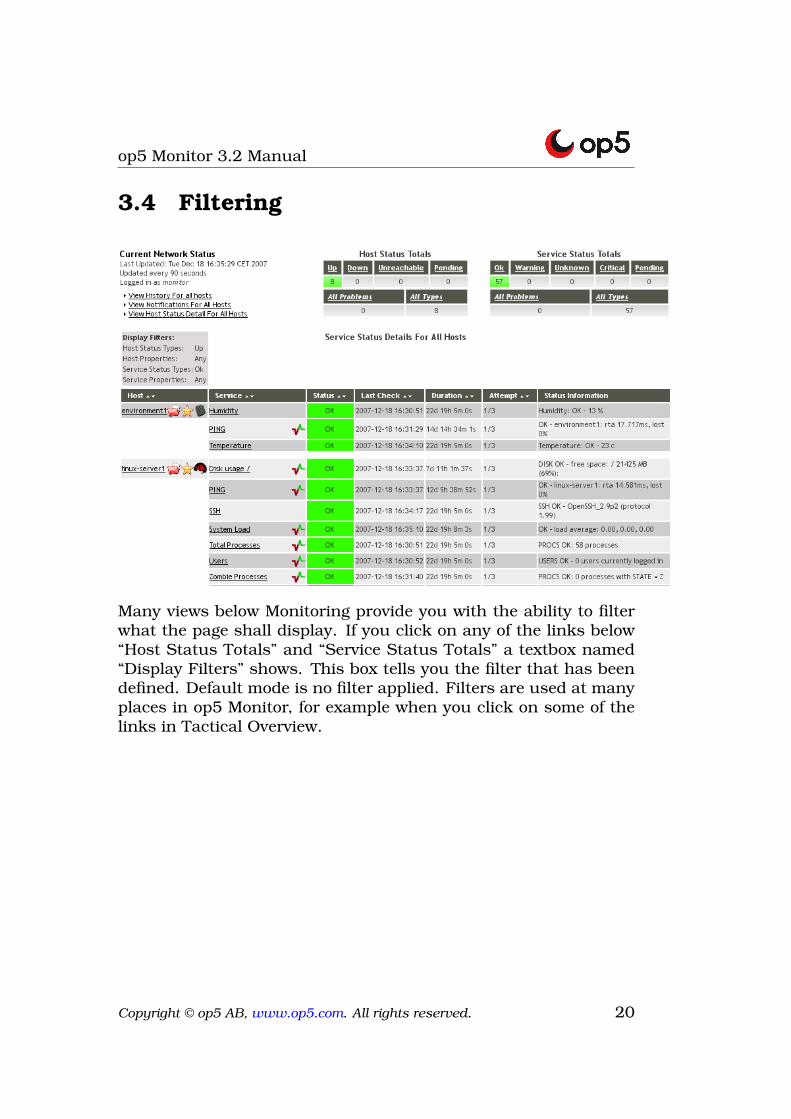
3.4 Filtering
Many views below Monitoring provide you with the ability to filterwhat the page shall display. If you click on any of the links below“Host Status Totals” and “Service Status Totals” a textbox named“Display Filters” shows. This box tells you the filter that has beendefined. Default mode is no filter applied. Filters are used at manyplaces in op5 Monitor, for example when you click on some of thelinks in Tactical Overview.
Copyright © op5 AB, www.op5.com. All rights reserved. 20
op5 Monitor 3.2 Manual
3.5 Host group Summary, Overview and Grid
A host group is used to group one or more hosts together for displaypurposes. You can for example create host groups to reflect thegeographical locations of your hosts or type of host. A host can bea member of several host groups.
The available views for host groups are:
• Host Group Summary
• Host Group Overview
• Host Group Grid
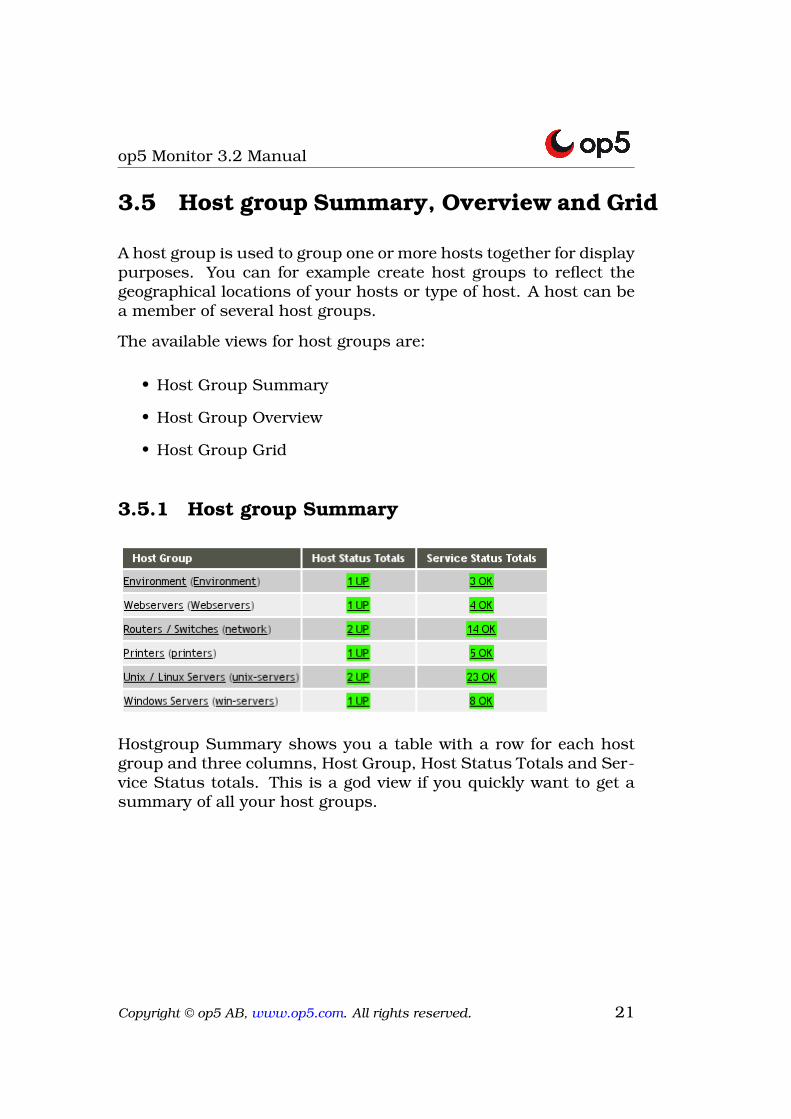
3.5.1 Host group Summary
Hostgroup Summary shows you a table with a row for each hostgroup and three columns, Host Group, Host Status Totals and Ser-vice Status totals. This is a god view if you quickly want to get asummary of all your host groups.
Copyright © op5 AB, www.op5.com. All rights reserved. 21
op5 Monitor 3.2 Manual
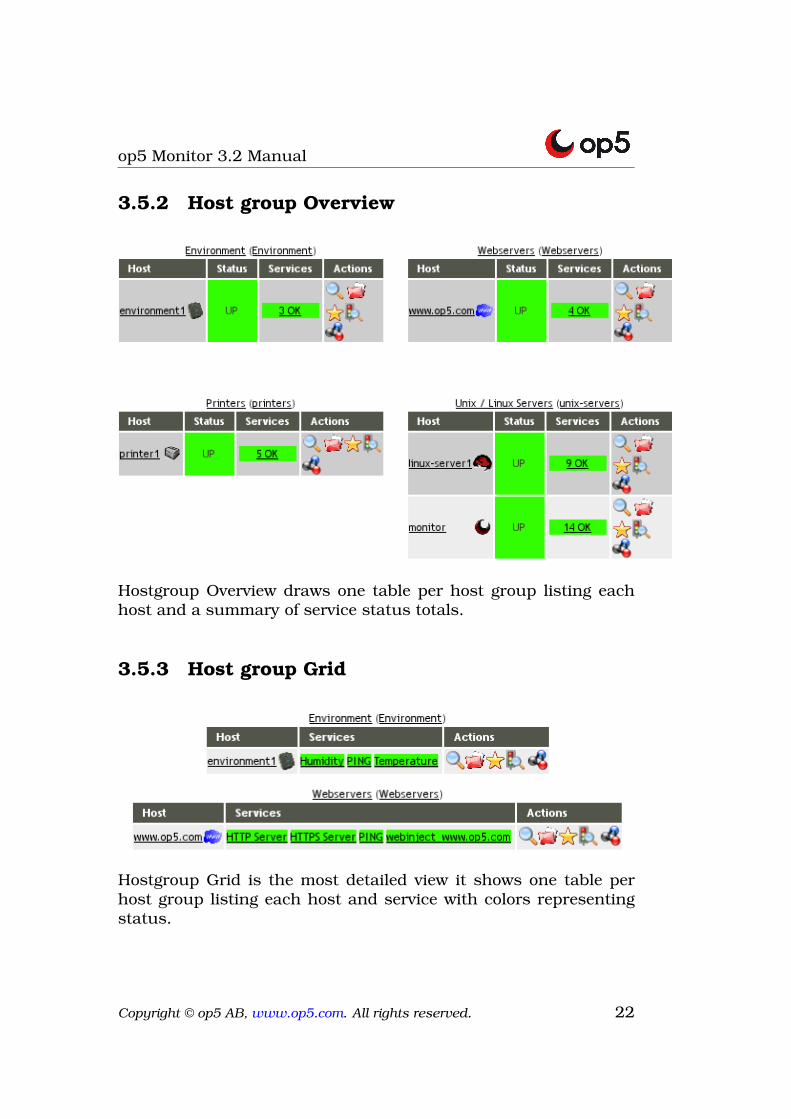
3.5.2 Host group Overview
Hostgroup Overview draws one table per host group listing eachhost and a summary of service status totals.
3.5.3 Host group Grid
Hostgroup Grid is the most detailed view it shows one table perhost group listing each host and service with colors representingstatus.
Copyright © op5 AB, www.op5.com. All rights reserved. 22
op5 Monitor 3.2 Manual
3.6 Service group Summary, Overview andGrid
A servicegroup definition is used to group one or more servicestogether for display purposes. You can for example create a groupand include all services related to a specific service you provide,process, disk usage, cpu usage, internet connectivity and so on.You can also create groups based on service type. A service can bea member of more than one service group. The service groups canalso be used when creating Availability reports.
The available views for service groups are:
3.6.1 Service group Summary
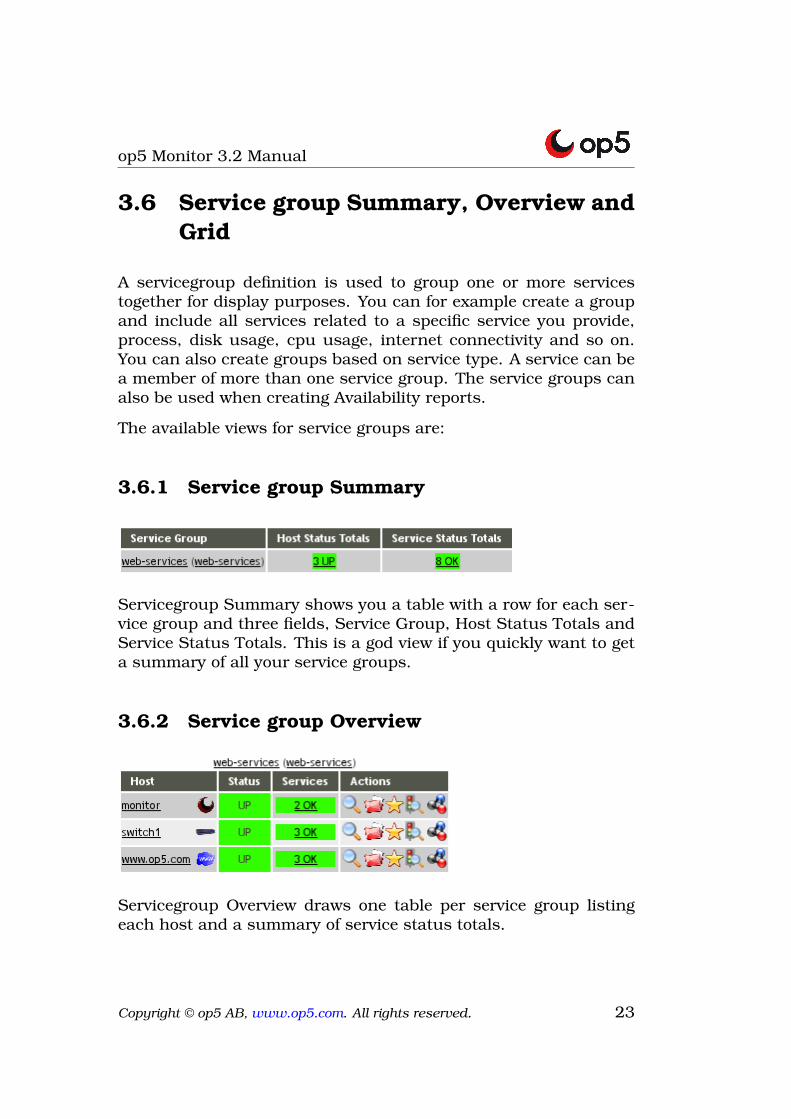
Servicegroup Summary shows you a table with a row for each ser-vice group and three fields, Service Group, Host Status Totals andService Status Totals. This is a god view if you quickly want to geta summary of all your service groups.
3.6.2 Service group Overview
Servicegroup Overview draws one table per service group listingeach host and a summary of service status totals.
Copyright © op5 AB, www.op5.com. All rights reserved. 23
op5 Monitor 3.2 Manual
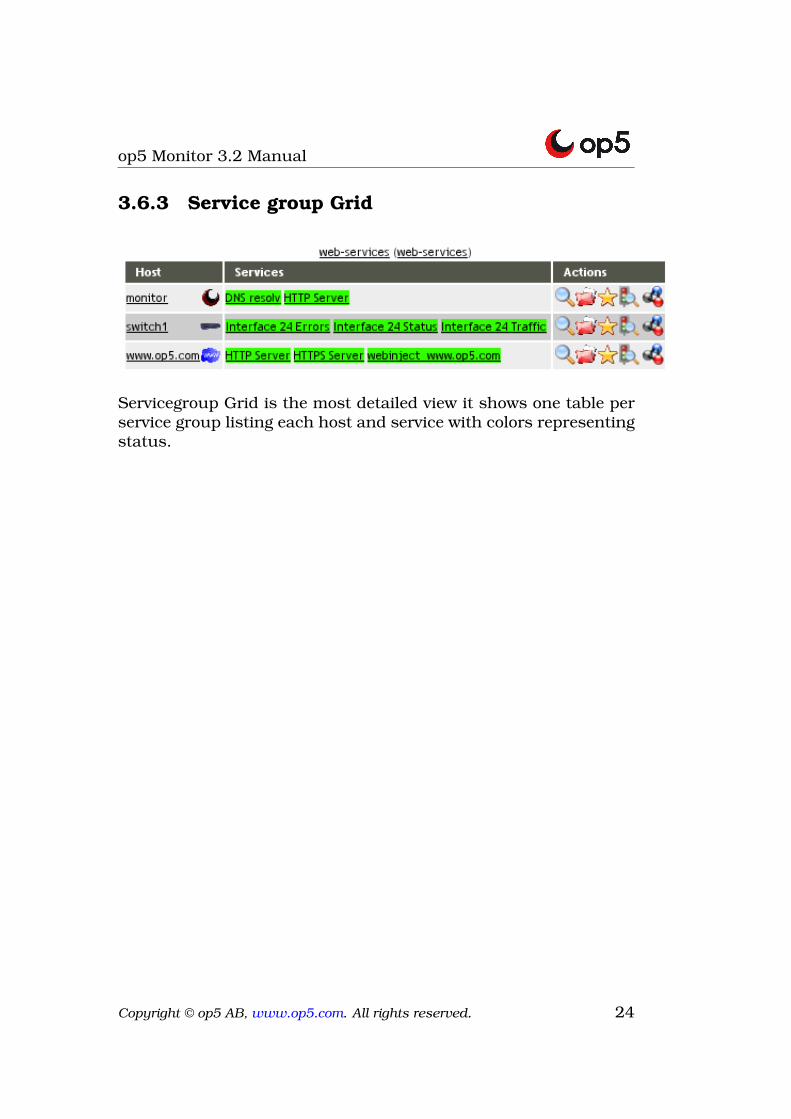
3.6.3 Service group Grid
Servicegroup Grid is the most detailed view it shows one table perservice group listing each host and service with colors representingstatus.
Copyright © op5 AB, www.op5.com. All rights reserved. 24
op5 Monitor 3.2 Manual
Chapter 4
Presentation Using Maps
4.1 Status Map
The Status Map gives you a graphical view of the network includingthe relations between the hosts. The Map also shows what parts ofthe network that is functional, non-functional and if there are anynetwork outages.
Copyright © op5 AB, www.op5.com. All rights reserved. 25
op5 Monitor 3.2 Manual
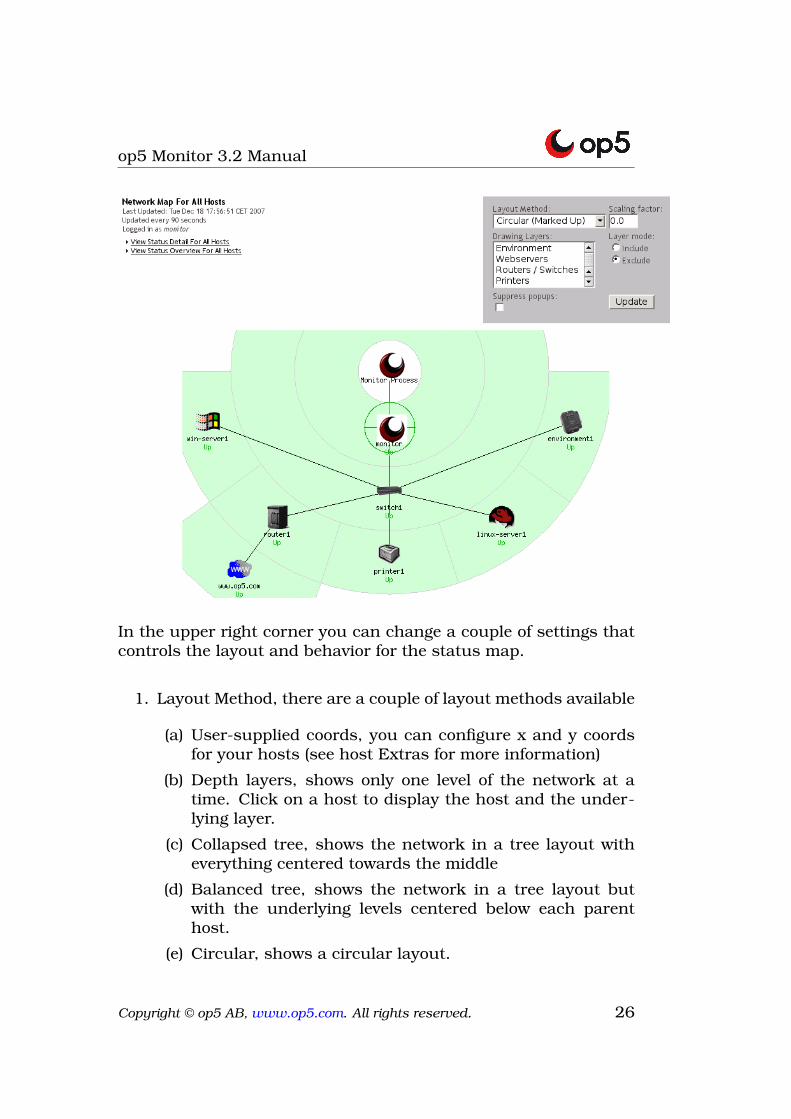
In the upper right corner you can change a couple of settings thatcontrols the layout and behavior for the status map.
1. Layout Method, there are a couple of layout methods available
(a) User-supplied coords, you can configure x and y coordsfor your hosts (see host Extras for more information)
(b) Depth layers, shows only one level of the network at atime. Click on a host to display the host and the under-lying layer.
(c) Collapsed tree, shows the network in a tree layout witheverything centered towards the middle
(d) Balanced tree, shows the network in a tree layout butwith the underlying levels centered below each parenthost.
(e) Circular, shows a circular layout.
Copyright © op5 AB, www.op5.com. All rights reserved. 26
op5 Monitor 3.2 Manual
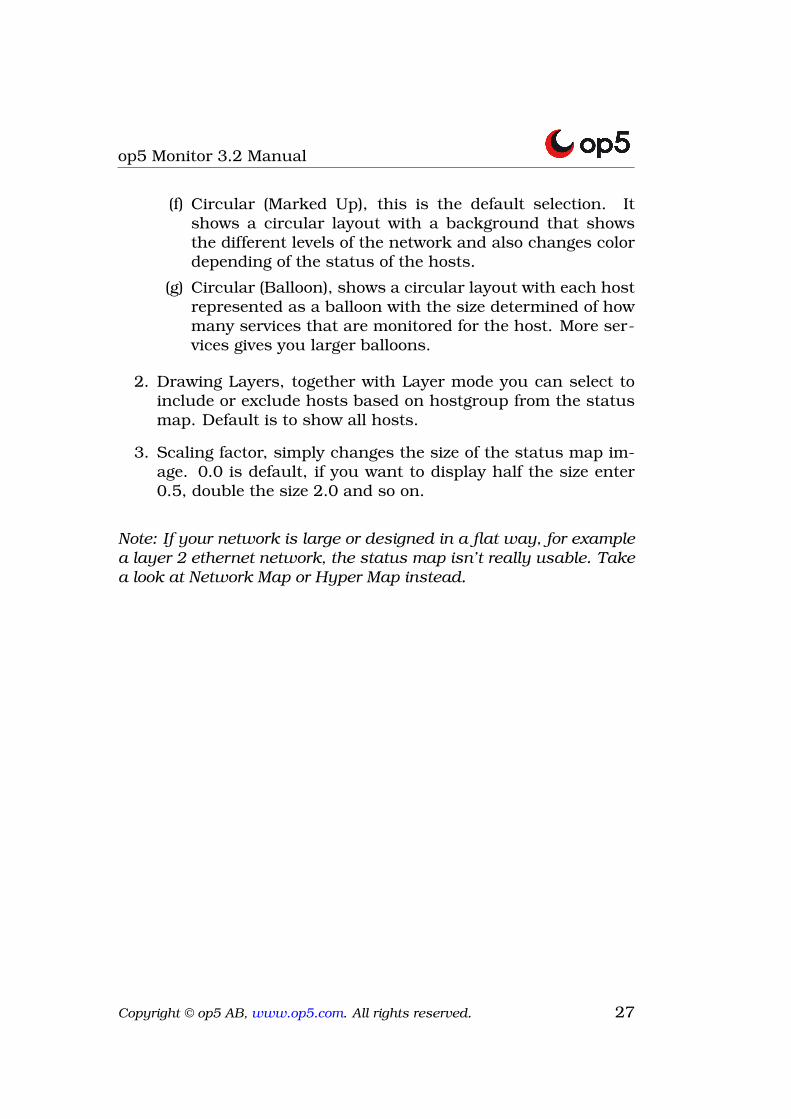
(f) Circular (Marked Up), this is the default selection. Itshows a circular layout with a background that showsthe different levels of the network and also changes colordepending of the status of the hosts.
(g) Circular (Balloon), shows a circular layout with each hostrepresented as a balloon with the size determined of howmany services that are monitored for the host. More ser-vices gives you larger balloons.
2. Drawing Layers, together with Layer mode you can select toinclude or exclude hosts based on hostgroup from the statusmap. Default is to show all hosts.
3. Scaling factor, simply changes the size of the status map im-age. 0.0 is default, if you want to display half the size enter0.5, double the size 2.0 and so on.
Note: If your network is large or designed in a flat way, for examplea layer 2 ethernet network, the status map isn’t really usable. Takea look at Network Map or Hyper Map instead.
Copyright © op5 AB, www.op5.com. All rights reserved. 27
op5 Monitor 3.2 Manual
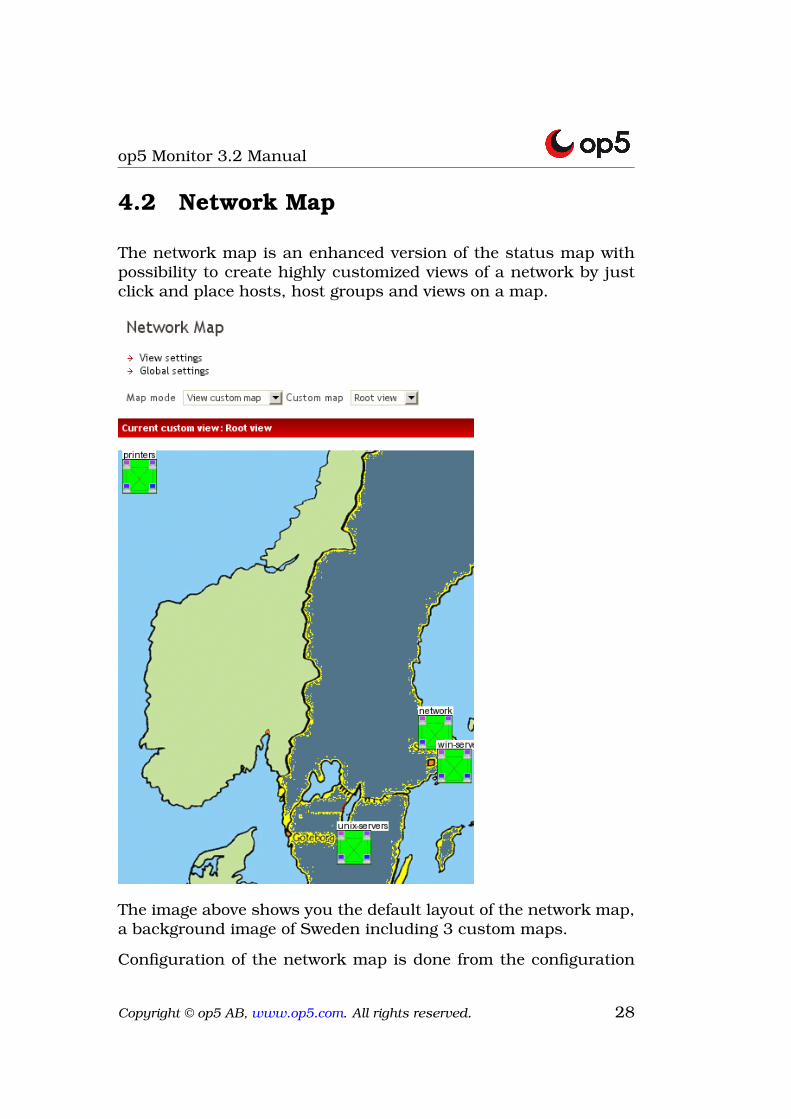
4.2 Network Map
The network map is an enhanced version of the status map withpossibility to create highly customized views of a network by justclick and place hosts, host groups and views on a map.
The image above shows you the default layout of the network map,a background image of Sweden including 3 custom maps.
Configuration of the network map is done from the configuration
Copyright © op5 AB, www.op5.com. All rights reserved. 28
op5 Monitor 3.2 Manual
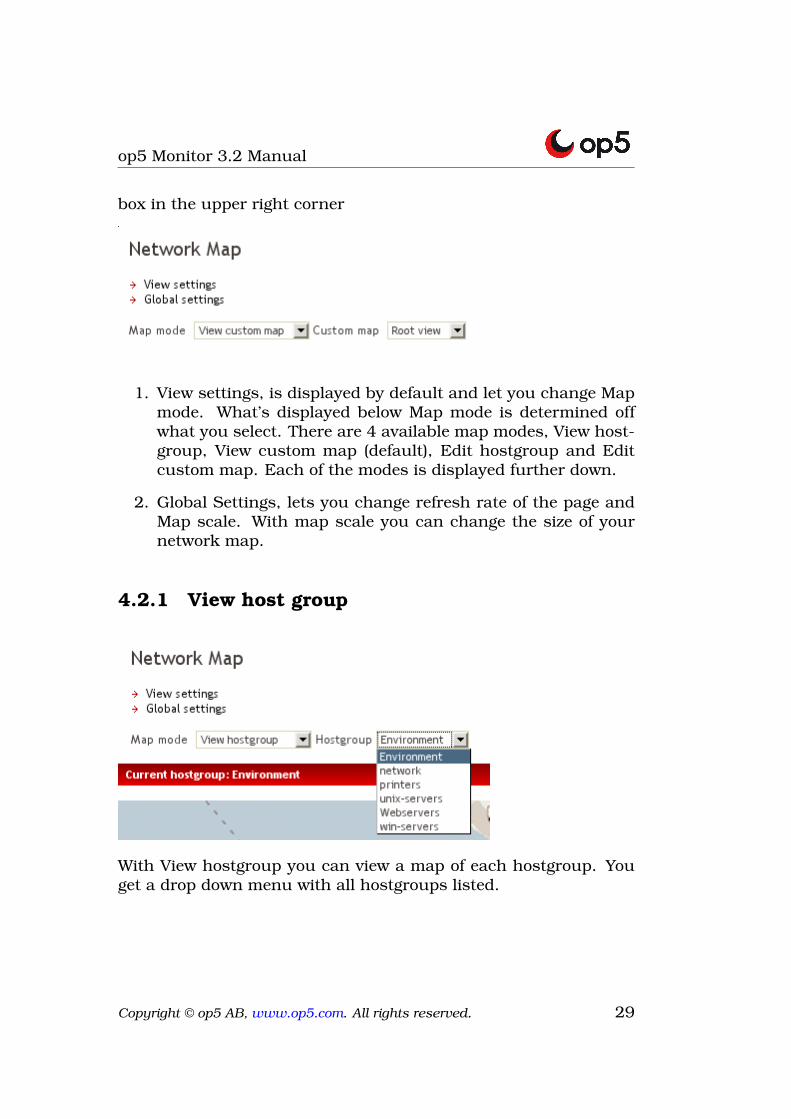
box in the upper right corner
1. View settings, is displayed by default and let you change Mapmode. What’s displayed below Map mode is determined offwhat you select. There are 4 available map modes, View host-group, View custom map (default), Edit hostgroup and Editcustom map. Each of the modes is displayed further down.
2. Global Settings, lets you change refresh rate of the page andMap scale. With map scale you can change the size of yournetwork map.
4.2.1 View host group
With View hostgroup you can view a map of each hostgroup. Youget a drop down menu with all hostgroups listed.
Copyright © op5 AB, www.op5.com. All rights reserved. 29
op5 Monitor 3.2 Manual
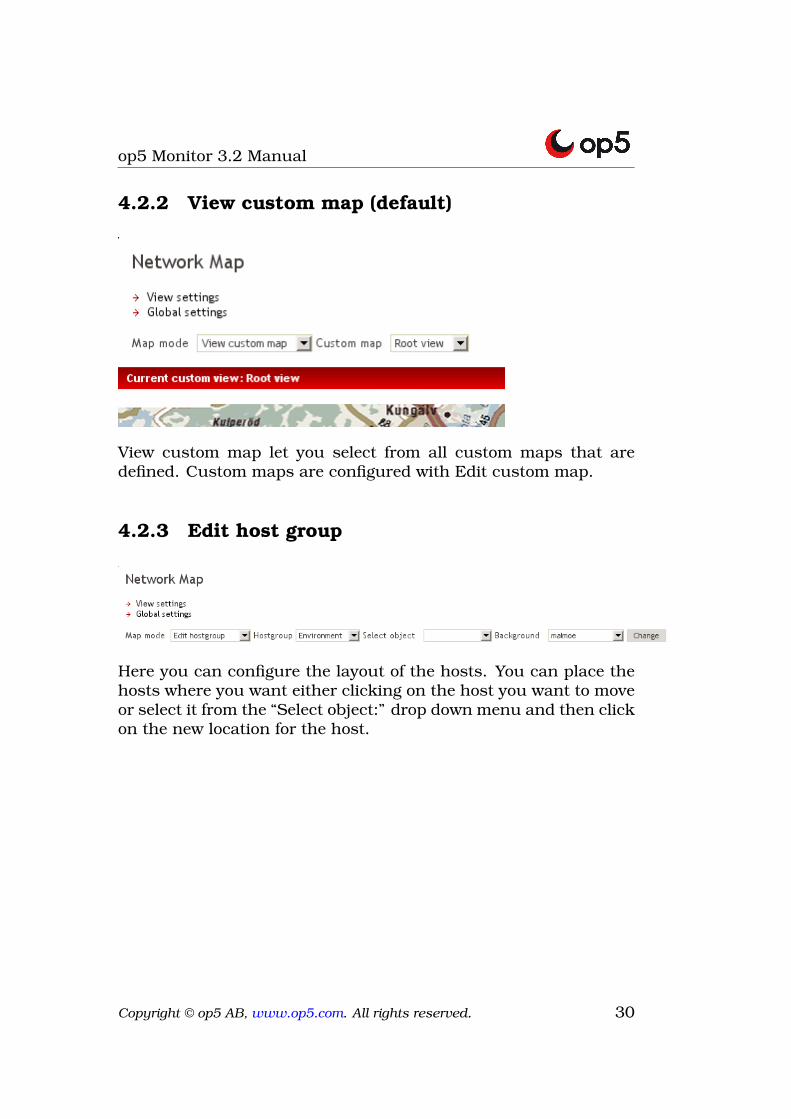
4.2.2 View custom map (default)
View custom map let you select from all custom maps that aredefined. Custom maps are configured with Edit custom map.
4.2.3 Edit host group
Here you can configure the layout of the hosts. You can place thehosts where you want either clicking on the host you want to moveor select it from the “Select object:” drop down menu and then clickon the new location for the host.
Copyright © op5 AB, www.op5.com. All rights reserved. 30
op5 Monitor 3.2 Manual
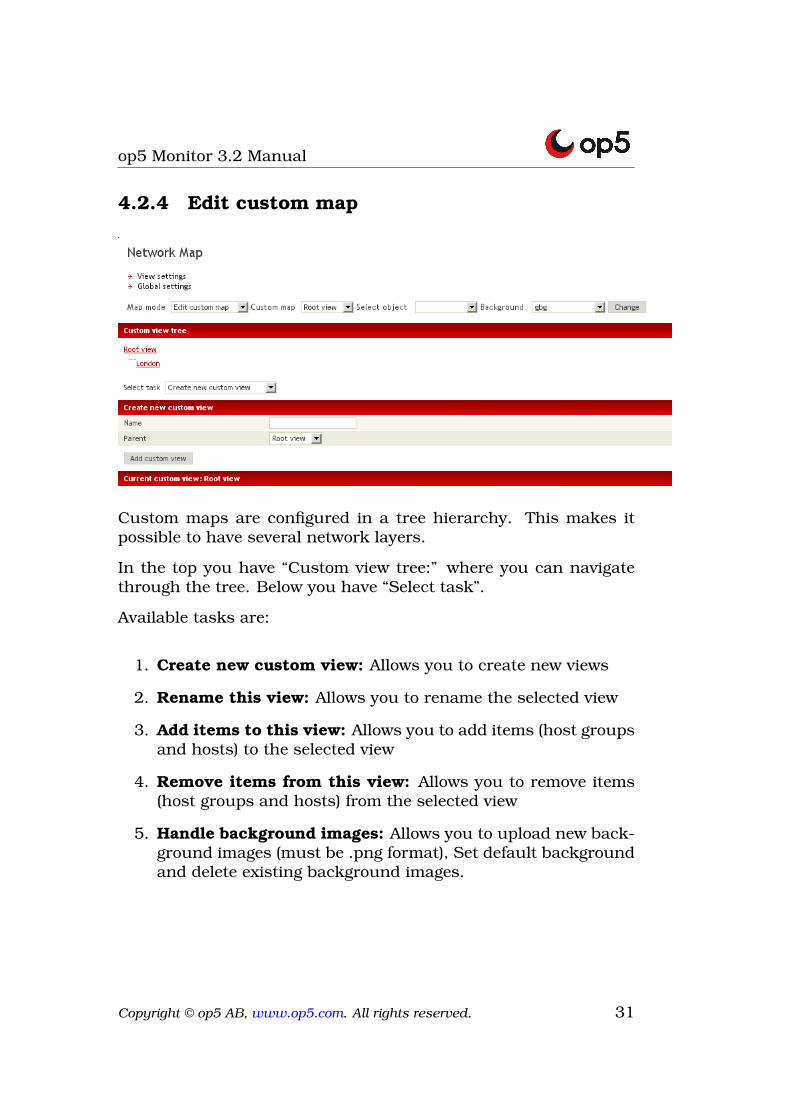
4.2.4 Edit custom map
Custom maps are configured in a tree hierarchy. This makes itpossible to have several network layers.
In the top you have “Custom view tree:” where you can navigatethrough the tree. Below you have “Select task”.
Available tasks are:
1. Create new custom view: Allows you to create new views
2. Rename this view: Allows you to rename the selected view
3. Add items to this view: Allows you to add items (host groupsand hosts) to the selected view
4. Remove items from this view: Allows you to remove items(host groups and hosts) from the selected view
5. Handle background images: Allows you to upload new back-ground images (must be .png format), Set default backgroundand delete existing background images.
Copyright © op5 AB, www.op5.com. All rights reserved. 31
op5 Monitor 3.2 Manual
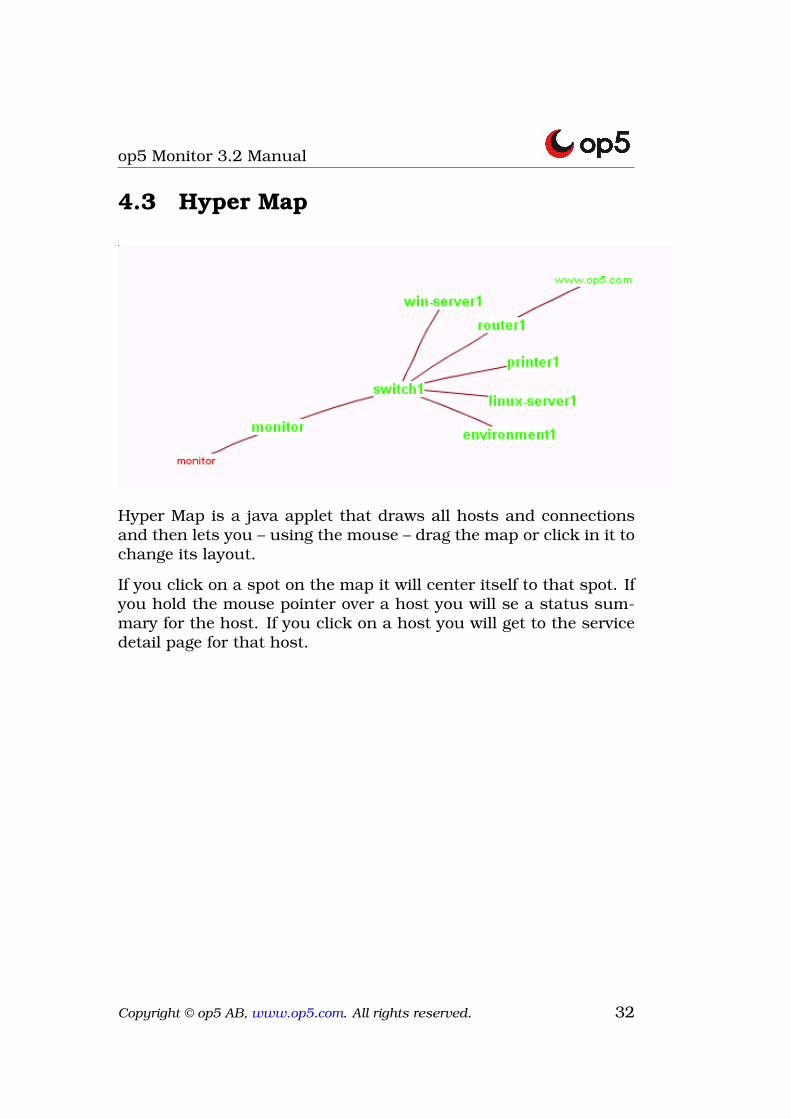
4.3 Hyper Map
Hyper Map is a java applet that draws all hosts and connectionsand then lets you – using the mouse – drag the map or click in it tochange its layout.
If you click on a spot on the map it will center itself to that spot. Ifyou hold the mouse pointer over a host you will se a status sum-mary for the host. If you click on a host you will get to the servicedetail page for that host.
Copyright © op5 AB, www.op5.com. All rights reserved. 32
op5 Monitor 3.2 Manual
Chapter 5
Problem Views for Work Flow
5.1 Network Outages
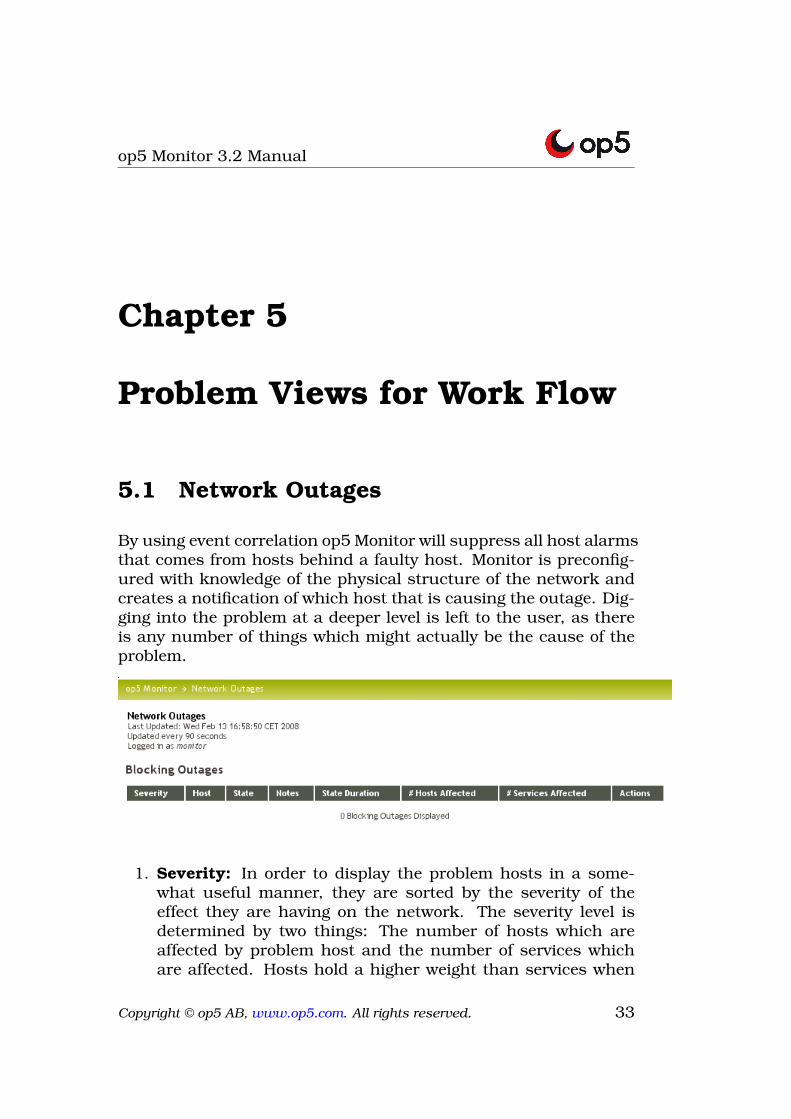
By using event correlation op5 Monitor will suppress all host alarmsthat comes from hosts behind a faulty host. Monitor is preconfig-ured with knowledge of the physical structure of the network andcreates a notification of which host that is causing the outage. Dig-ging into the problem at a deeper level is left to the user, as thereis any number of things which might actually be the cause of theproblem.
1. Severity: In order to display the problem hosts in a some-what useful manner, they are sorted by the severity of theeffect they are having on the network. The severity level isdetermined by two things: The number of hosts which areaffected by problem host and the number of services whichare affected. Hosts hold a higher weight than services when
Copyright © op5 AB, www.op5.com. All rights reserved. 33
op5 Monitor 3.2 Manual
it comes to calculating severity. The current code sets thisweight ratio at 4:1 (i.e. hosts are 4 times more important thanindividual services).
2. Host: Name of the host causing the network outage
3. State: State of the host
4. Notes: Link to comments for the host, if there are no com-ments N/A is displayed
5. State Duration: For how long has the outage been going on
6. Hosts Affected: Number of hosts affected by the outage
7. Services Affected: Number of services affected by the outage
8. Actions: A couple of icons that links you to different statuspages. For a full list of icons and images se .
5.2 Host Problems
The host problems view is similar to the Host Detail view. Thedifference is the display of status, The host problems view onlyshows hosts in a non ok state.
Copyright © op5 AB, www.op5.com. All rights reserved. 34

op5 Monitor 3.2 Manual
5.3 Service Problems
The service problems view is similar to the Service Detail view. Thedifference is the display of status, service problems only showsservices in a non ok state.
5.4 Unhandled Problems
Unhandled problems show all problems that is not in scheduleddowntime, or has not been acknowledged as stated in the DisplayFilter info box.
The idea of this view is that is should give the user a good view ofnew problems that hasn’t been taken care of. Unhandled Problemsis a good status view for helpdesk staff.
5.5 Show Host
Simple search box that let you search for a host by typing the initialletters of the host name in the field that says “show host” in themain menu. Press enter and the host and its services detail will beshown.
Note: This is really a simple search, it will only show the first matchand the search is case sensitive.
Copyright © op5 AB, www.op5.com. All rights reserved. 35
op5 Monitor 3.2 Manual
5.6 Comments
All hosts and services can have one or more comments related toit. A comment is a free text note of your choice.
Host name: The host the comment is related to.
Service: The service the comment is related to.
Entry Time: Date and time when the comment was added.
Author: The author of the comment.
Comment: The comment itself.
Comment ID: A Unique ID number for the comment, it can beused as a reference number.
Persistent: If the comment is persistent or not. Comments thatare not persistent will be removed if the op5 Monitor system isrestarted.
Type: What kind of comment, User, System or acknowledgement.
Expires: This is only used for comments automatically added bythe system such as scheduled downtime or flapping comments.
Actions: Possibility to delete a comment.
5.7 Downtime
Using scheduled downtime enables you to plan for system workahead. When a host or service is scheduled for downtime op5 Mon-itor suppresses alarms for that host or service. Furthermore op5Monitor informs you about when a host or service is scheduled fordowntime through the web interface. Information about the sched-uled downtime is also stored in the logs so that planned systemwork does not affect availability reports (read more on Availability).
It is possible to schedule downtime for hosts, services, entire hostgroups and service groups. You can also configure triggered down-time for hosts located below a host currently during scheduleddowntime.
Copyright © op5 AB, www.op5.com. All rights reserved. 36
op5 Monitor 3.2 Manual
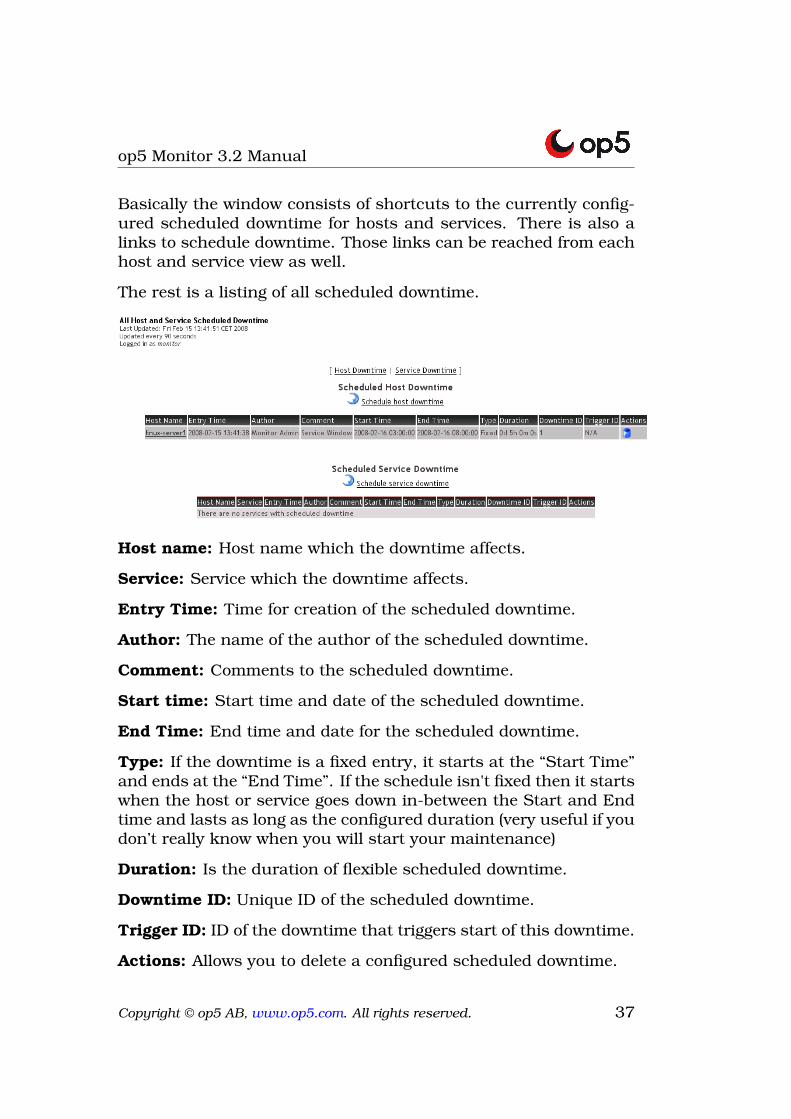
Basically the window consists of shortcuts to the currently config-ured scheduled downtime for hosts and services. There is also alinks to schedule downtime. Those links can be reached from eachhost and service view as well.
The rest is a listing of all scheduled downtime.
Host name: Host name which the downtime affects.
Service: Service which the downtime affects.
Entry Time: Time for creation of the scheduled downtime.
Author: The name of the author of the scheduled downtime.
Comment: Comments to the scheduled downtime.
Start time: Start time and date of the scheduled downtime.
End Time: End time and date for the scheduled downtime.
Type: If the downtime is a fixed entry, it starts at the “Start Time”and ends at the “End Time”. If the schedule isn't fixed then it startswhen the host or service goes down in-between the Start and Endtime and lasts as long as the configured duration (very useful if youdon’t really know when you will start your maintenance)
Duration: Is the duration of flexible scheduled downtime.
Downtime ID: Unique ID of the scheduled downtime.
Trigger ID: ID of the downtime that triggers start of this downtime.
Actions: Allows you to delete a configured scheduled downtime.
Copyright © op5 AB, www.op5.com. All rights reserved. 37
op5 Monitor 3.2 Manual
Chapter 6
Runtime Status
6.1 Process Info
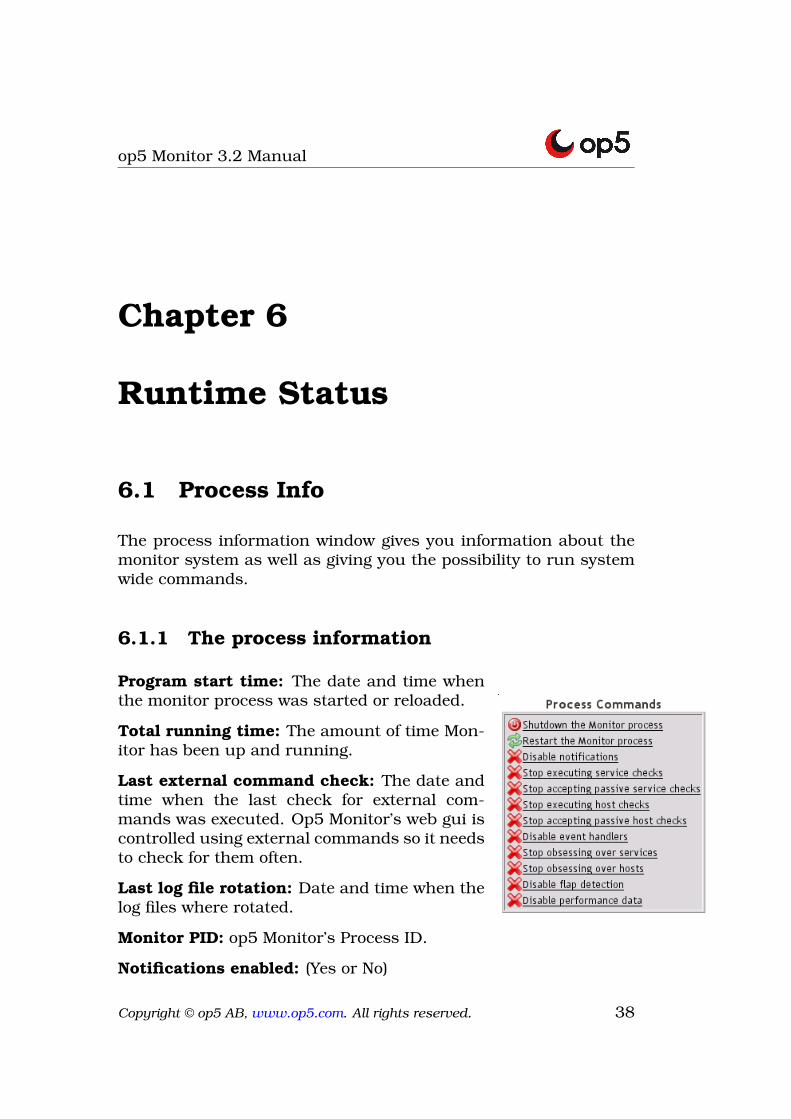
The process information window gives you information about themonitor system as well as giving you the possibility to run systemwide commands.
6.1.1 The process information
Program start time: The date and time whenthe monitor process was started or reloaded.
Total running time: The amount of time Mon-itor has been up and running.
Last external command check: The date andtime when the last check for external com-mands was executed. Op5 Monitor’s web gui iscontrolled using external commands so it needsto check for them often.
Last log file rotation: Date and time when thelog files where rotated.
Monitor PID: op5 Monitor’s Process ID.
Notifications enabled: (Yes or No)
Copyright © op5 AB, www.op5.com. All rights reserved. 38
op5 Monitor 3.2 Manual
Service Checks Being Executed: (Yes or No)
Passive service checks being accepted: (Yes or No)
Host check being executed: (Yes or No)
Passive host checks being accepted: (Yes or No)
Event handler enabled: (Yes or No)
Obsessing over services: (Yes or No)
Obsessing over hosts: (Yes or No)
Flap Detection enabled: (Yes or No)
Performance data being processed: (Yes or No)
6.1.2 Process Commands
Shutdown the Monitor Process: Shutdown the Monitor program.Be aware that to start the process again you need to access thesystem by console or SSH.
You can find more information about accessing the linux terminalin op5 System manual.
Restart the Monitor Process: The op5 Monitor process stops andstarts again.
Disable Notifications: All notifications are disabled.
Stop executing service checks: This will cause op5 Monitor tostop all execution of all service checks.
Stop accepting passive service checks: This will cause op5 Mon-itor to stop accepting all passive service checks.
Stop executing host checks: This will cause op5 Monitor to stopall execution of host checks.
Stop accepting passive host checks: This will cause op5 Monitorto stop receiving external host checks.
Disable event handlers: This will cause op5 Monitor to disableevent handling (automatic reaction to events).
Copyright © op5 AB, www.op5.com. All rights reserved. 39
op5 Monitor 3.2 Manual
Start obsessing over services: Only used in certain redundantsetups.
Start obsessing over hosts: Only used in certain redundant se-tups.
Disable flap detection: Disable the detection of hosts and servicespending between different states.
Enable performance data: Storage of performance data for hostsand services.
Copyright © op5 AB, www.op5.com. All rights reserved. 40
op5 Monitor 3.2 Manual
6.2 Performance Info
op5 Monitor gives you detailed information about its performance.
6.2.1 Active Service Checks
The textbox to the left shows you how manyactive service checks the system has done ina time frame of 1 minute, 5 minutes, 15 min-utes, 1 hour and since program start. Anactive check is a check that op5 Monitor hasscheduled and executed it self. Read moreabout Passive Service Checks below. Thevalues can be used to get an idea of how op5Monitor is performing. If you have configured a default check in-terval of five minutes you should have a value close to 100%.
The textbox to the right shows:
1. Check Execution Time: This is the time it takes for op5 Mon-itor to execute its checks. The average value should be fairlylow, close to one second in most cases.
2. Check Latency: This value tells you how far behind the systemis when scheduling its checks. The average value should befairly close to zero.
3. Percent State Change: This is a quite interesting number. Ittells you the stability of the monitored infrastructure. If theaverage value is high it tells you that a lot of things in yourinfrastructure are changing state. If the value is low it canmean that everything is constantly up or down.
6.2.2 Passive Service Checks
The textbox to the right shows you how many passive service checksthe system has done in a time frame of 1 minute, 5 minutes, 15minutes, 1 hour and since program start. A passive service check
Copyright © op5 AB, www.op5.com. All rights reserved. 41
op5 Monitor 3.2 Manual
is a check where the check result has been delivered to op5 Mon-itor from an external source, for example a script. Normally mostchecks are Active Service Checks so the values can be quite low orequal to zero.
6.2.3 Active Host Checks
The textbox to the left shows you how many active host checksthe system has done in a time frame of 1 minute, 5 minutes, 15minutes, 1 hour and since program start. An active host check isa check that op5 Monitor has scheduled and executed it self. Readmore about Passive Host Checks below. Host checks are normallynot scheduled to be checked at a certain interval, default behavioris that op5 Monitor only executes host checks if there is a problemwith one of the hosts services. The values in this box can thereforenot be used as a performance measurement.
Note that if you have a lot of active hosts checks executed thenyou probably have an unstable network and a large “percent statechange” value.
6.2.4 Passive Host Checks
The textbox to the right shows you how many passive host checksthe system has done in a time frame of 1 minute, 5 minutes, 15minutes, 1 hour and since program start. A passive host check isa check where the check result has been delivered to op5 Monitorfrom an external source, for example a script. Normally most hostchecks are Active Service Checks.
Copyright © op5 AB, www.op5.com. All rights reserved. 42
op5 Monitor 3.2 Manual
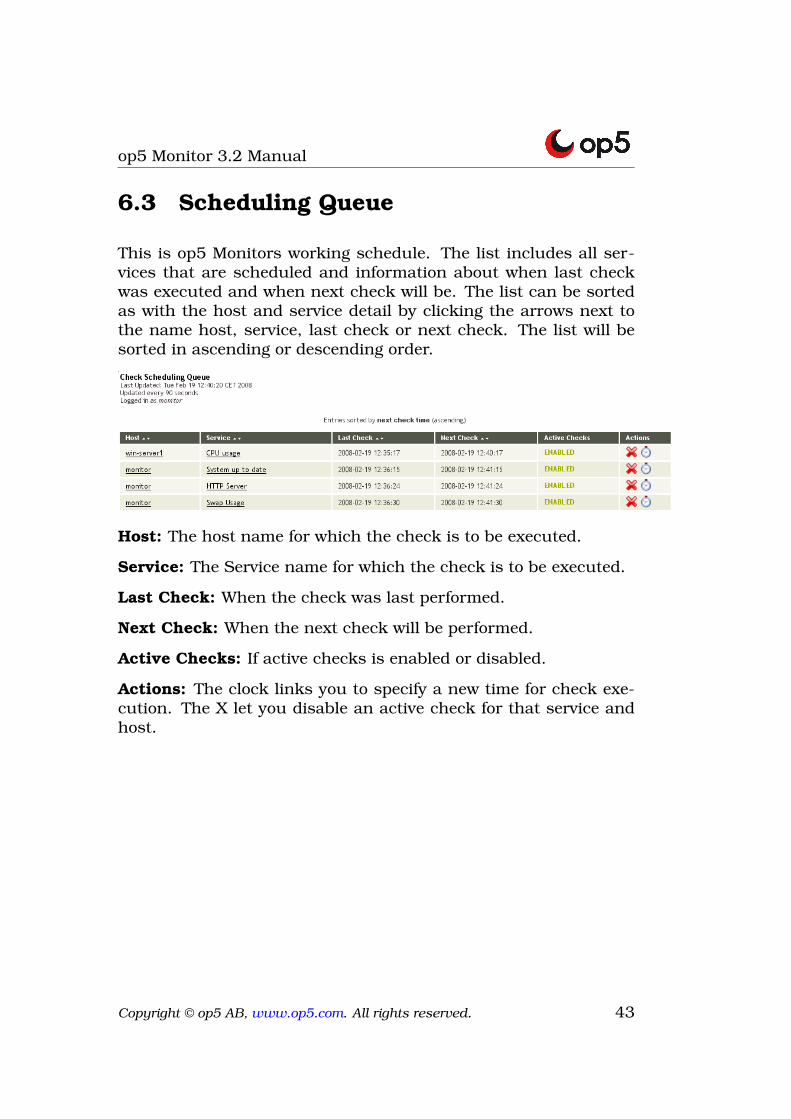
6.3 Scheduling Queue
This is op5 Monitors working schedule. The list includes all ser-vices that are scheduled and information about when last checkwas executed and when next check will be. The list can be sortedas with the host and service detail by clicking the arrows next tothe name host, service, last check or next check. The list will besorted in ascending or descending order.
Host: The host name for which the check is to be executed.
Service: The Service name for which the check is to be executed.
Last Check: When the check was last performed.
Next Check: When the next check will be performed.
Active Checks: If active checks is enabled or disabled.
Actions: The clock links you to specify a new time for check exe-cution. The X let you disable an active check for that service andhost.
Copyright © op5 AB, www.op5.com. All rights reserved. 43
op5 Monitor 3.2 Manual
Chapter 7
Reporting Web Menu
7.0.1 Reporting
The Monitoring headline basically covers everything in op5 Mon-itor that is happening in real time. It shows you the status onyour hosts and services right now. The Reporting headline is aboutletting the user create historical reports from the information thatop5 Monitor has collected.
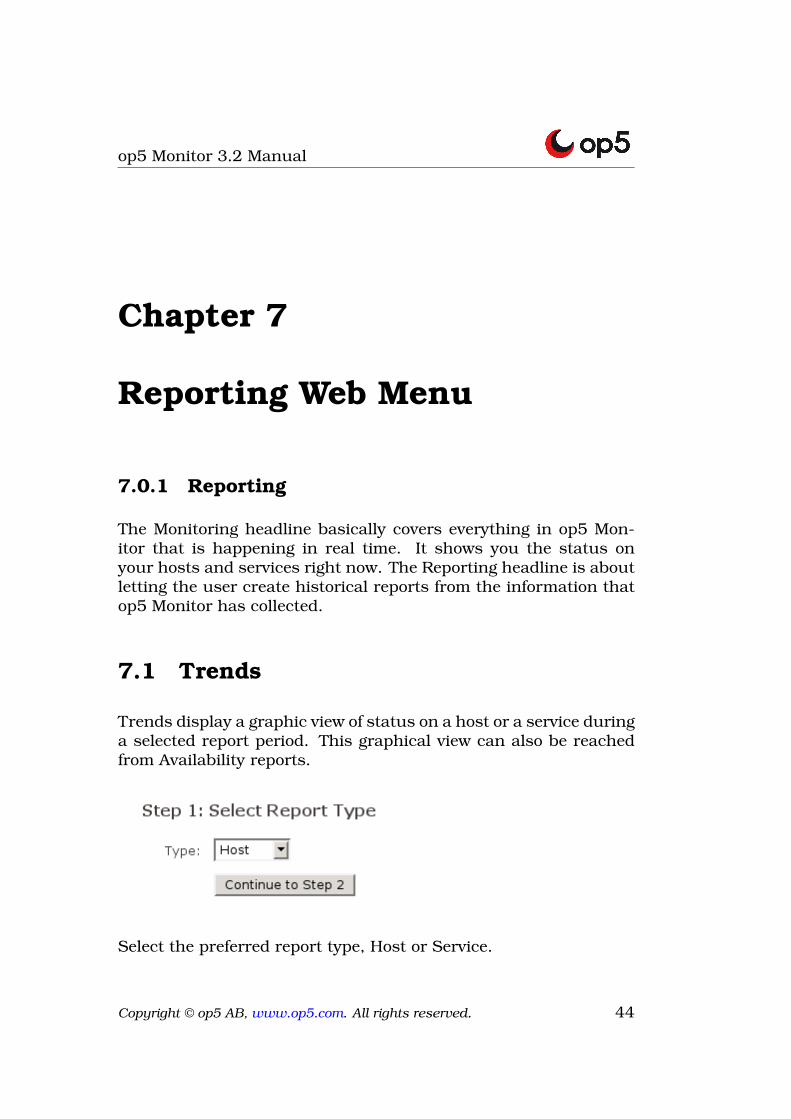
7.1 Trends
Trends display a graphic view of status on a host or a service duringa selected report period. This graphical view can also be reachedfrom Availability reports.
Select the preferred report type, Host or Service.
Copyright © op5 AB, www.op5.com. All rights reserved. 44
op5 Monitor 3.2 Manual
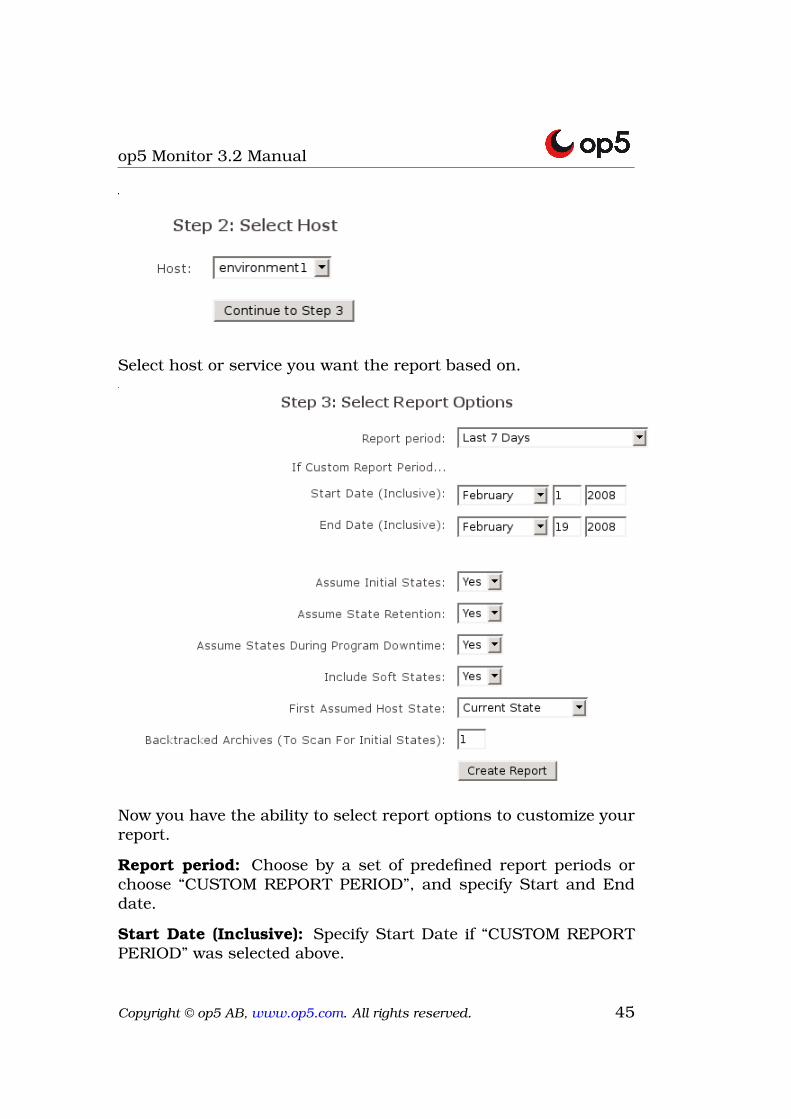
Select host or service you want the report based on.
Now you have the ability to select report options to customize yourreport.
Report period: Choose by a set of predefined report periods orchoose “CUSTOM REPORT PERIOD”, and specify Start and Enddate.
Start Date (Inclusive): Specify Start Date if “CUSTOM REPORTPERIOD” was selected above.
Copyright © op5 AB, www.op5.com. All rights reserved. 45
op5 Monitor 3.2 Manual
End Date (Inclusive): Specify End Date if “CUSTOM REPORT PE-RIOD” was selected above.
Assume Initial States: Whether to assume logging of initial statesor not. Default values are YES. For advanced users the valuecan be modified by editing the nagios.cfg config file located in the/opt/monitor/etc directory.
Assume State Retention: Whether to assume state retention ornot. State retention determines if op5 Monitor should retain thestates of hosts and services between program restarts. Default isYES. For advanced users the value can be modified by editing thenagios.cfg config file located in the /opt/monitor/etc directory.
Assume States During Program Downtime: If op5 Monitor is notrunning for some time during a report period we can by this optiondecide to assume states for hosts and services during the down-time. Default value is YES.
Include Soft States: A problem is classified as a SOFT problemuntil the number of checks has reached the configured max check attemptsvalue. When max check attempts is reached the problem is reclas-sified as HARD and normally op5 Monitor will send out a notifi-cation about the problem. SOFT problem’s does not result in anotification. If you select YES, SOFT states will be included in thereport, if NO only HARD states will be included.
First Assumed Host State: If there is no information about thehost or service in the current log file, op5 Monitor can assumestatus of the host/service. Default value is “Current State”.
First Assumed Service State: If there is no information aboutthe host or service in the current log file, op5 Monitor can assumestatus of the host/service. Default value is “Current State”.
Backtracked Archives (To Scan For Initial States): How manylog archives to look through when searching for initial states. op5Monitor is configured to rotate the log monthly.
Click on “Create Report” to proceed and create the report.
Copyright © op5 AB, www.op5.com. All rights reserved. 46
op5 Monitor 3.2 Manual
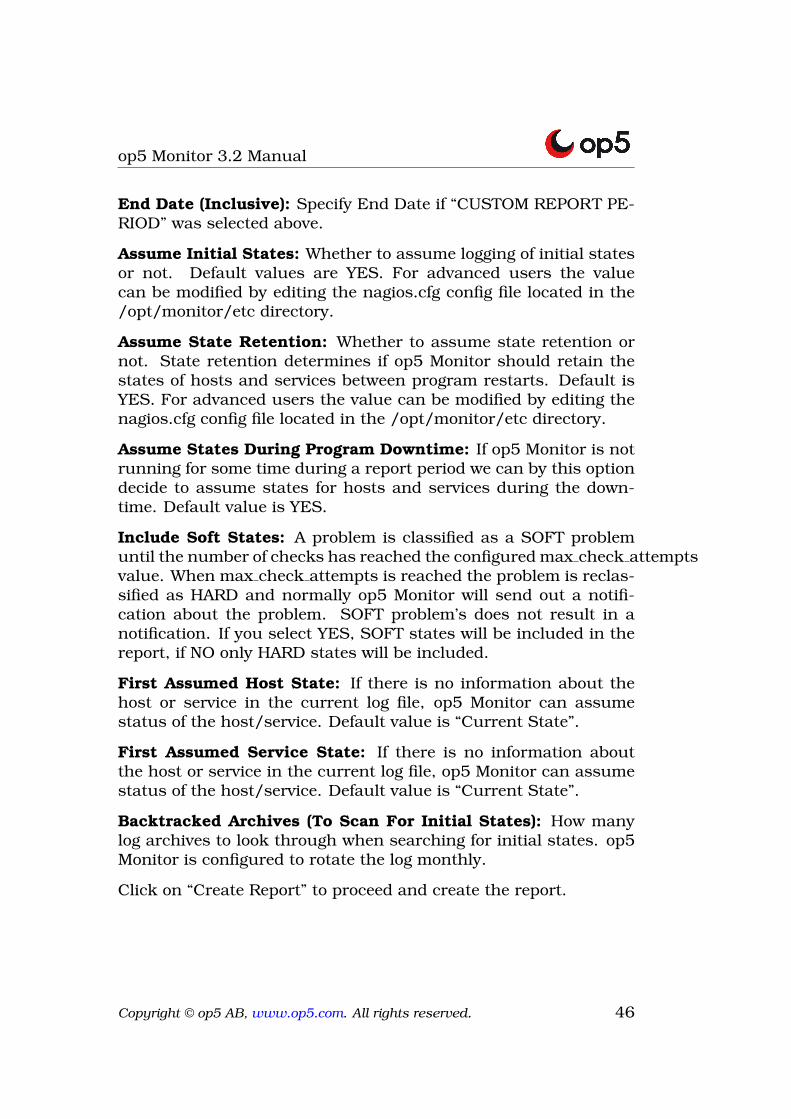
The graph that is created shows what state the host has been inover the selected report interval. You can zoom into the graph byclicking on it.
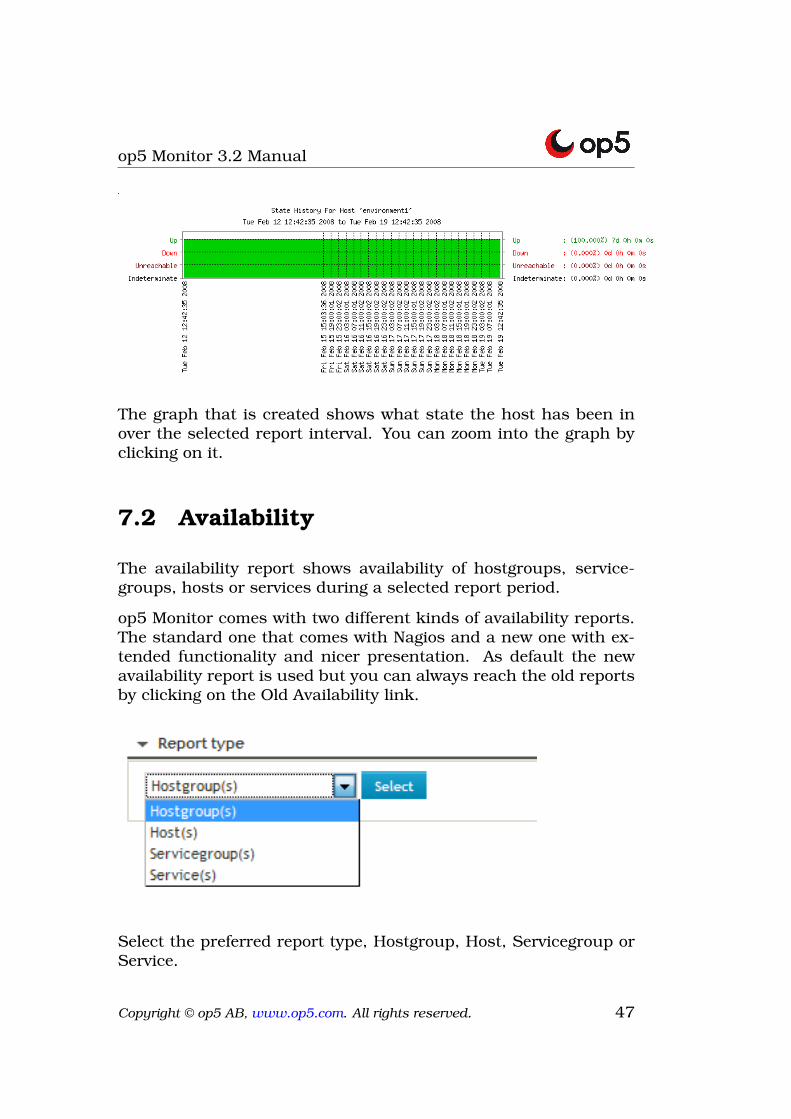
7.2 Availability
The availability report shows availability of hostgroups, service-groups, hosts or services during a selected report period.
op5 Monitor comes with two different kinds of availability reports.The standard one that comes with Nagios and a new one with ex-tended functionality and nicer presentation. As default the newavailability report is used but you can always reach the old reportsby clicking on the Old Availability link.
Select the preferred report type, Hostgroup, Host, Servicegroup orService.
Copyright © op5 AB, www.op5.com. All rights reserved. 47
op5 Monitor 3.2 Manual
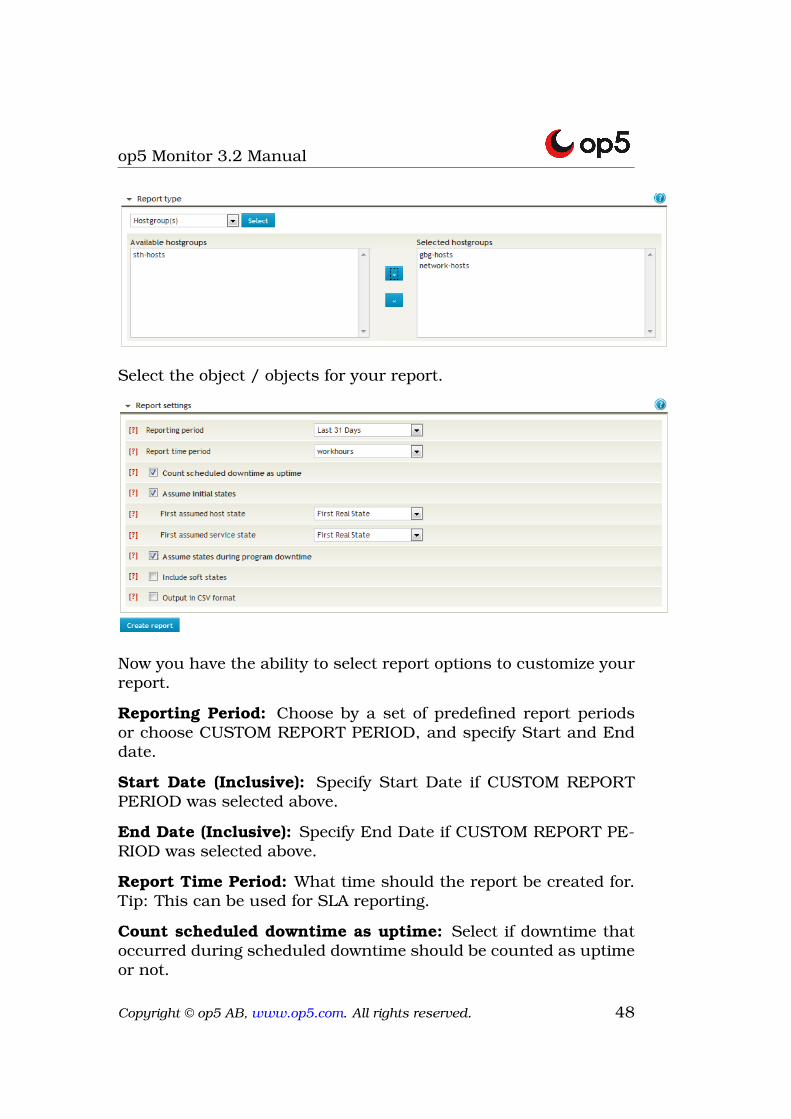
Select the object / objects for your report.
Now you have the ability to select report options to customize yourreport.
Reporting Period: Choose by a set of predefined report periodsor choose CUSTOM REPORT PERIOD, and specify Start and Enddate.
Start Date (Inclusive): Specify Start Date if CUSTOM REPORTPERIOD was selected above.
End Date (Inclusive): Specify End Date if CUSTOM REPORT PE-RIOD was selected above.
Report Time Period: What time should the report be created for.Tip: This can be used for SLA reporting.
Count scheduled downtime as uptime: Select if downtime thatoccurred during scheduled downtime should be counted as uptimeor not.
Copyright © op5 AB, www.op5.com. All rights reserved. 48
op5 Monitor 3.2 Manual
Assume Initial States: Whether to assume logging of initial statesor not. Default values are YES. For advanced users the valuecan be modified by editing the nagios.cfg config file located in the/opt/monitor/etc directory.
First Assumed Host State: If there is no information about thehost or service in the current log file, op5 Monitor can assumestatus of the host/service. Default value is Current State.
First Assumed Service State: If there is no information aboutthe host or service in the current log file, op5 Monitor can assumestatus of the host/service. Default value is Current State.
Assume States During Program Downtime: If op5 Monitor is notrunning for some time during a report period we can by this optiondecide to assume states for hosts and services during the down-time. Default value is YES.
Include Soft States: A problem is classified as a SOFT problemuntil the number of checks has reached the configuredmax check attempts value. When max check attempts is reachedthe problem is reclassified as HARD and normally op5 Monitor willsend out a notification about the problem. SOFT problems doesnot result in a notification. If you select YES, SOFT states will beincluded in the report, if NO only HARD states will be included.
Output in CSV format: The CSV (comma-separated values) formatis a file format that stores tabular data. This format is supportedby many applications such as MS Excel, OpenOffice and GoogleSpreadsheets.
Click on Create Report to create the availability report
Copyright © op5 AB, www.op5.com. All rights reserved. 49
op5 Monitor 3.2 Manual
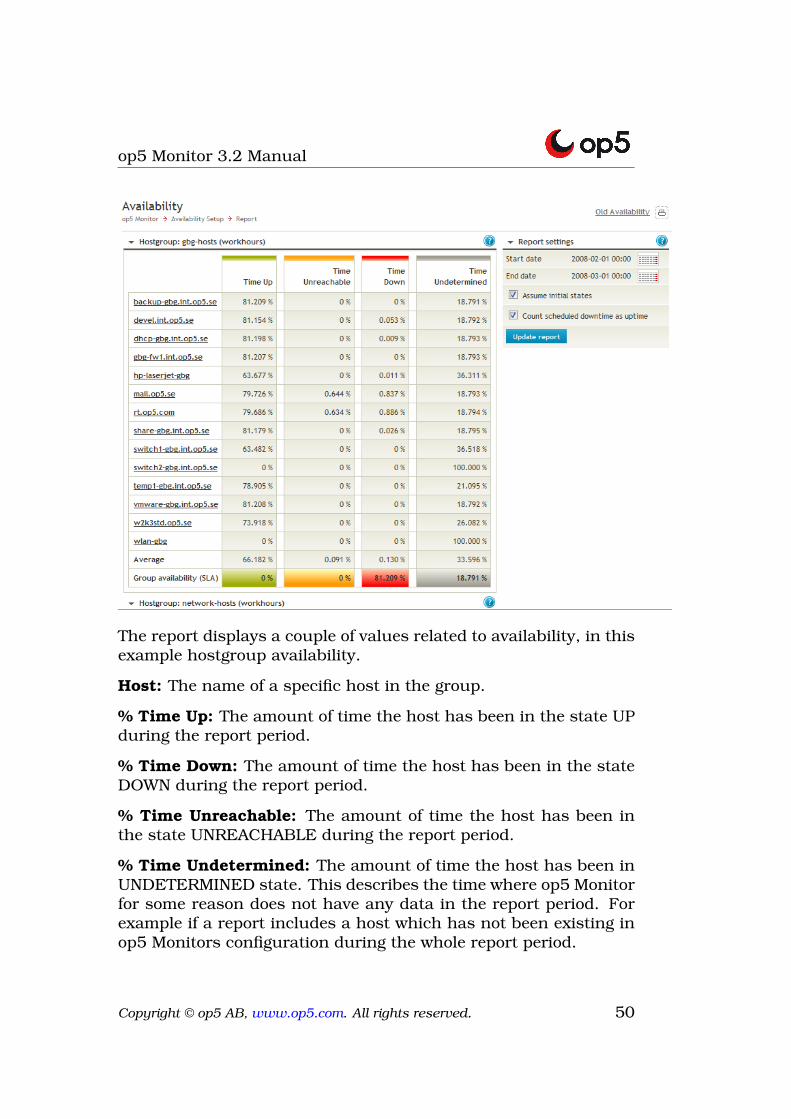
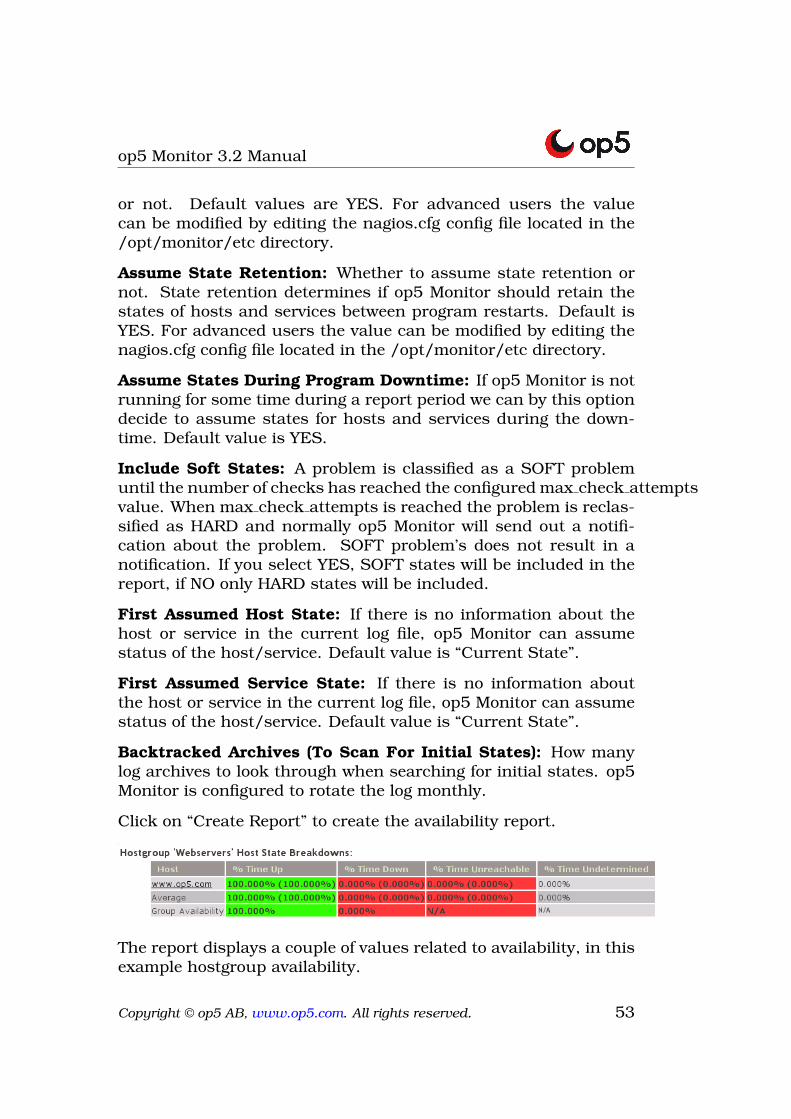
The report displays a couple of values related to availability, in thisexample hostgroup availability.
Host: The name of a specific host in the group.
% Time Up: The amount of time the host has been in the state UPduring the report period.
% Time Down: The amount of time the host has been in the stateDOWN during the report period.
% Time Unreachable: The amount of time the host has been inthe state UNREACHABLE during the report period.
% Time Undetermined: The amount of time the host has been inUNDETERMINED state. This describes the time where op5 Monitorfor some reason does not have any data in the report period. Forexample if a report includes a host which has not been existing inop5 Monitors configuration during the whole report period.
Copyright © op5 AB, www.op5.com. All rights reserved. 50
op5 Monitor 3.2 Manual
There are two values displayed for each time above except for the%Time Undetermined value.
There are also two summary values for each hostgroup report
Average: This is the average value for the group. It is calculatedby adding the % Time for each host and then divide the total valuewith the amount of hosts in the group. This can also be done onservicegroup reports.Group Availability (SLA): This value is only calculated for UP andDOWN states. It displays the amount of time where all hosts in thegroup has been UP or DOWN at the same time.
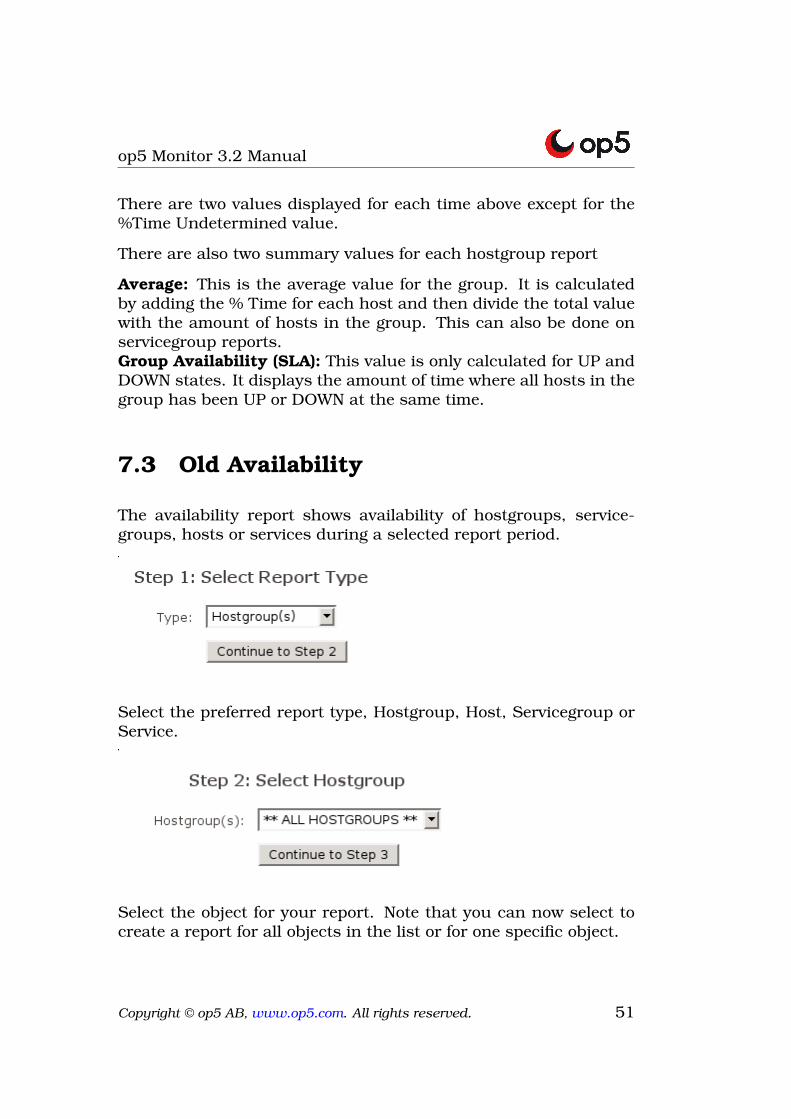
7.3 Old Availability
The availability report shows availability of hostgroups, service-groups, hosts or services during a selected report period.
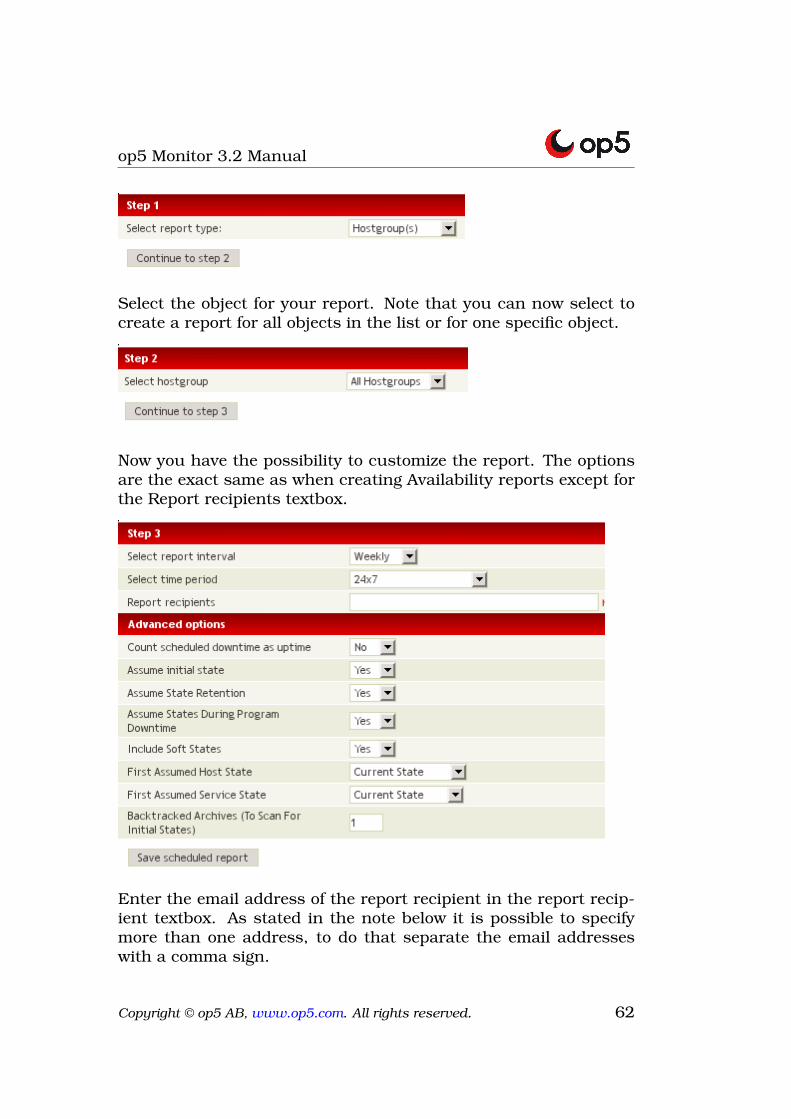
Select the preferred report type, Hostgroup, Host, Servicegroup orService.
Select the object for your report. Note that you can now select tocreate a report for all objects in the list or for one specific object.
Copyright © op5 AB, www.op5.com. All rights reserved. 51
op5 Monitor 3.2 Manual
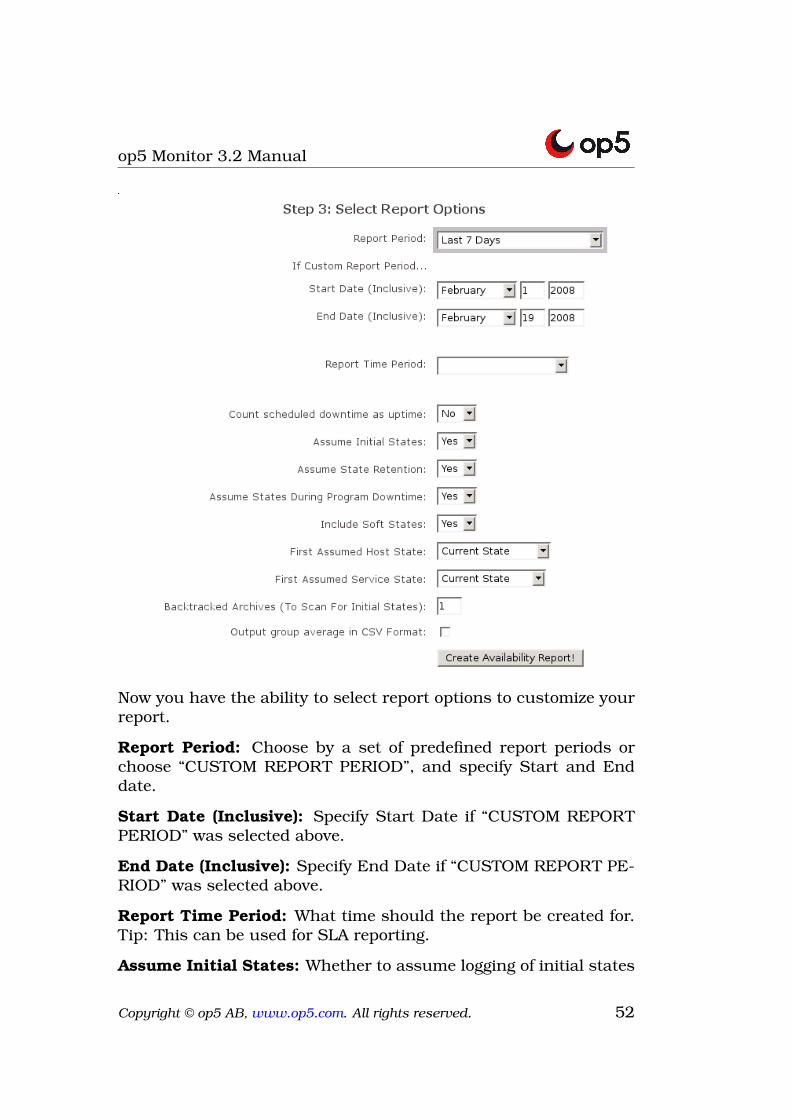
Now you have the ability to select report options to customize yourreport.
Report Period: Choose by a set of predefined report periods orchoose “CUSTOM REPORT PERIOD”, and specify Start and Enddate.
Start Date (Inclusive): Specify Start Date if “CUSTOM REPORTPERIOD” was selected above.
End Date (Inclusive): Specify End Date if “CUSTOM REPORT PE-RIOD” was selected above.
Report Time Period: What time should the report be created for.Tip: This can be used for SLA reporting.
Assume Initial States: Whether to assume logging of initial states
Copyright © op5 AB, www.op5.com. All rights reserved. 52
op5 Monitor 3.2 Manual
or not. Default values are YES. For advanced users the valuecan be modified by editing the nagios.cfg config file located in the/opt/monitor/etc directory.
Assume State Retention: Whether to assume state retention ornot. State retention determines if op5 Monitor should retain thestates of hosts and services between program restarts. Default isYES. For advanced users the value can be modified by editing thenagios.cfg config file located in the /opt/monitor/etc directory.
Assume States During Program Downtime: If op5 Monitor is notrunning for some time during a report period we can by this optiondecide to assume states for hosts and services during the down-time. Default value is YES.
Include Soft States: A problem is classified as a SOFT problemuntil the number of checks has reached the configured max check attemptsvalue. When max check attempts is reached the problem is reclas-sified as HARD and normally op5 Monitor will send out a notifi-cation about the problem. SOFT problem’s does not result in anotification. If you select YES, SOFT states will be included in thereport, if NO only HARD states will be included.
First Assumed Host State: If there is no information about thehost or service in the current log file, op5 Monitor can assumestatus of the host/service. Default value is “Current State”.
First Assumed Service State: If there is no information aboutthe host or service in the current log file, op5 Monitor can assumestatus of the host/service. Default value is “Current State”.
Backtracked Archives (To Scan For Initial States): How manylog archives to look through when searching for initial states. op5Monitor is configured to rotate the log monthly.
Click on “Create Report” to create the availability report.
The report displays a couple of values related to availability, in thisexample hostgroup availability.
Copyright © op5 AB, www.op5.com. All rights reserved. 53
op5 Monitor 3.2 Manual
Host: The name of a specific host in the group.
% Time Up: The amount of time the host has been in the state UPduring the report period.
% Time Down: The amount of time the host has been in the stateDOWN during the report period.
% Time Unreachable: The amount of time the host has been inthe state UNREACHABLE during the report period.
% Time Undetermined: The amount of time the host has been inUNDETERMINED state. This describes the time where op5 Monitorfor some reason does not have any data in the report period. Forexample if a report includes a host which has not been existing inop5 Monitor’s configuration during the whole report period.
There are two values displayed for each time above except for the%Time Undetermined value.
There are also two summary values for each hostgroup report.
Average: This is the average value for the group. It is calculatedby adding the % Time for each host and then divide the total valuewith the amount of hosts in the group. This can also be done onservicegroup reports.
Group Average: This value is only calculated for UP and DOWNstates. It displays the amount of time where all hosts in the grouphas been UP or DOWN at the same time.
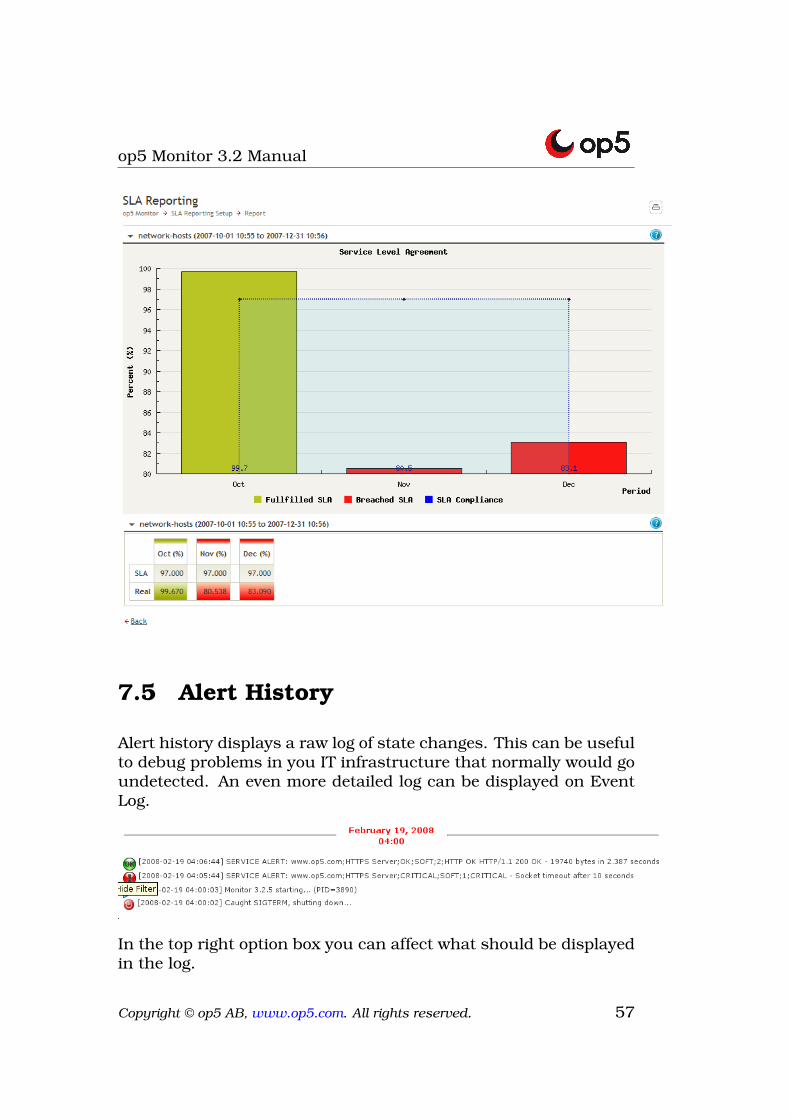
7.4 SLA Reporting
SLA (Service Level Agreement) reporting is a report that visualizesif we met the agreed level of service, i.e. uptime, or not.
Copyright © op5 AB, www.op5.com. All rights reserved. 54
op5 Monitor 3.2 Manual
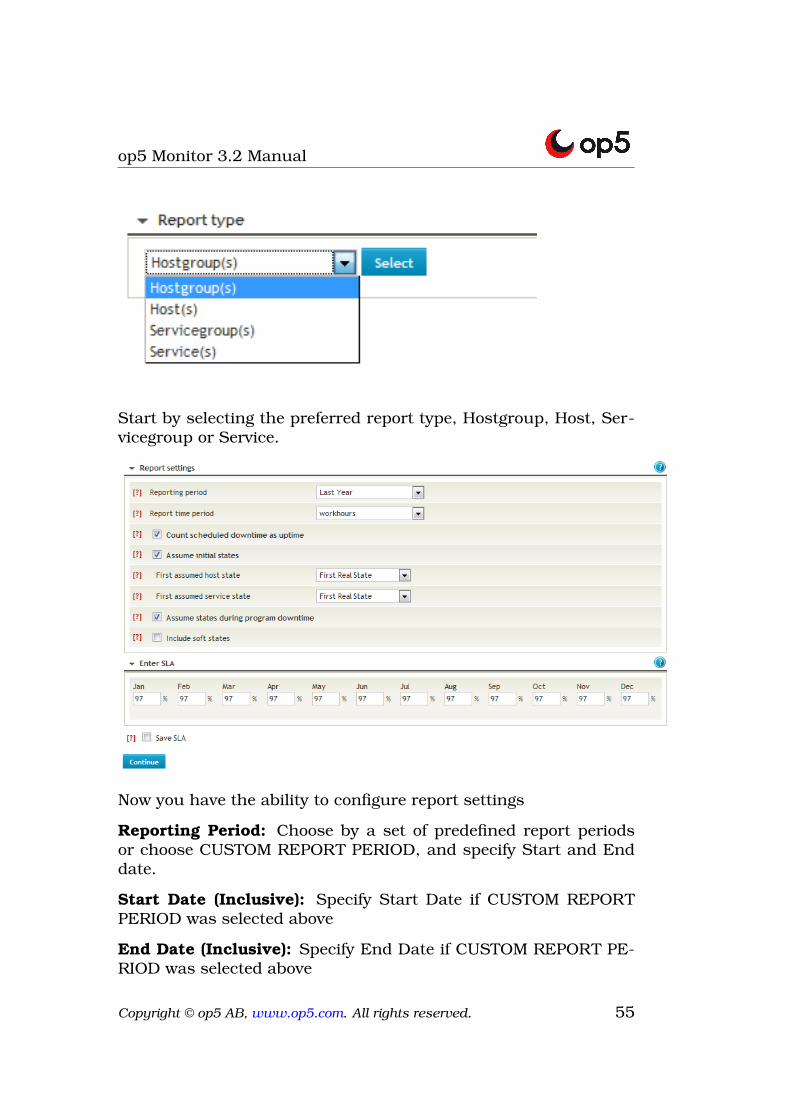
Start by selecting the preferred report type, Hostgroup, Host, Ser-vicegroup or Service.
Now you have the ability to configure report settings
Reporting Period: Choose by a set of predefined report periodsor choose CUSTOM REPORT PERIOD, and specify Start and Enddate.
Start Date (Inclusive): Specify Start Date if CUSTOM REPORTPERIOD was selected above
End Date (Inclusive): Specify End Date if CUSTOM REPORT PE-RIOD was selected above
Copyright © op5 AB, www.op5.com. All rights reserved. 55
op5 Monitor 3.2 Manual
Report Time Period: What time should the report be created for.Tip: This can be used for SLA reporting.
Count scheduled downtime as uptime: Select if downtime thatoccurred during scheduled downtime should be counted as uptimeor not.
Assume Initial States: Whether to assume logging of initial statesor not. Default values are YES. For advanced users the valuecan be modified by editing the nagios.cfg config file located in the/opt/monitor/etc directory.
First Assumed Host State: If there is no information about thehost or service in the current log file, op5 Monitor can assumestatus of the host/service. Default value is Current State.
First Assumed Service State: If there is no information aboutthe host or service in the current log file, op5 Monitor can assumestatus of the host/service. Default value is Current State.
Assume States During Program Downtime: If op5 Monitor is notrunning for some time during a report period we can by this optiondecide to assume states for hosts and services during the down-time. Default value is YES.
Include Soft States: A problem is classified as a SOFT problemuntil the number of checks has reached the configuredmax check attempts value. When max check attempts is reachedthe problem is reclassified as HARD and normally op5 Monitor willsend out a notification about the problem. SOFT problems doesnot result in a notification. If you select YES, SOFT states will beincluded in the report, if NO only HARD states will be included.
Enter SLA: Here you specify the expected availability for each month.Tip: If you enter a value for the first month and click outside theform you will get the option to autofill the other months as well.
If you want to use this report at later date you can click Save SLAand select a name for the report.
Click on Create Report to create the SLA report
Copyright © op5 AB, www.op5.com. All rights reserved. 56
op5 Monitor 3.2 Manual
7.5 Alert History
Alert history displays a raw log of state changes. This can be usefulto debug problems in you IT infrastructure that normally would goundetected. An even more detailed log can be displayed on EventLog.
In the top right option box you can affect what should be displayedin the log.
Copyright © op5 AB, www.op5.com. All rights reserved. 57
op5 Monitor 3.2 Manual
The information in the log is divided in segments consisting in logentries with one hour of log data for each segment.
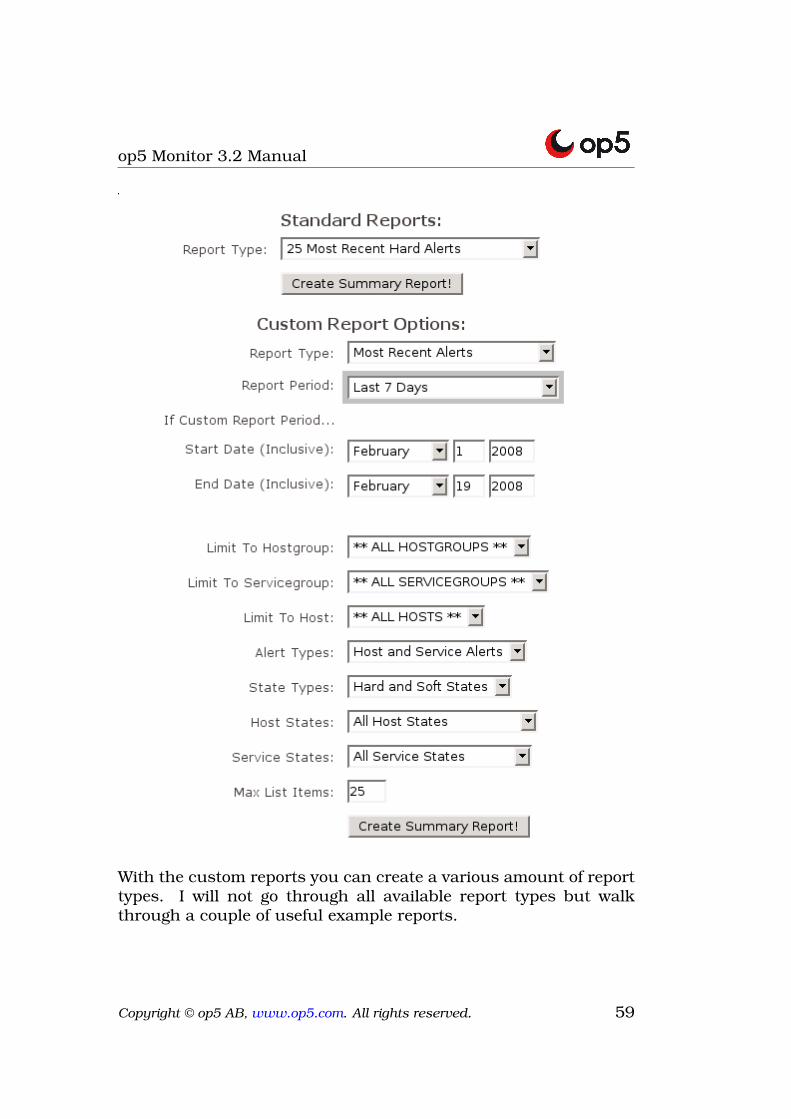
7.6 Alert Summary
The alert summary report gives you a subset of possibilities to cre-ate different reports based on the data op5 Monitor has collected.
The page gives you the possibility to create a subset of standardreports and it is also possible to create customized reports.
Copyright © op5 AB, www.op5.com. All rights reserved. 58
op5 Monitor 3.2 Manual
With the custom reports you can create a various amount of reporttypes. I will not go through all available report types but walkthrough a couple of useful example reports.
Copyright © op5 AB, www.op5.com. All rights reserved. 59
op5 Monitor 3.2 Manual
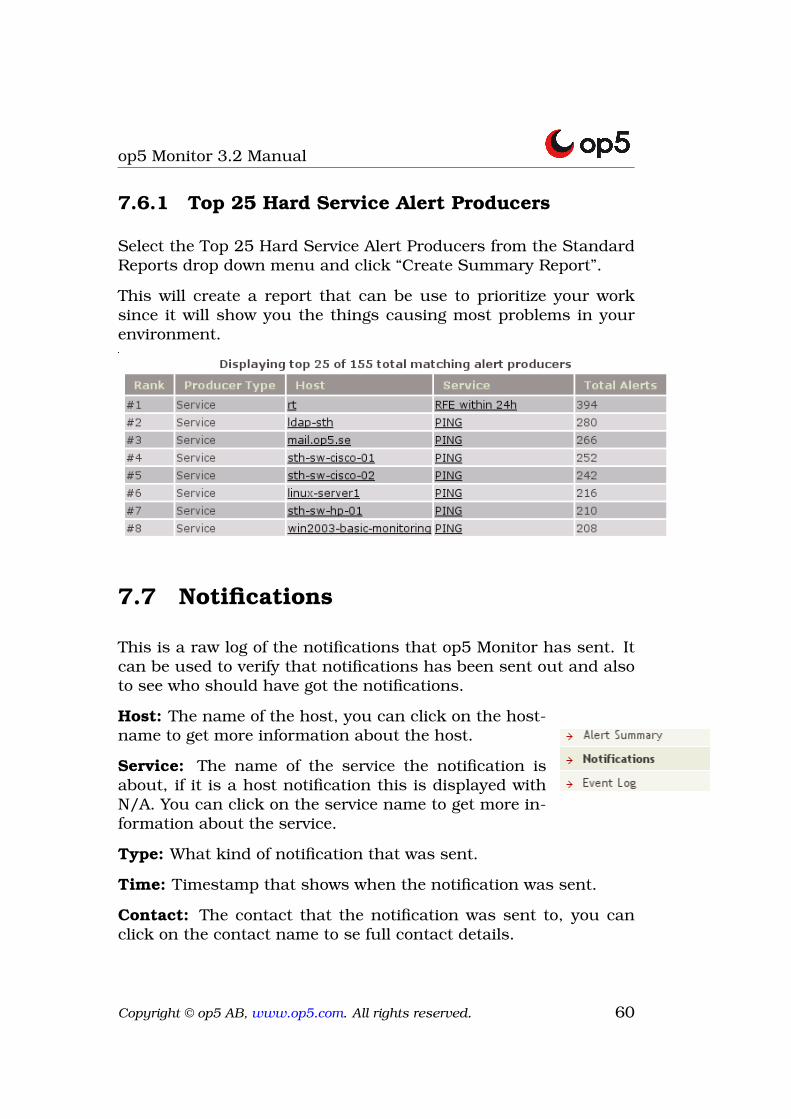
7.6.1 Top 25 Hard Service Alert Producers
Select the Top 25 Hard Service Alert Producers from the StandardReports drop down menu and click “Create Summary Report”.
This will create a report that can be use to prioritize your worksince it will show you the things causing most problems in yourenvironment.
7.7 Notifications
This is a raw log of the notifications that op5 Monitor has sent. Itcan be used to verify that notifications has been sent out and alsoto see who should have got the notifications.
Host: The name of the host, you can click on the host-name to get more information about the host.
Service: The name of the service the notification isabout, if it is a host notification this is displayed withN/A. You can click on the service name to get more in-formation about the service.
Type: What kind of notification that was sent.
Time: Timestamp that shows when the notification was sent.
Contact: The contact that the notification was sent to, you canclick on the contact name to se full contact details.
Copyright © op5 AB, www.op5.com. All rights reserved. 60
op5 Monitor 3.2 Manual
Notification Command: The command used to send the notifica-tion, se more on Check Commands.
Information: The status output that resulted in the notification.This is not necessary the information sent in the notification it justindicates the reason for the notification.
7.8 Event Log
The event log is a raw log of events in the system. This can beinteresting if you want to do troubleshooting on the op5 Monitorsystem or your IT infrastructure.
This log is also available for advanced users in text format directlyon your op5 Monitor system in /opt/monitor/var/nagios.log
The log file is rotated once every month and moved to/opt/monitor/var/archive/. The rotation interval can be changedby advanced users by editing the variable ‘log rotation method’ in/opt/monitor/etc/nagios.cfg.
Warning: this log can be really large if you are at the end of themonth just before rotation or if you monitor a large amount of hostsand services. The size of the log can even crash some browsers ormake your system slow and unresponsive. A good alternative tothe Event Log is the Alert History which contains a more filteredlist of events.
7.9 Schedule Reports
Schedule reports provides the exact same function as Availabilityreports with the addition that the report is sent out as an htmlemail to one or several recipients. The reports can be sent out ona monthly or weekly basis.
To configure a scheduled report do following
Select the preferred report type, Hostgroup, Host, Servicegroup orService.
Copyright © op5 AB, www.op5.com. All rights reserved. 61
op5 Monitor 3.2 Manual
Select the object for your report. Note that you can now select tocreate a report for all objects in the list or for one specific object.
Now you have the possibility to customize the report. The optionsare the exact same as when creating Availability reports except forthe Report recipients textbox.
Enter the email address of the report recipient in the report recip-ient textbox. As stated in the note below it is possible to specifymore than one address, to do that separate the email addresseswith a comma sign.
Copyright © op5 AB, www.op5.com. All rights reserved. 62
op5 Monitor 3.2 Manual
Chapter 8
Configuration Web Menu
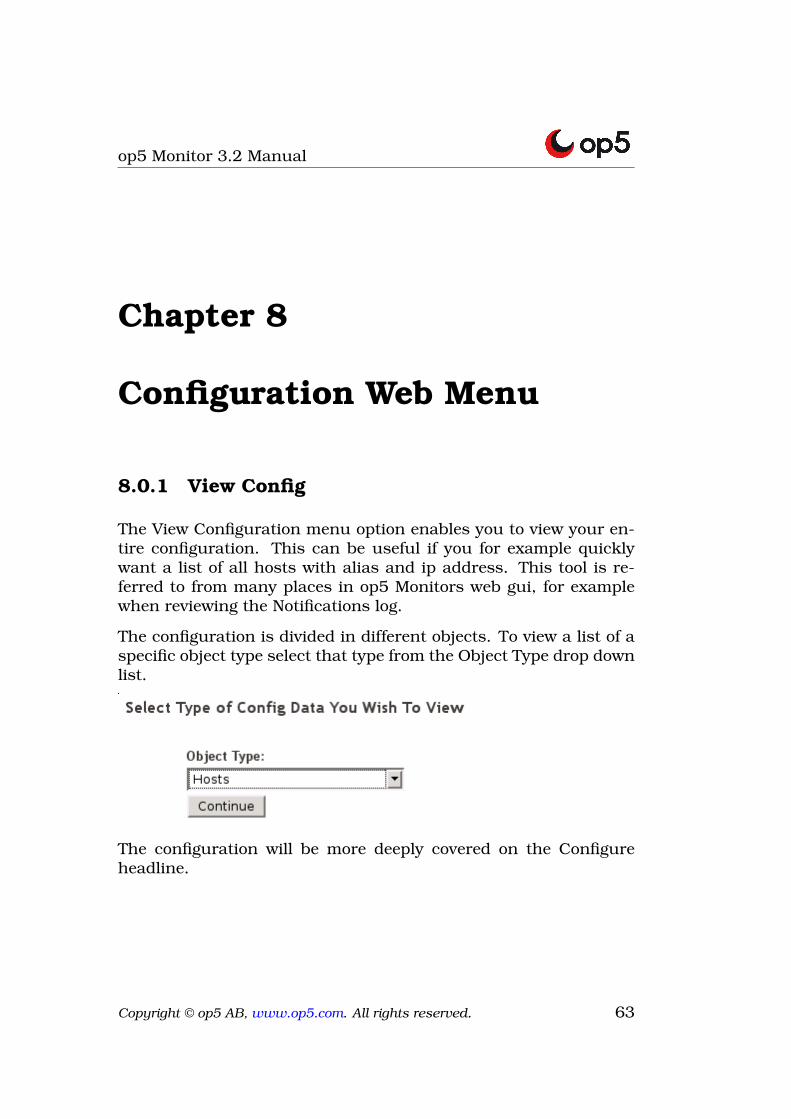
8.0.1 View Config
The View Configuration menu option enables you to view your en-tire configuration. This can be useful if you for example quicklywant a list of all hosts with alias and ip address. This tool is re-ferred to from many places in op5 Monitors web gui, for examplewhen reviewing the Notifications log.
The configuration is divided in different objects. To view a list of aspecific object type select that type from the Object Type drop downlist.
The configuration will be more deeply covered on the Configureheadline.
Copyright © op5 AB, www.op5.com. All rights reserved. 63
op5 Monitor 3.2 Manual
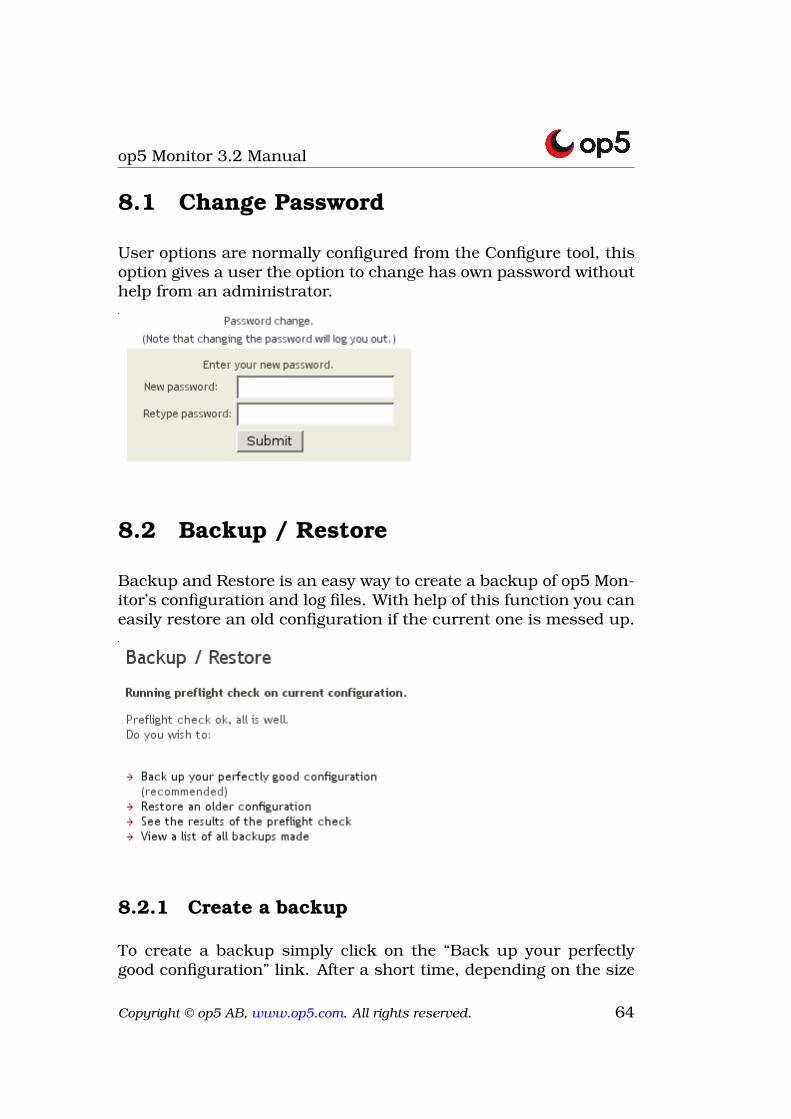
8.1 Change Password
User options are normally configured from the Configure tool, thisoption gives a user the option to change has own password withouthelp from an administrator.
8.2 Backup / Restore
Backup and Restore is an easy way to create a backup of op5 Mon-itor’s configuration and log files. With help of this function you caneasily restore an old configuration if the current one is messed up.
8.2.1 Create a backup
To create a backup simply click on the “Back up your perfectlygood configuration” link. After a short time, depending on the size
Copyright © op5 AB, www.op5.com. All rights reserved. 64
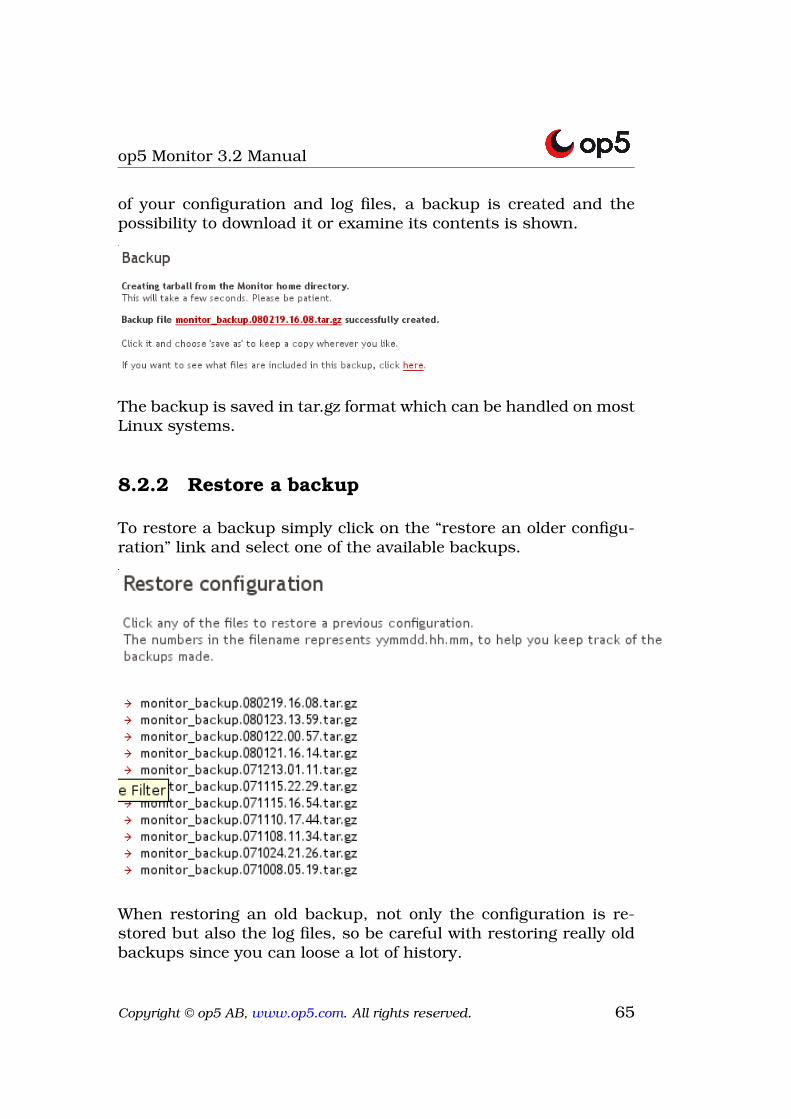
op5 Monitor 3.2 Manual
of your configuration and log files, a backup is created and thepossibility to download it or examine its contents is shown.
The backup is saved in tar.gz format which can be handled on mostLinux systems.
8.2.2 Restore a backup
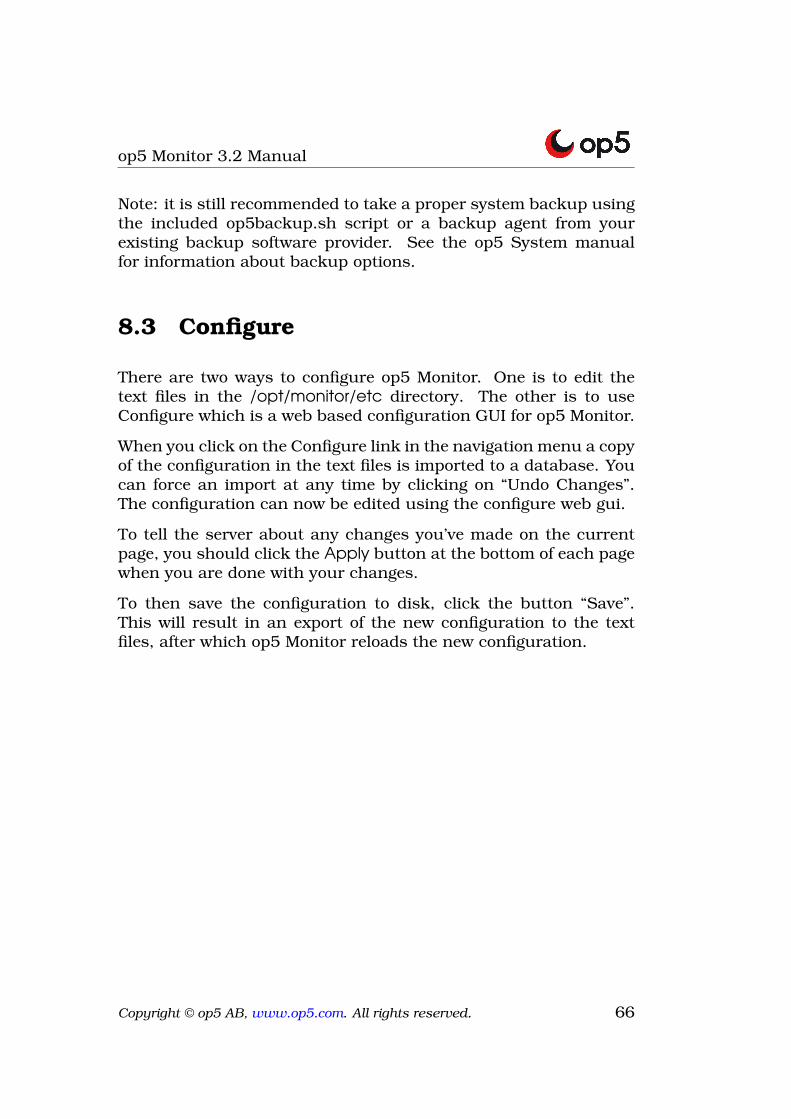
To restore a backup simply click on the “restore an older configu-ration” link and select one of the available backups.
When restoring an old backup, not only the configuration is re-stored but also the log files, so be careful with restoring really oldbackups since you can loose a lot of history.
Copyright © op5 AB, www.op5.com. All rights reserved. 65
op5 Monitor 3.2 Manual
Note: it is still recommended to take a proper system backup usingthe included op5backup.sh script or a backup agent from yourexisting backup software provider. See the op5 System manualfor information about backup options.
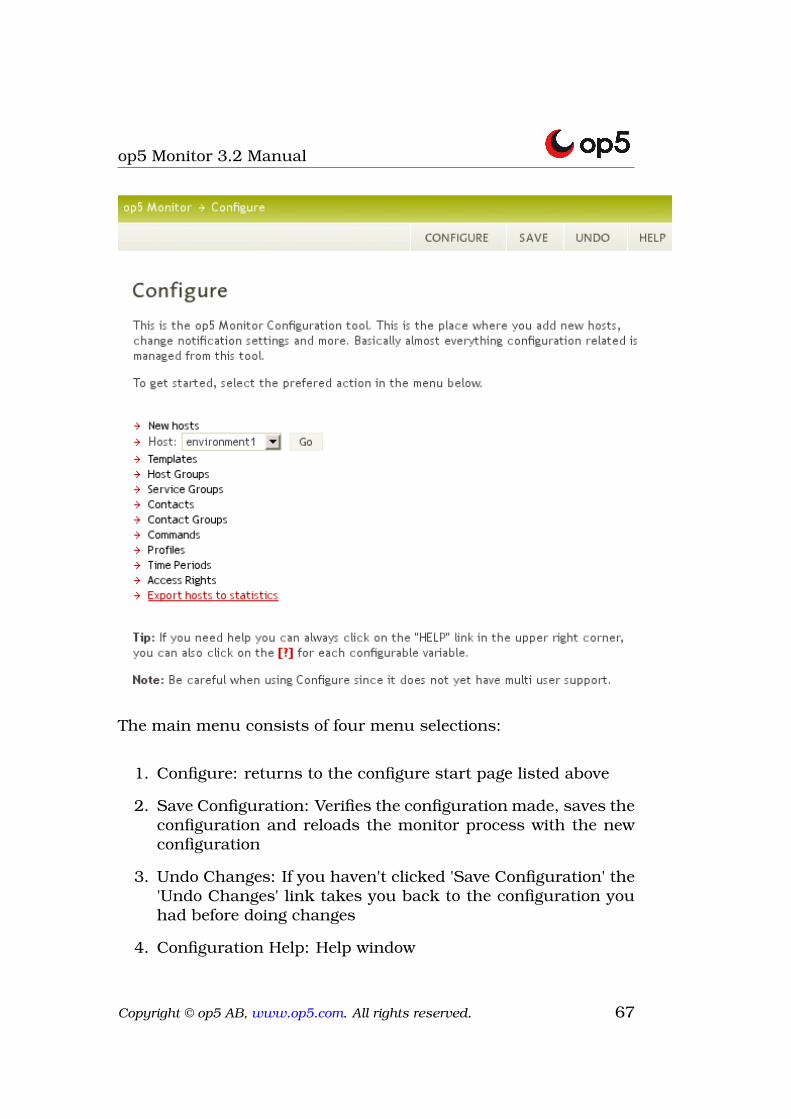
8.3 Configure
There are two ways to configure op5 Monitor. One is to edit thetext files in the /opt/monitor/etc directory. The other is to useConfigure which is a web based configuration GUI for op5 Monitor.
When you click on the Configure link in the navigation menu a copyof the configuration in the text files is imported to a database. Youcan force an import at any time by clicking on “Undo Changes”.The configuration can now be edited using the configure web gui.
To tell the server about any changes you’ve made on the currentpage, you should click the Apply button at the bottom of each pagewhen you are done with your changes.
To then save the configuration to disk, click the button “Save”.This will result in an export of the new configuration to the textfiles, after which op5 Monitor reloads the new configuration.
Copyright © op5 AB, www.op5.com. All rights reserved. 66
op5 Monitor 3.2 Manual
The main menu consists of four menu selections:
1. Configure: returns to the configure start page listed above
2. Save Configuration: Verifies the configuration made, saves theconfiguration and reloads the monitor process with the newconfiguration
3. Undo Changes: If you haven't clicked 'Save Configuration' the'Undo Changes' link takes you back to the configuration youhad before doing changes
4. Configuration Help: Help window
Copyright © op5 AB, www.op5.com. All rights reserved. 67
op5 Monitor 3.2 Manual
8.3.1 Configuration basics
The configuration is based on objects. There are several types ofobjects, each one defining different things in the monitoring pro-cess. Each object consists of a object name and a couple of vari-ables that needs to be configured. For example on a host objectyou configure hostname, address and so on.
In the configure tool you can add new objects and modify existingobjects. A lot of objects can be cross referenced in the configurationand the configure tool helps you with this to.
8.3.2 New Hosts
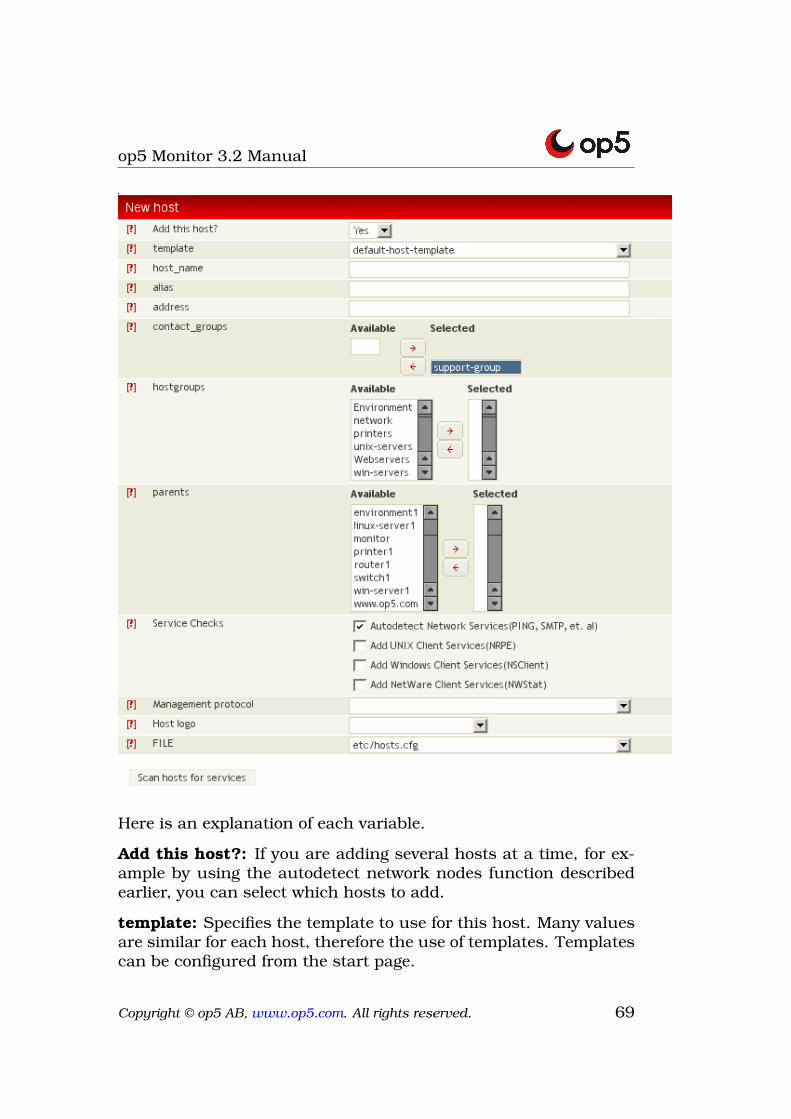
To add a host, click the 'New hosts' link. A new window appearsthat allows you to enter the data needed to add the host.
To add several hosts at a time you have two options.
1. Autodetect network nodes. This function scans one or severalip ranges to detect which IP addresses that responds to ping.
2. You can also change the number of hosts to add in the dropdown menu in the top of the page.
To complete a new host a couple of variables need to be configured.Some of the variables are optional, the required variables are: hostname, alias, address, contact groups and hostgroups. If you fail toadd information in these fields the configuration of the new hostwill fail. You can get a detailed description of all fields by clickingon “Configuration Help” in the upper right corner.
Copyright © op5 AB, www.op5.com. All rights reserved. 68
op5 Monitor 3.2 Manual
Here is an explanation of each variable.
Add this host?: If you are adding several hosts at a time, for ex-ample by using the autodetect network nodes function describedearlier, you can select which hosts to add.
template: Specifies the template to use for this host. Many valuesare similar for each host, therefore the use of templates. Templatescan be configured from the start page.
Copyright © op5 AB, www.op5.com. All rights reserved. 69
op5 Monitor 3.2 Manual
host name: The name of the host that you want to add, usually ashort but descriptive name. Example: router1
alias: Full description of the host, since the host name is supposedto be short you can use this field to enter a more descriptive text.Example: Router for main office.
address: The IP address or host name of the host.
contact groups: The contact group(s) this hosts notifications willbe sent to, one or more groups can be selected.
hostgroups: The host group(s) that the host will be a member of.The host can be a member of several hostgroups.
parents: The parent(s) that this host is physically connected to.Example: serverA is connected to switch1 and therefore has switch1as parent. It is possible to have several parents for redundant con-nections. Note: There is a limitation in the parent directive, youcannot have circular parent relationships.
Service Checks: Add items that Monitor will scan for in the host.By default auto detect network services are checked. This optionscans the host for common used ports and also looks for the pres-ence of a client. You can also force checks associated with a specificclient to be included. This can be useful if you haven't installed theagent software yet.
Management Protocol: Choose the management protocol used toconfigure the host. E.g. telnet for routers and HTTP for switches.This will result in a URL, with the specified management protocol,next to the host in Host Detail. Example: telnet://router1/
Host Logo: Associate a logo to the host. This logo will appear inthe status map and network map. When selecting a logo you willget a popup window with a preview.
FILE: The configuration file that this data will be stored in, defaultis hosts.cfg. Don’t change this if you’re not really sure what it does.
Example of entered data
Copyright © op5 AB, www.op5.com. All rights reserved. 70
op5 Monitor 3.2 Manual
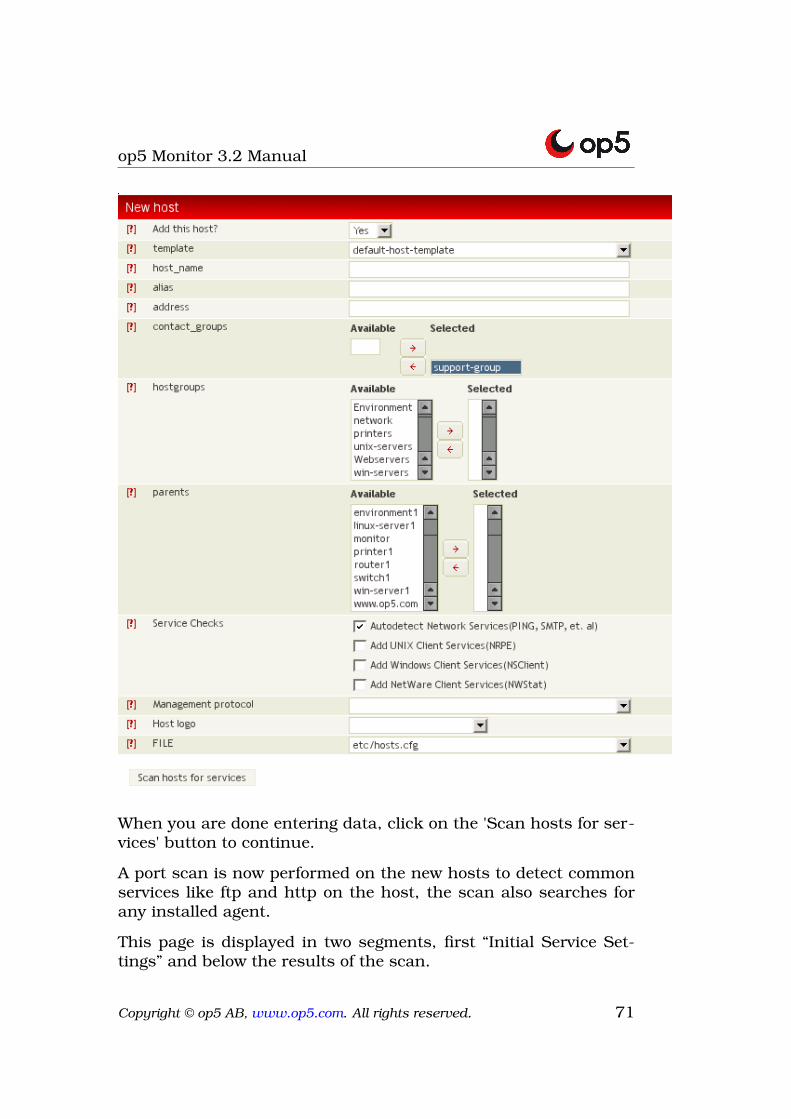
When you are done entering data, click on the 'Scan hosts for ser-vices' button to continue.
A port scan is now performed on the new hosts to detect commonservices like ftp and http on the host, the scan also searches forany installed agent.
This page is displayed in two segments, first “Initial Service Set-tings” and below the results of the scan.
Copyright © op5 AB, www.op5.com. All rights reserved. 71
op5 Monitor 3.2 Manual
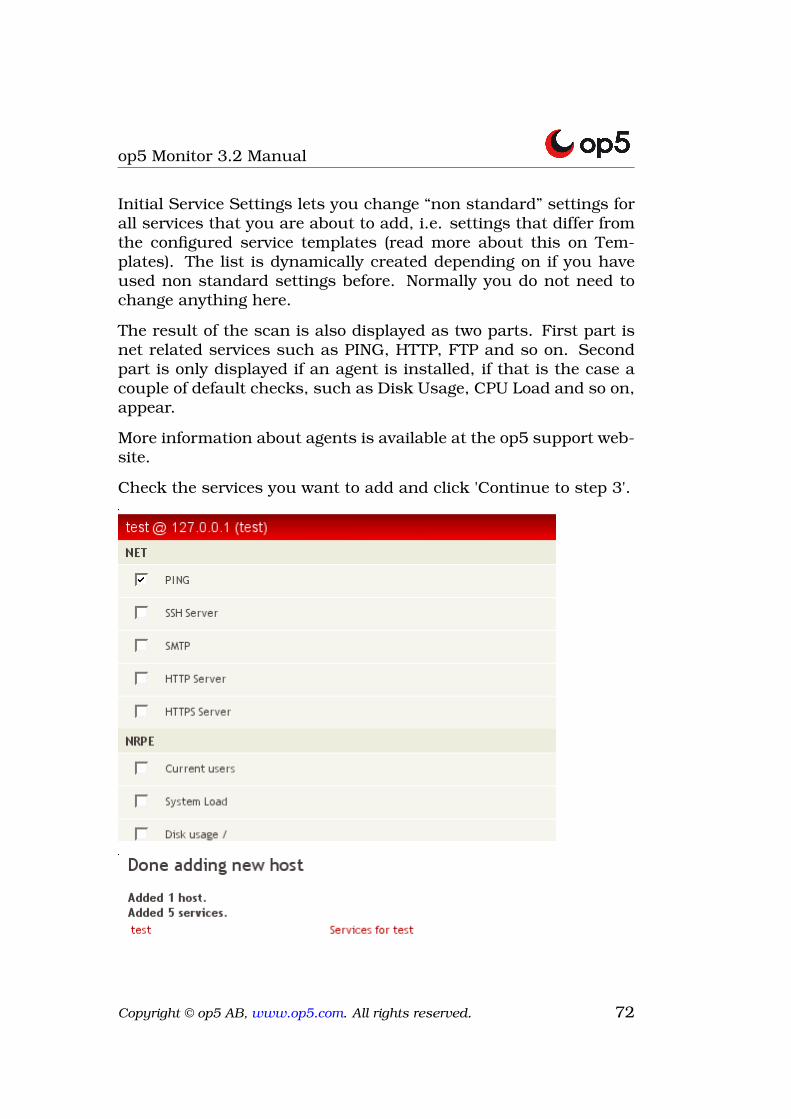
Initial Service Settings lets you change “non standard” settings forall services that you are about to add, i.e. settings that differ fromthe configured service templates (read more about this on Tem-plates). The list is dynamically created depending on if you haveused non standard settings before. Normally you do not need tochange anything here.
The result of the scan is also displayed as two parts. First part isnet related services such as PING, HTTP, FTP and so on. Secondpart is only displayed if an agent is installed, if that is the case acouple of default checks, such as Disk Usage, CPU Load and so on,appear.
More information about agents is available at the op5 support web-site.
Check the services you want to add and click 'Continue to step 3'.
Copyright © op5 AB, www.op5.com. All rights reserved. 72
op5 Monitor 3.2 Manual
That's it. You have now added a new host. You have the optionsto go back and do configurations on the new host or its services. Ifyou feel you're done click save configuration. The Pre–flight config-uration check is made, Monitor reloads the configuration and thenew host is up and running. If you encounter problems with the'Save Configuration' you probably didn't fill out the fields correctlyor missed to enter data in the fields.
There is two ways to fix the configuration if the “Pre-flight config-uration check” fails. The first is to try to fix any mistakes thatyou have done in the configuration gui, pay attention to any errorsor warnings displayed during the “Pre-flight configuration check”.The second one is to simply restore an old backup using the Backup/Restoretool.
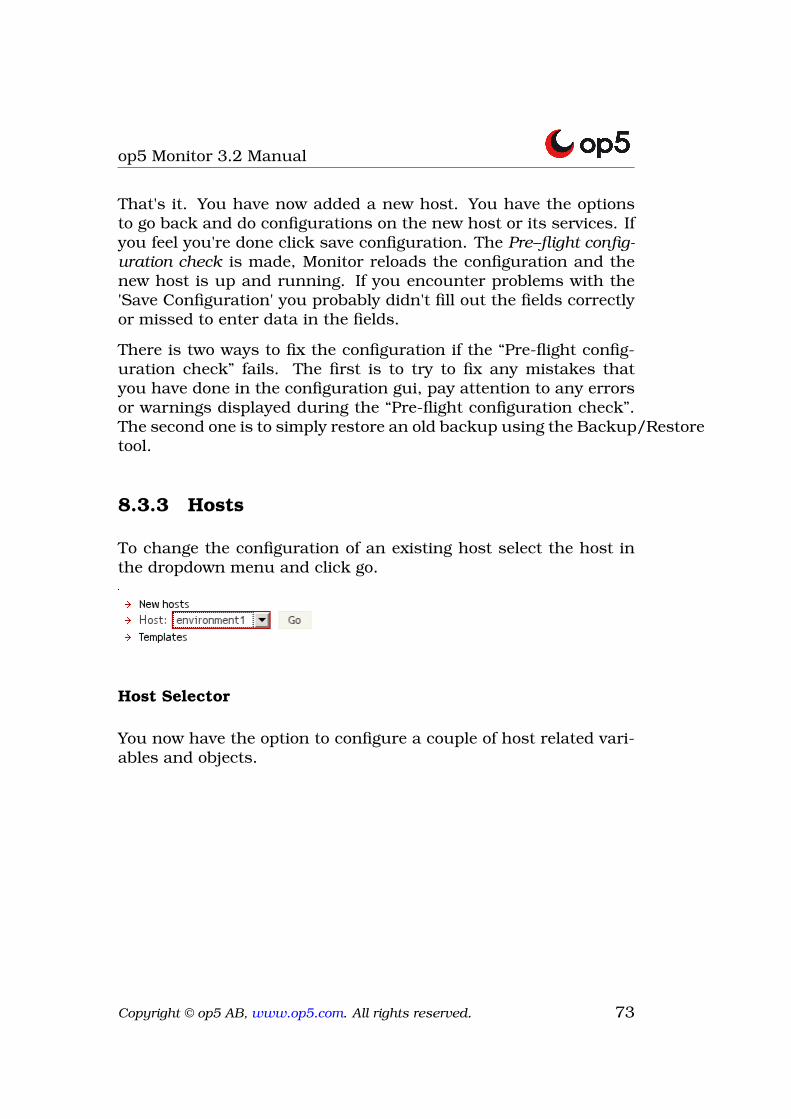
8.3.3 Hosts
To change the configuration of an existing host select the host inthe dropdown menu and click go.
Host Selector
You now have the option to configure a couple of host related vari-ables and objects.
Copyright © op5 AB, www.op5.com. All rights reserved. 73
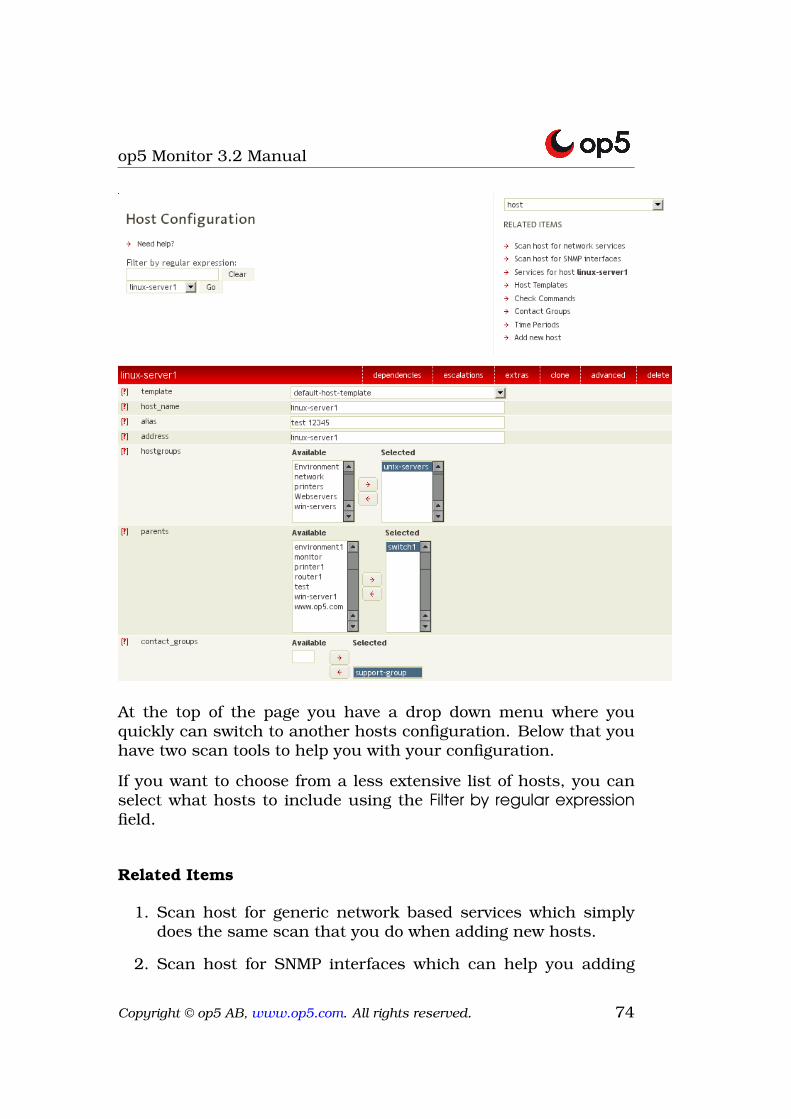
op5 Monitor 3.2 Manual
At the top of the page you have a drop down menu where youquickly can switch to another hosts configuration. Below that youhave two scan tools to help you with your configuration.
If you want to choose from a less extensive list of hosts, you canselect what hosts to include using the Filter by regular expressionfield.
Related Items
1. Scan host for generic network based services which simplydoes the same scan that you do when adding new hosts.
2. Scan host for SNMP interfaces which can help you adding
Copyright © op5 AB, www.op5.com. All rights reserved. 74
op5 Monitor 3.2 Manual
monitoring of interfaces for a RFC1213 (MIB-II) compliant SNMPdevice.
Related items gives you shortcuts to, well related items. Basically,lets say that you are about to make some configuration changesto your host and discovers that you are missing the new con-tact group that you needed you can simply click on the “ContactGroups” link in the related items section. It’s supposed to speedup the configuration process by saving you an extra click.
Note: to configure services for a host, click on the “services forhost” link in the related items section. Read more about how toconfigure services on the Services for host headline.
Host Object Box
The last part of the host configuration page is the host object boxitself. Next to the name of the host in the host object box there aresix links:
• dependencies
• escalations
• extras
• clone
• advanced
• delete
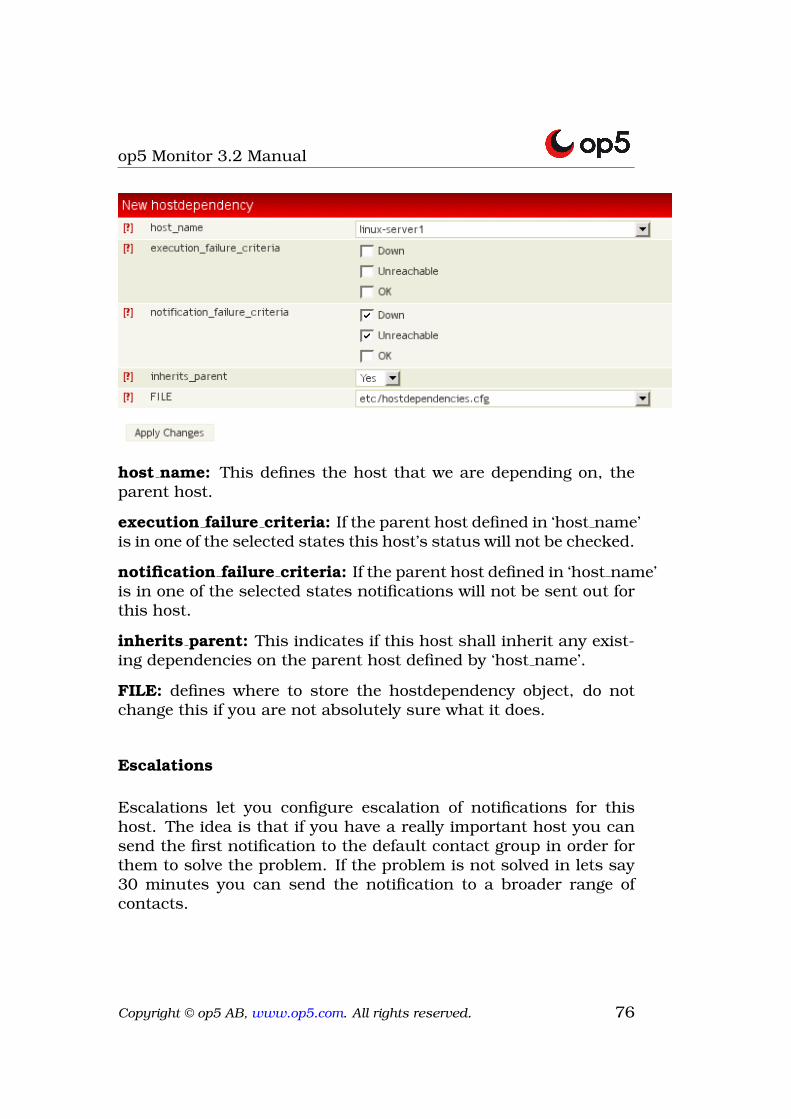
Dependencies
Host dependencies are an advanced feature of op5 Monitor thatallows you to suppress notifications and even check execution forhosts, based on the status of one or more other hosts. Host depen-dencies are optional and are mainly targeted at advanced users.
An easy way to get almost the same functionality would be to usethe parents directive instead.
Copyright © op5 AB, www.op5.com. All rights reserved. 75
op5 Monitor 3.2 Manual
host name: This defines the host that we are depending on, theparent host.
execution failure criteria: If the parent host defined in ‘host name’is in one of the selected states this host’s status will not be checked.
notification failure criteria: If the parent host defined in ‘host name’is in one of the selected states notifications will not be sent out forthis host.
inherits parent: This indicates if this host shall inherit any exist-ing dependencies on the parent host defined by ‘host name’.
FILE: defines where to store the hostdependency object, do notchange this if you are not absolutely sure what it does.
Escalations
Escalations let you configure escalation of notifications for thishost. The idea is that if you have a really important host you cansend the first notification to the default contact group in order forthem to solve the problem. If the problem is not solved in lets say30 minutes you can send the notification to a broader range ofcontacts.
Copyright © op5 AB, www.op5.com. All rights reserved. 76
op5 Monitor 3.2 Manual
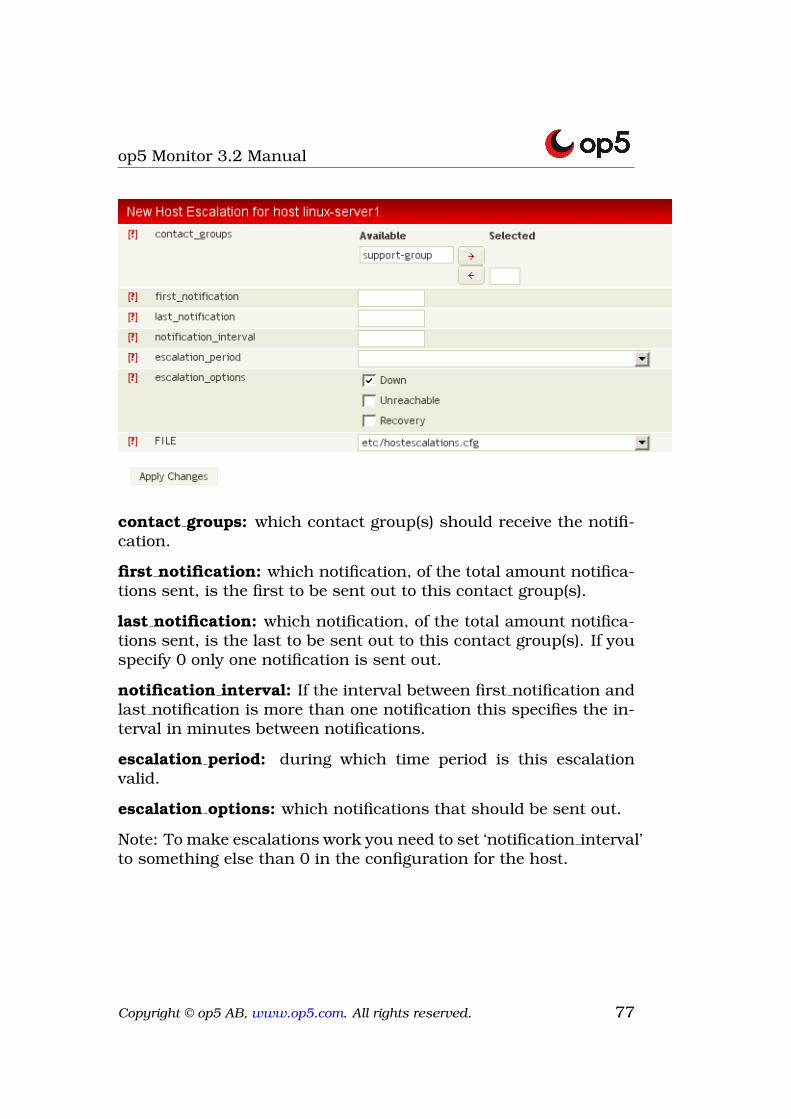
contact groups: which contact group(s) should receive the notifi-cation.
first notification: which notification, of the total amount notifica-tions sent, is the first to be sent out to this contact group(s).
last notification: which notification, of the total amount notifica-tions sent, is the last to be sent out to this contact group(s). If youspecify 0 only one notification is sent out.
notification interval: If the interval between first notification andlast notification is more than one notification this specifies the in-terval in minutes between notifications.
escalation period: during which time period is this escalationvalid.
escalation options: which notifications that should be sent out.
Note: To make escalations work you need to set ‘notification interval’to something else than 0 in the configuration for the host.
Copyright © op5 AB, www.op5.com. All rights reserved. 77
op5 Monitor 3.2 Manual
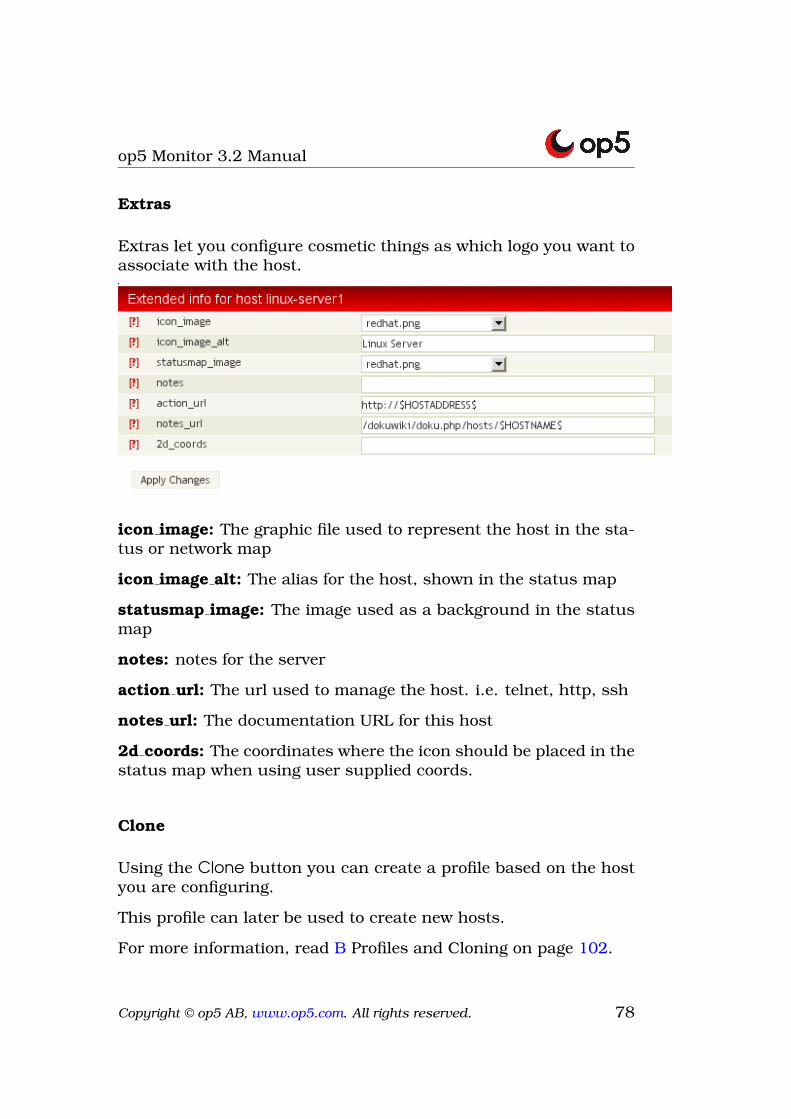
Extras
Extras let you configure cosmetic things as which logo you want toassociate with the host.
icon image: The graphic file used to represent the host in the sta-tus or network map
icon image alt: The alias for the host, shown in the status map
statusmap image: The image used as a background in the statusmap
notes: notes for the server
action url: The url used to manage the host. i.e. telnet, http, ssh
notes url: The documentation URL for this host
2d coords: The coordinates where the icon should be placed in thestatus map when using user supplied coords.
Clone
Using the Clone button you can create a profile based on the hostyou are configuring.
This profile can later be used to create new hosts.
For more information, read B Profiles and Cloning on page 102.
Copyright © op5 AB, www.op5.com. All rights reserved. 78
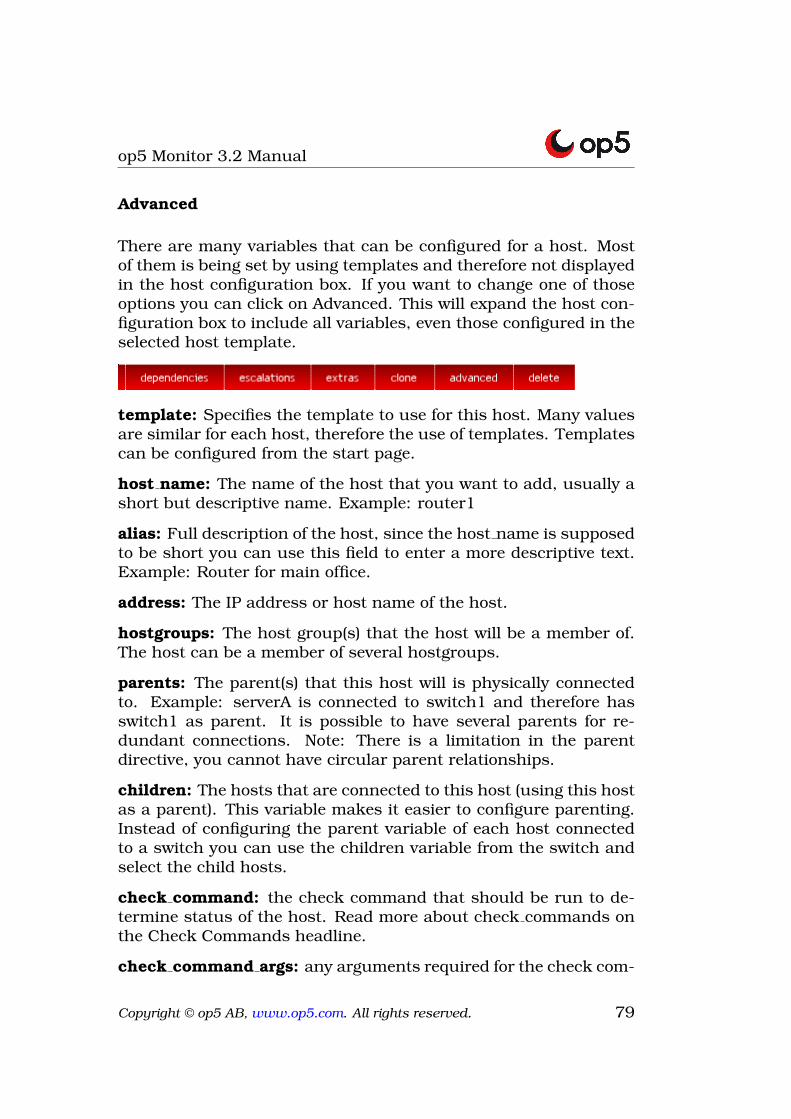
op5 Monitor 3.2 Manual
Advanced
There are many variables that can be configured for a host. Mostof them is being set by using templates and therefore not displayedin the host configuration box. If you want to change one of thoseoptions you can click on Advanced. This will expand the host con-figuration box to include all variables, even those configured in theselected host template.
template: Specifies the template to use for this host. Many valuesare similar for each host, therefore the use of templates. Templatescan be configured from the start page.
host name: The name of the host that you want to add, usually ashort but descriptive name. Example: router1
alias: Full description of the host, since the host name is supposedto be short you can use this field to enter a more descriptive text.Example: Router for main office.
address: The IP address or host name of the host.
hostgroups: The host group(s) that the host will be a member of.The host can be a member of several hostgroups.
parents: The parent(s) that this host will is physically connectedto. Example: serverA is connected to switch1 and therefore hasswitch1 as parent. It is possible to have several parents for re-dundant connections. Note: There is a limitation in the parentdirective, you cannot have circular parent relationships.
children: The hosts that are connected to this host (using this hostas a parent). This variable makes it easier to configure parenting.Instead of configuring the parent variable of each host connectedto a switch you can use the children variable from the switch andselect the child hosts.
check command: the check command that should be run to de-termine status of the host. Read more about check commands onthe Check Commands headline.
check command args: any arguments required for the check com-
Copyright © op5 AB, www.op5.com. All rights reserved. 79
op5 Monitor 3.2 Manual
mand to work
contact groups: The contact group(s) this hosts notifications aresent to.
max check attempts: The number of checks required for the hostto enter HARD state and send out notifications.
checks enabled: if checks are enabled or not, normally yes.
event handler: Event handler is a check command that is runevery time a host changes state.
event handler args: any arguments needed for the event handlercommand.
event handler enabled: specifies if event handlers should be usedor not.
low flap threshold: se below note about flap detection
high flap threshold: se below note about flap detection
flap detection enabled: if flap detection is enabled or not. Nor-mally flap detection is enabled on global basis and not per host.
process perf data: Most of the plugins outputs data in two ways.The normal output which you can see in your notifications and webgui, but also performance output. Performance output is a more“machine friendly” output that can be parsed by a script or a pieceof software. Currently performance data is used to create graphsof the check result for some standard checks.
retain status information: Retain status information between restartsof op5 Monitor.
retain nonstatus information: Retain other information betweenrestarts of op5 Monitor.
notification interval: The interval in minutes when the host isdown or unreachable. If this is set to 0 (default) only one notifica-tion is sent out.
first notification delay: The amount of minutes to delay the hostnotification. This can be useful if you want to be able to reboot aserver without notifying anyone.
Copyright © op5 AB, www.op5.com. All rights reserved. 80
op5 Monitor 3.2 Manual
notification period: During which period notifications for this hostshould be sent out.
notification options: Which notifications that should be sent outfor this host.
notifications enabled: If notifications are enabled or not, defaultis Yes.
stalking options: Stalking is used mainly for troubleshooting. Ifyou enable stalking, op5 Monitor will log everything related to thehost. Note that this will probably cause the log file to grow andtherefore slow down all reports. Use this with care.
FILE: Which file this host object should be saved in.
Note: Flap detection is a useful mechanism to detect reoccurringproblems with a host or service. The logic works like this.
The result of the 21 last checks is saved in the memory. High flap thresholddefines a value in percent of how much the host or service haschanged its state. If the high flap threshold value is exceeded thehost/service enters flapping state. To exit flapping state the per-centage must go down to the low flap threshold value.
8.3.4 Services for host
If you click on the “Services for host” link in the Host configurationwindow you will be directed to the Service configuration windowwhere you can configure services.
The service objects defines what should be checked on your host.
Copyright © op5 AB, www.op5.com. All rights reserved. 81
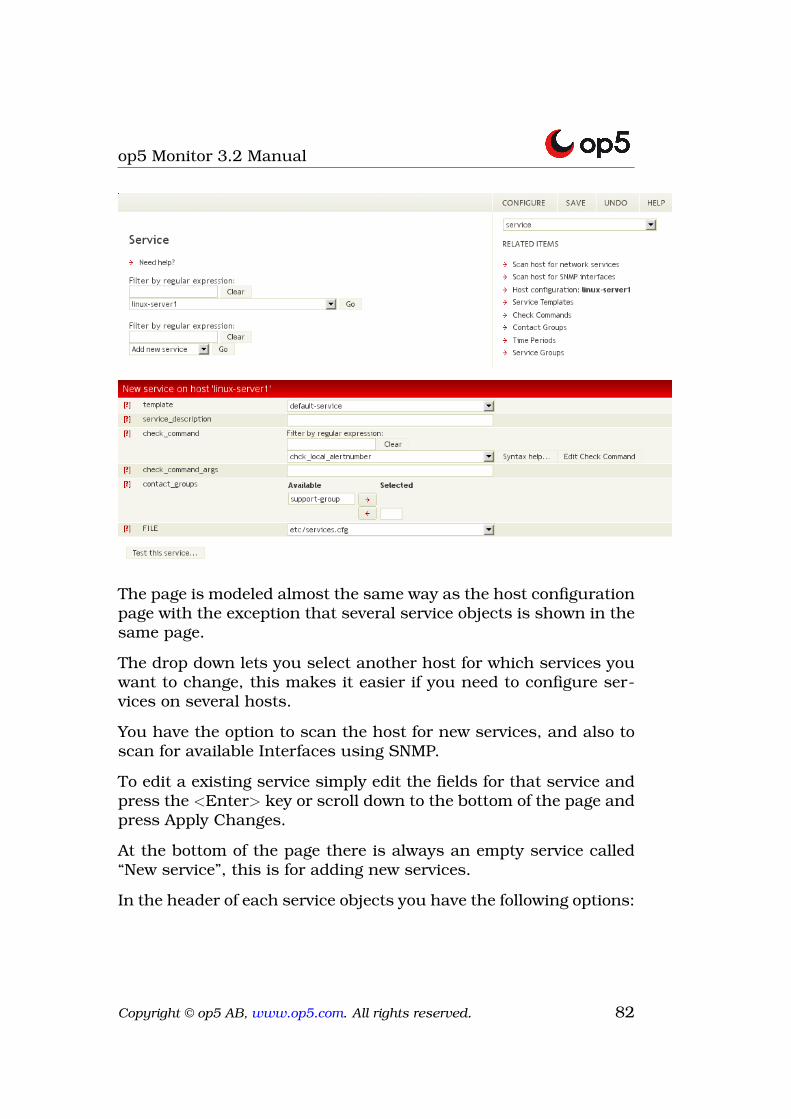
op5 Monitor 3.2 Manual
The page is modeled almost the same way as the host configurationpage with the exception that several service objects is shown in thesame page.
The drop down lets you select another host for which services youwant to change, this makes it easier if you need to configure ser-vices on several hosts.
You have the option to scan the host for new services, and also toscan for available Interfaces using SNMP.
To edit a existing service simply edit the fields for that service andpress the <Enter> key or scroll down to the bottom of the page andpress Apply Changes.
At the bottom of the page there is always an empty service called“New service”, this is for adding new services.
In the header of each service objects you have the following options:
Copyright © op5 AB, www.op5.com. All rights reserved. 82
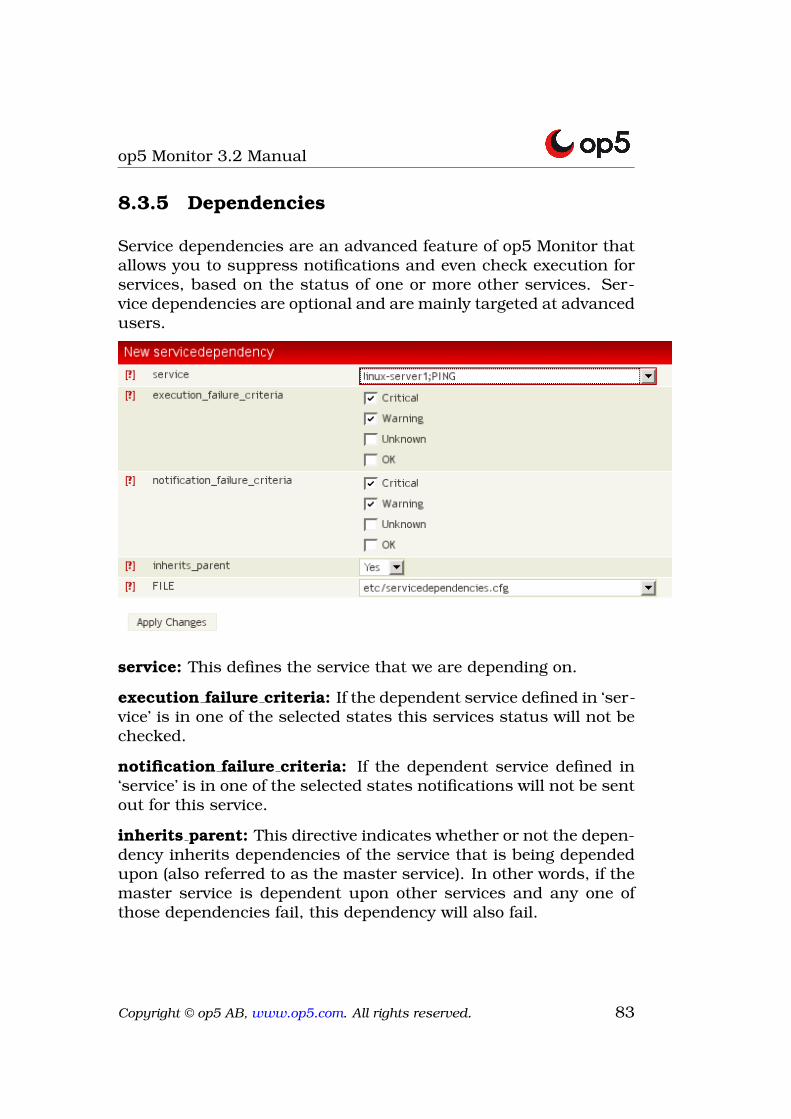
op5 Monitor 3.2 Manual
8.3.5 Dependencies
Service dependencies are an advanced feature of op5 Monitor thatallows you to suppress notifications and even check execution forservices, based on the status of one or more other services. Ser-vice dependencies are optional and are mainly targeted at advancedusers.
service: This defines the service that we are depending on.
execution failure criteria: If the dependent service defined in ‘ser-vice’ is in one of the selected states this services status will not bechecked.
notification failure criteria: If the dependent service defined in‘service’ is in one of the selected states notifications will not be sentout for this service.
inherits parent: This directive indicates whether or not the depen-dency inherits dependencies of the service that is being dependedupon (also referred to as the master service). In other words, if themaster service is dependent upon other services and any one ofthose dependencies fail, this dependency will also fail.
Copyright © op5 AB, www.op5.com. All rights reserved. 83
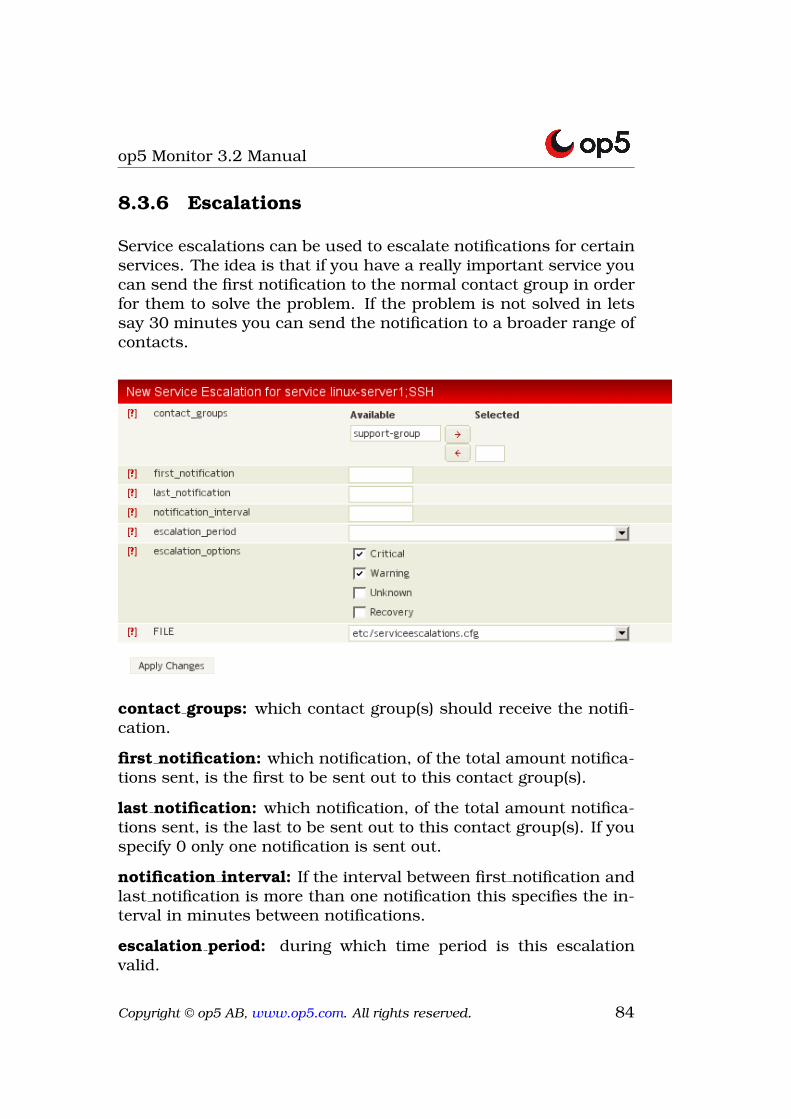
op5 Monitor 3.2 Manual
8.3.6 Escalations
Service escalations can be used to escalate notifications for certainservices. The idea is that if you have a really important service youcan send the first notification to the normal contact group in orderfor them to solve the problem. If the problem is not solved in letssay 30 minutes you can send the notification to a broader range ofcontacts.
contact groups: which contact group(s) should receive the notifi-cation.
first notification: which notification, of the total amount notifica-tions sent, is the first to be sent out to this contact group(s).
last notification: which notification, of the total amount notifica-tions sent, is the last to be sent out to this contact group(s). If youspecify 0 only one notification is sent out.
notification interval: If the interval between first notification andlast notification is more than one notification this specifies the in-terval in minutes between notifications.
escalation period: during which time period is this escalationvalid.
Copyright © op5 AB, www.op5.com. All rights reserved. 84
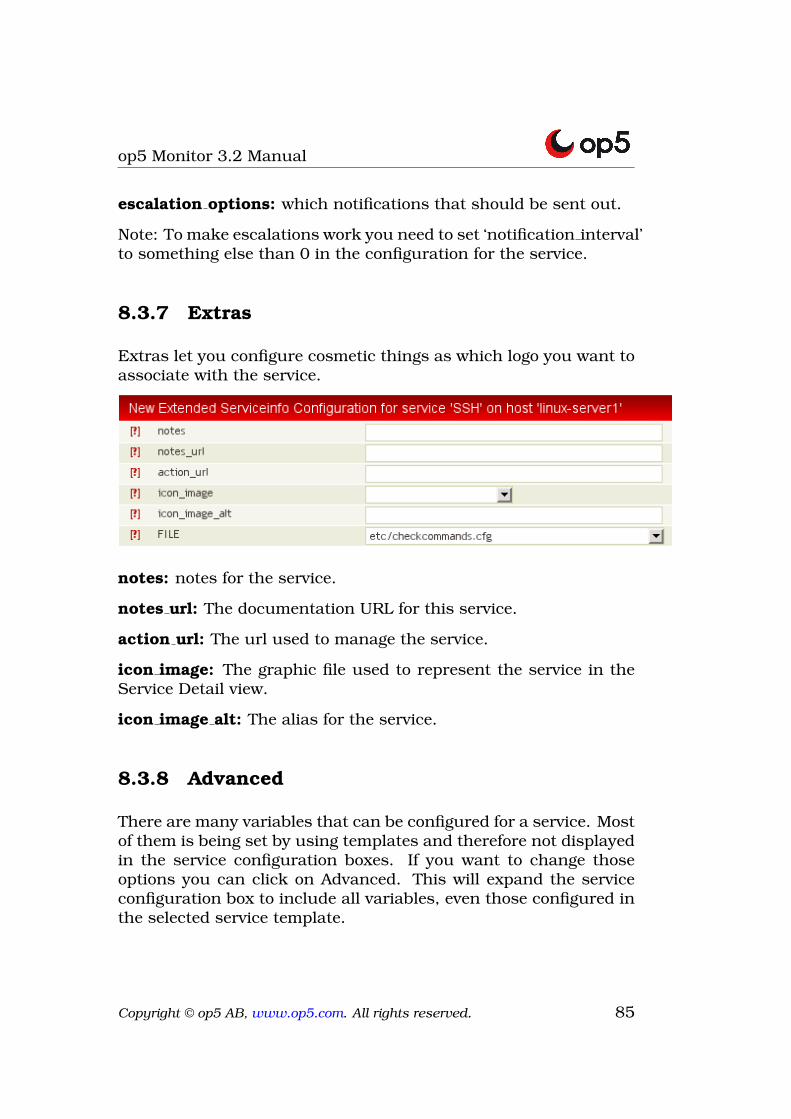
op5 Monitor 3.2 Manual
escalation options: which notifications that should be sent out.
Note: To make escalations work you need to set ‘notification interval’to something else than 0 in the configuration for the service.
8.3.7 Extras
Extras let you configure cosmetic things as which logo you want toassociate with the service.
notes: notes for the service.
notes url: The documentation URL for this service.
action url: The url used to manage the service.
icon image: The graphic file used to represent the service in theService Detail view.
icon image alt: The alias for the service.
8.3.8 Advanced
There are many variables that can be configured for a service. Mostof them is being set by using templates and therefore not displayedin the service configuration boxes. If you want to change thoseoptions you can click on Advanced. This will expand the serviceconfiguration box to include all variables, even those configured inthe selected service template.
Copyright © op5 AB, www.op5.com. All rights reserved. 85
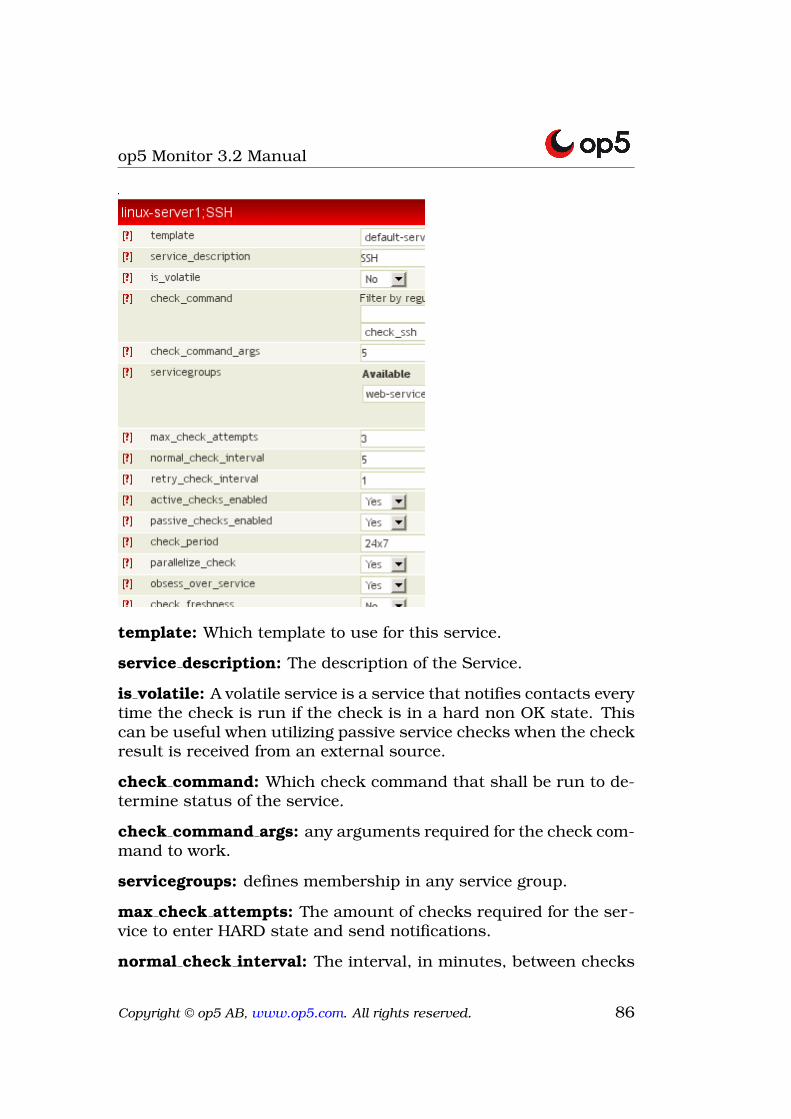
op5 Monitor 3.2 Manual
template: Which template to use for this service.
service description: The description of the Service.
is volatile: A volatile service is a service that notifies contacts everytime the check is run if the check is in a hard non OK state. Thiscan be useful when utilizing passive service checks when the checkresult is received from an external source.
check command: Which check command that shall be run to de-termine status of the service.
check command args: any arguments required for the check com-mand to work.
servicegroups: defines membership in any service group.
max check attempts: The amount of checks required for the ser-vice to enter HARD state and send notifications.
normal check interval: The interval, in minutes, between checks
Copyright © op5 AB, www.op5.com. All rights reserved. 86
op5 Monitor 3.2 Manual
of the service.
retry check interval: The interval, in minutes, between checks ifthe previous check failed.
active checks enabled: Active checks enabled, default is Yes.
passive checks enabled: Passive checks enabled, default is Yes.
check period: During which time period this service should bechecked.
parallelize check: Allow this check to be run in parallel with otherchecks. Default is Yes . Changing this can drastically influenceperformance.
obsess over service: This command can be used to tell op5 Mon-itor to run a script after each service check. It can be used forcertain redundant configurations. Don’t use this if you’re not sureabout what it does.
check freshness: op5 Monitor supports a feature that does fresh-ness checking on the results of host and service checks. This fea-ture is useful when you want to ensure that passive checks arebeing received as frequently as you want.
freshness threshold: This directive is used to specify the fresh-ness threshold (in seconds) for this service. If you set this directiveto a value of 0, op5 Monitor will determine a freshness thresholdto use automatically.
event handler: Command that should be run in case of a statechange.
event handler args: Arguments needed for the event handler com-mand.
event handler enabled: Enable or disable Event handlers. Defaultvalue is Yes.
low flap threshold: se below note about flap detection.
high flap threshold: se below note about flap detection.
flap detection enabled: if flap detection is enabled or not. Nor-mally flap detection is enabled on global basis and not per service.
Copyright © op5 AB, www.op5.com. All rights reserved. 87
op5 Monitor 3.2 Manual
process perf data: Most of the plugins outputs data in two ways.The normal output which you can see in your notifications and webgui, but also performance output. Performance output is a more“machine friendly” output that can be parsed by a script or a pieceof software. Currently performance data is used to create graphsof the check result for some standard checks.
retain status information: Retain status information between restartsof op5 Monitor. This is a good thing to enable, otherwise the statuswill be lost when you save your new configuration.
retain nonstatus information: Retain other information betweenrestarts of op5 Monitor. This is also a good thing to enable to notloose status data when saving new configurations.
notification interval: The interval in minutes between notifica-tions, when the service is Critical, Warning, or Unknown. If this isset to 0 (default) only one notification is sent out.
notification period: During which period notifications for this ser-vice should be sent out.
notification options: Which notifications that should be sent outfor this service.
notifications enabled: If notifications are enabled or not, defaultis Yes.
contact groups: The contact group(s) this service notifications issent to.
stalking options: Stalking is used mainly for troubleshooting. Ifyou enable stalking, op5 Monitor will log everything related to thehost. Note that this will probably cause the log file to grow andtherefore slow down all reports. Use this with care.
FILE: Which file this host object should be saved in.
Note: Flap detection is a useful mechanism to detect reoccurringproblems with a host or service. The logic works like this.
The result of the 21 last checks is saved in the memory. High flap thresholddefines a value in percent of how much the host or service haschanged its state. If the high flap threshold value is exceeded thehost/service enters flapping state. To exit flapping state the per-
Copyright © op5 AB, www.op5.com. All rights reserved. 88
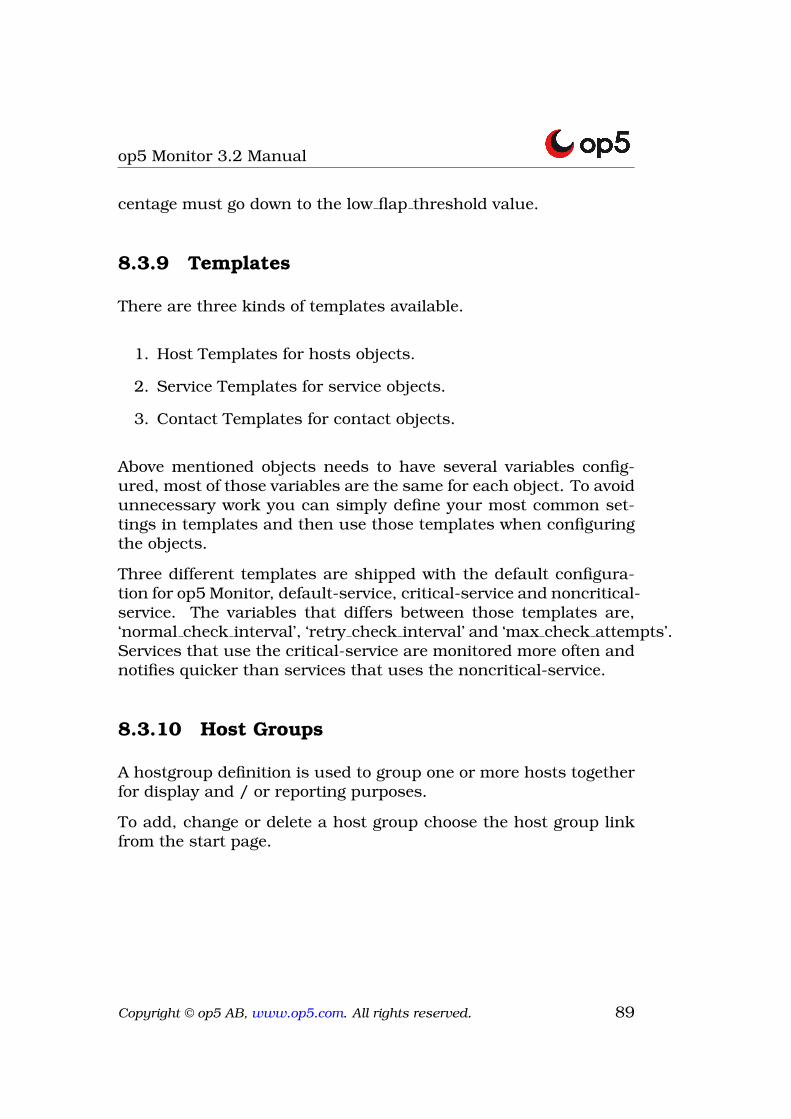
op5 Monitor 3.2 Manual
centage must go down to the low flap threshold value.
8.3.9 Templates
There are three kinds of templates available.
1. Host Templates for hosts objects.
2. Service Templates for service objects.
3. Contact Templates for contact objects.
Above mentioned objects needs to have several variables config-ured, most of those variables are the same for each object. To avoidunnecessary work you can simply define your most common set-tings in templates and then use those templates when configuringthe objects.
Three different templates are shipped with the default configura-tion for op5 Monitor, default-service, critical-service and noncritical-service. The variables that differs between those templates are,‘normal check interval’, ‘retry check interval’ and ‘max check attempts’.Services that use the critical-service are monitored more often andnotifies quicker than services that uses the noncritical-service.
8.3.10 Host Groups
A hostgroup definition is used to group one or more hosts togetherfor display and / or reporting purposes.
To add, change or delete a host group choose the host group linkfrom the start page.
Copyright © op5 AB, www.op5.com. All rights reserved. 89
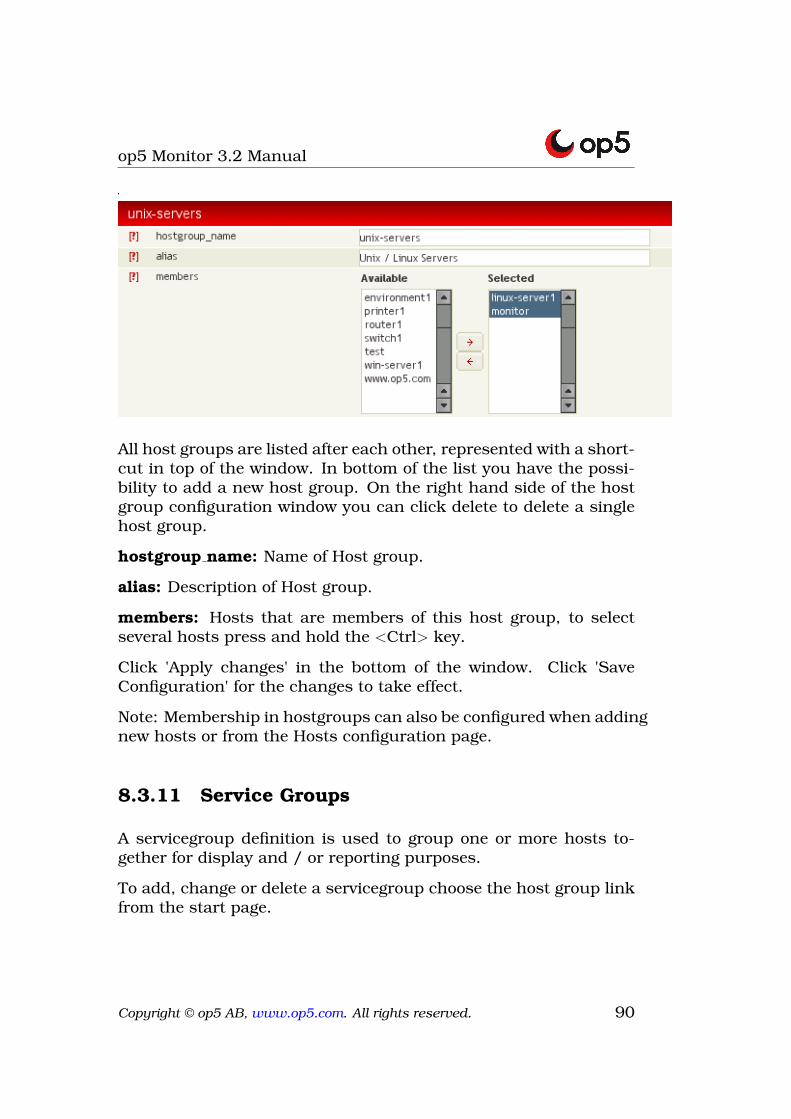
op5 Monitor 3.2 Manual
All host groups are listed after each other, represented with a short-cut in top of the window. In bottom of the list you have the possi-bility to add a new host group. On the right hand side of the hostgroup configuration window you can click delete to delete a singlehost group.
hostgroup name: Name of Host group.
alias: Description of Host group.
members: Hosts that are members of this host group, to selectseveral hosts press and hold the <Ctrl> key.
Click 'Apply changes' in the bottom of the window. Click 'SaveConfiguration' for the changes to take effect.
Note: Membership in hostgroups can also be configured when addingnew hosts or from the Hosts configuration page.
8.3.11 Service Groups
A servicegroup definition is used to group one or more hosts to-gether for display and / or reporting purposes.
To add, change or delete a servicegroup choose the host group linkfrom the start page.
Copyright © op5 AB, www.op5.com. All rights reserved. 90

op5 Monitor 3.2 Manual
All service groups are listed after each other represented with ashortcut in top of the window. In bottom of the list you have thepossibility to add a new service group. On the right hand side of theservice group configuration window you can click delete to deletechosen service group.
servicegroup name: Name of the service group
alias: Description of service group
members: Services that are members of this service group
Click 'Apply changes' in the bottom of the window. Click 'SaveConfiguration' for the changes to take effect.
Servicegroups can be specifically useful to visualize business pro-cesses. In the image above a servicegroup named ‘email-service-group’ is configured. If you put all service checks that are relatedto email in that group, i.e. DNS, internet connections, POP3, SMTPand so on, you will get a good view of how your email service isworking in total.
This information can be used for real-time troubleshooting but alsofor reports.
Copyright © op5 AB, www.op5.com. All rights reserved. 91
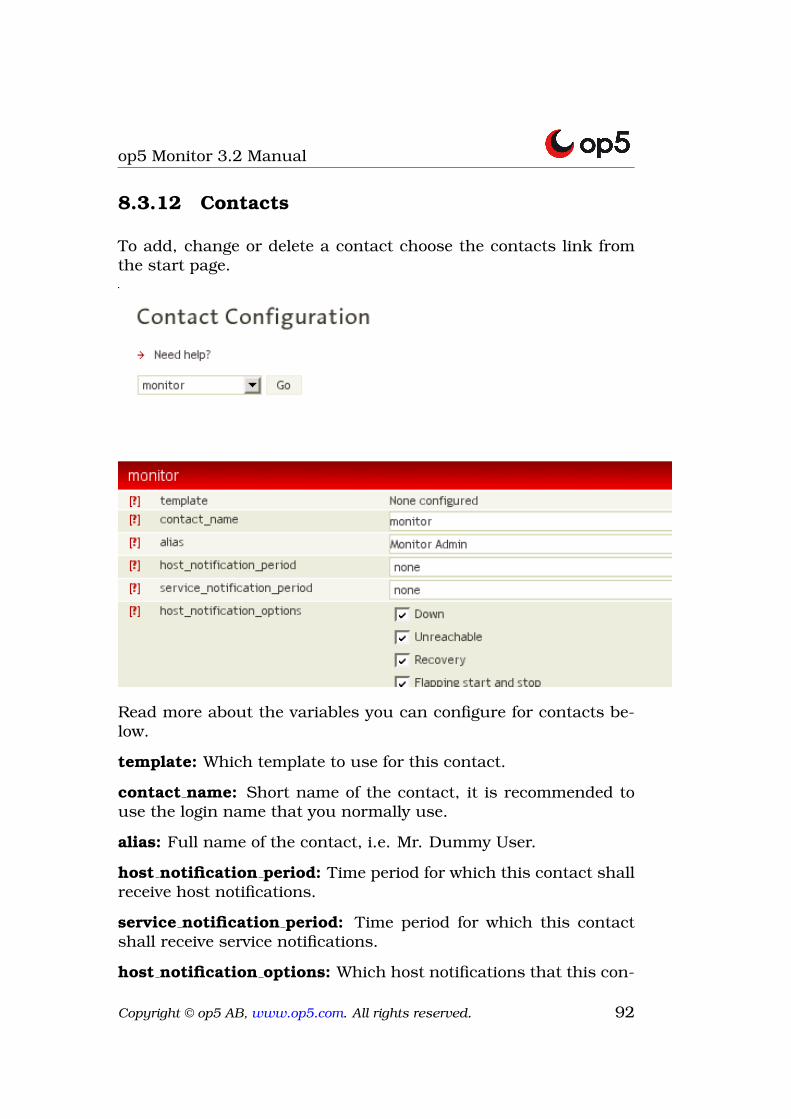
op5 Monitor 3.2 Manual
8.3.12 Contacts
To add, change or delete a contact choose the contacts link fromthe start page.
Read more about the variables you can configure for contacts be-low.
template: Which template to use for this contact.
contact name: Short name of the contact, it is recommended touse the login name that you normally use.
alias: Full name of the contact, i.e. Mr. Dummy User.
host notification period: Time period for which this contact shallreceive host notifications.
service notification period: Time period for which this contactshall receive service notifications.
host notification options: Which host notifications that this con-
Copyright © op5 AB, www.op5.com. All rights reserved. 92
op5 Monitor 3.2 Manual
tact shall receive.
service notification options: Which service notifications that thiscontact shall receive.
host notification commands: Command that is executed to sendout host notifications. Op5 Monitor comes with a default host notification command,host-notify. This command can send notifications using email andsms. You can also add your own notification commands if you like.
host notification commands args: Arguments that might be neededfor the host notification command.
service notification commands: Command that is executed tosend out service notifications. Op5 Monitor comes with a defaultservice notification command, service-notify. This command cansend notifications using email and sms. You can also add yourown notification commands if you like.
service notification commands args: Arguments that might beneeded for the service notification command.
contactgroups: The contact group(s) this contact is a member of.
email: This contacts email address, for receiving email notifica-tions.
pager: This contacts cell phone number, for receiving SMS notifi-cations. Note: The number must include country code. Examplefor a Swedish number, 46701123456.
address1 - 6: These variables are reserved for other kind of noti-fication options. If you create your own notification script you canuse these variables to specify notification data.
Tip 1: If you want to notify an individual with both email and SMSwe recommend to define two separate contacts with different hostand service notification options since you normally want to definedifferent settings for email and SMS.
Copyright © op5 AB, www.op5.com. All rights reserved. 93
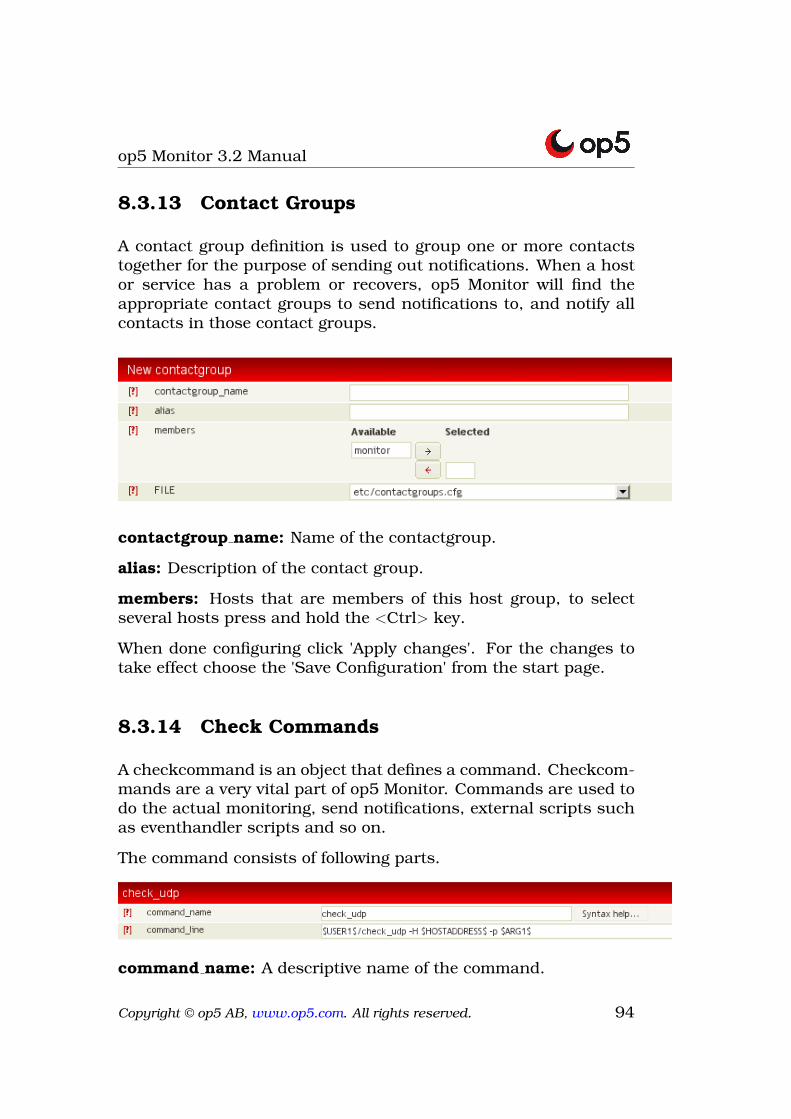
op5 Monitor 3.2 Manual
8.3.13 Contact Groups
A contact group definition is used to group one or more contactstogether for the purpose of sending out notifications. When a hostor service has a problem or recovers, op5 Monitor will find theappropriate contact groups to send notifications to, and notify allcontacts in those contact groups.
contactgroup name: Name of the contactgroup.
alias: Description of the contact group.
members: Hosts that are members of this host group, to selectseveral hosts press and hold the <Ctrl> key.
When done configuring click 'Apply changes'. For the changes totake effect choose the 'Save Configuration' from the start page.
8.3.14 Check Commands
A checkcommand is an object that defines a command. Checkcom-mands are a very vital part of op5 Monitor. Commands are used todo the actual monitoring, send notifications, external scripts suchas eventhandler scripts and so on.
The command consists of following parts.
command name: A descriptive name of the command.
Copyright © op5 AB, www.op5.com. All rights reserved. 94
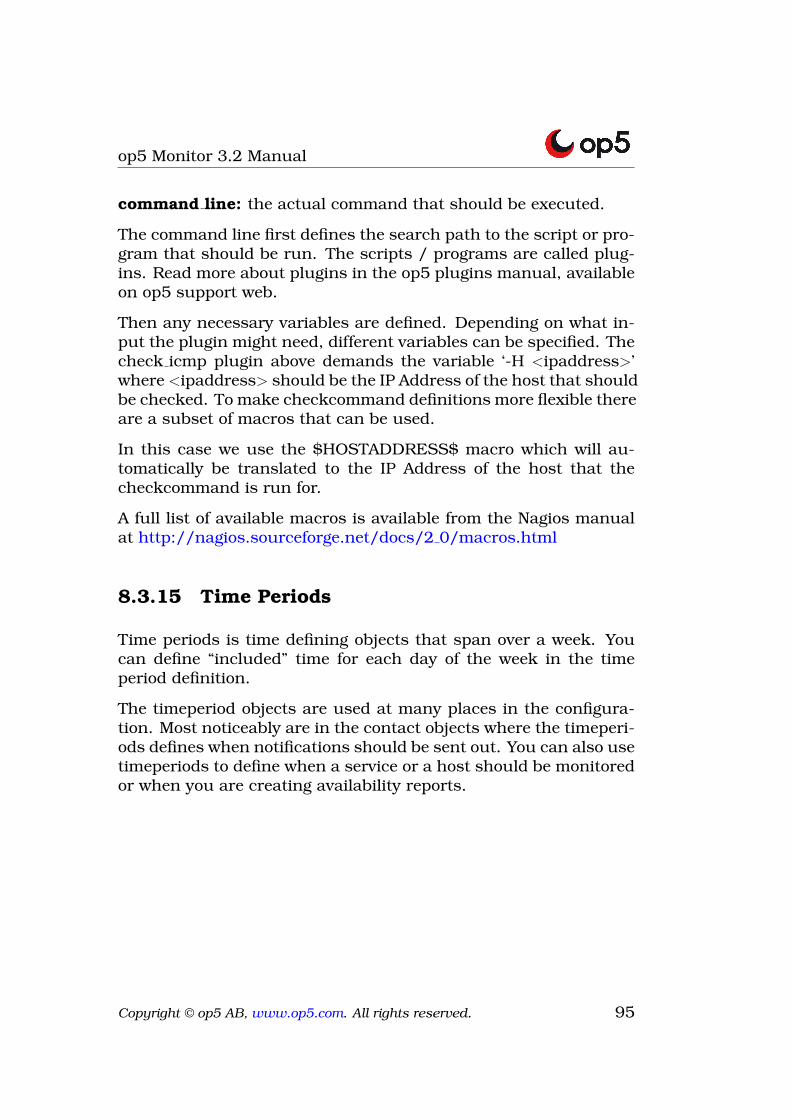
op5 Monitor 3.2 Manual
command line: the actual command that should be executed.
The command line first defines the search path to the script or pro-gram that should be run. The scripts / programs are called plug-ins. Read more about plugins in the op5 plugins manual, availableon op5 support web.
Then any necessary variables are defined. Depending on what in-put the plugin might need, different variables can be specified. Thecheck icmp plugin above demands the variable ‘-H <ipaddress>’where <ipaddress> should be the IP Address of the host that shouldbe checked. To make checkcommand definitions more flexible thereare a subset of macros that can be used.
In this case we use the $HOSTADDRESS$ macro which will au-tomatically be translated to the IP Address of the host that thecheckcommand is run for.
A full list of available macros is available from the Nagios manualat http://nagios.sourceforge.net/docs/2 0/macros.html
8.3.15 Time Periods
Time periods is time defining objects that span over a week. Youcan define “included” time for each day of the week in the timeperiod definition.
The timeperiod objects are used at many places in the configura-tion. Most noticeably are in the contact objects where the timeperi-ods defines when notifications should be sent out. You can also usetimeperiods to define when a service or a host should be monitoredor when you are creating availability reports.
Copyright © op5 AB, www.op5.com. All rights reserved. 95
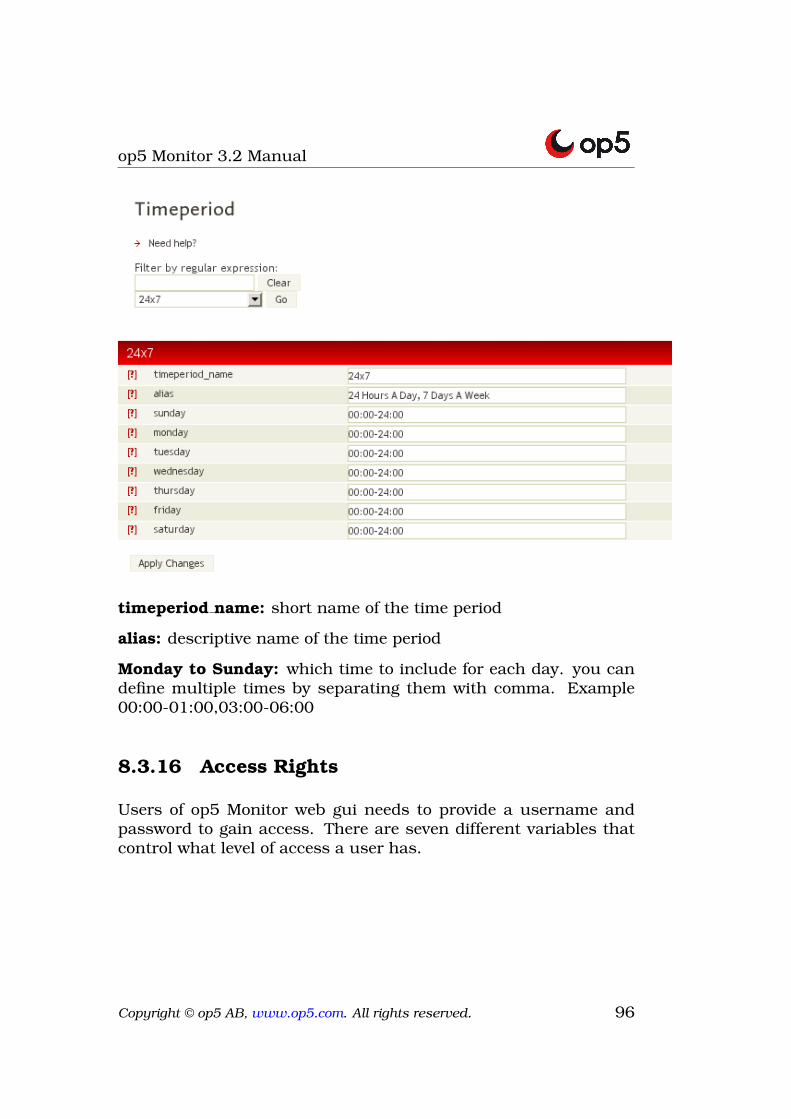
op5 Monitor 3.2 Manual
timeperiod name: short name of the time period
alias: descriptive name of the time period
Monday to Sunday: which time to include for each day. you candefine multiple times by separating them with comma. Example00:00-01:00,03:00-06:00
8.3.16 Access Rights
Users of op5 Monitor web gui needs to provide a username andpassword to gain access. There are seven different variables thatcontrol what level of access a user has.
Copyright © op5 AB, www.op5.com. All rights reserved. 96
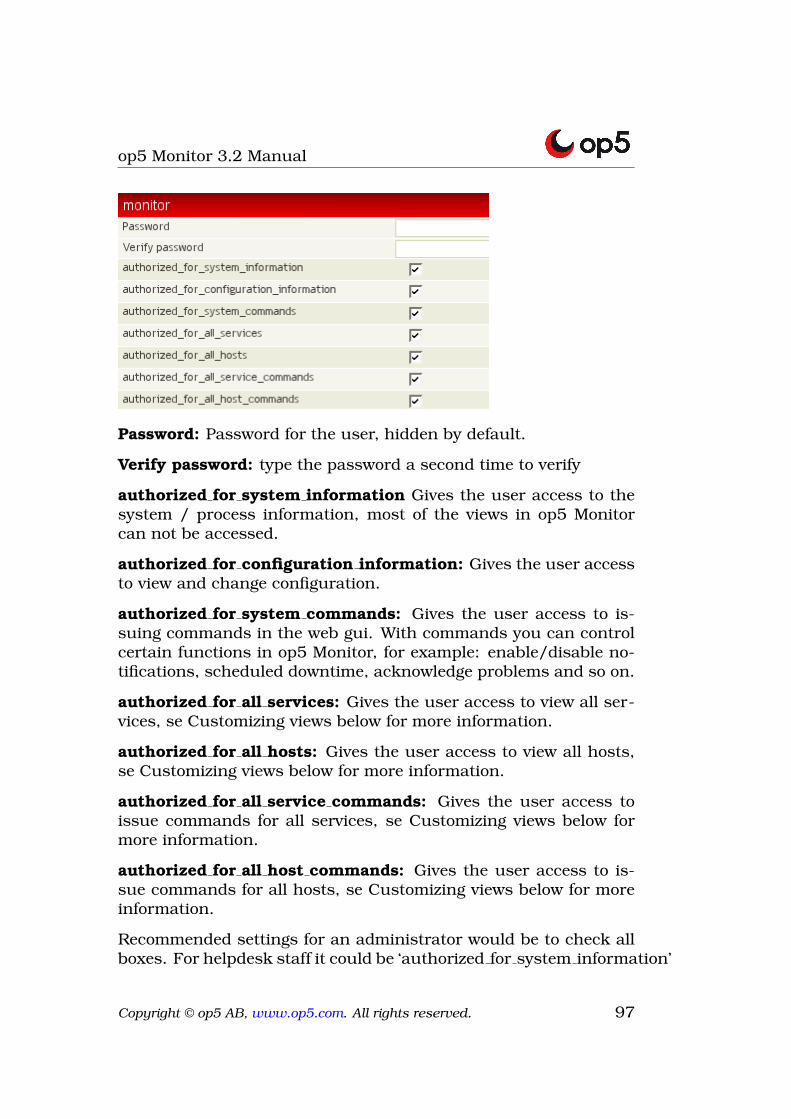
op5 Monitor 3.2 Manual
Password: Password for the user, hidden by default.
Verify password: type the password a second time to verify
authorized for system information Gives the user access to thesystem / process information, most of the views in op5 Monitorcan not be accessed.
authorized for configuration information: Gives the user accessto view and change configuration.
authorized for system commands: Gives the user access to is-suing commands in the web gui. With commands you can controlcertain functions in op5 Monitor, for example: enable/disable no-tifications, scheduled downtime, acknowledge problems and so on.
authorized for all services: Gives the user access to view all ser-vices, se Customizing views below for more information.
authorized for all hosts: Gives the user access to view all hosts,se Customizing views below for more information.
authorized for all service commands: Gives the user access toissue commands for all services, se Customizing views below formore information.
authorized for all host commands: Gives the user access to is-sue commands for all hosts, se Customizing views below for moreinformation.
Recommended settings for an administrator would be to check allboxes. For helpdesk staff it could be ‘authorized for system information’
Copyright © op5 AB, www.op5.com. All rights reserved. 97
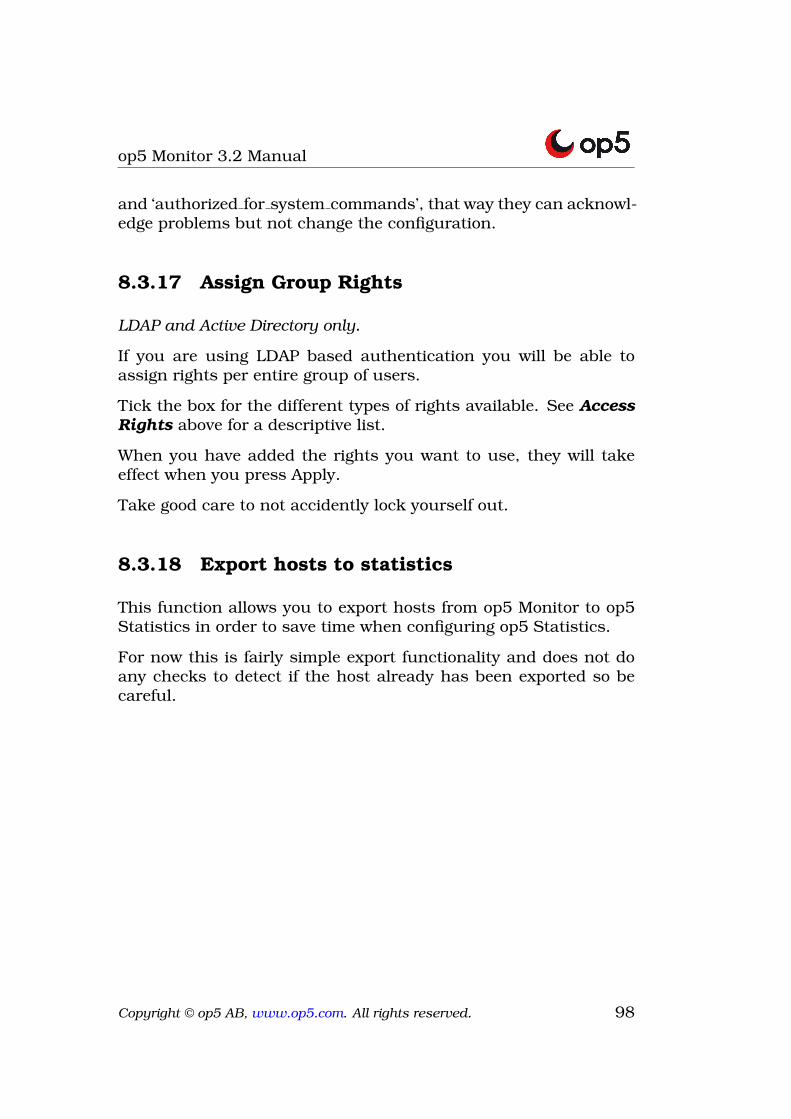
op5 Monitor 3.2 Manual
and ‘authorized for system commands’, that way they can acknowl-edge problems but not change the configuration.
8.3.17 Assign Group Rights
LDAP and Active Directory only.
If you are using LDAP based authentication you will be able toassign rights per entire group of users.
Tick the box for the different types of rights available. See AccessRights above for a descriptive list.
When you have added the rights you want to use, they will takeeffect when you press Apply.
Take good care to not accidently lock yourself out.
8.3.18 Export hosts to statistics
This function allows you to export hosts from op5 Monitor to op5Statistics in order to save time when configuring op5 Statistics.
For now this is fairly simple export functionality and does not doany checks to detect if the host already has been exported so becareful.
Copyright © op5 AB, www.op5.com. All rights reserved. 98
op5 Monitor 3.2 Manual
Select which host(s) you want to export, change the SNMP Commu-nity if needed and select which Host template to use in statistics.You can also specify which host identifier in op5 Monitor that shallbe used as Host Description in statistics.
Click Export hosts and you are done.
Copyright © op5 AB, www.op5.com. All rights reserved. 99
op5 Monitor 3.2 Manual
Appendix A
Customizing Views
It is possible to configure a user with limited access to the systemnot only by denying access to certain views using Access Rightsbut also by only letting the user see a selected choice of hosts andservices.
In smaller companies or organizations this might not be needed butfor larger enterprises it can be quite useful to be able to customizethe objects op5 Monitor displays for each user or team of users.This function can also be useful if you are a hosting provider.
Customization of the gui can be done in three steps where the laststep is optional and only for advanced users since it requires edit-ing html or php files on the op5 Monitor system.
1. Configure a new contact.
2. Add the contact to an existing contactgroup or create a newcontactgroup specific for the new contact. If you created anew contactgroup make sure to add the contact group for thehosts and services that you want to make available in thecustomized view.
3. Configure a user in access rights with the exact same nameas the contact you created. When selecting options do notuse the last fore options, authorized for all . By doing this thenew user will only see the hosts and services that uses thecontactgroup that he is a member of.
Copyright © op5 AB, www.op5.com. All rights reserved. 100
op5 Monitor 3.2 Manual
4. Create a directory in /opt/monitor/share/ with the same nameas the contact and user you just configured. Create your ownindex.html and side.html files, you can use the files availablein /opt/monitor/share as start. Make sure to set the rightpermissions on the directory and the files so that the webserver can read the files.
Remember the third step is optional and only for advanced users.
To test your new “limited” simply log on as the new user you justcreated.
Copyright © op5 AB, www.op5.com. All rights reserved. 101
op5 Monitor 3.2 Manual
Appendix B
Profiles and Cloning
B.1 Overview
Profiles and Cloning is a feature new to Monitor 3.2.x. It is a fea-ture aimed at solving the task of configuring many similar serverswithout having to repeat many steps.
A profile is essentially a stored copy of a host. The profile can thenbe used when creating new hosts, creating an initial setup withservices.
The profile will include services from the original host – when youcreate the profile you are presented with a choice of which servicesto include.
Copyright © op5 AB, www.op5.com. All rights reserved. 102
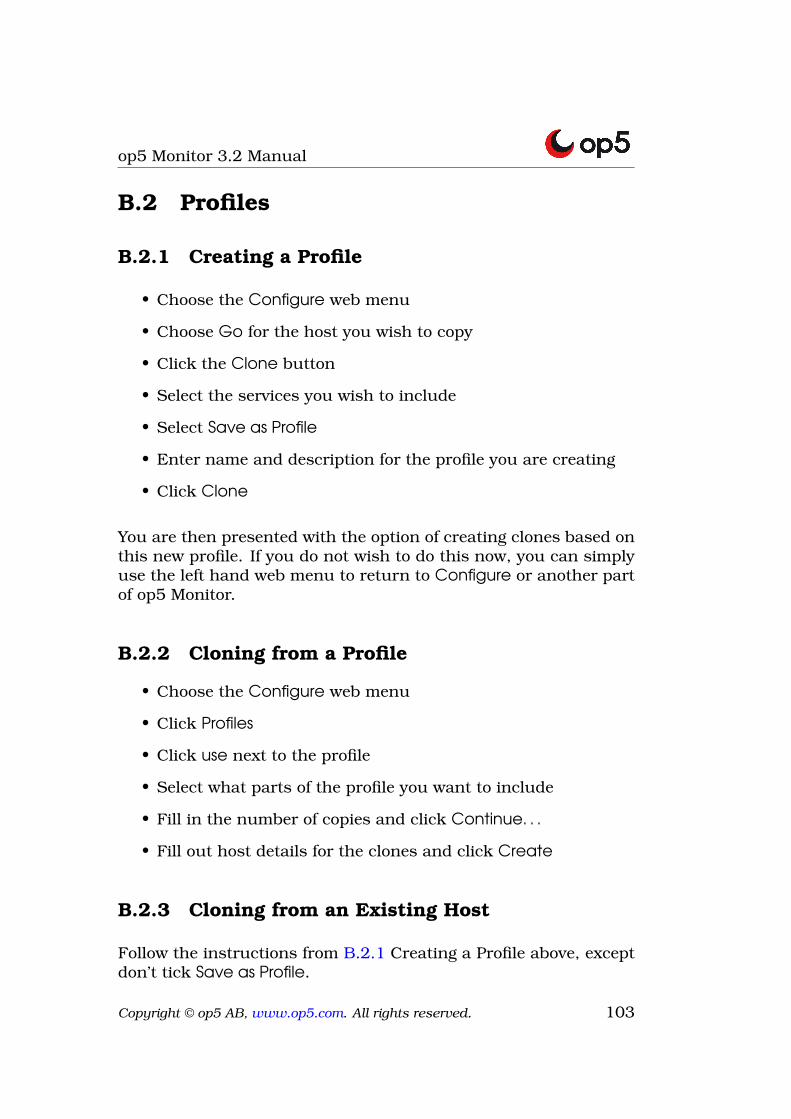
op5 Monitor 3.2 Manual
B.2 Profiles
B.2.1 Creating a Profile
• Choose the Configure web menu
• Choose Go for the host you wish to copy
• Click the Clone button
• Select the services you wish to include
• Select Save as Profile
• Enter name and description for the profile you are creating
• Click Clone
You are then presented with the option of creating clones based onthis new profile. If you do not wish to do this now, you can simplyuse the left hand web menu to return to Configure or another partof op5 Monitor.
B.2.2 Cloning from a Profile
• Choose the Configure web menu
• Click Profiles
• Click use next to the profile
• Select what parts of the profile you want to include
• Fill in the number of copies and click Continue. . .
• Fill out host details for the clones and click Create
B.2.3 Cloning from an Existing Host
Follow the instructions from B.2.1 Creating a Profile above, exceptdon’t tick Save as Profile.
Copyright © op5 AB, www.op5.com. All rights reserved. 103
op5 Monitor 3.2 Manual
Appendix C
Basing Work Flows aroundMonitor
The need for an IT department to follow up on user questions isquite obvious and most organisations use some sort of troubleticket system for this.
The need to administer faults and preventive maintenance, how-ever, is often forgotten about and that work is then performed as apart of general server and network maintenance.
Anybody who has worked using a trouble ticket system will recog-nize how it makes it easy to make sure that the work gets doneeven if someone is on holiday, and how it makes it easier to keeptrack of how time is spent.
In theory, an op5 Monitor notification equals a problem and couldgenerate a trouble ticket. It is not always that easy though, so wewill present an example scenario to illustrate how you can integrateop5 Monitor in your organisation.
C.1 Getting the Contacts Right
If the notifications are annoying, they will be ignored. This is avery important rule of thumb - enabling notifications is better doneslowly.
Copyright © op5 AB, www.op5.com. All rights reserved. 104
op5 Monitor 3.2 Manual
Most Monitor users have both email and mobile phone text mes-sages for notifications. Typically, you should only send messagesto mobile phones out of work hours, and only for the most impor-tant services and hosts. To throughout the workday receive textmessages perhaps because of planned work does not tend to godown well.
You can also start off only sending critical notifications and hostdown messages via email, until you’ve seen that this works welland people know how to deal with the messages they receive.
C.2 Tuning Alerts
It is very important to not have “false” alerts – meaning alerts thatthe administrators do not think of as faults.
For instance - a ping response time of 100ms is unacceptable if itis in the same switch, but on a WAN link it might be normal.
It is very important that anything red or orange on your op5 Mon-itor – perhaps you have your op5 Monitor on a wall mounted TV –should be trustworthy as an important issue to deal with. There-fore, on of the highest priorities for having a successful networkmonitoring is adjusting the levels so that the normal state of thingsis that everything is green.
C.3 Updating Monitor
When you have a new installation of Monitor, it should be up todate with regards to your servers and network structure.
A common mistake is to forgetting to update as new servers areadded or changes are made.
To prevent your system from degrading over time, you should notonly have at least one person with the dedicated responsibility ofmaking sure op5 Monitor is up to date – but also it needs to part ofthe protocol for anyone installing servers to configure it in Monitor
Copyright © op5 AB, www.op5.com. All rights reserved. 105
op5 Monitor 3.2 Manual
aswell. The web interface makes it easy for everyone in your ITdepartment to manage their own servers and other devices.
C.4 Handling Alerts
It is essential that all notifications are dealt with. If you have afalse alarm it still needs action – the action is to change theservice settings.
If you have a trouble ticket system already, alerts can be registeredin this. op5 can offer integrations to make this automatic withsome trouble ticket systems – ask us if you want to know aboutyour possibilities. Automatically having a ticket opened for everynotification is sometimes a very good idea.
Another option is having a mailbox that is shared by several sys-tem administrators, where all notifications are sent. An unreadnotification in the inbox would then mean that it has to be dealtwith.
C.4.1 Acknowledging Alerts
Monitor has strong features built-in to let your adminsitrators worktogether. Acknowledging alerts is such a feature.
When you receive an alert, you can acknowledge it using the webinterface and make a comment to inform your colleagues aboutwhat you are planning to do.
Using the web view Unhandled Problems you can then overviewalerts that have not been acked yet – a great way of knowing whathas been dealt with or not.
Sometimes it is a good idea to have Unhandled Problems displayedon the wall near the NOC or System Administrators.
Copyright © op5 AB, www.op5.com. All rights reserved. 106
op5 Monitor 3.2 Manual
C.5 Service Groups
The administrators often know exactly what it means when theCPU usage on a specific server is high or a disk on a databaseserver is nearing full.
People working less closely with the infrastructure might not knowthis though, and this is one of the reasons why using ServiceGroups is a good idea.
You can create a group of services for every actual function deliv-ered by your IT staff – for instance grouping email services providesa great overview: If everything is green your email ought to be work-ing properly.
It is also great to quickly find the problem if you know there is one- you just have to look in the right service group instead of havingto look through everything.
Copyright © op5 AB, www.op5.com. All rights reserved. 107
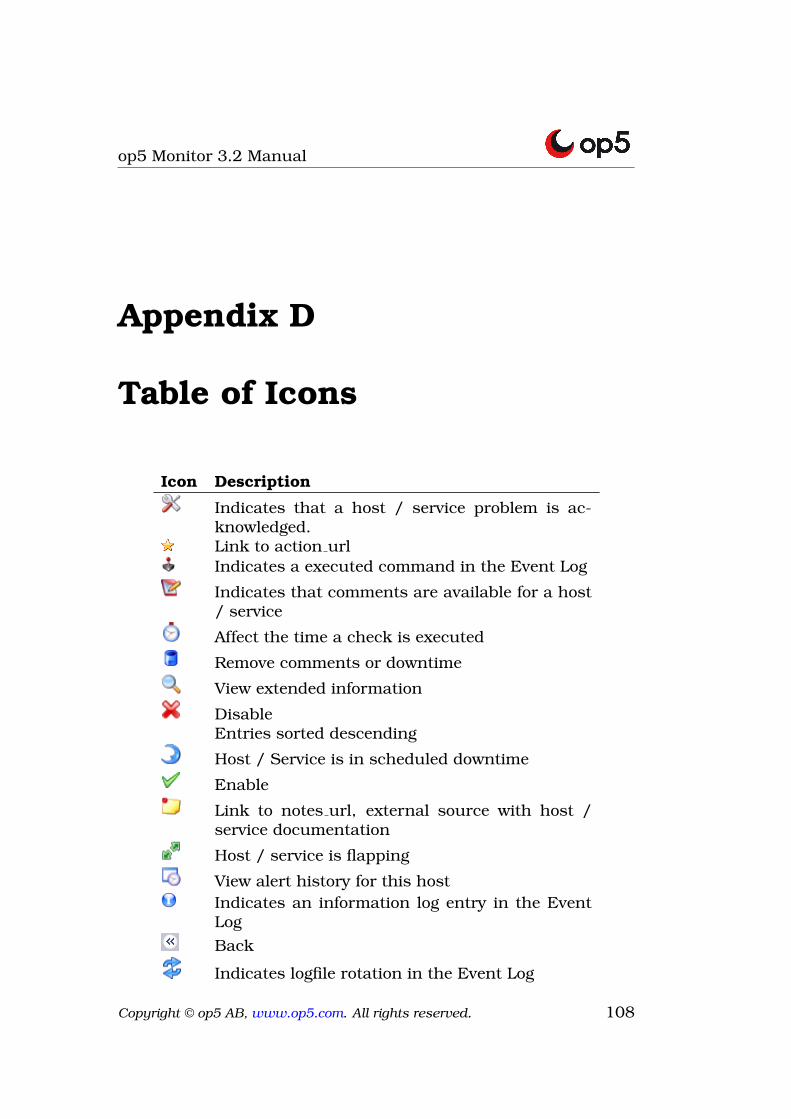
op5 Monitor 3.2 Manual
Appendix D
Table of Icons
Icon Description
Indicates that a host / service problem is ac-knowledged.Link to action urlIndicates a executed command in the Event Log
Indicates that comments are available for a host/ service
Affect the time a check is executed
Remove comments or downtime
View extended information
DisableEntries sorted descending
Host / Service is in scheduled downtime
Enable
Link to notes url, external source with host /service documentation
Host / service is flapping
View alert history for this hostIndicates an information log entry in the EventLogBack
Indicates logfile rotation in the Event Log
Copyright © op5 AB, www.op5.com. All rights reserved. 108
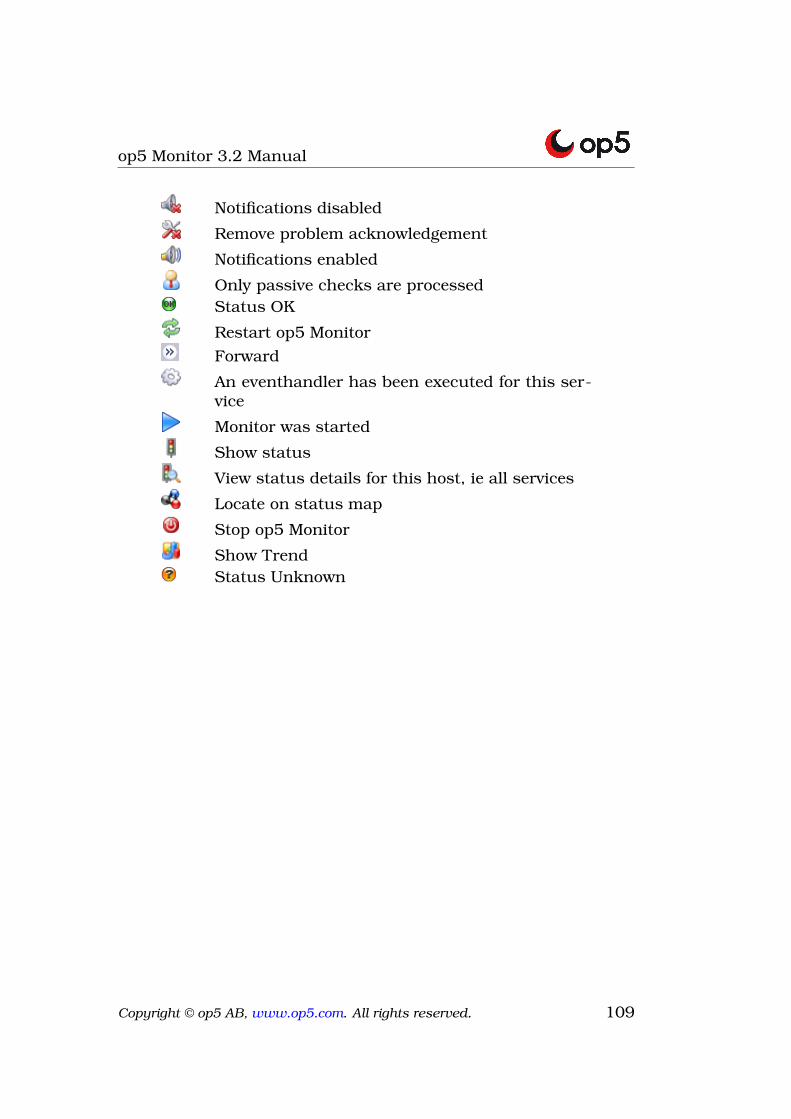
op5 Monitor 3.2 Manual
Notifications disabled
Remove problem acknowledgement
Notifications enabled
Only passive checks are processedStatus OK
Restart op5 MonitorForward
An eventhandler has been executed for this ser-vice
Monitor was started
Show status
View status details for this host, ie all services
Locate on status map
Stop op5 Monitor
Show TrendStatus Unknown
Copyright © op5 AB, www.op5.com. All rights reserved. 109
op5 Monitor 3.2 Manual
Appendix E
Index
You can use the index on the following pages if you want to knowabout a keyword that is not to be found in the table of contents.
Copyright © op5 AB, www.op5.com. All rights reserved. 110
Index
2d coords, 78
action url, 78, 85Active Checks, 8Add this host?, 69address, 1, 62, 63, 68, 70Advanced menu, 3alias, 63, 68, 70, 79, 85, 90–92,
94, 96Assume Initial States, 46, 52Assume State Retention, 46, 53Assume States During Program Down-
time, 46authorized for all, 100authorized for all host commands, 97authorized for all hosts, 97authorized for all service commands,
97authorized for all services, 97authorized for configuration information,
97authorized for system commands, 97authorized for system information,
97Autodetect network nodes, 68
Backtracked Archives, 46, 53
Check Execution Time, 41Check for Updates, 3Check Latency, 41check command, 79, 80, 86check command args, 79, 86check freshness, 87
check period, 87checks enabled, 80, 87children, 79cloning, 102contact groups, 68, 70, 77, 80, 84,
88contact name, 92contactgroup name, 94contactgroups, 93Critical, 7
Dependencies, 75Down, 7
email, 93escalation options, 77, 85escalation period, 77, 84Escalations, 76event correlation, 33Event Handlers, 8event handler, 80, 87event handler args, 80, 87event handler enabled, 80, 87execution failure criteria, 76, 83exthostinfo, 78Extras, 78
FILE, 70, 76, 81, 88First Assumed Host State, 53First Assumed Service State, 53first notification, 77, 80, 84Flap Detection, 8Flap detection, 81, 88flap detection enabled, 80, 87
111
op5 Monitor 3.2 Manual
freshness threshold, 87
graphical view, 25Group Average, 54
high flap threshold, 80, 81, 87, 88Host Logo, 70Host State Information, 11host name, 70, 76, 79host notification commands, 93hostgroup name, 90hostgroups, 29, 51, 68, 70, 79, 90
icon image, 78, 85icon image alt, 78Include Soft States, 53inherits parent, 76, 83is volatile, 86
last notification, 77, 84Layout Method, 26low flap threshold, 80, 81, 87, 89
Management Protocol, 70max check attempts, 46, 53, 80, 86,
89members, 90, 91, 94Montitoring Performance, 8
Network Health, 8Network Outage, 6normal check interval, 86, 89notes, 78, 85notes url, 78, 85notification failure criteria, 76, 83notification interval, 77, 80, 84, 85,
88notification options, 81, 88, 92, 93notification period, 81, 88, 92Notifications, 8notifications enabled, 81, 88
obsess over service, 87
Ok, 7
pager, 93parallelize check, 87parents, 70, 75, 79Passive Check, 8Password, 97Pending, 7Pre-flight configuration check, 73process perf data, 80, 88profiles, 102
Report Time Period, 52retain nonstatus information, 80, 88retain status information, 80, 88retry check interval, 87, 89
scheduled downtime, 36search box, 35Service Checks, 70service description, 86service notification commands, 93service notification commands args,
93servicegroup, 23servicegroup name, 91servicegroups, 86Severity, 33Simple menu, 4Soft States, 46SSL, 1stalking options, 81, 88statusmap image, 78
template, 69, 79, 86, 92timeperiod name, 96
Unknown, 7Unreachable, 7Up, 7User-supplied coords, 26
Warning, 7
Copyright © op5 AB, www.op5.com. All rights reserved. 112


![Corelli Sonata Op5 No8 4th Mvt[1]](https://img.pdfslide.net/doc/110x75/577c826c1a28abe054b0b1ed/corelli-sonata-op5-no8-4th-mvt1.jpg)