Embed Size (px)
Citation preview

Rao et al. Biotechnol Biofuels (2017) 10:266 DOI 10.1186/s13068-017-0954-2
RESEARCH
Dynamic changes in transcriptome and cell wall composition underlying brassinosteroid-mediated lignification of switchgrass suspension cellsXiaolan Rao1,2*, Hui Shen1,5, Sivakumar Pattathil2,3,7, Michael G. Hahn2,3, Ivana Gelineo‑Albersheim2,3, Debra Mohnen2,3, Yunqiao Pu2, Arthur J. Ragauskas2,4, Xin Chen2,6, Fang Chen1,2 and Richard A. Dixon1,2*
Abstract
Background: Plant cell walls contribute the majority of plant biomass that can be used to produce transportation fuels. However, the complexity and variability in composition and structure of cell walls, particularly the presence of lignin, negatively impacts their deconstruction for bioenergy. Metabolic and genetic changes associated with second‑ary wall development in the biofuel crop switchgrass (Panicum virgatum) have yet to be reported.
Results: Our previous studies have established a cell suspension system for switchgrass, in which cell wall lignifica‑tion can be induced by application of brassinolide (BL). We have now collected cell wall composition and microarray‑based transcriptome profiles for BL‑induced and non‑induced suspension cultures to provide an overview of the dynamic changes in transcriptional reprogramming during BL‑induced cell wall modification. From this analysis, we have identified changes in candidate genes involved in cell wall precursor synthesis, cellulose, hemicellulose, and pectin formation and ester‑linkage generation. We have also identified a large number of transcription factors with expression correlated with lignin biosynthesis genes, among which are candidates for control of syringyl (S) lignin accumulation.
Conclusion: Together, this work provides an overview of the dynamic compositional changes during brassinoster‑oid‑induced cell wall remodeling, and identifies candidate genes for future plant genetic engineering to overcome cell wall recalcitrance.
Keywords: Brassinosteroid, Cell wall, Comparative transcriptomics, Glycome profiling, Lignin, Suspension cell
© The Author(s) 2017. This article is distributed under the terms of the Creative Commons Attribution 4.0 International License (http://creativecommons.org/licenses/by/4.0/), which permits unrestricted use, distribution, and reproduction in any medium, provided you give appropriate credit to the original author(s) and the source, provide a link to the Creative Commons license, and indicate if changes were made. The Creative Commons Public Domain Dedication waiver (http://creativecommons.org/publicdomain/zero/1.0/) applies to the data made available in this article, unless otherwise stated.
BackgroundThe plant cell wall has unique characteristics, with a dynamic architecture and composition that determines cell shape, supports plant mechanical structure during growth, and responds to developmental and environmen-tal cues such as nutrient uptake and biotic/abiotic stress [1]. The cell wall contributes to the biomass of plants as the major carbon sink because plants assimilate much of
the atmospheric carbon dioxide through photosynthesis into cell wall polymers including cellulose, hemicellulose, and lignin [2]. Although plant biomass is considered a promising source of reduced carbon for bioenergy, the conversion of lignocellulosic biomass into liquid trans-portation fuels is limited by the innate resistance of cell walls to microbial and enzymatic deconstruction [3], a phenomenon termed recalcitrance [4]. An understand-ing of the molecular mechanisms underlying the dynamic structure of plant cell walls in dedicated bioenergy crops is required for overcoming cell wall recalcitrance and enhancing biofuel production.
Open Access
Biotechnology for Biofuels
*Correspondence: [email protected]; [email protected] 1 BioDiscovery Institute and Department of Biological Sciences, University of North Texas, Denton, TX, USAFull list of author information is available at the end of the article
Page 2 of 18Rao et al. Biotechnol Biofuels (2017) 10:266
The grasses (family Poaceae) represent a major carbo-hydrate and protein resource for feeding humans and herbivores, as well as for biofuel production [5]. The fam-ily includes maize, Miscanthus, and switchgrass (Pani-cum virgatum L.), which have been selected as preferred feedstocks for bioenergy in the United States [5]. Grasses have distinct cell wall compositions compared with dicots [6]. Generally, the primary cell wall in grasses comprises assemblies of cellulose microfibrils embedded in a matrix of arabinoxylan with mixed-linkage glucans [7] and small amounts of pectin. Secondary cell walls in grasses exhibit a significant proportion of lignin as the major non-cellu-losic component [7, 8], and this lignin generally possesses higher levels of syringyl (S) units and more esterified p-coumaric acid than dicot lignins [9, 10].
In spite of the interest in switchgrass as a bioenergy crop, few studies have been undertaken to elucidate cell wall structure and genes involved in cell wall biogenesis in this species. We previously generated a list of candi-date genes involved in lignin biosynthesis in switchgrass by a combination of bioinformatic analysis and gene silencing technology [11], and baseline internode struc-ture and cell wall composition have been determined in mature stems [12] and maturing tillers [13]. However, a comprehensive understanding of the genetic control of cell wall composition in switchgrass is absent, probably due to the complexity and variability of cell wall develop-ment in planta.
Compared with whole plants, suspension-cultured cells offer a simplified model system with a large population of relatively homogenous cells capable of rapid and uniform response to external stimuli [14], and have been used as
effective model systems for investigating plant cell wall structure and composition since the 1970s [15, 16]. The brassinosteroids (BRs) are a group of naturally occurring plant hormones that function in cell elongation and dif-ferentiation as well as cell wall formation [17]. Exogenous supplementation of brassinolide (BL) can induce tra-cheary element formation and the deposition of cellulose and lignin during secondary wall formation in suspen-sion-cultured Arabidopsis, Zinnia (Zinnia elegans), and banana embryonic cells [18–21].
Previously, we established a suspension culture system with cells generated from callus derived from immature inflorescences of switchgrass variety Alamo [11, 22]. As in a Pinus taeda suspension cell system [23], only pri-mary cell walls form in switchgrass suspension cultures grown in medium containing high concentrations (9 μM) of 2,4-dichlorophenoxyacetic acid (2,4-D) [11]. Sup-plementation with BL (0.2 μM) along with a simultane-ous reduction in the concentration of 2,4-D (to 0.9 μM) induces formation of secondary cell wall-associated lig-nification by 7 days of treatment [11]. Phloroglucinol-HCl staining showed that BL-induced lignin is located within the cells, and no lignin is released into the culture medium [11]. We have now applied biochemical, immu-nochemical, and NMR analyses, along with global tran-script profiling, to determine the changes in cell wall composition and associated gene expression in both BL-induced- and non-induced switchgrass suspension cultures, which are associated with development of pri-mary and secondary cell walls, or only primary cell walls, respectively (Fig. 1). The combined information provides insights into the genetic control of the dynamic changes
6h 1d 3d 7d
Cell wall analysis
2,4-D
BL+2,4-D
Transcriptome analysisCorrelation analysis
Fig. 1 Experimental design. Switchgrass cell suspension cultures were transferred to fresh medium containing 9 μM 2,4‑D (controls, blue), or to medium with 0.9 μM 2,4‑D supplemented with 0.2 μM BL (induced, orange), and harvested at the times shown. The changes in cell wall composi‑tion of induced and non‑induced samples were analyzed by biochemical and immunochemical approaches at all the times shown. Microarray analysis was performed on induced samples harvested at 0, 6 h, 1, 3, and 7 days after transfer, and on non‑induced samples 1 and 7 days after transfer. Comparative transcriptomics and correlation with changes in cell wall composition were applied to identify putative cell wall‑related genes

Page 3 of 18Rao et al. Biotechnol Biofuels (2017) 10:266
in cell wall composition associated with the switch from primary to secondary wall formation.
Results and discussionChanges in cell wall glycosyl residuesThe sandy type of switchgrass cell culture that attains high cell density [22] was selected for this work because of its rapid and uniform growth [11]. No obvious changes in cell morphology were observed between BL-induced and non-induced sandy suspension cultures [11]. To assess the extent to which cell wall composition is altered during BL-induced lignification, we first analyzed the monosaccharide composition of cell walls from induced and non-induced suspension cultures as a function of time after BL addition (Fig. 2). The major monosaccha-ride components of the alcohol-insoluble residue (AIR) from the cell walls were quantified using GC–MS after hydrolysis.
The monosaccharide composition of the switchgrass cell wall preparations at the time of transfer (initial stage,
0 h) was similar to that previously reported for cell walls of suspension cultures of five other grasses; arabinose and xylose were the most abundant components and the ratio of arabinose to xylose was approximately equal to 1 (Additional file 1: Figure S1). Arabinoxylan (AX) is con-sidered to be the major hemicellulosic structural com-ponent in which cellulose is embedded in grass cell walls [1, 15]. The content of arabinose was reduced from 6 h to 3 days following application of BL (Fig. 2a), whereas the content of xylose showed the opposite trend (Fig. 2b), leading to a significant decrease in the ratio of arabinose to xylose during this period (Fig. 2c). In contrast, levels of arabinose and xylose remained relatively constant in non-induced suspension cultures except for a slight increase in the ratio of arabinose to xylose at 6 h. AX consists of a backbone of β-1,4-linked xylose residues on which the O3 position is frequently substituted by arabinose side chains [24]. The ratio of arabinose to xylose therefore reflects the degree of linearity or branching of this hemi-cellulose [24]. Our data indicate that increased levels of
0
20
40
60
0 6h 1d 3d 7d
mg
arab
inos
e/g
of A
IR
0
0.5
1
1.5
0 6h 1d 3d 7d
Rat
io o
f ar
abin
ose
to x
ylos
e
0
20
40
60
0 6h 1d 3d 7d
mg
xylo
se/g
of A
IR
0
10
20
0 6h 1d 3d 7d
mg
gala
ctos
e/g
of A
IR
0
10
20
0 6h 1d 3d 7d
mg
gluc
ose
/g o
f AIR
0
1
2
0 6h 1d 3d 7d
mg
rham
nose
/g o
f AIR
0
1
2
0 6h 1d 3d 7d
mg
man
nose
/g o
f AIR
Non-inducedInduced
**
**
**
*
**
**
** **
**
**
**
*
** **
***
*
*
*
*
* *
a b c
d e
f g
**
*
* *
Fig. 2 Monosaccharide composition of cell wall residues isolated from non‑induced and BL‑induced switchgrass cultures at the times indicated. Panels a, b, d, e, f, and g indicate arabinose, xylose, galactose, glucose, rhamnose, and mannose contents, respectively. c Indicates the ratio of arabinose to xylose. Non‑induced and induced samples are presented as open bars/dash line and closed bars/solid line, respectively. All data are mean ± SE (n = 3). The significant differences from 0 h control were determined by the Student’s t test and represented by a single asterisk (p < 0.05) or double asterisk (p < 0.01). The significant differences by the Student’s t test between induced and non‑induced samples at each time point are provided in Additional file 11: Table S8
Page 4 of 18Rao et al. Biotechnol Biofuels (2017) 10:266
linear xylan regions may occur in switchgrass suspension cells between 6 h and 3 days post-treatment with BL.
Other glycosyl residues, such as galactose (Fig. 2d) and mannose (Fig. 2g), are less abundant in the hemicellulosic fraction of grass cell walls [7], but changes in these sug-ars, likely in galactoarabinoxylans and galactomannans, also occur during induced lignification (Fig. 2d, g).
A large increase in the level of cell wall glucose was observed in BL-induced suspension cultures compared to non-induced cultures (Fig. 2e). Use of β-glucan anti-bodies (see section on glycome profiling) suggests that a significant increase in non-cellulosic polymers contrib-utes to the increase in glucose content in BL-induced cells. In addition, we observed a significant increase in cell wall rhamnose in non-induced cultures at days 1 and 3, with no corresponding increase in induced cultures at the same times (Fig. 2f ). Rhamnose is a component of the rhamnogalacturonan (RG)-II and RG-I pectic polysac-charides of the cell wall [25]. These results suggest that deposition of pectic polysaccharides is halted in the cell walls of BL-induced cells associated with the induction of lignification.
Changes in cell wall extractabilityAs a prelude to glycome profiling (see below), the AIR preparations analyzed in Fig. 2 were extracted sequen-tially with increasingly harsh reagents (ammonium oxa-late, sodium carbonate, sodium chlorite, 1 M KOH, and 4 M KOH) to release the most soluble to the most tightly bound cell wall components [26], and the total sugar con-tent was determined in each extract (Fig. 3).
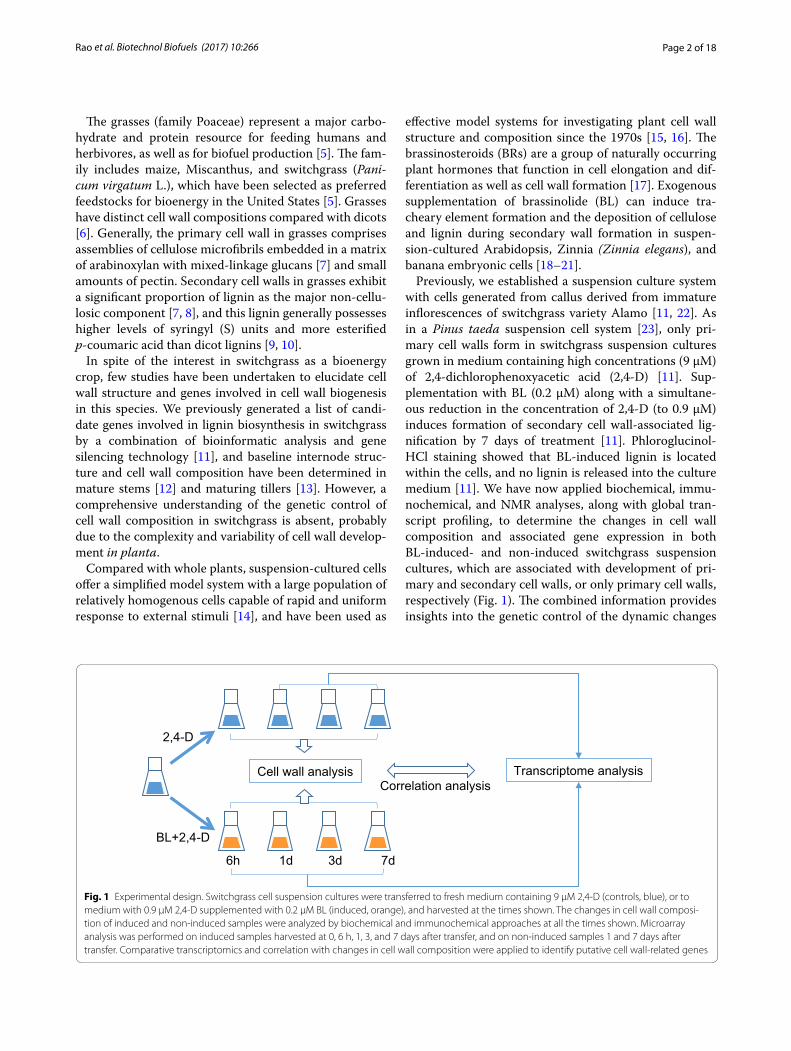
Ammonium oxalate and sodium carbonate extracts are usually enriched in pectins and arabinogalactans [27]. Ammonium oxalate releases pectic polymers that are loosely bound to the wall by ionic interactions, whereas sodium carbonate extracts polymers by hydrolysis of base-labile bonds (e.g., sensitive esters such as methy-lesters) or as a consequence of increased negativity of deprotonated chemical (e.g., carboxyl) groups and/or due to chelation of remaining cations (e.g., calcium) [28]. Ammonium oxalate extracted similar amounts of material from induced and non-induced cell cultures during the time course, with a large reduction in extract-able material at day 7 in both cases (Fig. 3a). In contrast, sodium carbonate released less material from BL-induced cell cultures compared to non-induced cell cultures, especially at the 6-h and 3-day time points (Fig. 3b). This suggests that BL treatment does not affect the content of loosely bound pectins and arabinogalactans, but rather causes a reduction in a fraction of these molecules that are more tightly held in the wall by base-sensitive link-ages and/or tight ionic binding.
The material extracted by 1 M and 4 M KOH is typi-cally enriched in hemicelluloses, but usually also contains tightly bound pectins, arabinogalactans, and phenolics. More material was released by 1 M KOH than by 4 M KOH in both induced and non-induced samples (Fig. 3c, d). Decreasing amounts of 1 M KOH-extractable material were released from the AIR from BL-induced cells dur-ing the time course, whereas the opposite was the case for the non-induced samples (Fig. 3c, d). In the 4 M KOH fractions from induced samples, a peak of extractable material was seen at 6 h post-induction, whereas the peak was delayed to 3 days in the non-induced cells (Fig. 3d). Hemicellulosic components with a higher degree of hydrogen bonding require more concentrated alkali for extraction [29]. The data therefore suggest that, after BL treatment, the content of hemicellulose with lower degree of hydrogen bonding may decrease and the con-tent of hemicellulose with a higher degree of hydrogen bonding may reach a peak around 6 h post-treatment.
Finally, the amount of material extracted by sodium chlorite was very different from walls of induced and non-induced cell cultures (Fig. 3e). This material con-sists of phenolic-associated wall polysaccharides [30]. In non-induced cultures, there was an increase in material released at 6 h and a reduction thereafter. In contrast, chlorite-extractable material decreased slightly up to 1 day and then increased in induced samples (Fig. 3e). These changes may be associated with the changes in lig-nification observed in the cultures (see below).
Glycome profiling reveals BL‑induced changes in cell wall compositionTo gain a more complete picture of cell wall composi-tional changes, cell wall fractions extracted with the rea-gents above were subjected to glycome profiling, which detects specific glycan epitopes using monoclonal anti-bodies [26] (Additional file 1: Figure S2). The glycan-directed antibodies used account for the majority of non-cellulosic glycan components of plant cell walls [7]. Using this approach, we observed a series of differences in the extractability of glycan components from walls of both non-induced and induced cells during the time course.
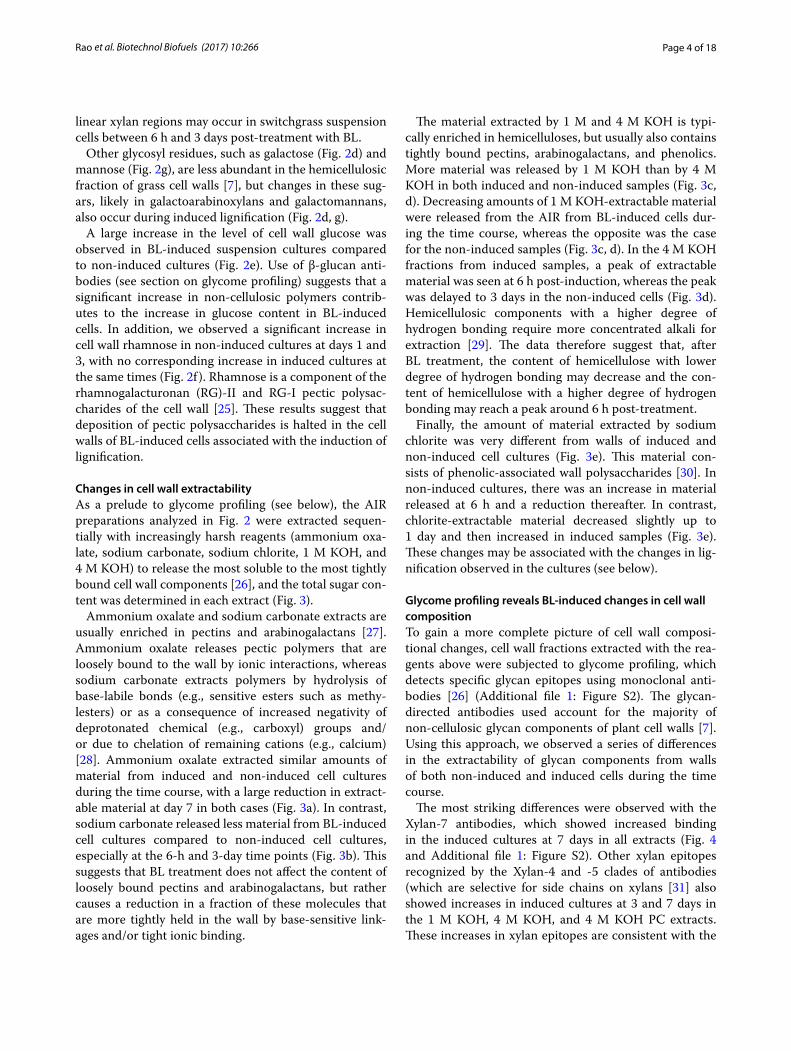
The most striking differences were observed with the Xylan-7 antibodies, which showed increased binding in the induced cultures at 7 days in all extracts (Fig. 4 and Additional file 1: Figure S2). Other xylan epitopes recognized by the Xylan-4 and -5 clades of antibodies (which are selective for side chains on xylans [31] also showed increases in induced cultures at 3 and 7 days in the 1 M KOH, 4 M KOH, and 4 M KOH PC extracts. These increases in xylan epitopes are consistent with the

Page 5 of 18Rao et al. Biotechnol Biofuels (2017) 10:266
observed induction of secondary wall formation in the induced cultures. Other more subtle increases were also observed in induced cultures for xyloglucan epitopes at 7 days in the 4 M KOH and 4 M KOH PC extracts (Fig. 4 and Additional file 1: Figure S2) and for pectic arabinoga-lactan epitopes (recognized by the RG-I/AG antibodies) at 7 days in all extracts (Fig. 4). An increase in the latter epitopes was also observed in induced cultures at 3 days in the 1 M KOH and 4 M KOH extracts (Additional file 1: Figure S2).
A closer inspection of the antibody reactive epitopes expressed in induced versus non-induced cell wall
material extracted from cells at 7 days revealed a subtle increase in homogalacturonan and mixed-linkage β-glucan epitopes in induced compared to non-induced cultures, particularly in the 1 M KOH and 4 M KOH fractions (Fig. 4). We propose that these changes upon BL-induction are associated with sec-ondary cell wall development. The glycome profiles suggest that our previous observation of a BL-induced increase in glucose in cell wall preparations may reflect an increase in non-cellulosic mixed-linkage (1 → 3, 1 → 4) β-glucans and possibly (1 → 3) β-glucans (calluses).
0
10
20
0 6h 1d 3d 7d
yiel
d m
g/g
AIR
yi
eld
mg/
g AI
R
yiel
d m
g/g
AIR
yi
eld
mg/
g AI
R
yiel
d m
g/g
AIR
Ammonium oxalate
0
30
60
0 6h 1d 3d 7d
Sodium carbonate
0
50
100
150
0 6h 1d 3d 7d
4M KOH
0
30
60
0 6h 1d 3d 7d
Chlorite
0
150
300
0 6h 1d 3d 7d
1M KOH
Non-induced
Induced
*
*
*
** **
**
**
**** **
**
****
*
*
*
*
**
a b
c d
e
Fig. 3 Amounts of polysaccharide sequentially extracted from cell wall residues of non‑induced and BL‑induced cultures using increasingly harsh solvents at the times shown. a–e indicate total carbohydrate yield in the ammonium oxalate, sodium carbonate 1 M KOH, 4 M KOH, and chlorite fractions, respectively. Non‑induced and induced samples are present as dash line and solid line, respectively. All data are mean ± SE (n = 3). The significant differences from the 0‑h control were determined by the Student’s t test and are represented by a single asterisk (p < 0.05) or double asterisk (p < 0.01). The significant differences by the Student’s t test between induced and non‑induced samples at each time point are provided in Additional file 11: Table S8

Page 6 of 18Rao et al. Biotechnol Biofuels (2017) 10:266
Lignin and hydroxycinnamate accumulationPreviously, we had shown that the level of lignin continu-ously increased in switchgrass cell suspension cultures after 2 days following BL treatment, while only trace amounts of lignin accumulated in non-induced suspen-sion cultures during the 7-day time period [11]. To fur-ther elucidate the nature of phenylpropanoid-derived compounds induced in BL-supplied suspension cells, HPLC, GC–MS, and 2D heteronuclear single-quan-tum coherence (HSQC) Nuclear Magnetic Resonance (NMR) spectroscopy were applied to analyze and quan-tify phenolic groups in lignins and esterified to cell wall components.
Wall-bound phenolic acids are embedded into cell walls through their chemical linkage with polysaccha-rides and polymeric lignin [32, 33]. p-Coumaric acid (p-CA) is preferentially ester-linked to lignin rather than to hemicellulose, whereas ferulic acid (FA) is exclusively ester-linked to glucuronoarabinoxylan in grass cell walls
[32, 33]. The amount of p-CA reflects the degree of lig-nification in grasses and a high p-CA/FA ratio is consid-ered to be highly correlated with cell wall recalcitrance [34]. In non-induced cells, FA was the most abundant wall-bound phenolic acid and essentially no p-CA was detected (Additional file 1: Figures S3A, B). In induced cells, the p-CA content increased while the wall-bound FA content decreased during the time course (Additional file 1: Figures S3A and B), leading to a large increase of p-CA/FA ratio (Additional file 1: Figures S3C). The increase in ester-linked p-CA and p-CA/FA ratio parallels the accumulation of lignin content in induced suspension cultures.
Predominantly S lignin monomers, with only trace amounts of G lignin, were detected in induced suspen-sion cells using thioacidolysis followed by GC–MS (Fig. 5a). The lignin isolated from the induced suspension cells had a much higher S:G ratio than that isolated from switchgrass stems (Fig. 5a), though the lignin from the
- + - + - + - + - + - +
1M K
OH
4M K
OH
4M K
OH
PC
carb
onat
eox
alat
e
Chl
orite
1M KOH 4M KOH 4M KOH PCCarbonateOxalate Chloriteβ-1,3,1,4-glucanβ-1,3-glucan
(β-1,3,1,4-glucan) BG1(β-1,3-glucan) LAMP
CCRC-M117CCRC-M113CCRC-M120CCRC-M118CCRC-M116CCRC-M114CCRC-M154CCRC-M150CCRC-M144CCRC-M146CCRC-M145CCRC-M155CCRC-M153CCRC-M151CCRC-M148CCRC-M140CCRC-M139CCRC-M138CCRC-M160CCRC-M137CCRC-M152CCRC-M149
Xylan-3
Xylan-4
Xylan-5
Xylan-6
Xylan-7
Physcomitrella Pectin
JIM3CCRC-M40
CCRC-M161CCRC-M164
CCRC-M98CCRC-M94
Linseed Mucilage RG-I
CCRC-M60CCRC-M41CCRC-M80CCRC-M79CCRC-M44CCRC-M33CCRC-M32CCRC-M13CCRC-M42CCRC-M24CCRC-M12
CCRC-M7CCRC-M77CCRC-M25
CCRC-M9CCRC-M128CCRC-M126CCRC-M134CCRC-M125CCRC-M123CCRC-M122CCRC-M121CCRC-M112
CCRC-M21JIM131
CCRC-M22JIM132
JIM1CCRC-M15
CCRC-M8JIM16
CCRC-M131CCRC-M38
JIM5 HG Backbone-1
RG-I/Arabinogalactan
- + - + - + - + - + - +Fig. 4 Glycome profiling heat maps showing the relative abundance of cell wall glycan epitopes released sequentially from the AIR fraction of 7‑day BL‑induced and non‑induced suspension cells. Plus and minus symbols indicate BL‑induced and non‑induced samples, respectively. The cell walls were sequentially extracted with ammonium oxalate, sodium carbonate, 1 M and 4 M KOH, chlorite, and 4 M KOH post‑chlorite as indicated. The solubilized extracts were then analyzed by ELISA using cell wall glycan‑directed monoclonal antibodies. The results presented on the heatmaps are the average values of three independent replicates. Right panel shows a magnified view of the hatched areas on the left panel

Page 7 of 18Rao et al. Biotechnol Biofuels (2017) 10:266
two sources shares a similar degree of polymerization [11, 74]. Because thioacidolysis preferentially analyzes β-O-4-linked lignin units, the overall enrichment in S lignin and deficiency in G lignin in induced suspension cells was further confirmed using 2D 13C–1H HSQC NMR analysis (Fig. 5b). Compared with that in switchgrass stem sam-ples, the aromatic region of the 2D 13C–1H HSQC cor-relation NMR spectrum shows that the majority of lignin induced in switchgrass suspension cells is made of S units and contains a considerable amount of p-courmarate and ferulate, whereas G units are rare (Fig. 5b).
Functional classification of differentially expressed genes during BL‑induced cell wall modificationTo obtain a genome-wide understanding of the tran-scriptional reprogramming associated with BL-induced changes in cell wall composition, microarray analyses were conducted on RNA extracted from cells harvested on 0, 6 h, 1, 3, and 7 days for induced suspension cell cul-tures, as well as 1 and 7 days for non-induced cultures [11]. Low expression genes were filtered from the micro-array dataset and 58,079 probes remained for subsequent analysis. Principal component analysis (PCA) was per-formed to visually summarize the features of the gene expression profiles. The details of data pre-processing and principal component analysis (PCA) are described in Additional file 2: Methods.
To optimally classify genes according to their expres-sion pattern, we applied a self-organizing map (SOM) method to cluster gene sets with a 4 × 4 matrix (Fig. 6a) and defined sixteen expression groups of filtered genes during the 7-day time course in induced suspension cul-tures (Fig. 6a). Generally speaking, Clusters 3, 4, 8, and 12 represent genes for which transcript levels were gradually elevated after BL treatment, whereas the expression lev-els of genes in Clusters 5, 9, 13, and 14 were significantly decreased over the same period. Clusters 1 and 2 repre-sent genes that responded rapidly to BL with transcript levels up-regulated at 6 h and restored after that time, whereas genes in Clusters 15 and 16 were expressed in the opposite way.
We compared the biological functions of differentially expressed genes between clusters using the Mapman [35] functional catalog database (Additional file 3: Table S1). We first compared the functional categories of tran-scripts in Clusters 3, 4, 8, and 12, and Clusters 5, 9, 13, and 14 (Fig. 6c) that consist of steadily up-regulated and steadily down-regulated genes following BL treatment, respectively. Eight thousand six hundred and ninety-nine out of the total of 11,094 genes in Clusters 3, 4, 8, and 12, and 7108 of the total of 9389 genes in Clusters 5, 9, 13, and 14 could be annotated into 35 main catalogs of Map-man based on the corresponding Arabidopsis orthologs. Among them, genes involved in the oxidative pentose
0
5
10
15
20
25
E4-I2 E4-I4 Suspension cell
Thio
acid
olys
is m
onom
er
S/G
ratio
S/G ratio
0
100
200
300
400
E4-I2 E4-I4 Suspension cell
Thio
acid
olys
is m
onom
er
yiel
d (m
g/g
CW
R) H unit G unit S unit
stem Stem lignin Suspension cell lignin
a b
Fig. 5 A comparison of lignin quantity and quality in switchgrass stem and BL‑induced suspension culture. a Lignin quantity and composition as determined by thioacidolysis yield (upper panel), and S/G ratio (lower panel). b HSQC‑NMR analysis of the aromatic region. Stem lignin was from plants at the E4–I2 and E4–I4 developmental stages for thioacidolysis analysis, and a mixture of E4–I2 and E4–I4 stages for NMR analysis. Cell cultures were 7 days post‑treatment with BL

Page 8 of 18Rao et al. Biotechnol Biofuels (2017) 10:266
phosphate (OPP) pathway, TCA cycle, mitochondrial electron transport/ATP synthesis, amino acid metabo-lism, nucleotide metabolism, and secondary metabolism were preferentially enriched in Clusters 3, 4, 8, and 12, whereas genes involved in glycolysis, fermentation and cell wall metabolism (including cellulose and hemicel-lulose synthesis) were significantly enriched in Clusters 5, 9, 13, and 14 (Fig. 6d and Additional file 3: Table S1). Taken together, these data are consistent with a gradual reduction in conversion of sucrose (the carbon source in the cultures) into complex carbohydrates (such as cel-lulose and hemicellulose) stored in the cell wall and an increased conversion of sucrose into amino acid, nucleo-tide, and secondary metabolism (with reductive power supplied by the OPP), through the intermediates of the TCA cycle following exposure to BL.
We also compared the functional categories of tran-scripts in Clusters 1 and 2, and Clusters 15 and 16 (Fig. 6d), which represent genes that were rapidly up-reg-ulated or down-regulated in response to BL treatment, respectively. A total of 4371 and 4697 genes were grouped into Clusters 1 and 2 and Clusters 15 and 16, respec-tively, and 3420 and 3526 genes had orthologs in Arabi-dopsis annotated in the Mapman database, respectively. More genes involved in major and minor CHO metabo-lism were preferentially enriched in Clusters 15 and 16 compared with Clusters 1 and 2 (Fig. 6d and Additional file 4: Table S2). Further analysis in sub-categories indi-cates that the expression of 28 genes involved in sucrose and starch synthesis was rapidly reduced by 6 h and then recovered in response to BL treatment (Additional file 4: Table S2). Genes predicted to be involved in transport
b
c
d
Down in 1D
Up in 1D Down in 7D
Up in 7D
4182
1273
1810
51
1743
170
733
2466
a 1 2 3 4
5 6 7 8
9 10 11 12
13 14 15 16
n = 2155 n = 2216 n = 2507 n = 3857
n = 2217 n = 258 n = 324 n = 973
n = 369 n = 533 n = 393 n = 3757
n = 5145 n = 1658 n = 1788 n = 2909
major CHO metabolismminor CHOmetabolism
TCA / orgtransformation
mitochondrial electrontransport / ATP
synthesis
cell wall
lipid metabolism
S-assimilation
secondary metabolismhormone metabolism
Co-factor and vitaminemetabolism
tetrapyrrole synthesis
stress
redox
cell
development
transport
Class 1 and 2 Class 15 and 16
major CHOmetabolism
minor CHOmetabolism
glycolysis
fermentation
OPP
TCA / orgtransformation
mitochondrialelectron transport /
ATP synthesiscell wall
lipid metabolismN-metabolism
amino acidmetabolism
secondarymetabolism
hormone metabolism
redox
polyaminemetabolism
C1-metabolism
Classes 3, 4, 8 and 12Classes 5, 9, 13 and 14
Fig. 6 Cluster analysis of gene expression in BL‑induced cultures and analysis of differentially expressed genes. a Cluster analysis of genes with at least twofold change in expression in induced cells using SOM method (4 × 4 matrix). b Numbers of differentially expressed genes between induced and non‑induced cells on 1 and 7 days. c and d show relative numbers of gene functional groups in selected expression clusters
Page 9 of 18Rao et al. Biotechnol Biofuels (2017) 10:266
and cell division/growth were enriched in Clusters 1 and 2 and Clusters 15 and 16, respectively (Fig. 6d and Addi-tional file 4: Table S2). Further analysis of sub-categories suggests that genes involved in transport of peptides and calcium, and genes involved in cell organization, cell division, and cell cycle were rapidly up-regulated or down-regulated in response to BL treatment, respectively (Additional file 4: Table S2; see below).
To identify candidates genes that may be associated with secondary cell wall formation, we detected genes differentially expressed between day 1 (transition into lignin biosynthesis) and day 7 (late phase of lignin bio-synthesis) in induced and non-induced suspension cul-tures. After application of the linear model, 6503 and 8152 genes were identified as differentially expressed according to these criteria (Fig. 6b and Additional file 3: Table S1). Among them, 1273 and 733 genes showed higher or lower expression in induced samples than in non-induced samples during the time course, respec-tively (Fig. 6b). Functional ontology analysis showed a downregulation of genes involved in cell wall metabolism and an up-regulation of genes involved in the TCA cycle, lipid metabolism, amino acid metabolism, secondary metabolism, and biotic stress response in induced sam-ples on both day 1 and day 7 compared with non-induced samples (Additional file 4: Table S2). Below, we examine specific facets of some of these processes.
Gene involved in cell wall biogenesis and cell wall modificationExpansinsExpansins encode proteins that loosen non-covalent link-ages between cellulose microfibrils and are required for cell wall extension [36]. Genes annotated as encoding expansins were differentially expressed in our dataset (Additional file 5: Table S3). For example, genes encod-ing α-expansin were more highly expressed from day 1 in BL-induced cells, whereas expression of some genes encoding β-expansins decreased and was less than in non-induced samples (Table 1). The differential expres-sion of expansins may reflect their different targets in cell wall modification.
Cellulose and COBRAThe cellulose elementary fibril (β-1,4-glucan chain) is synthesized by a complex of cellulose synthase (CESA) proteins [37]. We generated a phylogenetic tree to search for CESA genes in switchgrass and analyzed their expression in our dataset (Additional file 1: Fig-ure S5). Expression profiles grouped in Clusters 1 and 2 were observed for the switchgrass genes homologous to rice CESA1, CESA3, and CESA8 involved in primary cell wall biosynthesis. Rice CESA4, CESA7, and CESA 9
are involved in secondary cell wall formation, and gene transcripts homologous to rice CESA4 and CESA9 start to accumulated at 1 day post-treatment with BL, whereas genes homologous to rice CESA7 are slightly induced at 6 h. Considering its higher expression at 1 and 7 days in induced compared to non-induced samples, switch-grass CESA4 may play a major role in cellulose synthe-sis for the secondary cell wall. qRT-PCR was conducted to further confirm the divergent expression between the CESAs (Additional file 1: Figure S6). Together, our data suggest that primary cell wall cellulose synthesis starts at 6 h and secondary cell wall cellulose synthesis starts at 1 day in induced suspension cultures, with very little sec-ondary cell wall synthesis in non-induced cells.
COB protein encodes a GPI-anchored protein local-ized in the plasma membrane that facilitates cellulose microfibril organization [38]. One switchgrass COB gene ortholog showed a similar expression profile to the CESA genes involved in primary cell wall synthesis, whereas another COB gene was down-regulated at 1 day post-treatment with BL, but its expression was unchanged in non-induced suspension cultures. We suggest that the protein encoded by the former COB gene might guide cellulose deposition in the primary cell wall, whereas that encoded by the latter COB gene might somehow inhibit the development of the secondary cell wall.
Cellulose synthase‑like and callose synthase genesThe CESA super family contains several subfamilies of closely related sequences, termed the cellulose synthase-like (CSL) family [39]. Here we identified 42 switchgrass transcripts homologous to Arabidopsis and rice CSL genes, including CSLA, CSLC, CSLD, CSLE, and CSLF subfamilies (Additional file 5: Table S3). Two CSLA genes, which encode enzymes mediating mannan and glucomannan synthesis [39], were up-regulated, whereas two CSLCs involved in xyloglucan biosynthesis [40] were down-regulated in BL-induced cells (Table 1 and Addi-tional file 5: Table S3). The expression of CSLFs encod-ing (1,3;1,4)-β-glucan synthase [40] was unchanged or slightly reduced from 3 days in induced samples. Con-sidering the increased deposition of (1,3;1,4)-β-glucan in induced cells (Fig. 4 and Additional file 1: Figure S2), it is possible that other CSL genes are also involved in the synthesis of mixed-linkage glucan in switchgrass cells. For example, HvCSLH and the CSLJ genes have been identified as being involved in (1,3;1,4)-β-glucan synthe-sis in wheat [41], but the probes corresponding to their switchgrass homologs were absent from our dataset.
Transcripts encoding a plasmodesmata-localized cal-lose synthase [(1,3)-β-d-glucan synthase] [42] were down-regulated at 6 h and then up-regulated from 1 day, and another gene encoding a plasmodesmata-localized

Page 10 of 18Rao et al. Biotechnol Biofuels (2017) 10:266
Table 1 Expression of switchgrass genes involved in cell wall development
Gene information Expression information
Microarray Probe PvGene Clade/Gene Cluster 0 h Induced Non‑induced Compare
6 h 1 Day 3 Days 7 Days 1 Day 7 Days 1 Day 7 Days
Expansin
AP13ITG71529_at Pavir.Aa00711 α‑Expansin 4 260 1176 3260 2120 1002 2025 737 1 0
KanlowCTG26349_s_at Pavir.Aa00711 α‑Expansin 4 185 572 1927 942 603 1215 397 1 0
AP13ITG57935_at Pavir.Aa00840 β‑Expansin 5 3692 3666 134 71 40 16,793 8354 − 1 0
AP13CTG27439_s_at Pavir.Ia02285 β‑Expansin 5 2721 5043 2475 440 346 13636 6467 − 1 0
CESA
AP13.12059.m00001_s_at Pavir.Ca01073 OsCESA1 2 1771 6165 4553 3517 2713 3351 2759 0 0
AP13CTG00607_s_at Pavir.Ba01088 OsCESA3 4 1160 2574 2285 3019 1894 1391 1362 0 0
AP13CTG25870_s_at Pavir.J35010 OsCESA8 2702 4804 3832 4513 3535 3877 3669 0 0
KanlowCTG12907_s_at Pavir.J30974 OsCESA4 16 51 30 98 94 114 58 65 1 1
KanlowCTG34110_at Pavir.Ib00804 OsCESA7 0 8 11 9 10 9 9 8 0 0
AP13CTG25049_s_at Pavir.Bb02205 OsCESA9 0 52 44 56 52 66 56 56 0 0
KanlowCTG15421_s_at Pavir.Ea00385 OsCESA1 15 1795 1003 1622 2469 1176 1956 1810 0 0
OTHSWCTG06249_s_at OsCESA5 7 820 904 1810 803 1300 939 1094 1 0
AP13CTG06255_s_at Pavir.J12858 OsCESA2 16 917 549 827 1418 774 941 868 0 0
COBRA
AP13CTG00322_s_at Pavir.Ia00526 COB 2 3061 6252 5466 3902 3750 4715 3158 0 0
AP13ITG43381_at Pavir.Ia00525 COB 5 1771 2628 697 164 697 3370 4215 0 − 1Cellulose‑like synthases
AP13CTG01955_at Pavir.Ia02025 CSLA 16 204 201 246 269 213 411 224 0 0
AlamoCTG01742_s_at Pavir.Ib01792 CSLA 12 86 145 279 474 394 207 233 0 1
AP13CTG06284RC_s_at Pavir.Ia00426 CSLC 13 350 151 187 161 144 228 133 0 0
AP13CTG27051_s_at Pavir.Fa01312 CSLC 5 133 251 39 25 32 147 98 − 1 0
KanlowCTG19494_s_at Pavir.Fb00422 CSLF 5 335 304 327 150 134 154 125 1 0
KanlowCTG37527_s_at Pavir.Ba00688 CSLF 0 164 212 199 147 190 202 174 0 0
Callose synthesis
KanlowCTG45113_s_at Pavir.Aa00017 Callose synthase 16 215 100 551 879 379 241 233 1 0
AP13ITG74190RC_at Pavir.Ib02063 Callose‑binding 11 64 83 178 116 66 57 48 1 0
Cell wall precursor
KanlowCTG00021_s_at Pavir.Ia00394 UGD 1 2487 8192 2541 1710 2633 4416 2852 0 0
AP13CTG07489_at Pavir.Ea03089 UXS 2 416 1017 583 537 605 637 637 0 0
KanlowCTG22514_s_at Pavir.Ea03089 UXS 0 530 1003 872 820 780 614 813 1 0
AP13CTG10419_s_at Pavir.Gb00500 UXE 1 792 1820 696 695 809 927 934 0 0
AP13CTG28681_s_at Pavir.Ba03802 UXE 3 186 396 335 329 488 374 300 0 1
AP13CTG00023_s_at Pavir.Gb00638 UXT 4 63 249 409 338 1273 72 156 1 1
KanlowCTG06720_s_at Pavir.Ia00627 UXT 2 695 1531 855 1053 1227 588 666 1 1
AP13CTG08328RC_s_at Pavir.Ab02692 UER 5 1017 969 566 639 474 2925 1380 − 1 0
Arabinoxylan (AX) and glucuronoarabinoxylan (GAX) synthesis (backbone)
AP13CTG08590_s_at Pavir.J27018 IRX9 3 280 635 729 481 563 627 441 0 0
AP13ITG73683_s_at Pavir.Ib01337 IRX9 5 461 385 195 116 124 469 345 − 1 − 1 AlamoCTG02760_s_at Pavir.Ea01094 IRX9L 12 136 139 207 370 362 87 174 1 1
AP13ITG60236_at Pavir.Ea01094 IRX9L 16 194 153 292 666 548 148 227 1 1
AP13ITG74502_x_at Pavir.J37721 IRX14L 1 221 2740 402 234 121 513 208 0 0
KanlowCTG18373_s_at Pavir.J06597 IRX14L 1 4068 5793 3770 2684 3800 3711 4190 0 0
AP13CTG44601_s_at Pavir.Ea03872 IRX10 2 388 3191 1018 714 930 609 896 0 0
AP13CTG03198_s_at Pavir.J03056 IRX10 2 443 3104 851 809 882 1413 1262 − 1 − 1Arabinoxylan (AX) and glucuronoarabinoxylan (GAX) synthesis (side chain)

Page 11 of 18Rao et al. Biotechnol Biofuels (2017) 10:266
callose-binding protein [43] was up-regulated after 1 day in induced cells. Both genes were more highly expressed at 1 day in induced samples compared with non-induced samples. No consistent pattern of increased callose epitopes was observed in the glycome profiles (Fig. 4 and Additional file 1: Figure S2).
Biosynthesis of cell wall precursorsCell wall polysaccharide precursors are synthesized in the cytoplasm [44, 45], and in the Golgi [46]. Many genes involved in the synthesis of cell wall precursors were identified in our dataset (Table 1 and Additional file 5: Table S3). Differential expression patterns were observed
for genes encoding enzymes involved in the formation of eleven nucleoside diphosphate (NDP)-sugars (UDP-Gal, UDP-Glc, UDP-Rha, UDP-GlcA, UDP-GalA, UDP-Xyl, UDP-apiose, UDP-Ara, GDP-Man, GDP-Glc, and GDP-Fuc) (Additional file 1: Figure S7). Generally speaking, transcripts encoding enzymes involved in the last steps of UDP-Rha, UDP-Gal, and UDP-GalA synthesis decreased, whereas transcripts encoding enzymes involved in the synthesis of UDP-Xyl [47] and UDP-Ara [44] increased after BL treatment (Additional file 1: Figure S7 and Addi-tional file 5: Table S3). Consistently, genes that encode transporters of cytosolic UDP-xylose into the Golgi (UXT, UDP-xylose transporter) [48] were up-regulated
Table 1 continued
Gene information Expression information
Microarray Probe PvGene Clade/Gene Cluster 0 h Induced Non‑induced Compare
6 h 1 Day 3 Days 7 Days 1 Day 7 Days 1 Day 7 Days
AP13ITG71461_at Pavir.Aa01690 GUX 3 74 274 261 122 419 184 226 0 0
KanlowCTG10196_x_at Pavir.J03459 GUX 1 135 419 170 165 135 353 303 0 0
AP13CTG04376_s_at Pavir.Aa01745 XAX1 5 146 236 85 73 64 330 217 − 1 0
AP13ITG43704_at Pavir.Ea01415 XAT1 13 136 29 19 15 20 73 53 − 1 0
AP13.12340.m00010_s_at Pavir.Da01068 XAT1 0 179 147 173 190 146 212 227 0 − 1PF02458 (candidates for forming the ester linkages in GAX)
AP13CTG59034RC_at Pavir.Gb00939 12 22 34 103 280 171 27 30 0 1
AP13ITG73138_at Pavir.Fa02187 5 190 143 60 27 106 68 135 0 0
KanlowCTG26994RC_at Pavir.Aa01433 12 73 138 256 626 354 98 105 1 1
AP13ITG72773_s_at Pavir.Eb00373 13 1226 269 126 89 117 509 311 − 1 0
Pectin biosynthesis
AP13CTG05511_s_at Pavir.Ba00640 ARAD1 1 79 95 65 80 75 131 80 − 1 0
AP13CTG06439_at Pavir.Aa00624 GALS1 4 114 422 512 481 490 212 186 1 1
AP13CTG14035_at Pavir.J20866 RGXT4 4 129 211 228 254 217 291 219 − 1 0
AP13ITG63440_at Pavir.J14339 RGXT4 4 120 209 247 280 235 304 239 0 0
AP13CTG02428_s_at Pavir.Ba01601 GAUT1 0 1418 1296 1565 1607 1332 1562 1462 0 0
AP13CTG18174_at Pavir.Ba00237 GAUT7 2 118 331 247 232 125 447 315 − 1 − 1 KanlowCTG43804_at Pavir.Fb01281 GAUT4 16 90 77 138 150 95 206 162 − 1 − 1 AP13CTG09682_s_at Pavir.Ab01751 GAUT8 5 609 755 369 449 225 573 371 − 1 − 1
Pectin esterases
AP13ITG41170_at Pavir.Ea01491 PME 5 699 484 73 80 72 104 97 0 0
AP13CTG29622_at Pavir.Ia02028 PME 13 55 13 7 9 26 12 12 0 0
AP13ITG67053RC_at Pavir.Eb02306 PAE 5 83 92 27 15 10 602 200 − 1 0
AP13CTG10801RC_at Pavir.Ba00334 PAE 9 838 495 289 407 78 852 353 − 1 0
KanlowCTG09579_s_at Pavir.Eb04062 PAE 1 174 290 170 167 145 280 180 − 1 0
Wall structural protein
AP13CTG23898_at Pavir.J33924 AGP13 5 923 976 127 126 121 774 399 − 1 0
AP13ITG74104_at Pavir.J33924 AGP13 5 120 158 13 13 16 174 67 − 1 − 1 AP13ITG53973_s_at Pavir.Eb02706 FLA 1 315 1924 529 352 111 188 146 1 0
Expression values at each data point represent the mean of three biological replicates. Cluster represents the expression groups of filtered genes in induced samples defined by self-organizing map (SOM) method (Fig. 6a). Differential expression genes between induced and non-induced samples on 1 and 7 days were identified by the linear model in LIMMA [84]; − 1 (represented by bold italic), significant lower expression in induced samples than in non-induced samples, 1 (represented by italic), significant higher expression in induced samples than in non-induced samples, 0, no change between induced and non-induced samples

Page 12 of 18Rao et al. Biotechnol Biofuels (2017) 10:266
in induced cells. The elevated expression of UXS (UDP-xylose synthase), UXE (UDP-xylose epimerase), and UXT genes and decreased expression of the UER (nucle-otide-rhamnose synthase/epimerase-reductase) gene that encodes an enzyme for the final step in the biosynthesis of UDP-Rha [49] at 1 and 7 days (Table 1 and Additional file 1: Figure S7) may underlie the BL-induced decreases in rhamnose and arabinose/xylose ratio of the cell wall residues (Fig. 2).
Arabinoxylan (AX) and glucuronoarabinoxylan (GAX) synthesisA large number of arabinosyl (Ara) and/or glucuronosyl (GlcA) side chains are attached to the xylan backbone to form arabinoxylan and glucuronoarabinoxylan (GAX) in grass cell walls [50]. Several members of the GT43 and GT47 families, such as IRX9, IRX10, and IRX14, have been shown to be involved in xylan backbone extension in Arabidopsis [50–52]. Genes homologous to IRX10 and IRX14 were co-induced in switchgrass cells in response to BL, but genes homologous to IRX9/IRX9L were differ-entially expressed. Considering that IRX10L and IRX14, rather than IRX9, are required for xylan backbone syn-thesis in primary cell walls of Arabidopsis [53], the dif-ferential expression of these GT43 and GT47 genes in switchgrass may suggest differential functions in xylan extension in the primary and/or secondary cell wall.
A few genes in the GT8 family (GUX1 and GUX2 in Arabidopsis) [54] and GT61 family (XAT1 in wheat and XAX1 in rice) [55] have been identified to decorate the xylan backbone with glucuronosyl and arabinosyl substi-tution, respectively. An increased expression of switch-grass homologs of GUX1 was observed in BL-induced cells. However, the expression of switchgrass homologs of XAT1 and XAX1 was decreased in induced cells, with a lower value on day 1 and/or day 7 compared with non-induced cells.
Arabinoxylan and glucuronoarabinoxylan may be ester-linked to ferulic and p-coumaric acids in grass cell walls, providing a barrier to cell wall digestibility [56]. Enzymes in the Pfam family PF02458 are considered as candidates for forming the ester linkages in GAX [56, 57]. We examined the expression profiles of genes encoding enzymes belonging to the PF02458 family in our dataset (Additional file 5: Table S3), and further selected candi-date genes according to the differential accumulation of wall-esterified ferulic acid (decreased) and p-coumaric acid (increased) during the time course in induced sam-ples (Table 1). Expression of gene AP13ISTG72773 was down-regulated in induced cells (Additional file 5: Table S3), whereas P13CTG59034-RC and KanlCTG26994-RC were up-regulated. These two genes could be candidate targets for reducing the degree of ester linkages in the
GAX component of grass cell walls for increasing the effi-ciency of conversion of biomass to sugars.
Pectin and cell wall structural proteinsA limited number of enzymes have been unambiguously identified to be specifically required for synthesis of pec-tic polysaccharides [58, 59]. The switchgrass homolog of RGXT that is responsible for the xylosyl-linkage in RG-II [60] was weakly induced in the cell cultures in response to BL. Arabidopsis ARAD1 [61] and GALS1 [62] have been shown to encode enzymes involved in attaching α-1,5-arabinans and β-1,4-galactans onto the RG-I back-bone, respectively. The switchgrass homologs of ARAD1 show overall a slight up-regulation in response to BL, but are expressed at lower levels than in non-induced sam-ples on day 1 (Table 1). Interestingly, one homolog of GALS1 showed elevated expression throughout the time course in induced suspension cultures, with no change in expression on day 1 and day 7 in non-induced cultures. Considering the fact that β-1,4-galactans are more abun-dant in secondary than in primary cell walls [62], we sug-gest that this gene is a candidate for involvement in the synthesis of the galactan side chain of RG-I.
Several members of the galacturonosyltransferase (GAUT) family are responsible for constructing the HG chain [63]. Switchgrass genes belonging to the GAUT family were expressed with varying patterns in induced suspension cells, but were expressed lower at day 1 and day 7 than in non-induced cells. GAUT1 expression was relatively unaffected by BL addition, whereas the expres-sion of GAUT7 peaked at 6 h post BL addition. Consid-ering that Arabidopsis GAUT1 and GAUT7 form a core complex for HG synthesis [63], we suggest that a peak of HG synthesis might occur at 6 h and then decrease in induced samples to an overall lower level than in non-induced samples.
The largely unbranched HG polymer may be modified by methylesterification at C-6, and acetylation at O-2 and O-3, of GalA residues [64]. Most pectin methylesterase (PME) genes were down-regulated in both induced and non-induced cell cultures, consistent with the low degree of pectin methylation detected by glycome profiling (Fig. 4). Pectin acetylesterase (PAE) lowers the acetylation status of pectic polymers [65]. We have listed several PAE candidates which are down-regulated in BL-induced cell but up-regulated or unaffected on days 1 and 7 in non-induced cultures (Table 1).
We also observed differential expression of genes encoding cell wall structural proteins (Additional file 5: Table S3). For example, a rapid induction by 6 h and a higher expression on day 1 was found for genes encod-ing fasciclin-like arabinogalactan proteins (FLA) in induced compared with non-induced cells (Table 1 and

Page 13 of 18Rao et al. Biotechnol Biofuels (2017) 10:266
Additional file 5: Table S3). FLAs are plasma membrane-bound proteins with signal peptides that are involved in secondary cell wall development in Arabidopsis and rice [66]. We suggest that these FLAs may have a simi-lar function in cell membrane signaling in secondary cell wall formation in switchgrass suspension cells. Interest-ingly, expression of two genes encoding arabinogalactan proteins (AGPs) involved in cell–cell signaling [67] was significantly down-regulated by day 1 in induced cells, and these genes were expressed at lower levels at day 1 and/or day 7 than in non-induced cells (Table 1). We sug-gest that these AGP genes might be involved in negative regulation of secondary cell wall formation in switchgrass suspension cultures.
Transcriptional control of S lignin biosynthesisTwelve enzymes are well known to be involved in plant monolignol biosynthesis, and we have previously identi-fied a full suite of candidate switchgrass genes potentially involved in this pathway [11]. Here, we have confirmed the abundance of S lignin in BL-induced suspension cells. Genes encoding phenylalanine ammonia-lyase (PAL), cinnamate 4-hydroxylase (C4H), 4-coumarate:CoA ligase (4CL), and caffeoyl CoA 3-O-methyltransferase (CCoAoMT) were strongly up-regulated in BL-induced
cells. A coordinated accumulation of transcripts encod-ing cinnamoyl CoA reductase (CCR), caffeic acid 3-O-methyltransferase (COMT), and p-coumaroyl-CoA:monolignol transferase (PMT) was observed in induced cells after day 1. Cinnamyl alcohol dehydroge-nase (CAD) and ferulate/coniferaldehyde 5-hydroxylase (F5H) were the most highly expressed lignin synthesis genes during the time course in induced samples. Based on these results, a preferred route for S unit biosynthesis in induced cells is suggested in Additional file 1: Figure S8.
The differential expression of lignin biosynthesis genes suggests control by multiple transcription factors (TFs). To identify candidate TFs involved in S lignin accumu-lation, co-expression analysis was applied to our dataset using Pearson’s correlation method and lignin biosynthe-sis genes as bait genes (Additional file 6: Table S4). Most TF genes that were co-expressed with lignin biosynthe-sis genes belonged to the ERF, bHLH, NAC, MYB, bZIP, and WRKY families (Fig. 7). Several members of the ERF, NAC, MYB, and WRKY families have already been char-acterized for regulation of lignin genes [68–71], and are present in our candidate TF list. We found a group of TFs that were co-expressed with CCR, COMT, ferulate/conif-eraldehyde 5-hydroxylase (F5H), and CAD (all potentially
MYBNACWRKYERFbHLH
Positive correlationNegative correlation
0 50 100
ERFbHLHNACMYBbZIP
WRKYC2H2C3H
GRASMYB_related
HD-ZIPG2-like
TALETrihelix
ARFLBDHSF
FAR1GATAMIKC
NF-YAAP2
B3GeBP
SBPCAMTA
DofHB-other
Other
Number of gene
Tran
scrip
tion
fact
or fa
mily
Co-expressed TF with lignin biosynthesis genes
a b
Fig. 7 Co‑expression analysis of transcription factors with lignin biosynthesis genes. a Numbers of TFs of different families that are co‑expressed with lignin biosynthesis genes. b Co‑expression network of TFs and lignin biosynthesis genes. Pink and gray lines indicate positive and negative correlations, respectively

Page 14 of 18Rao et al. Biotechnol Biofuels (2017) 10:266
specific for S lignin biosynthesis), whereas a separate group of TFs showed co-expression with PAL, C4H, 4CL, and CCoAoMT (Fig. 7). Interestingly, caffeoyl shikimate 3′-hydroxylase (C3ˊH) was an outlier, suggesting inde-pendent regulation by additional TFs (Fig. 7).
Genes associated with stress and signalingIn addition, we identified candidate genes involved in hormone signaling and metabolism, and biotic stress. Details are provided and discussed in Additional file 7: Results and Discussion and Additional file 8: Table S7. In our BL-induced suspension cultures, we detected increased levels of lignin without tracheary element formation, and the elevated expression of many genes involved in sensing and resistance to pathogen attack (Additional file 5: Table S3 and Additional file 9: Table S5) which did not occur in non-induced cells. This suggests a role for BR in the activation of lignin biosynthesis as a defense response, rather than as part of a developmen-tally regulated program of cellular differentiation. The response of the switchgrass cells to BR appears similar to the response of Arabidopsis cell cultures to methyl JA, which includes increased production of monolignols and up-regulation of defense genes [72]. We suggest that the triple effects of BR signaling on immune responses and phenylpropanoid metabolism might not be independent events.
ConclusionsImproving the conversion efficiency of lignocellulosic biomass to fuels requires a better understanding of cell wall properties. However, until now, a relatively limited number of cell wall-related genes have been manipulated in switchgrass; these include UAM, GAUT, COMT, CCR, hydroxycinnamoyl CoA shikimate:quinate hydroxycin-namoyl transferase (HCT), and the transcription factors MYB4 and MYB46 [11, 68, 69, 73–78]. We have estab-lished a switchgrass suspension cell system in which lignification can be robustly activated by exogenously supplied brassinolide. Biochemical analysis of cell wall composition and associated transcript profiling has pro-vided a resource to identify genes related to both primary and secondary cell wall processes.
Based on our data, we present a model for key bio-chemical and transcriptional events associated with BL-induced reprogramming of cell wall development in switchgrass suspension cultures (Fig. 8). As early as 6 h after BL treatment, there is a reduced ratio of arabinose to xylose and a reduced content of base-sensitive pec-tic material released by sodium carbonate. At the same time, genes encoding CESAs associated with the primary cell wall are up-regulated. The low ratio of arabinose to xylose reflects a high degree of linear xylans, which have
reduced crosslinking with cellulose and other compo-nents of the wall [54, 79]. These changes suggest an early stimulation of primary cell wall synthesis.
By 1 day after BL treatment, the content of arabinose, xylose, and pectin increases, as does the ratio of wall-bound phenolic acids (p-CA/FA), suggesting initiation of secondary wall synthesis. After 3 days of BL treatment, there is an accumulation of xylans, lignin, p-CA and mixed-linkage β-glucans, as well as a reduction in the arabinose/xylose ratio. The expression of CESA forms associated with secondary cell wall increases. We suggest that secondary cell wall development is occurring in the cells within 3 days of BL addition.
Seven days after BL treatment, the initial ratio of arab-inose to xylose is restored, and elevated levels of xylans, mixed-linkage glucan, and lignin are deposited in the cell walls. These changes correlate with reduced expression of genes functioning in glycolysis, fermentation, and cell wall biosynthesis and increased expression of genes func-tioning in amino acid, nucleotide, and secondary metab-olism. At later times of cell wall lignification, carbon flow might be shifted from formation of structural polymers to formation of storage polymers and secondary metabo-lites in suspension cells.
The identification of genes associated with the above program of cell wall biogenesis provides a basis for appli-cation for high throughput genetic engineering of biofuel crops to reduce biomass recalcitrance and enhance bio-energy production.
MethodsDetermination of polysaccharide compositionCell wall extraction and polysaccharide estimation were as described previously [7, 26]. Briefly, the alcohol-insol-uble residue (AIR) of cell walls from suspension cells was extracted with water and then alcohol. After hydrolysis with 2 M trifluoroacetic acid (TFA), the concentrations of cell wall matrix polysaccharide components (arab-inose, xylose, mannose, galactose, rhamnose, fucose, and glucose) were determined by gas chromatography–mass spectrometry (GC–MS) as the corresponding alditol ace-tate derivatives in comparison to authentic standards.
Cell wall fractionalization and glycome profilingSequential cell wall extraction and subsequent glycome profiling were performed as described previously [7, 26]. Samples were sequentially extracted with 50 mM ammo-nium oxalate (pH ~ 5.0), 50 mM sodium carbonate with 0.5% (w/v) sodium borohydride (pH ~ 10), 1 M KOH with 1% (w/v) sodium borohydride, 4 M KOH with 1% (w/v) sodium borohydride, chlorite, and 4 M KOH with 1% (w/v) sodium borohydride post-chlorite. The super-natants were neutralized, dialyzed, lyophilized, and saved

Page 15 of 18Rao et al. Biotechnol Biofuels (2017) 10:266
after each fractionation step [26]. The information for each plant glycan-directed antibody used in subsequent ELISA assays is available in previous publications [26, 80] and in a web database (http://www.wallmabdb.net).
Determination of lignin content and compositionSwitchgrass stems (at the E4I2 and E4I4 stages) and sus-pension cells were collected and prepared as described previously [11, 81]. Lignin content and composition were determined by thioacidolysis followed by gas chro-matography/mass spectrometry (GC/MS) of trimethyl-silyl derivatives [11]. The extraction of soluble phenolics using 50% (v/v) methanol and 1.5% (v/v) acetic acid was as previously described [68]. Esterified cell wall-bound phenolics were subjected to low-temperature alkaline hydrolysis and determined by high-performance liquid chromatography (HPLC) [81].
Nuclear magnetic resonance (NMR) analysisLignin samples from switchgrass stems at the E4I4 stage and induced suspension cells at day 7 were isolated and
2D HSQC NMR spectral analysis was carried out as described previously [74].
Gene expression profiling, clustering, and annotationMicroarray analysis was conducted on induced samples at 0, 6 h, 1, 3, and 7 days and on non-induced samples at 1 and 7 days with replicates as previously described [11]. The raw and normalized microarray data for the present suspension cell samples can be downloaded at the Switchgrass Functional Genomics Server (http://switchgrassgenomics.noble.org) [82]. The microarray probes were mapped to Panicum virgatum v1.1 reference genome (http://phytozome.jgi.doe.gov/) using BLAST [83]. Gene expression patterns were clustered by prin-cipal component analysis (PCA), self-organizing map (SOM) (https://cran.r-project.org/web/packages/som/index.html), and the linear model (Limma) [84] using R 3.0.1. Gene classification and transcription factor (TF) identification in switchgrass was based on the Arabidop-sis and rice homologs as described previously [85]. Func-tional classification of differentially expressed genes was
0 h
Primary cell wall Primary cell wall Primary cell wallPrimary cell wall
6 h 1 day 3 day 7 day
Secondary cell wallSecondary cell wall
Hemicellulose
Primary cell wall
Arabinose/xylose
Base-sensitive pectin(sodium carbonate extraction)
CESA (primary cell wall)
Cellulose
Pectin
Lignin
Changes in wall composition
Changes in geneexpression
Lignin
Arabinose/xylose
Mixed linkage β-glucan
CESA (secondary cell wall)
Xylan
Lignin
Arabinose/xylose
Mixed linkage β-glucan
Arabinose/xylose
Base-sensitive pectin(sodium carbonate extraction)
p-CA
p-CA
p-CA
Fig. 8 Model for BL‑mediated cell wall development in switchgrass suspension cultures. The cell wall components cellulose, hemicellulose, pectin, and lignin are represented as yellow, blue, and green lines, and triangles symbols, respectively. Dynamic changes in cell wall composition and gene expression are represented in black and red squares, respectively. The direction of arrows shows increase (↑), restoration (→), or decrease (↓) in con‑tent of the corresponding components. Significant changes in cell wall composition and gene expression at each time point are as follows: at 6 h, a decrease in arabinose/xylose ratio, contents of pectin released by sodium carbonate, and an up‑regulation of CESAs involved in primary cell wall synthesis; at 1 day, restored content of arabinose, xylose, and pectin; at 3 days, an increased content of lignin, p‑CA and mixed‑linkage β‑glucan, a reduced ratio of arabinose/xylose, and an up‑regulation of CESAs associated with secondary cell wall synthesis; at 7 days, an increased content of xylan, lignin, p‑CA and mixed‑linkage β‑glucan, and restored ratio of arabinose/xylose

Page 16 of 18Rao et al. Biotechnol Biofuels (2017) 10:266
performed as described in Additional file 2: Materials and Methods.
RNA isolation and real‑time PCRThe methods for RNA isolation, cDNA synthesis, primer design, and qRT-PCR analysis were performed as previ-ously described [11]. Sequences of primers are provided in Additional file 10: Table S6. Transcript levels were determined by relative quantification using the ubiquitin gene as reference.
Authors’ contributionsXR, HS, and RAD designed the project. HS, SP, MGH, IGA, and DM conducted the determination of polysaccharide composition of cell wall residues and cell wall glycome profiling. HS, YP, AJR, and FC conducted the determination of lignin content and NMR analysis. XR and XC conducted microarray data analysis. All authors read and approved the final manuscript.
Author details1 BioDiscovery Institute and Department of Biological Sciences, University of North Texas, Denton, TX, USA. 2 BioEnergy Science Center (BESC), Oak Ridge National Laboratory (ORNL), Oak Ridge, TN, USA. 3 Complex Carbohy‑drate Research Center, The University of Georgia, 315 Riverbend Rd, Athens,
Additional files
Additional file 1: Figure S1. Comparison of the monosaccharide composition of switchgrass suspension cell walls with those of other plant cell suspensions. Figure S2. Glycome profiling heat map showing the relative abundance of cell wall glycan epitopes released sequentially from the AIR fractions of non‑induced and BL‑induced suspension cells. Figure S3. Measurement of wall‑bound phenolic acids in non‑induced and BL‑induced switchgrass suspension culture cells. Figure S4. Principal component analysis (PCA) of genes expressed in BL‑induced cultures. Figure S5. The expression of CESA genes in non‑induced and BL‑induced cultures. Figure S6. Validation of cell wall‑related gene expression in switchgrass suspension cultures by qRT‑PCR. Figure S7. Overview of changes in transcript levels for genes involved in cell wall precursor synthesis in BL‑induced cultures. Figure S8. Proposed route for S lignin biosynthesis in BL‑induced suspension cells.
Additional file 2: Materials and Methods. Supplementary information on pre‑processing of the microarray dataset.
Additional file 3: Table S1. List of differentially expressed genes in switchgrass suspension cells using SOM and the linear model.
Additional file 4: Table S2. Functional distribution of differentially expressed genes in switchgrass suspension cells.
Additional file 5: Table S3. Cell wall‑related functional groups in switch‑grass suspension cells.
Additional file 6: Table S4. List of TFs co‑expressed with lignin biosyn‑thesis genes in switchgrass suspension cells.
Additional file 7: Results and Discussion. Supplementary informa‑tion on genes involved in hormone signaling and metabolism, and biotic stress.
Additional file 8: Table S7. Expression of switchgrass genes involved in hormone signaling.
Additional file 9: Table S5. Expression of switchgrass genes involved in biotic stress responses.
Additional file 10: Table S6. Sequences of qRT‑PCR primers.
Additional file 11: Table S8. The Student’s t‑tests on the monosaccha‑ride composition and sequential extraction between pairwise samples.
GA 30602, USA. 4 Department of Chemical and Biomolecular Engineering, University of Tennessee, Knoxville, TN, USA. 5 Present Address: Marker‑assisted Breeding and Traits, Chromatin Inc, Lubbock, TX 79404, USA. 6 Present Address: Center for Applied Mathematics, Tianjin University, Tianjin 300072, China. 7 Pre‑sent Address: Mascoma LLC (Lallemand Company), 67 Etna Road, Lebanon, NH 03766, USA.
AcknowledgementsThe Panicum virgatum genome v1.1 sequence data were produced by the US Department of Energy Joint Genome Institute. We thank Drs Lina Gallego‑Giraldo and Luis Escamilla‑Treviño for critical reading of the manuscript.
Competing interestsThe authors declare that they have no competing interests.
FundingThis research was supported by the BioEnergy Science Center (BESC). The BioEnergy Science Center is a U.S. Department of Energy Bioenergy Research Center supported by the Office of Biological and Environmental Research in the DOE Office of Science. The generation of the CCRC series of plant cell wall glycan‑directed monoclonal antibodies used in this work was supported by the National Science Foundation Plant Genome Program (DBI‑0421683 and IOS‑0923992) to Dr. Michael G. Hahn.
Publisher’s NoteSpringer Nature remains neutral with regard to jurisdictional claims in pub‑lished maps and institutional affiliations.
Received: 8 August 2017 Accepted: 2 November 2017
References 1. Vogel J. Unique aspects of the grass cell wall. Curr Opin Plant Biol.
2008;11(3):301–7. 2. Loque D, Scheller HV, Pauly M. Engineering of plant cell walls for
enhanced biofuel production. Curr Opin Plant Biol. 2015;25:151–61. 3. Pauly M, Keegstra K. Plant cell wall polymers as precursors for biofuels.
Curr Opin Plant Biol. 2010;13(3):305–12. 4. Himmel ME, Ding S‑Y, Johnson DK, Adney WS, Nimlos MR, Brady JW,
et al. Biomass recalcitrance: engineering plants and enzymes for biofuels production. Science. 2007;315(5813):804–7.
5. Bouton JH. Molecular breeding of switchgrass for use as a biofuel crop. Curr Opin Genet Dev. 2007;17(6):553–8.
6. Cosgrove DJ, Jarvis MC. Comparative structure and biomechanics of plant primary and secondary cell walls. Front Plant Sci. 2012;3:204.
7. Pattathil S, Hahn MG, Dale BE, Chundawat SP. Insights into plant cell wall structure, architecture, and integrity using glycome profiling of native and AFEXTM‑pre‑treated biomass. J Exp Bot. 2015;66(14):4279–94.
8. Handakumbura PP, Hazen SP. Transcriptional regulation of grass second‑ary cell wall biosynthesis: playing catch‑up with Arabidopsis thaliana. Front Plant Sci. 2012;3:74.
9. Grabber JH, Ralph J, Lapierre C, Barrière Y. Genetic and molecular basis of grass cell‑wall degradability. I. Lignin–cell wall matrix interactions. CR Biol. 2004;327(5):455–65.
10. Barros J, Serrani‑Yarce JC, Chen F, Baxter D, Venables BJ, Dixon RA. Role of bifunctional ammonia‑lyase in grass cell wall biosynthesis. Nat Plants. 2016;2(6):16050.
11. Shen H, Mazarei M, Hisano H, Escamilla‑Trevino L, Fu CX, Pu YQ, et al. A genomics approach to deciphering lignin biosynthesis in switchgrass. Plant Cell. 2013;25(11):4342–61.
12. Kulkarni AR, Pattathil S, Hahn MG, York WS, O’Neill MA. Comparison of arabinoxylan structure in bioenergy and model grasses. Ind Biotechnol. 2012;8(4):222–9.
13. Sarath G, Baird LM, Vogel KP, Mitchell RB. Internode structure and cell wall composition in maturing tillers of switchgrass (Panicum virgatum L.). Biores Technol. 2007;98(16):2985–92.

Page 17 of 18Rao et al. Biotechnol Biofuels (2017) 10:266
14. Mustafa NR, de Winter W, van Iren F, Verpoorte R. Initiation, growth and cryopreservation of plant cell suspension cultures. Nat Protocols. 2011;6(6):715–42.
15. Burke D, Kaufman P, McNeil M, Albersheim P. The structure of plant cell walls: VI. A survey of the walls of suspension‑cultured monocots. Plant Physiol. 1974;54(1):109–15.
16. Karkonen A, Koutaniemi S. Lignin biosynthesis studies in plant tissue cultures. J Integr Plant Biol. 2010;52(2):176–85.
17. Creelman RA, Mullet JE. Oligosaccharins, brassinolides, and jasmonates: nontraditional regulators of plant growth, development, and gene expression. Plant Cell. 1997;9(7):1211–23.
18. Yamamoto R, Fujioka S, Demura T, Takatsuto S, Yoshida S, Fukuda H. Brassinosteroid levels increase drastically prior to morphogenesis of tracheary elements. Plant Physiol. 2001;125(2):556–63.
19. Negi S, Tak H, Ganapathi TR. In vitro xylem vessel elements forma‑tion from banana embryogenic cells and expression analysis of vessel development‑related genes. Plant Biotechnol Rep. 2015;9(2):47–54.
20. Oda Y, Mimura T, Hasezawa S. Regulation of secondary cell wall develop‑ment by cortical microtubules during tracheary element differentiation in Arabidopsis cell suspensions. Plant Physiol. 2005;137(3):1027–36.
21. Kubo M, Udagawa M, Nishikubo N, Horiguchi G, Yamaguchi M, Ito J, et al. Transcription switches for protoxylem and metaxylem vessel formation. Genes Dev. 2005;19(16):1855–60.
22. Mazarei M, Al‑Ahmad H, Rudis MR, Joyce BL, Stewart CN Jr. Switchgrass (Panicum virgatum L.) cell suspension cultures: establishment, characteri‑zation, and application. Plant Sci. 2011;181(6):712–5.
23. Eberhardt TL, Bernards MA, He L, Davin LB, Wooten JB, Lewis NG. Lignifica‑tion in cell suspension cultures of Pinus taeda. In situ characterization of a gymnosperm lignin. J Biol Chem. 1993;268(28):21088–96.
24. Labourel A, Crouch LI, Brás JLA, Jackson A, Rogowski A, Gray J, et al. The mechanism by which arabinoxylanases can recognize highly decorated xylans. J Biol Chem. 2016;291(42):22149–59.
25. Bar‑Peled M, Urbanowicz BR, O’Neill MA. The synthesis and origin of the pectic polysaccharide rhamnogalacturonan II—insights from nucleotide sugar formation and diversity. Front Plant Sci. 2012;3:92.
26. Pattathil S, Avci U, Miller JS, Hahn MG. Immunological approaches to plant cell wall and biomass characterization: glycome profiling. In: Him‑mel ME, editor. Biomass conversion: methods and protocols. Totowa: Humana Press; 2012. p. 61–72.
27. Pilnik W, Rombouts FM. Polysaccharides and food processing. Carbohydr Res. 1985;142(1):93–105.
28. Brummell DA. Cell wall disassembly in ripening fruit. Funct Plant Biol. 2006;33(2):103–19.
29. Merali Z, Collins SRA, Elliston A, Wilson DR, Käsper A, Waldron KW. Charac‑terization of cell wall components of wheat bran following hydrothermal pretreatment and fractionation. Biotechnol Biofuels. 2015;8(1):23.
30. Hedley CL. Carbohydrates in grain legume seeds: improving nutritional quality and agronomic characteristics. Oxfordshire: CABI; 2000.
31. Schmidt D, Schuhmacher F, Geissner A, Seeberger PH, Pfrengle F. Auto‑mated synthesis of arabinoxylan‑oligosaccharides enables characteri‑zation of antibodies that recognize plant cell wall glycans. Chemistry. 2015;21(15):5709–13.
32. Ralph J, Grabber JH, Hatfield RD. Lignin‑ferulate cross‑links in grasses: active incorporation of ferulate polysaccharide esters into ryegrass lignins. Carbohydr Res. 1995;275(1):167–78.
33. Grabber JH, Ralph J, Hatfield RD. Cross‑linking of maize walls by ferulate dimerization and incorporation into lignin. J Agric Food Chem. 2000;48(12):6106–13.
34. Chen F, Duran AL, Blount JW, Sumner LW, Dixon RA. Profiling phenolic metabolites in transgenic alfalfa modified in lignin biosynthesis. Phyto‑chemistry. 2003;64(5):1013–21.
35. Thimm O, Blasing O, Gibon Y, Nagel A, Meyer S, Kruger P, et al. MAPMAN: a user‑driven tool to display genomics data sets onto diagrams of meta‑bolic pathways and other biological processes. Plant J. 2004;37(6):914–39.
36. Yennawar NH, Li LC, Dudzinski DM, Tabuchi A, Cosgrove DJ. Crystal structure and activities of EXPB1 (Zea m 1), alpha, beta‑expansin and group‑1 pollen allergen from maize. Proc Natl Acad Sci USA. 2006;103(40):14664–71.
37. Kumar M, Turner S. Plant cellulose synthesis: CESA proteins crossing kingdoms. Phytochemistry. 2015;112:91–9.
38. Sorek N, Sorek H, Kijac A, Szemenyei HJ, Bauer S, Hématy K, et al. The Arabidopsis COBRA protein facilitates cellulose crystallization at the plasma membrane. J Biol Chem. 2014;289(50):34911–20.
39. Liepman AH, Cavalier DM. The cellulose synthase‑like A and cellulose synthase‑like C families: recent advances and future perspectives. Front Plant Sci. 2012;3:109.
40. Schwerdt JG, MacKenzie K, Wright F, Oehme D, Wagner JM, Harvey AJ, et al. Evolutionary dynamics of the cellulose synthase gene superfamily in grasses. Plant Physiol. 2015;168:968–83.
41. Fincher GB. Revolutionary times in our understanding of cell wall biosyn‑thesis and remodeling in the grasses. Plant Physiol. 2009;149(1):27–37.
42. Yadav SR, Yan D, Sevilem I, Helariutta Y. Plasmodesmata‑mediated intercellular signaling during plant growth and development. Specialised membrane domains of plasmodesmata, plant intercellular nanopores. Front Plant Sci. 2014;5:131.
43. Simpson C, Thomas C, Findlay K, Bayer E, Maule AJ. An Arabidopsis GPI‑anchor plasmodesmal neck protein with callose binding activity and potential to regulate cell‑to‑cell trafficking. Plant Cell. 2009;21(2):581–94.
44. Alonso AP, Piasecki RJ, Wang Y, LaClair RW, Shachar‑Hill Y. Quantifying the labeling and the levels of plant cell wall precursors using ion chromatog‑raphy tandem mass spectrometry. Plant Physiol. 2010;153(3):915–24.
45. Fry SC. Plant cell wall biosynthesis, in eLS. Hoboken: John Wiley & Sons Inc; 2001.
46. Bar‑Peled M, O’Neill MA. Plant nucleotide sugar formation, inter‑conversion, and salvage by sugar recycling. Annu Rev Plant Biol. 2011;62(1):127–55.
47. Harper AD, Bar‑Peled M. Biosynthesis of UDP‑xylose. Cloning and charac‑terization of a novel Arabidopsis gene family, UXS, encoding soluble and putative membrane‑bound UDP‑glucuronic acid decarboxylase isoforms. Plant Physiol. 2002;130(4):2188–98.
48. Ebert B, Rautengarten C, Guo X, Xiong G, Stonebloom S, Smith‑Moritz AM, et al. Identification and characterization of a golgi‑localized UDP‑xylose transporter family from Arabidopsis. Plant Cell. 2015;27(4):1218–27.
49. Han X, Qian L, Zhang L, Liu X. Structural and biochemical insights into nucleotide–rhamnose synthase/epimerase–reductase from Arabidopsis thaliana. Biochim Biophys Acta Proteins Proteom. 2015;1854(10, Part A):1476–86.
50. Scheller HV, Ulvskov P. Hemicelluloses. Annu Rev Plant Biol. 2010;61(1):263–89.
51. Urbanowicz BR, Peña MJ, Moniz HA, Moremen KW, York WS. Two Arabidopsis proteins synthesize acetylated xylan in vitro. Plant J. 2014;80(2):197–206.
52. Jensen JK, Johnson NR, Wilkerson CG. Arabidopsis thaliana IRX10 and two related proteins from Psyllium and Physcomitrella patens are xylan xylosyltransferases. Plant J. 2014;80(2):207–15.
53. Mortimer JC, Faria‑Blanc N, Yu X, Tryfona T, Sorieul M, Ng YZ, et al. An unusual xylan in Arabidopsis primary cell walls is synthesised by GUX3, IRX9L, IRX10L and IRX14. Plant J. 2015;83(3):413–26.
54. Mortimer JC, Miles GP, Brown DM, Zhang ZN, Segura MP, Weimar T, et al. Absence of branches from xylan in Arabidopsis gux mutants reveals potential for simplification of lignocellulosic biomass. Proc Natl Acad Sci USA. 2010;107(40):17409–14.
55. Anders N, Wilkinson MD, Lovegrove A, Freeman J, Tryfona T, Pellny TK, et al. Glycosyl transferases in family 61 mediate arabinofuranosyl transfer onto xylan in grasses. Proc Natl Acad Sci USA. 2012;109(3):989–93.
56. Mitchell RAC, Dupree P, Shewry PR. A novel bioinformatics approach identifies candidate genes for the synthesis and feruloylation of arabi‑noxylan. Plant Physiol. 2007;144(1):43–53.
57. Bartley LE, Peck ML, Kim S‑R, Ebert B, Manisseri C, Chiniquy DM, et al. Overexpression of a BAHD acyltransferase, OsAt10, alters rice cell wall hydroxycinnamic acid content and saccharification. Plant Physiol. 2013;161(4):1615–33.
58. Harholt J, Suttangkakul A, Scheller HV. Biosynthesis of pectin. Plant Physiol. 2010;153(2):384–95.
59. Atmodjo MA, Hao Z, Mohnen D. Evolving views of pectin biosynthesis. Annu Rev Plant Biol. 2013;64(1):747–79.
60. Liu X‑L, Liu L, Niu Q‑K, Xia C, Yang K‑Z, Li R, et al. MALE GAMETOPHYTE DEFECTIVE 4 encodes a rhamnogalacturonan II xylosyltransferase and is important for growth of pollen tubes and roots in Arabidopsis. Plant J. 2011;65(4):647–60.

Page 18 of 18Rao et al. Biotechnol Biofuels (2017) 10:266
• We accept pre-submission inquiries
• Our selector tool helps you to find the most relevant journal
• We provide round the clock customer support
• Convenient online submission
• Thorough peer review
• Inclusion in PubMed and all major indexing services
• Maximum visibility for your research
Submit your manuscript atwww.biomedcentral.com/submit
Submit your next manuscript to BioMed Central and we will help you at every step:
61. Harholt J, Jensen JK, Sørensen SO, Orfila C, Pauly M, Scheller HV. ARA‑BINAN DEFICIENT 1 Is a putative arabinosyltransferase involved in biosyn‑thesis of pectic arabinan in Arabidopsis. Plant Physiol. 2006;140(1):49–58.
62. Liwanag AJM, Ebert B, Verhertbruggen Y, Rennie EA, Rautengarten C, Oikawa A, et al. Pectin biosynthesis: GALS1 in Arabidopsis thaliana is a β‑1, 4‑galactan β‑1, 4‑galactosyltransferase. Plant Cell. 2012;24(12):5024–36.
63. Atmodjo MA, Sakuragi Y, Zhu X, Burrell AJ, Mohanty SS, Atwood JA, et al. Galacturonosyltransferase (GAUT)1 and GAUT7 are the core of a plant cell wall pectin biosynthetic homogalacturonan:galacturonosyltransferase complex. Proc Natl Acad Sci USA. 2011;108(50):20225–30.
64. Caffall KH, Pattathil S, Phillips SE, Hahn MG, Mohnen D. Arabidopsis thali-ana T‑DNA mutants implicate GAUT genes in the biosynthesis of pectin and xylan in cell walls and seed testa. Mol Plant. 2009;2(5):1000–14.
65. de Souza A, Hull PA, Gille S, Pauly M. Identification and functional charac‑terization of the distinct plant pectin esterases PAE8 and PAE9 and their deletion mutants. Planta. 2014;240(5):1123–38.
66. Oikawa A, Joshi HJ, Rennie EA, Ebert B, Manisseri C, Heazlewood JL, et al. An Integrative approach to the identification of Arabidopsis and Rrce genes involved in xylan and secondary wall development. PLoS ONE. 2010;5(11):e15481.
67. Guan Y, Nothnagel EA. Binding of arabinogalactan proteins by Yariv phe‑nylglycoside triggers wound‑like responses in Arabidopsis cell cultures. Plant Physiol. 2004;135(3):1346–66.
68. Shen H, He X, Poovaiah CR, Wuddineh WA, Ma J, Mann DGJ, et al. Func‑tional characterization of the switchgrass (Panicum virgatum) R2R3‑MYB transcription factor PvMYB4 for improvement of lignocellulosic feed‑stocks. New Phytol. 2012;193(1):121–36.
69. Zhong R, Yuan Y, Spiekerman JJ, Guley JT, Egbosiuba JC, Ye Z‑H. Func‑tional characterization of NAC and MYB transcription factors Involved in regulation of biomass production in switchgrass (Panicum virgatum). PLoS ONE. 2015;10(8):e0134611.
70. Zhao Q, Dixon RA. Transcriptional networks for lignin biosynthesis: more complex than we thought? Trends Plant Sci. 2011;16(4):227–33.
71. Hussey SG, Mizrachi E, Creux NM, Myburg AA. Navigating the transcrip‑tional roadmap regulating plant secondary cell wall deposition. Front Plant Sci. 2013;4:325.
72. Pauwels L, Morreel K, De Witte E, Lammertyn F, Van Montagu M, Boerjan W, et al. Mapping methyl jasmonate‑mediated transcriptional reprogram‑ming of metabolism and cell cycle progression in cultured Arabidopsis cells. Proc Natl Acad Sci USA. 2008;105(4):1380–5.
73. Escamilla‑Treviño LL, Shen H, Hernandez T, Yin Y, Xu Y, Dixon RA. Early lignin pathway enzymes and routes to chlorogenic acid in switchgrass (Panicum virgatum L.). Plant Mol Biol. 2014;84(4–5):565–76.
74. Shen H, Poovaiah CR, Ziebell A, Tschaplinski TJ, Pattathil S, Gjersing E, et al. Enhanced characteristics of genetically modified switchgrass (Panicum virgatum L.) for high biofuel production. Biotechnol for Biofuels. 2013;6(1):71.
75. Fu C, Mielenz JR, Xiao X, Ge Y, Hamilton CY, Rodriguez M, et al. Genetic manipulation of lignin reduces recalcitrance and improves ethanol production from switchgrass. Proc Natl Acad Sci USA. 2011;108(9):3803–8.
76. Dumitrache A, Natzke J, Rodriguez M, Yee KL, Thompson OA, Poovaiah CR, et al. Transgenic switchgrass (Panicum virgatum L.) targeted for reduced recalcitrance to bioconversion: a two‑year comparative analysis of field‑grown lines modified for target gene or genetic element expres‑sion. Plant Biotechnol J. 2017;15:688–97.
77. Willis J, Smith J, Mazarei M, Zhang J, Turner G, Decker S, et al. Downregu‑lation of the UDP‑arabinomutase gene in switchgrass (Panicum virgatum L.) results in increased cell wall lignin while reducing arabinose‑glycans. Front Plant Sci. 2016;7:1580.
78. Escamilla‑Treviño LL, Shen H, Uppalapati SR, Ray T, Tang Y, Hernandez T, et al. Switchgrass (Panicum virgatum) possesses a divergent family of cin‑namoyl CoA reductases with distinct biochemical properties. New Phytol. 2010;185(1):143–55.
79. Brice RE, Morrison IM. The degradation of isolated hemicelluloses and lignin‑hemicellulose complexes by cell‑free, rumen hemicellulases. Carbohydr Res. 1982;101(1):93–100.
80. Pattathil S, Avci U, Baldwin D, Swennes AG, McGill JA, Popper Z, et al. A comprehensive toolkit of plant cell wall glycan‑directed monoclonal antibodies. Plant Physiol. 2010;153(2):514–25.
81. Shen H, Fu C, Xiao X, Ray T, Tang Y, Wang Z, et al. Developmental control of lignification in stems of lowland switchgrass variety Alamo and the effects on saccharification efficiency. BioEnergy Res. 2009;2(4):233–45.
82. Zhang JY, Lee YC, Torres‑Jerez I, Wang M, Yin Y, Chou WC, et al. Devel‑opment of an integrated transcript sequence database and a gene expression atlas for gene discovery and analysis in switchgrass (Panicum virgatum L.). Plant J. 2013;74(1):160–73.
83. Chen X, Ma Q, Rao X, Tang Y, Wang Y, Li G, et al. Genome‑scale identifi‑cation of cell‑wall‑related genes in switchgrass through comparative genomics and computational analyses of transcriptomic data. BioEnergy Res. 2015;9(1):172–80.
84. Ritchie ME, Phipson B, Wu D, Hu Y, Law CW, Shi W, et al. limma powers dif‑ferential expression analyses for RNA‑sequencing and microarray studies. Nucleic Acids Res. 2015;43(7):e47.
85. Rao X, Lu N, Li G, Nakashima J, Tang Y, Dixon RA. Comparative cell‑specific transcriptomics reveals differentiation of C4 photosynthesis pathways in switchgrass and other C4 lineages. J Exp Bot. 2016;67(6):1649–62.


![OpAccess Insecticide-treatedξdurableξwallξliningξ (ITWL ... · MessengerξandξRowlandξMalar J Pageξ2ξofξ18 maintainandconsolidategainsandtotransitiontowards malariaeliminationanderadication[20],thereisagrow](https://img.pdfslide.net/doc/110x75/5fbaa2ee85d8cf311b6e90d2/opaccess-insecticide-treateddurablewalllining-itwl-messengerandrowlandmalar.jpg)