Embed Size (px)
Citation preview

138 The Open Atmospheric Science Journal, 2009, 3, 138-146
1874-2823/09 2009 Bentham Open
Open Access
Aviation Applications of the Pulsed Doppler LIDAR – Experience in Hong Kong
P.W. Chan*
Hong Kong Observatory, 134A Nathan Road, Hong Kong, China
Abstract: The Hong Kong Observatory (HKO) introduced a Doppler LIDAR to the Hong Kong International Airport
(HKIA) in 2002, the first LIDAR for aviation alerting services in the world. Since then, HKO has developed a number of
weather products based on the LIDAR’s velocity and backscatter power data. LIDAR is found to provide crucial
information in a wide variety of aviation applications. This paper gives a review of the experience in Hong Kong in the
development of aviation-related weather products using the LIDAR data. Applications include: automatic windshear
alerting from the HKO-developed glide-path scans, detection of low-level turbulence, 2D wind retrieval for intense
convective events from LIDAR-radar dual Doppler analysis, 3D wind retrieval from a single LIDAR for terrain-disrupted
airflow, visibility map based on backscatter power distribution in conical scans, and mixing-height monitoring in vertical
scans.
1. INTRODUCTION
In August 2002, the Hong Kong Observatory (HKO) introduced a pulsed Doppler LIght Detection And Ranging (LIDAR) system to the Hong Kong International Airport (HKIA), the first LIDAR for aviation weather alerting in the world (“first LIDAR” in Fig. 1). The primary application of the HKIA is the monitoring and alerting of low-level windshear at HKIA. To date, this LIDAR is the unit with the longest operation history in the world. Its performance is found to be generally satisfactory, fulfilling the required system availability of 98%.
Based on the radial velocity data of the LIDAR, HKO has developed the first LIDAR-based windshear alerting system in the world and put it into operation since December 2005. The LIDAR turns out to be very suitable for detecting low-level windshear in clear-air conditions, which accounts for nearly 90% of windshear reports at HKIA. In view of the success of the first LIDAR, HKO set up the second LIDAR inside the airport in October 2006 (location in Fig. 1). The second unit serves as a backup of the first one. When not required to perform the backup function, the second LIDAR makes more frequent scans over the north runway of HKIA, over which most of the aircraft approaches are made, to better capture the transient and sporadic windshear associated with terrain-disrupted airflow. In March 2009, the first LIDAR is relocated to a site near the south runway (location in Fig. 1). This gets to the time of “runway-specific LIDAR”.
Apart from automatic windshear detection, HKO has also developed a number of products based on the wind and backscattered power data of the LIDAR, including turbulence intensity distribution around the airport, 2D and 3D wind fields retrieved from the LIDAR data, visibility
*Address correspondence to this author at the Hong Kong Observatory, 134A
Nathan Road, Hong Kong, China; E-mail: [email protected]
map and mixing height monitoring tool. This paper aims at giving an overview of HKO’s applications of LIDAR in aviation weather services in the past several years. The performance of the LIDAR in the operational environment is described in Section 2. Sections 3 to 6 discuss the various applications of the LIDAR. Conclusions of the paper are given in Section 7.
2. PERFORMANCE OF THE LIDAR
The performance of the LIDAR has been studied in terms of its measurable range and the quality of the wind data [1] which are fundamental to the windshear detection function.
Data availability of the LIDAR over the four seasons in a typical year (February 2004 to January 2005) has been studied. Noting that in each season, the data availability is more or less isotropic with respect to the azimuth angle, curves of azimuthally averaged data availability are prepared (Fig. 2). Two commonly used Plan Position Indicator (PPI) scans of the first LIDAR are considered, namely, elevation angles of 1 degree and 4.5 degrees which could represent roughly the wind conditions near the arrival and departure corridors.
For the 1-degree PPI scans, the curves for the different seasons appear to be quite similar. Data are available for at least 70% of the time up to about 7.5 km (8 km in spring time (February to April)), providing just sufficient coverage for the arrival corridors. For the 4.5-degree PPI scans, the springtime (February to April) sees less LIDAR velocity data between 1.5 and 7.5 km compared to the other three seasons, possibly as a result of the lower cloud-base height in spring. Taking an availability threshold of 70%, the maximum measurement range for the 4.5-degree PPI scans in springtime is about 6 km. This corresponds to a height of about 2,200 feet (or 670 m) AGL assuming a 6-degree glide path, which is sufficient to cover the international requirement of low-level windshear alerting service (at least up to 1,600 feet).

Aviation Applications of the Pulsed Doppler LIDAR The Open Atmospheric Science Journal, 2009, Volume 3 139
Fig. (1). Meteorological instruments in the vicinity of HKIA, including the two Doppler LIDARs near the centre of the airfield.
Fig. (2). Data availability curves (as a function of range) for the 1-degree (upper) and 4.5-degree (lower) PPI scans of the first LIDAR at
HKIA.
����������
������ ���
������������������������
�����
������������ ����������
� �����������������
����������
����������
����������
��������
�����������������������
��������
����������� !
�
������ �����"#$%
%�&
'������"#$%
���������
���� ����'�������"#$%
�����(#$%�)���������*��+�����!��'���������,
��-�.�$!�����/
0��.�1������/
$���.�( �����/
��2����/�.�1�����3
���
��
��
��
��
��
�
�
��
��
�� ���� ���� ��� ��� ���� ���� ���� ���� ���� �����
� �������
� � � � �� ���������
�
��-�.�$!�����/
0��.�1������/
$���.�( �����/
��2����/�.�1�����3
���
��
��
��
��
��
�
�
��
��
�
� ���� ���� ��� ��� ���� ���� ���� ���� ���� ������ �������
� � � � �� ���������
�
140 The Open Atmospheric Science Journal, 2009, Volume 3 P.W. Chan
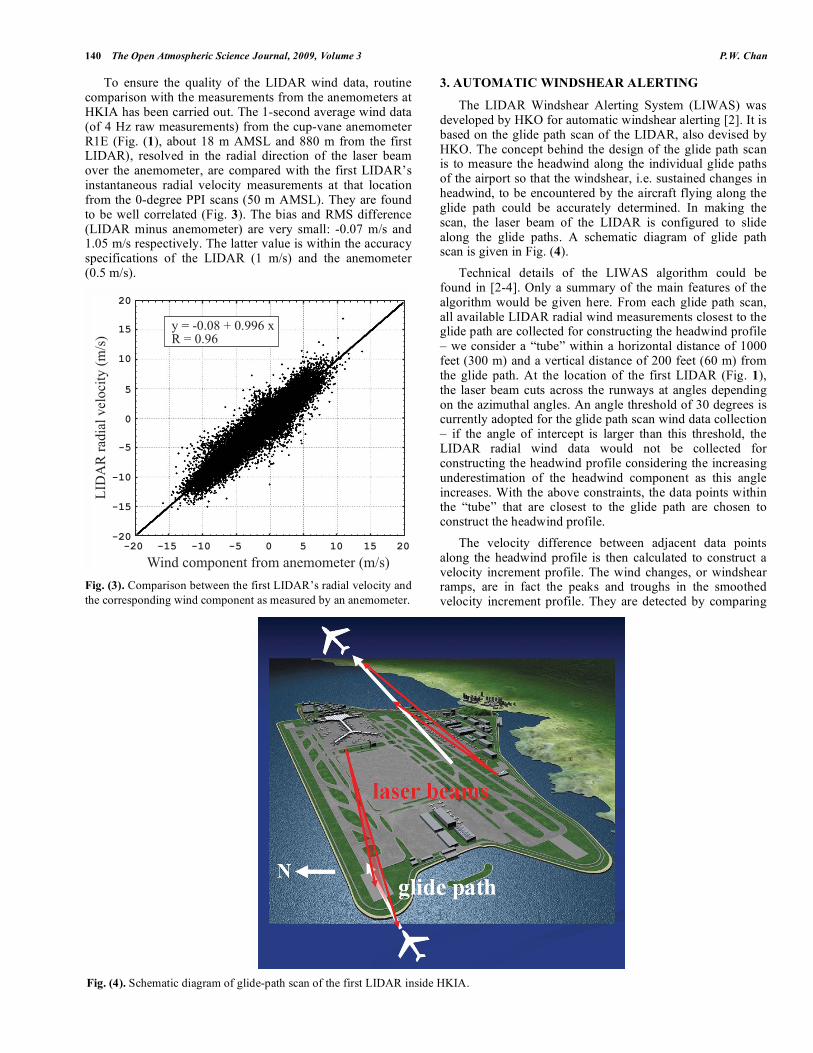
To ensure the quality of the LIDAR wind data, routine comparison with the measurements from the anemometers at HKIA has been carried out. The 1-second average wind data (of 4 Hz raw measurements) from the cup-vane anemometer R1E (Fig. (1), about 18 m AMSL and 880 m from the first LIDAR), resolved in the radial direction of the laser beam over the anemometer, are compared with the first LIDAR’s instantaneous radial velocity measurements at that location from the 0-degree PPI scans (50 m AMSL). They are found to be well correlated (Fig. 3). The bias and RMS difference (LIDAR minus anemometer) are very small: -0.07 m/s and 1.05 m/s respectively. The latter value is within the accuracy specifications of the LIDAR (1 m/s) and the anemometer (0.5 m/s).
Fig. (3). Comparison between the first LIDAR’s radial velocity and
the corresponding wind component as measured by an anemometer.
3. AUTOMATIC WINDSHEAR ALERTING
The LIDAR Windshear Alerting System (LIWAS) was developed by HKO for automatic windshear alerting [2]. It is based on the glide path scan of the LIDAR, also devised by HKO. The concept behind the design of the glide path scan is to measure the headwind along the individual glide paths of the airport so that the windshear, i.e. sustained changes in headwind, to be encountered by the aircraft flying along the glide path could be accurately determined. In making the scan, the laser beam of the LIDAR is configured to slide along the glide paths. A schematic diagram of glide path scan is given in Fig. (4).
Technical details of the LIWAS algorithm could be found in [2-4]. Only a summary of the main features of the algorithm would be given here. From each glide path scan, all available LIDAR radial wind measurements closest to the glide path are collected for constructing the headwind profile – we consider a “tube” within a horizontal distance of 1000 feet (300 m) and a vertical distance of 200 feet (60 m) from the glide path. At the location of the first LIDAR (Fig. 1), the laser beam cuts across the runways at angles depending on the azimuthal angles. An angle threshold of 30 degrees is currently adopted for the glide path scan wind data collection – if the angle of intercept is larger than this threshold, the LIDAR radial wind data would not be collected for constructing the headwind profile considering the increasing underestimation of the headwind component as this angle increases. With the above constraints, the data points within the “tube” that are closest to the glide path are chosen to construct the headwind profile.
The velocity difference between adjacent data points along the headwind profile is then calculated to construct a velocity increment profile. The wind changes, or windshear ramps, are in fact the peaks and troughs in the smoothed velocity increment profile. They are detected by comparing
Fig. (4). Schematic diagram of glide-path scan of the first LIDAR inside HKIA.
���������� �������!��������
"#�$��% &� �����'(������
)*�
+��&�('�,'�����-%'�� ���'����%���)*�
��
��
��
�
�
��
���
���
������ ��� ��� �� � � �� �� ��
Aviation Applications of the Pulsed Doppler LIDAR The Open Atmospheric Science Journal, 2009, Volume 3 141
each data point of this profile with the neighbouring points on its both sides. In general, a headwind profile contains more than one windshear ramp. The detected ramps are prioritized according to the severity factor S:
S = (dV
dt)(
V
V app
)2 = (V
H 1/3 )3 /Vapp (1)
where dV/dt is the rate of change of wind speed (along the glide path), V the total change of wind (along the glide path), Vapp the normal approach speed of the aircraft and H the ramp length. Thus, the primary parameter turned out to be the normalized windshear value V/H
1/3 [5].
LIWAS generates a windshear alert automatically when a windshear ramp with V exceeding the alert threshold is detected. The LIWAS alert is ingested into the Windshear and Turbulence Warning System (WTWS) operated by HKO to provide windshear alerts to ATC for relay via voice communications to the pilots. WTWS also integrates alerts from the other windshear detection systems/algorithms, including TDWR alerts and alerts generated by the anemometer-based algorithm. The integration is carried out based on a prioritization scheme which considers the significance of the event and credibility of the system issuing the alert. After integration, one single windshear alert will be generated for each runway corridor.
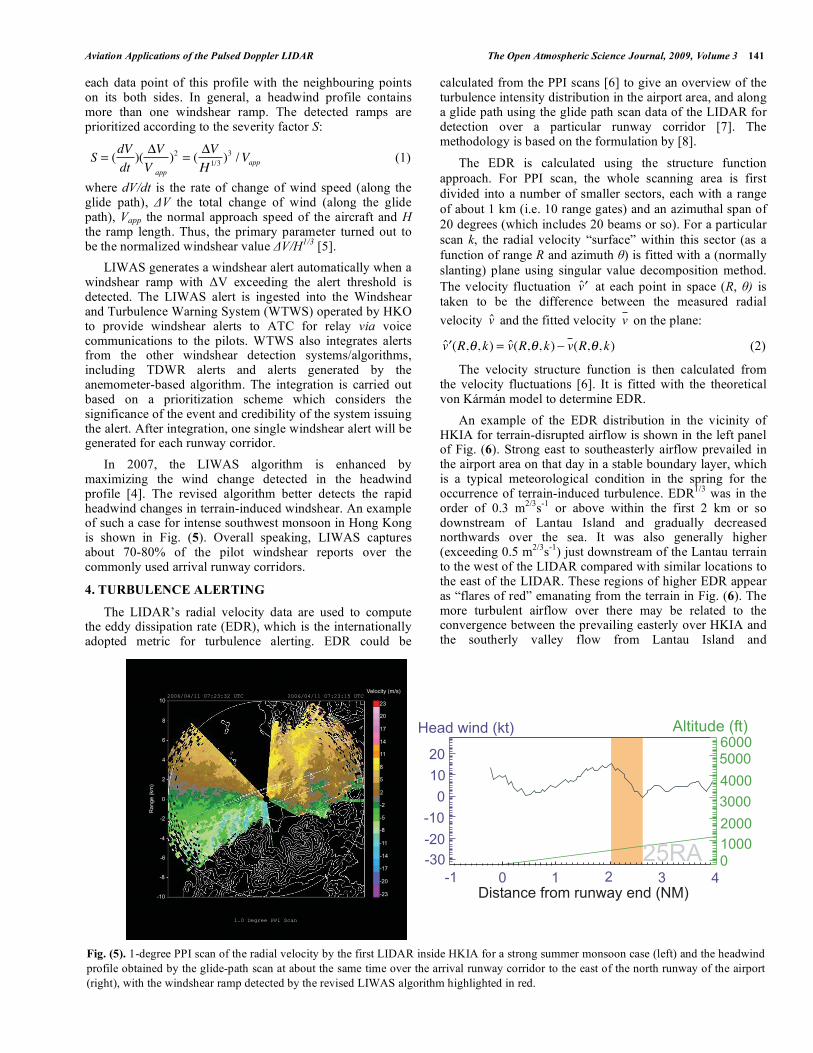
In 2007, the LIWAS algorithm is enhanced by maximizing the wind change detected in the headwind profile [4]. The revised algorithm better detects the rapid headwind changes in terrain-induced windshear. An example of such a case for intense southwest monsoon in Hong Kong is shown in Fig. (5). Overall speaking, LIWAS captures about 70-80% of the pilot windshear reports over the commonly used arrival runway corridors.
4. TURBULENCE ALERTING
The LIDAR’s radial velocity data are used to compute the eddy dissipation rate (EDR), which is the internationally adopted metric for turbulence alerting. EDR could be
calculated from the PPI scans [6] to give an overview of the turbulence intensity distribution in the airport area, and along a glide path using the glide path scan data of the LIDAR for detection over a particular runway corridor [7]. The methodology is based on the formulation by [8].
The EDR is calculated using the structure function
approach. For PPI scan, the whole scanning area is first
divided into a number of smaller sectors, each with a range
of about 1 km (i.e. 10 range gates) and an azimuthal span of
20 degrees (which includes 20 beams or so). For a particular
scan k, the radial velocity “surface” within this sector (as a
function of range R and azimuth ) is fitted with a (normally
slanting) plane using singular value decomposition method.
The velocity fluctuation v̂ at each point in space (R, ) is
taken to be the difference between the measured radial
velocity v̂ and the fitted velocity v on the plane:
v̂ (R, , k) = v̂(R, , k) v(R, , k) (2)
The velocity structure function is then calculated from the velocity fluctuations [6]. It is fitted with the theoretical von Kármán model to determine EDR.
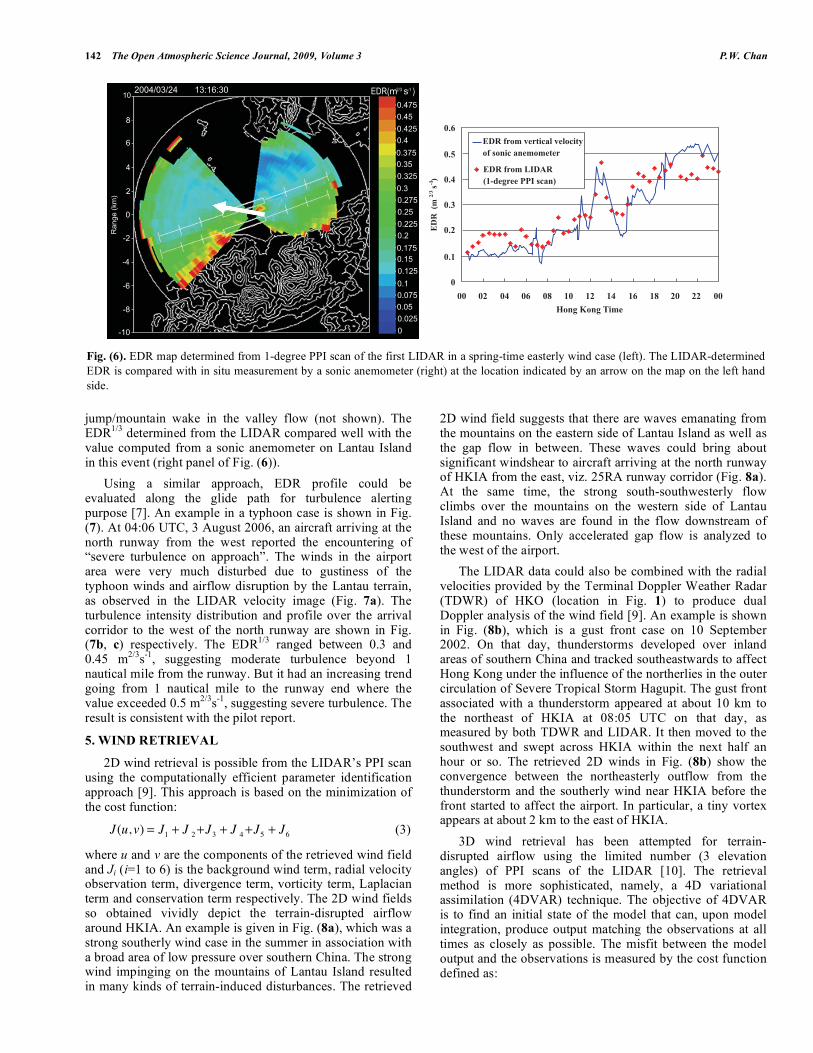
An example of the EDR distribution in the vicinity of HKIA for terrain-disrupted airflow is shown in the left panel of Fig. (6). Strong east to southeasterly airflow prevailed in the airport area on that day in a stable boundary layer, which is a typical meteorological condition in the spring for the occurrence of terrain-induced turbulence. EDR
1/3 was in the
order of 0.3 m2/3
s-1
or above within the first 2 km or so downstream of Lantau Island and gradually decreased northwards over the sea. It was also generally higher (exceeding 0.5 m
2/3s
-1) just downstream of the Lantau terrain
to the west of the LIDAR compared with similar locations to the east of the LIDAR. These regions of higher EDR appear as “flares of red” emanating from the terrain in Fig. (6). The more turbulent airflow over there may be related to the convergence between the prevailing easterly over HKIA and the southerly valley flow from Lantau Island and
Fig. (5). 1-degree PPI scan of the radial velocity by the first LIDAR inside HKIA for a strong summer monsoon case (left) and the headwind
profile obtained by the glide-path scan at about the same time over the arrival runway corridor to the east of the north runway of the airport
(right), with the windshear ramp detected by the revised LIWAS algorithm highlighted in red.
������������������ � ������������������ ���������� ��
��
��
��
��
��
�
�
�
��
��
��
���
���
���
���
���
�������������������
��
�
�
�
�
�
��
��
��
��
���
���������
����
��!"��!����
�����
���
������
��� � � � �
��������
��������
���������
�����#!��$��
%�������$&��&#�"���!�'(�
142 The Open Atmospheric Science Journal, 2009, Volume 3 P.W. Chan
jump/mountain wake in the valley flow (not shown). The EDR
1/3 determined from the LIDAR compared well with the
value computed from a sonic anemometer on Lantau Island in this event (right panel of Fig. (6)).
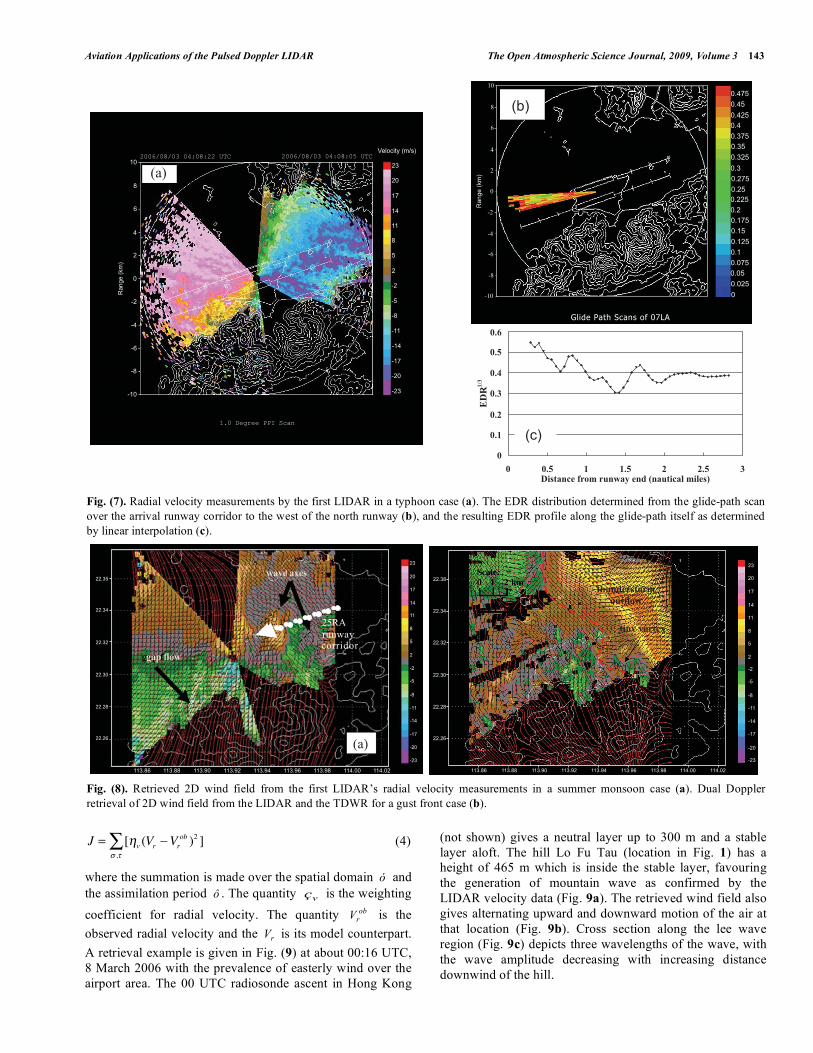
Using a similar approach, EDR profile could be evaluated along the glide path for turbulence alerting purpose [7]. An example in a typhoon case is shown in Fig. (7). At 04:06 UTC, 3 August 2006, an aircraft arriving at the north runway from the west reported the encountering of “severe turbulence on approach”. The winds in the airport area were very much disturbed due to gustiness of the typhoon winds and airflow disruption by the Lantau terrain, as observed in the LIDAR velocity image (Fig. 7a). The turbulence intensity distribution and profile over the arrival corridor to the west of the north runway are shown in Fig. (7b, c) respectively. The EDR
1/3 ranged between 0.3 and
0.45 m2/3
s-1
, suggesting moderate turbulence beyond 1 nautical mile from the runway. But it had an increasing trend going from 1 nautical mile to the runway end where the value exceeded 0.5 m
2/3s
-1, suggesting severe turbulence. The
result is consistent with the pilot report.
5. WIND RETRIEVAL
2D wind retrieval is possible from the LIDAR’s PPI scan using the computationally efficient parameter identification approach [9]. This approach is based on the minimization of the cost function:
J(u, v) = J1 + J 2+J3 + J 4+J5 + J6 (3)
where u and v are the components of the retrieved wind field and Ji (i=1 to 6) is the background wind term, radial velocity observation term, divergence term, vorticity term, Laplacian term and conservation term respectively. The 2D wind fields so obtained vividly depict the terrain-disrupted airflow around HKIA. An example is given in Fig. (8a), which was a strong southerly wind case in the summer in association with a broad area of low pressure over southern China. The strong wind impinging on the mountains of Lantau Island resulted in many kinds of terrain-induced disturbances. The retrieved
2D wind field suggests that there are waves emanating from the mountains on the eastern side of Lantau Island as well as the gap flow in between. These waves could bring about significant windshear to aircraft arriving at the north runway of HKIA from the east, viz. 25RA runway corridor (Fig. 8a). At the same time, the strong south-southwesterly flow climbs over the mountains on the western side of Lantau Island and no waves are found in the flow downstream of these mountains. Only accelerated gap flow is analyzed to the west of the airport.
The LIDAR data could also be combined with the radial velocities provided by the Terminal Doppler Weather Radar (TDWR) of HKO (location in Fig. 1) to produce dual Doppler analysis of the wind field [9]. An example is shown in Fig. (8b), which is a gust front case on 10 September 2002. On that day, thunderstorms developed over inland areas of southern China and tracked southeastwards to affect Hong Kong under the influence of the northerlies in the outer circulation of Severe Tropical Storm Hagupit. The gust front associated with a thunderstorm appeared at about 10 km to the northeast of HKIA at 08:05 UTC on that day, as measured by both TDWR and LIDAR. It then moved to the southwest and swept across HKIA within the next half an hour or so. The retrieved 2D winds in Fig. (8b) show the convergence between the northeasterly outflow from the thunderstorm and the southerly wind near HKIA before the front started to affect the airport. In particular, a tiny vortex appears at about 2 km to the east of HKIA.
3D wind retrieval has been attempted for terrain-disrupted airflow using the limited number (3 elevation angles) of PPI scans of the LIDAR [10]. The retrieval method is more sophisticated, namely, a 4D variational assimilation (4DVAR) technique. The objective of 4DVAR is to find an initial state of the model that can, upon model integration, produce output matching the observations at all times as closely as possible. The misfit between the model output and the observations is measured by the cost function defined as:
Fig. (6). EDR map determined from 1-degree PPI scan of the first LIDAR in a spring-time easterly wind case (left). The LIDAR-determined
EDR is compared with in situ measurement by a sonic anemometer (right) at the location indicated by an arrow on the map on the left hand
side.
��������������������
�)����)���)����)�
�)����)���)���
�)��)����)���)����)�
�)����)���)���
�)�
�
�)����)���)���
���� �� ����*��*��
�
��
�
�
�
�
��
��
��
��
���
���������
&#%�'����2���� ��2��� ����'����� ����������
&#%�'�����"#$%)�.���������"�� �,
�45
�43
�4/
�46
�4�
�4�
�
�� �� �/ �5 �7 �� �� �/ �5 �7 �� �� ��*����8��������
&#%��)���������,
�96����.�
Aviation Applications of the Pulsed Doppler LIDAR The Open Atmospheric Science Journal, 2009, Volume 3 143
J = [ v (Vr Vrob )2
,
] (4)
where the summation is made over the spatial domain ó and
the assimilation period ô . The quantity vç is the weighting
coefficient for radial velocity. The quantity ob
rV is the
observed radial velocity and the rV is its model counterpart.
A retrieval example is given in Fig. (9) at about 00:16 UTC,
8 March 2006 with the prevalence of easterly wind over the
airport area. The 00 UTC radiosonde ascent in Hong Kong
(not shown) gives a neutral layer up to 300 m and a stable
layer aloft. The hill Lo Fu Tau (location in Fig. 1) has a
height of 465 m which is inside the stable layer, favouring
the generation of mountain wave as confirmed by the
LIDAR velocity data (Fig. 9a). The retrieved wind field also
gives alternating upward and downward motion of the air at
that location (Fig. 9b). Cross section along the lee wave
region (Fig. 9c) depicts three wavelengths of the wave, with
the wave amplitude decreasing with increasing distance
downwind of the hill.
Fig. (7). Radial velocity measurements by the first LIDAR in a typhoon case (a). The EDR distribution determined from the glide-path scan
over the arrival runway corridor to the west of the north runway (b), and the resulting EDR profile along the glide-path itself as determined
by linear interpolation (c).
Fig. (8). Retrieved 2D wind field from the first LIDAR’s radial velocity measurements in a summer monsoon case (a). Dual Doppler
retrieval of 2D wind field from the LIDAR and the TDWR for a gust front case (b).
������������������� � ������������������� ���������� ��
��
��
��
��
��
�
�
�
��
��
��
���
���
���
���
���
�������������������
��
�
�
�
�
�
��
��
��
��
���
���������
� �
���������� ����������
��
�
�
�
�
��
�
��
��
���
���������
�)����)���)����)��)����)���)���
�)��)����)���)����)��)����)���)����)�
�
�)����)���)���
�+�
���
&#%�96
�45
�43
�4/
�46
�4�
�4�
�� �43 � ��43 �43 6
#���� ��'�������������)���� �������,
��)��
��)��
��)��
��)��
��)��
��)��
���)�� ���)�� ���),� ���),� ���),� ���),� ���),� ���)�� ���)��
� ����
���
���
���
���
��
��
��
�
�
�
��
��
��
��
��
���$%.�/ �('%%�&'%
2��:��
�!�'��
��)��
��)��
��)��
��)��
��)��
���)�� ���)�� ���),� ���),� ���),� ���),� ���),� ���)�� ���)��
���
���
���
���
���
��
��
��
�
�
�
��
��
��
��
��
��)��
���������������'��
�����2����:

144 The Open Atmospheric Science Journal, 2009, Volume 3 P.W. Chan
6. VISIBILITY AND MIXING HEIGHT MONITORING
The backscattered power data obtained in 1-degree PPI scans of the LIDAR are used to retrieve the horizontal variation of visibility in the airport area [11]. Klett’s inversion method is employed to retrieve the extinction coefficient (r) from the LIDAR’s backscattered power P(r) along a radial, where r is the range from the LIDAR:
(r) =exp[(S(r) Sm ) / k]
m1+2
kexp[(S(r ') Sm ) / k]dr '
r
rm (5)
for r less than a reference distance rm, where S(r) = ln(r2P(r))
is the logarithmic range-adjusted power, Sm = S(rm), m = (rm) and k a constant depending on the LIDAR wavelength and the properties of the aerosol. The following relationship between visibility V at the middle of the visible range (0.55 micron) and is adopted:
V =3.91 0.55
1.3
(6)
where is the wavelength of the LIDAR.
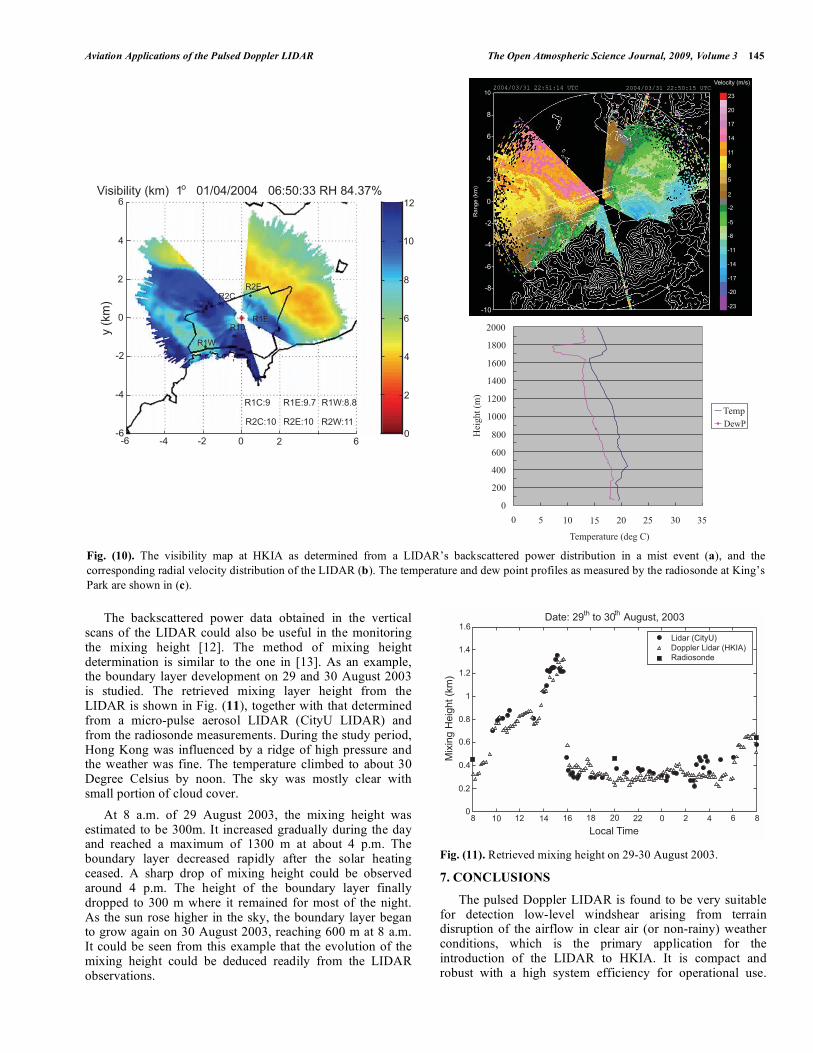
An example of the visibility map is given in Fig. (10). On 1 April 2004, the visibility was good inside HKIA in the early morning, ranging between 9 and 11 km as measured by the forward scatter sensors. However, the visibility map (Fig. 10a) shows that there was a band of relatively low visibility of about 4 km stretching from the gap south of Lo Fu Tau (location in Fig. 1) to the north of HKIA. As depicted in the LIDAR’s velocity image (Fig. 10b), east to southeasterly wind prevailed in this low visibility band. Mist was reported in the area upstream of Lantau Island at that time, with the visibility falling to about 3000 m at the HKO headquarters in the urban areas of Hong Kong (about 23 km to the east of HKIA). From the radiosonde measurement at 00 UTC on that day, there was an inversion of several degrees between 280 and 450 m (Fig. 10c). The stable temperature profile near the ground favoured the blockage of the prevailing easterly flow by the high mountains of Lantau Island (with peaks rising to about 1 km AMSL). On the other hand, the easterly wind managed to climb over the lower valleys, such as the gap to the south of Lo Fu Tau (about 150 m AMSL) and brought along the mist from the upstream area. As a result, a curving band of mist appeared to the east and north of HKIA. Another band of low visibility over the western part of HKIA (Fig. 10a) may be related to the flow emerging from Tung Chung Gap (location in Fig. 1).
Fig. (9). Radial velocity measurements by a LIDAR in a mountain wave case (a). The analyzed 3D wind field at a height of 500 m AMSL is
shown in (b). The cross-sectional wind field at the line A-B in (b) is given in (c).
������������������ � ������������������ ���������� ��
��
��
��
��
��
�
�
�
��
��
��
���
���
���
���
��
�
�
�
�
�
��
��
��
��
���
���������
���
-���� ��(��������*��./0
1�#�2�'�&�2%�����������
��������� ��
3
4����5���%�����������
��
�
�
�
�
�
��
��
��
��
������ �� �� �� �� � ������
��
��)�
��
��)�
��
��)�
�)�
�
�)�
�
�)�
�
�����&*4��!6&�7����!��0&���1������6����0���&*�%4��!18��!0����#&*��&������������ ��(��������*��./0
��������� ��
��
��)�
��
��)�
��
�)�
�
�)�
���� ��
���
���
���
���
����
����
����
����
����
����
���2����
�� ! �� !
� !
�� !
�
"
��� !
�� !
�"
� !
�""
�" ! "
� !�"
�
" !
�" !
�"
�� ! �� !
�"
�" ! �" !
Aviation Applications of the Pulsed Doppler LIDAR The Open Atmospheric Science Journal, 2009, Volume 3 145
The backscattered power data obtained in the vertical scans of the LIDAR could also be useful in the monitoring the mixing height [12]. The method of mixing height determination is similar to the one in [13]. As an example, the boundary layer development on 29 and 30 August 2003 is studied. The retrieved mixing layer height from the LIDAR is shown in Fig. (11), together with that determined from a micro-pulse aerosol LIDAR (CityU LIDAR) and from the radiosonde measurements. During the study period, Hong Kong was influenced by a ridge of high pressure and the weather was fine. The temperature climbed to about 30 Degree Celsius by noon. The sky was mostly clear with small portion of cloud cover.
At 8 a.m. of 29 August 2003, the mixing height was estimated to be 300m. It increased gradually during the day and reached a maximum of 1300 m at about 4 p.m. The boundary layer decreased rapidly after the solar heating ceased. A sharp drop of mixing height could be observed around 4 p.m. The height of the boundary layer finally dropped to 300 m where it remained for most of the night. As the sun rose higher in the sky, the boundary layer began to grow again on 30 August 2003, reaching 600 m at 8 a.m. It could be seen from this example that the evolution of the mixing height could be deduced readily from the LIDAR observations.
Fig. (11). Retrieved mixing height on 29-30 August 2003.
7. CONCLUSIONS
The pulsed Doppler LIDAR is found to be very suitable for detection low-level windshear arising from terrain disruption of the airflow in clear air (or non-rainy) weather conditions, which is the primary application for the introduction of the LIDAR to HKIA. It is compact and robust with a high system efficiency for operational use.
Fig. (10). The visibility map at HKIA as determined from a LIDAR’s backscattered power distribution in a mist event (a), and the
corresponding radial velocity distribution of the LIDAR (b). The temperature and dew point profiles as measured by the radiosonde at King’s
Park are shown in (c).
����+����������� �� ������*��*��� ��)��9�
��
��
�
�
�
�
�� �
�
���������
��
��
�
�
�
����
��0*,
��0*�� ��5*��
��5*,)� ��4*�)�
��4*��
��4
�����5
��5��0
������������������� � ������������������� ���������� ��
��
��
��
��
��
�
�
�
��
��
��
���
���
���
���
���
�������������������
��
�
�
�
�
�
��
��
��
��
���
���������
0��,��/1
2���3�����
����
����
����
���
����
����
���
���
��
���
��
� �� �� �� �� � �
0��,�% �.%���&���4�
:�!�&�0��.�
��!�����!�%�88��&:�!�&� ;<��
%���*�,�����#�#��=�����2 �2
:����/���
(�>��� ���2�����
�)�
�)�
�)�
�
�)�
�)�
�)�
�)�
�� �� �� �� �� �� �� �� � � � � �
146 The Open Atmospheric Science Journal, 2009, Volume 3 P.W. Chan
Besides windshear alerting, a number of products has been developed based on the wind and backscattered power data from the LIDAR, such as turbulence intensity distribution, 2D and 3D wind field retrievals in the airport area, visibility map and mixing height monitoring tool. These products would change from research mode into real time operational data in the future, assisting the aviation weather forecaster in the monitoring of the weather conditions at HKIA. Other applications of the LIDAR, such as cloud amount estimation and cloud base height computation from vertical scans, would also be explored.
ACKNOWLEDGEMENT
The authors would like to thank Dr. A.Y.S. Cheng and Mr. R.L.M. Chan for developing the algorithm of LIDAR-based visibility map when they worked in the City University of Hong Kong between 2004 and 2006. Part of Section 3, Figs. (2, 3) are reprinted with permission from the American Meteorological Society.
REFERENCES
[1] Wu KC, Chan PW, Shun CM. Performance of a Doppler LIDAR in
an operational environment. 13th International Symposium for the Advancement of Boundary Layer Remote Sensing 2006.
[2] Shun CM, Chan PW. Applications of an infrared Doppler LIDAR in detection of windshear, J Atmos Ocean Technol 2007; 25: 637-
55. [3] Chan PW, Shun CM, Wu KC. Operational LIDAR-based system
for automatic windshear alerting at the Hong Kong International
Airport. 12th Conference on Aviation, Range, and Aerospace
Meteorology. Am Meteorol Soc 2006. [4] Chan PW, Kuo ML. Automatic LIDAR windshear detection
algorithm - a refinement. 14th Coherent Laser Radar Conference 2007.
[5] Woodfield AA, Woods JF. Worldwide experience of windshear during 1981-1982. AGARD Flight Mechanics Panel Conference on
‘Flight Mechanics and system design lessons from Operational Experience’, AGARD CP No. 347, 1983.
[6] Chan PW. Generation of eddy dissipation rate map at the Hong Kong International Airport based on Doppler LIDAR data. 12th
Conference on Aviation, Range, and Aerospace Meteorology, Am Meteorol Soc 2006.
[7] Kwong KM, Chan PW. LIDAR-based turbulence intensity calculation along glide paths. 14th Coherent Laser Radar
Conference, 2007. [8] Frehlich RG, Yannick M, Michael LJ, Ben B, Robert S.
Measurements of boundary layer profiles in an urban environment, J Appl Meteorol Clim 2006; 45: 821-37.
[9] Chan PW, Shao AM. Depiction of complex airflow near Hong Kong International Airport using a Doppler LIDAR with a two-
dimensional wind retrieval technique. Meteorol Zeitschrift 2007; 16: 491-504.
[10] Xu X, Chan PW. Retrieval of 3D wind field from LIDAR velocity data. 14th Coherent Laser Radar Conference 2007.
[11] Chan LM, Chan PW, Cheng YS. Generation of visibility map at the Hong Kong International Airport (HKIA) using LIDAR data. 3rd
Symposium on Lidar Atmospheric Applications, Am Meteorol Soc 2007.
[12] Chan RLM, Lee OSM, Cheng AYS. Diurnal variation of mixing height in Hong Kong. Reviewed and revised papers presented at
the 23rd International Laser Radar Conference 2006; pp. 737-40. [13] Marsik FJ, Fischer KW, McDonald TD, Samson PJ. Comparison of
methods for estimating mixing layer height used during the 1992 Atlanta field initiative. J Appl Meteorol 1995; 34: 1802-14.
Received: March 18, 2009 Revised: April 24, 2009 Accepted: May 4, 2009
© P.W. Chan; Licensee Bentham Open.
This is an open access article licensed under the terms of the Creative Commons Attribution Non-Commercial License (http://creativecommons.org/licenses/by-nc/3.0/) which permits unrestricted, non-commercial use, distribution and reproduction in any medium, provided the work is properly cited.