Embed Size (px)
Citation preview
© 2011 Wojcinski et al, publisher and licensee Dove Medical Press Ltd. This is an Open Access article which permits unrestricted noncommercial use, provided the original work is properly cited.
International Journal of Women’s Health 2011:3 337–346
International Journal of Women’s Health Dovepress
submit your manuscript | www.dovepress.com
Dovepress 337
O r I g I n A L r e s e A r c H
open access to scientific and medical research
Open Access Full Text Article
http://dx.doi.org/10.2147/IJWH.S23918
The Automated Breast Volume scanner (ABVs): initial experiences in lesion detection compared with conventional handheld B-mode ultrasound: a pilot study of 50 cases
sebastian Wojcinski1
Andre Farrokh1
Ursula Hille2
Jakub Wiskirchen3
samuel gyapong1
Amr A soliman1,4
Friedrich Degenhardt1
Peter Hillemanns2
1Department of OB/gYn, Franziskus Hospital, Bielefeld, germany; 2Department of OB/gYn, Hannover Medical school, Hannover, germany; 3Department of radiology, Franziskus Hospital, Bielefeld, germany; 4Department of OB/gYn, Faculty of Medicine, University of Alexandria, Alexandria, egypt
correspondence: sebastian Wojcinski Franziskus Hospital, Department of OB/gYn, Kisker str 27, 33615 Bielefeld, germany Tel +49 521 589 1501 Fax +49 521 589 1504 email [email protected]
Abstract: The idea of an automated whole breast ultrasound was developed three decades ago.
We present our initial experiences with the latest technical advance in this technique, the automated
breast volume scanner (ABVS) ACUSON S2000TM. Volume data sets were collected from 50
patients and a database containing 23 women with no detectable lesions in conventional ultrasound
(BI-RADS®-US 1), 13 women with clearly benign lesions (BI-RADS®-US 2), and 14 women with
known breast cancer (BI-RADS®-US 5) was created. An independent examiner evaluated the ABVS
data on a separate workstation without any prior knowledge of the patients’ histories. The diagnostic
accuracy for the experimental ABVS was 66.0% (95% confidence interval [CI]: 52.9–79.1). The
independent examiner detected all breast cancers in the volume data resulting in a calculated sensi-
tivity of 100% in the described setting (95% CI: 73.2%–100%). After the ABVS examination, there
were a high number of requests for second-look ultrasounds in 47% (95% CI: 30.9–63.5) of the
healthy women (with either a clearly benign lesion or no breast lesions at all in conventional handheld
ultrasound). Therefore, the specificity remained at 52.8% (95% CI: 35.7–69.2). When comparing
the concordance of the ABVS with the gold standard (conventional handheld ultrasound), Cohen’s
Kappa value as an estimation of the inter-rater reliability was κ = 0.37, indicating fair agreement.
In conclusion, the ABVS must still be regarded as an experimental technique for breast ultrasound,
which definitely needs to undergo further evaluation studies.
Keywords: breast cancer, automated breast ultrasound, automated breast volume scanner,
ABVS
IntroductionBreast ultrasound is a commonly accepted and reliable diagnostic method for women
with clinically or radiologically suspicious breast lesions.1 Although it is not estab-
lished as a routine part of screening programs, bilateral whole breast ultrasound has
even demonstrated diagnostic advantages in screening asymptomatic women.2–6 Breast
ultrasound has been performed for more than 50 years.7,8 Conventional handheld
ultrasound (HHUS) is the gold standard for performing the examination. Obviously,
sonography is an examiner-dependent method and the examiner has to be present at
the time of image acquisition.
The concept of automated breast ultrasound dates back to the 1970s when the first
applicable systems were reported by Maturo et al.9 In the current report we present our
initial experiences with the latest technical advance in automated breast ultrasound,
the Automated Breast Volume Scanner (ACUSON S2000TM ABVS; Siemens Medical
Video abstract
Point your SmartPhone at the code above. If you have a QR code reader the video abstract will appear. Or use:
http://dvpr.es/wojcinski
International Journal of Women’s Health 2011:3submit your manuscript | www.dovepress.com
Dovepress
Dovepress
338
Wojcinski et al
Solutions, Inc, Mountain View, CA). This system can be
operated by an assistant medical technician or radiographer.
The ABVS acquires a whole series of consecutive B-mode
pictures and reconstructs 3D data sets of the entire breast
volume. These data can be sent to a separate workstation to
be independently analyzed by a specialist.
We evaluated whether or not breast lesions, previously
detected by means of conventional ultrasound, could also be
detected and correctly classified by an independent examiner
who used only ABVS data. To the best of our knowledge, this
is one of the first descriptive studies dealing with the clinical
application of the ABVS system.
Materials and methodsgeneral design and creation of the patient databaseOur study was conducted at the Breast Cancer Center of
Franziskus Hospital in Bielefeld, Germany, between March
2010 and May 2010. The responsible ethical committee did
not require additional approval for this noninterventional
study design. All examinations were performed using the
Siemens ACUSON S2000TM ultrasound system (Siemens
Medical Solutions, Inc, Mountain View, CA).
The study cohort was recruited from patients who
attended the outpatient service of our breast cancer center.
The patients were referred to our clinic due to specific diag-
nostic queries such as palpable breast lesions, breast pain,
suspicious mammograms, and intensified screening in high-
risk populations. All patients received conventional HHUS as
the standard diagnostic method and subsequent examinations
whenever necessary. For each patient, the B-mode ultrasound
pictures were categorized according to the Breast Imaging
Reporting and Data System criteria of the American College
of Radiology (ACR BI-RADS®-US).10
Patients with a final categorization of BI-RADS®-US 1,
2, and 5 in the conventional ultrasound examination were
regarded as being suitable for our study. We excluded patients
with BI-RADS®-US 0, 3 and 4 lesions as the focus of our
study was on the bare detection of clearly benign and clearly
malignant lesions and not on the evaluation of questionable
lesions.
Patients with a history of breast surgery, bra cup sizes
greater than D, inflammatory conditions of the breast, and
skin disorders were also excluded.
Patients who met the inclusion criteria and who agreed
to be enrolled in our study signed an informed consent
form and subsequently received the additional ABVS
examination.
Thus, we created a database containing 50 patients exhib-
iting BI-RADS®-US 1, 2, and 5 findings in conventional
examinations. In our cohort the age ranged from 32 to 72
years (median 52 years). According to the BI-RADS®-US
categorization, 46% (n = 23) of our cases were assigned as
BI-RADS®-US 1, 26% (n = 13) had BI-RADS®-US 2 lesions,
and 28% (n = 14) of the cases had BI-RADS®-US 5 lesions.
All cases of BI-RADS®-US 5 were histologically confirmed
after the study setting was completed.
The mean tumor size for the malignant lesions was
23.4 mm (range 13 to 55).
After anonymization, the ABVS database was then
available for evaluation by an independent second examiner.
We compared the performance of the ABVS (experimental
method) to the HHUS (gold standard).
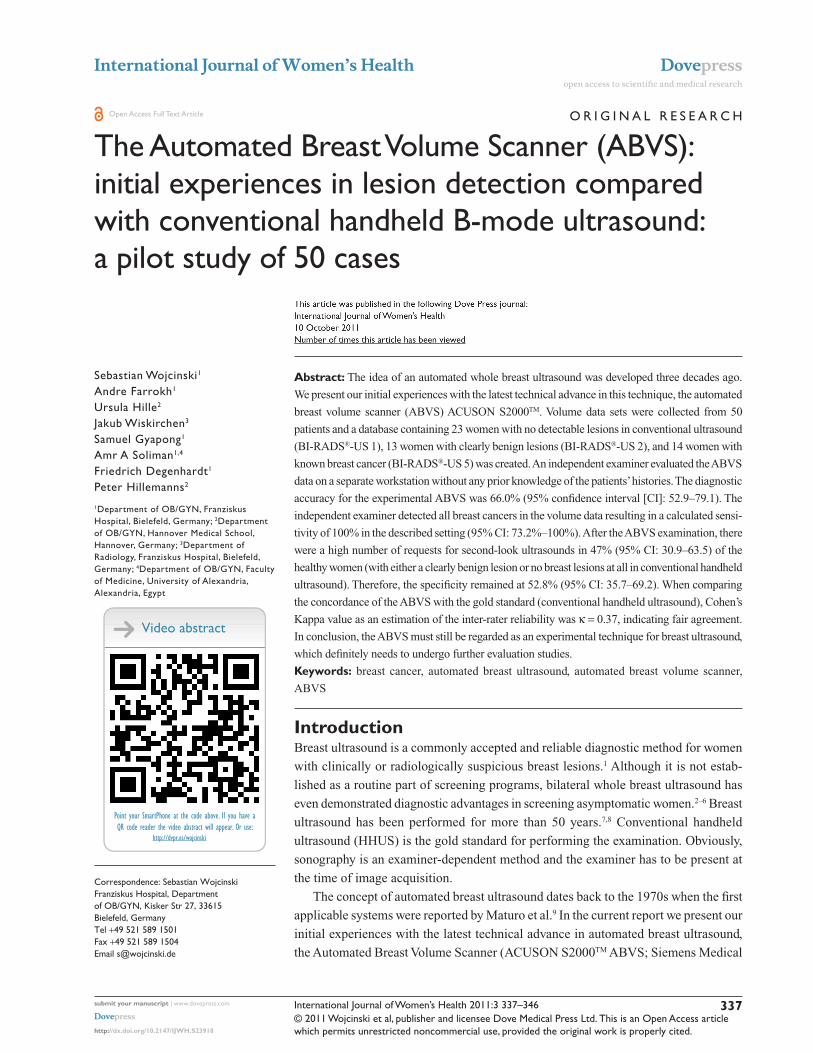
Technical background of the ABVsThe ACUSON S2000TM ABVS is an ultrasound system that
automatically surveys and acquires full-field volumes of the
breast (Figure 1).
For automated scanning, we used the integrated Siemens
14L5BV linear transducer (14 MHz, 15.4 cm) with 768
piezoelectric elements. These images have a depth of up to
6 cm. In the process of automated scanning, the transducer
covers a distance of 16.8 cm, acquiring 318 high-resolution
slices for post-processing. Therefore, the maximum volume
is 1552.3 cm³ and the slice thickness is about 0.5 mm.
In order to optimize the ABVS results there is a wide range
of known imaging modes including tissue harmonic imaging
(THI) and Advanced SieClearTM spatial compounding and
Dynamic TCETM (tissue contrast enhancement) technology,
Figure 1 Installation of the AcUsOn s2000TM ABVs ultrasound system. On the left-hand side is the AcUsOn s2000TM machine, on the right-hand side is the 14L5BV volume transducer attached to a mechanical arm.
International Journal of Women’s Health 2011:3 submit your manuscript | www.dovepress.com
Dovepress
Dovepress
339
The automated breast volume scanner
as well as new processing algorithms for nipple shadow and
reverberation artifacts that are automatically applied when
using the ABVS. The Reverberation Removal Algorithm
processes the 3D data and determines whether tissue contact
is present and where it is not. The data corresponding to the
area with no tissue contact are removed. This is intended to
suppress the reverberation artifacts from the noncontact areas.
The adaptive Nipple Shadow Reduction Tool analyzes data on
a case-by-case basis and is thought to enhance the structures
in the retro-areolar area and to improve the visualization of
this important region. Finally, a Gain Collection Algorithm
analyzes the 3D data and adjusts for the brightness variation
artifacts caused by transducer channel-to-channel variations.
After acquisition, the data are automatically sent from the
ultrasound system to a breast ultrasound review workstation,
which provides comprehensive analysis and manipulation of
the 3D data: the workstation presents images through multi-
planar reconstruction (MPR, Figure 2). All volume data sets
can also be viewed in multiple orientations, including the
standard transverse, sagittal, coronal, radial, and anti-radial
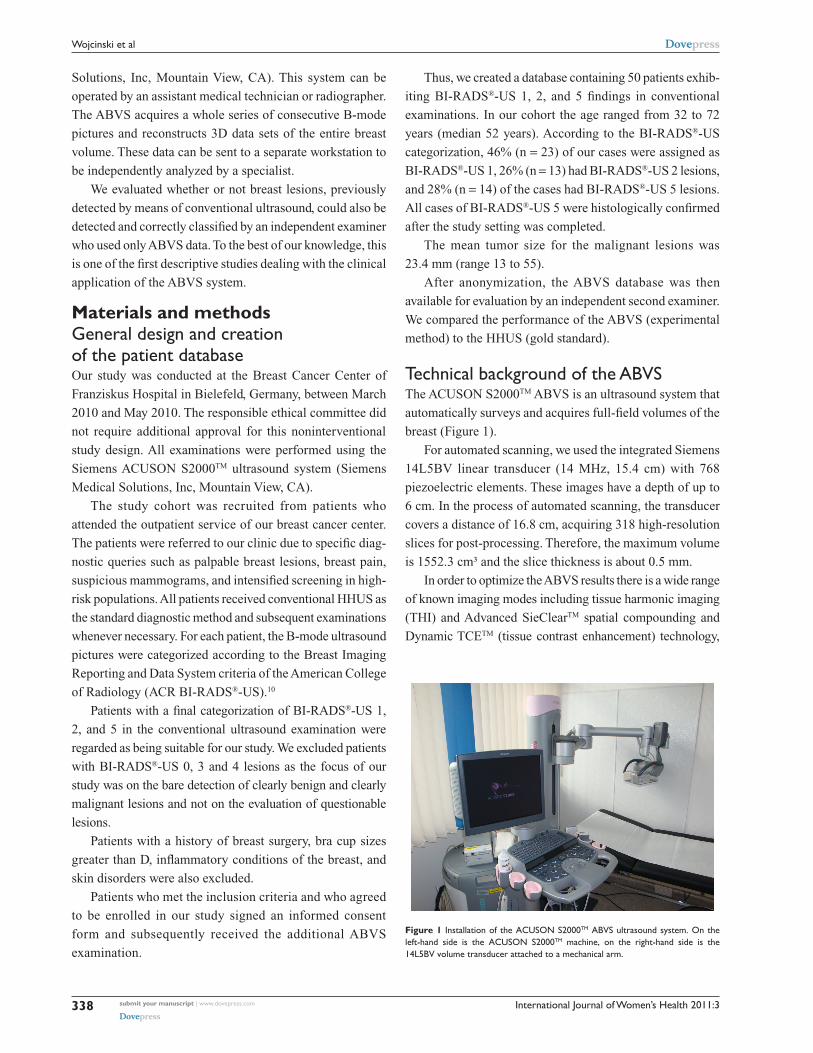
planes, as well as any other user-defined plane (Figure 3).
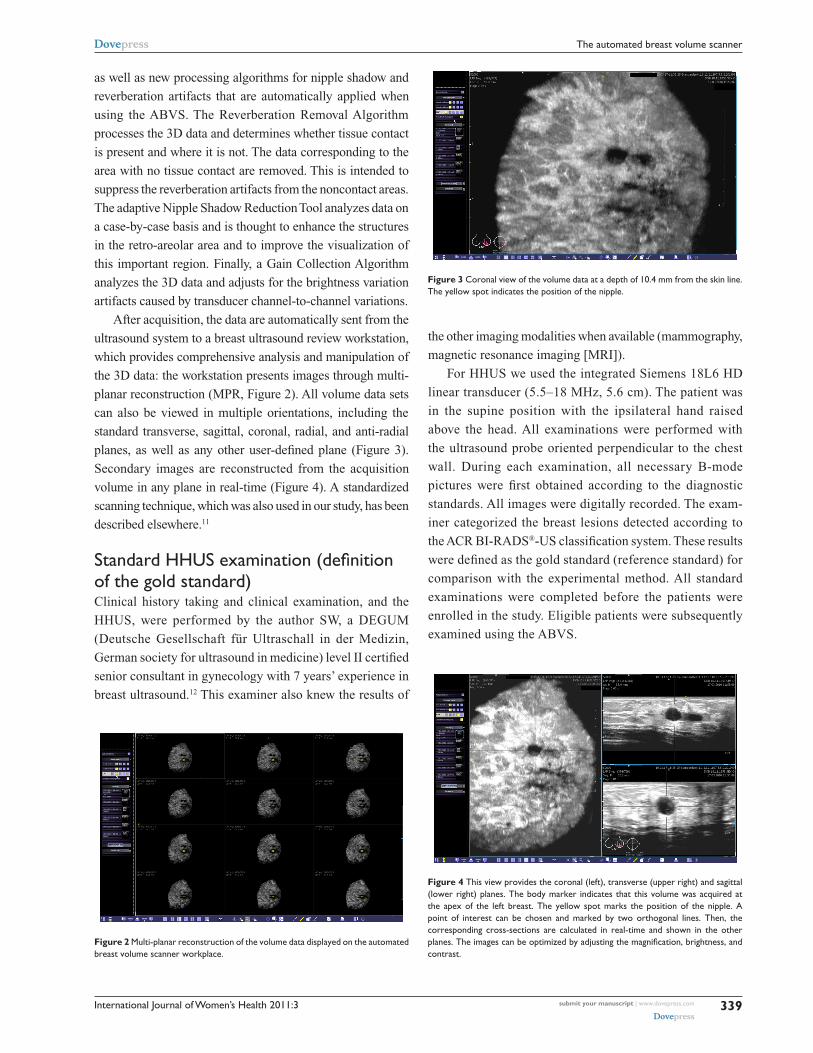
Secondary images are reconstructed from the acquisition
volume in any plane in real-time (Figure 4). A standardized
scanning technique, which was also used in our study, has been
described elsewhere.11
Standard HHUS examination (definition of the gold standard)Clinical history taking and clinical examination, and the
HHUS, were performed by the author SW, a DEGUM
(Deutsche Gesellschaft für Ultraschall in der Medizin,
German society for ultrasound in medicine) level II certified
senior consultant in gynecology with 7 years’ experience in
breast ultrasound.12 This examiner also knew the results of
the other imaging modalities when available (mammography,
magnetic resonance imaging [MRI]).
For HHUS we used the integrated Siemens 18L6 HD
linear transducer (5.5–18 MHz, 5.6 cm). The patient was
in the supine position with the ipsilateral hand raised
above the head. All examinations were performed with
the ultrasound probe oriented perpendicular to the chest
wall. During each examination, all necessary B-mode
pictures were first obtained according to the diagnostic
standards. All images were digitally recorded. The exam-
iner categorized the breast lesions detected according to
the ACR BI-RADS®-US classification system. These results
were defined as the gold standard (reference standard) for
comparison with the experimental method. All standard
examinations were completed before the patients were
enrolled in the study. Eligible patients were subsequently
examined using the ABVS.
Figure 2 Multi-planar reconstruction of the volume data displayed on the automated breast volume scanner workplace.
Figure 3 coronal view of the volume data at a depth of 10.4 mm from the skin line. The yellow spot indicates the position of the nipple.
Figure 4 This view provides the coronal (left), transverse (upper right) and sagittal (lower right) planes. The body marker indicates that this volume was acquired at the apex of the left breast. The yellow spot marks the position of the nipple. A point of interest can be chosen and marked by two orthogonal lines. Then, the corresponding cross-sections are calculated in real-time and shown in the other planes. The images can be optimized by adjusting the magnification, brightness, and contrast.
International Journal of Women’s Health 2011:3submit your manuscript | www.dovepress.com
Dovepress
Dovepress
340
Wojcinski et al
Acquisition of the ABVs dataThe experimental ABVS examination was also performed
by the author, SW. For the ABVS examination, the patient
was placed in the same position as for the HHUS. A special
ultrasound lotion that provides optimal imaging results in
combination with the ABVS was applied to the skin instead
of the usual ultrasound gel (Polysonic Ultrasound Lotion,
Parker Laboratories, Inc, Fairfield, NJ).
According to other studies, we used the bra cup size to
describe the size of the breast.13 Bra cup size is determined
by measuring the horizontal chest circumference in the infra-
mammary fold, adding 5 inches (12.7 cm) and subtracting
the horizontal chest circumference at the fullest part of the
breasts. A difference of 1 inch (2.54 cm) is equivalent to an
A cup, 2 inches a B cup, and so on.14 We did not perform
this measurement in the current study, but instead asked the
patients for their bra cup size.
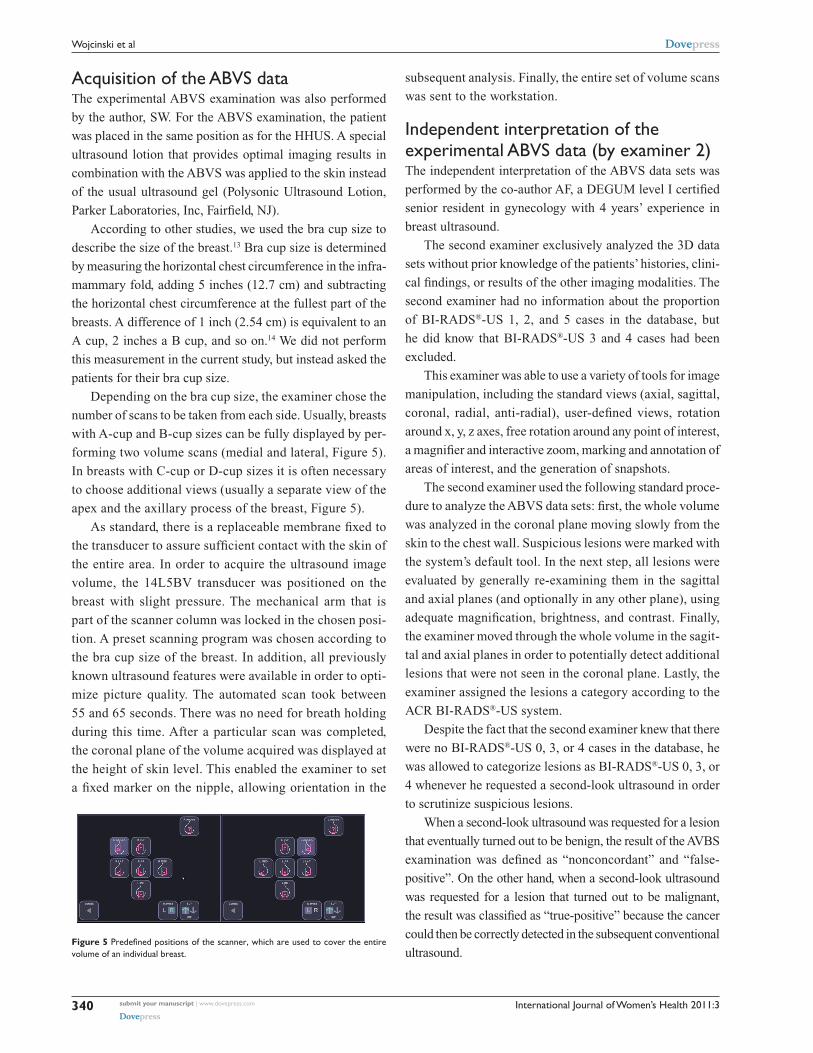
Depending on the bra cup size, the examiner chose the
number of scans to be taken from each side. Usually, breasts
with A-cup and B-cup sizes can be fully displayed by per-
forming two volume scans (medial and lateral, Figure 5).
In breasts with C-cup or D-cup sizes it is often necessary
to choose additional views (usually a separate view of the
apex and the axillary process of the breast, Figure 5).
As standard, there is a replaceable membrane fixed to
the transducer to assure sufficient contact with the skin of
the entire area. In order to acquire the ultrasound image
volume, the 14L5BV transducer was positioned on the
breast with slight pressure. The mechanical arm that is
part of the scanner column was locked in the chosen posi-
tion. A preset scanning program was chosen according to
the bra cup size of the breast. In addition, all previously
known ultrasound features were available in order to opti-
mize picture quality. The automated scan took between
55 and 65 seconds. There was no need for breath holding
during this time. After a particular scan was completed,
the coronal plane of the volume acquired was displayed at
the height of skin level. This enabled the examiner to set
a fixed marker on the nipple, allowing orientation in the
subsequent analysis. Finally, the entire set of volume scans
was sent to the workstation.
Independent interpretation of the experimental ABVs data (by examiner 2)The independent interpretation of the ABVS data sets was
performed by the co-author AF, a DEGUM level I certified
senior resident in gynecology with 4 years’ experience in
breast ultrasound.
The second examiner exclusively analyzed the 3D data
sets without prior knowledge of the patients’ histories, clini-
cal findings, or results of the other imaging modalities. The
second examiner had no information about the proportion
of BI-RADS®-US 1, 2, and 5 cases in the database, but
he did know that BI-RADS®-US 3 and 4 cases had been
excluded.
This examiner was able to use a variety of tools for image
manipulation, including the standard views (axial, sagittal,
coronal, radial, anti-radial), user-defined views, rotation
around x, y, z axes, free rotation around any point of interest,
a magnifier and interactive zoom, marking and annotation of
areas of interest, and the generation of snapshots.
The second examiner used the following standard proce-
dure to analyze the ABVS data sets: first, the whole volume
was analyzed in the coronal plane moving slowly from the
skin to the chest wall. Suspicious lesions were marked with
the system’s default tool. In the next step, all lesions were
evaluated by generally re-examining them in the sagittal
and axial planes (and optionally in any other plane), using
adequate magnification, brightness, and contrast. Finally,
the examiner moved through the whole volume in the sagit-
tal and axial planes in order to potentially detect additional
lesions that were not seen in the coronal plane. Lastly, the
examiner assigned the lesions a category according to the
ACR BI-RADS®-US system.
Despite the fact that the second examiner knew that there
were no BI-RADS®-US 0, 3, or 4 cases in the database, he
was allowed to categorize lesions as BI-RADS®-US 0, 3, or
4 whenever he requested a second-look ultrasound in order
to scrutinize suspicious lesions.
When a second-look ultrasound was requested for a lesion
that eventually turned out to be benign, the result of the AVBS
examination was defined as “nonconcordant” and “false-
positive”. On the other hand, when a second-look ultrasound
was requested for a lesion that turned out to be malignant,
the result was classified as “true-positive” because the cancer
could then be correctly detected in the subsequent conventional
ultrasound.Figure 5 Predefined positions of the scanner, which are used to cover the entire volume of an individual breast.
International Journal of Women’s Health 2011:3 submit your manuscript | www.dovepress.com
Dovepress
Dovepress
341
The automated breast volume scanner
Ultrasound quality assuranceDue to the national regulating authority statutes, all breast
ultrasound systems have to fulfill basic technical requirements
and undergo regular quality control measures.15 The technical
requirements include a linear transducer covering a least
38 mm, an ultrasound frequency $7 MHz, an adjustable
digital focus, a time gain control signal generator, a frame rate
$15 fps, an image depth $6 cm, the detection of a returning
echo $ 60 dB below the transmitted signal, and at least 8-bit
processing of the images.
In order to guarantee long-lasting performance of the
transducer and conformance of the whole device with the
standards, a compliance test is mandatory when setting up a
new ultrasound system and a consistency inspection is needed
every 4 years. All of the abovementioned standards applied
to the equipment used in our study.
statistical analysisThe software package SPSS Statistics (v 17.0; SPSS, Inc,
Chicago, IL) was used for the statistical analysis. The results
obtained from the experimental method (ABVS) were com-
pared with the results from the gold standard (HHUS). The
data were analyzed using descriptive statistics. The diagnostic
sensitivity and specificity, as well as the accuracy of the ABVS,
were calculated based on the Bayesian theorem using Fisher’s
exact test.
The Chi-square test was used to assess the correlation
between the expected and the observed rate of second-look
ultrasounds.
Calculation of the concordance with the BI-RADS®
classification was based on Cohen’s Kappa test.16 Although
both examiners (for both HHUS and ABVS) had differ-
ent degrees of information about the patients, this test can
provide a satisfactory estimation of the true inter-rater
reliability. We used the magnitude guidelines published by
Landis and Koch, who characterized the values of κ , 0 as
indicating no agreement and κ 0–0.20 slight, κ 0.21–0.40
fair, κ 0.41–0.60 moderate, κ 0.61–0.80 substantial, and κ
0.81–1 as almost perfect agreement.17
Statistical significance was assumed at P , 0.05 for all
tests.
ResultsAccuracy, sensitivity, and specificity of the ABVsThe sensitivity of the ABVS in detecting malignant lesions
ranged from 73.2 to 100% (95% CI), and all of the 14
cancer patients were detected by the second examiner.
The diagnostic accuracy of the experimental ABVS was
66.0% (95% CI: 52.9–79.1). The specificity seemed to
be quite low at 52.8% (95% CI: 35.7–69.2) as there was
a high number of requests for second-look ultrasounds
after the ABVS and these cases are, as a matter of fact,
false-positive if there is no cancer. These results must be
carefully interpreted, bearing in mind that the experimental
ABVS was performed on a subset of patients with results
defined by the HHUS.
rate of second-look ultrasoundsWe expected 14 (28%) requests for second-look ultrasound
after the ABVS examination as there were 14 cases of
BI-RADS®-US 5 lesions. We did not expect requests for
the other 36 cases (BI-RADS®-US 1 or 2 lesions). Nev-
ertheless, the observed rate of second-look ultrasounds
was significantly high, totaling 62% (95% CI: 48.6–75.5,
P , 10−8).
Regarding the subgroups, there was a request for a
second-look ultrasound in 61.5% (95% CI: 35.1–88.0) of
the women with benign lesions and even in 39.1% (95%
CI: 19.2–59.1) of the women with no breast lesions at all.
Overall, examiner 2 requested second-look ultrasounds
for all 14 cases of breast cancer but also in 17 of the 36
controls (47% [95% CI: 30.9–63.5]). These data are shown
in Table 1.
Table 1 Agreement between examiner 1 (gold standard) and examiner 2 (experimental ABVs data interpretation) focusing on the correct clinical decision of whether the patient should undergo a control ultrasound due to a suspicious finding or whether the patient should be defined as healthy as there is no suspicious lesion
Classification by examiner 1using all information and HHUS (gold standard)
Total
Disease - (BI-RADS 1, 2) Disease + (BI-RADS 5)
Classification by examiner 2 analyzing the ABVS data (experimental method)ABVs − (BI-rADs 1, 2) 19 0 19
ABVs + (BI-rADs 0, 3, 4, 5) 17 14 31Total 36 14 50
Abbreviations: ABVs, automated breast volume scanner; HHUs, handheld ultrasound.
International Journal of Women’s Health 2011:3submit your manuscript | www.dovepress.com
Dovepress
Dovepress
342
Wojcinski et al
estimation of the inter-rater reliabilityWe compared the results of the BI-RADS®-US classification by
the second examiner, who only had access to the ABVS data but
not to any other information, with the results of the first examiner
(HHUS, which can be seen as the gold standard). Cohen’s Kappa
value as an estimation of the inter-rater reliability regarding this
comparison was κ = 0.37 (95% CI: 0.19–0.55), reaching an
agreement that can be described as fair between both modalities.
The detailed results are shown in Table 2.
Diagnostic performance in the subgroup of BI-rADs®-Us 5 lesionsFocusing on the 14 lesions that were classified as BI-RADS®-US
5 in conventional ultrasound, we obtained the following
results: eight out of 14 lesions (57%) were correctly classified
as BI-RADS®-US 5, and six out of 14 lesions were classi-
fied as BI-RADS®-US 0, 3 or 4, resulting in a second-look
ultrasound being requested by examiner 2. Therefore, none of
the carcinomas would have been missed by the ABVS, as all
patients were scheduled for further examinations and none of
the 14 patients was classified as BI-RADS®-US 1 or 2, which
would have resulted in a delayed diagnosis.
Diagnostic performance in the subgroup of BI-rADs®-Us 2 lesionsWith respect to the BI-RADS®-US 2 lesions (n = 13), we
performed a test identical to the BI-RADS®-US 5 lesion test.
Only four (30.8%) of these lesions were correctly classified as
BI-RADS®-US 2. One lesion was missed and the breast was
therefore classified BI-RADS®-US 1. A second-look ultrasound
was requested in eight cases (61.5% [95% CI: 35.1–88.0]) as
examiner 2 either diagnosed a questionable lesion (six cases)
or was suspicious of a malignant lesion (2 cases).
Diagnostic performance in the subgroup of BI-rADs®-Us 1 breastsFurthermore, we analyzed the dataset of BI-RADS®-US 1
breasts, which exhibited no verifiable lesions (n = 23); 13
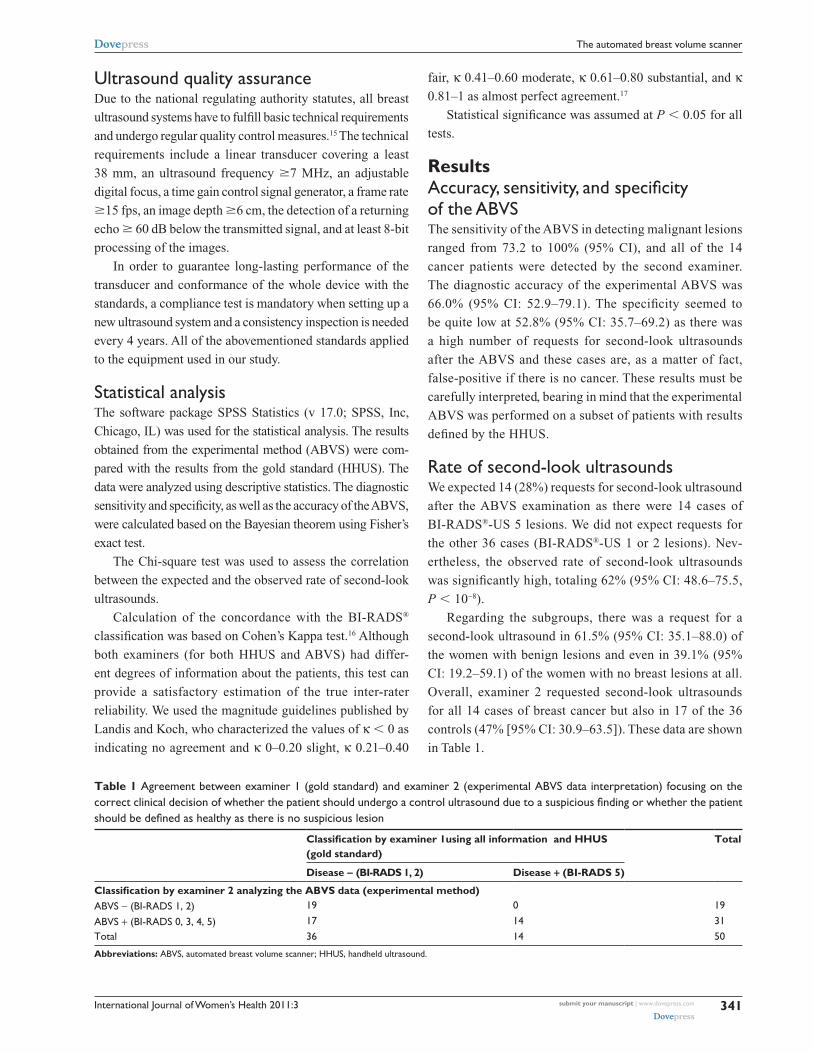
(56.5%) were correctly described as BI-RADS®-US 1. In one
case, examiner 2 suspected a benign lesion (BI-RADS®-US
2, Figure 6). There were no category BI-RADS®-US 5
diagnoses, but nine (39.1% [95% CI: 19.2–59.1]) second-
look ultrasounds were requested due to questionable lesions
categorized as BI-RADS®-US 0, 3 or 4.
experiences in clinical applicabilityThe standard examinations, which included history taking,
clinical examination, and HHUS, took about 20–30 minutes
on average per patient. An additional 8–10 minutes was
needed to acquire the ABVS data sets. This extra time period
included informing the patient about the procedure, applying
the ultrasound lotion, and acquiring two to four image sets
per breast. Regarding the size of the breast, there was no
difficulty in acquiring the whole breast volume in women
with bra cup sizes A to D, but there were noticeable deficits
in women with larger breasts. Interpretation times were about
6–10 minutes per patient. However, excessive time had to be
spent on the second-look HHUS, as mentioned above.
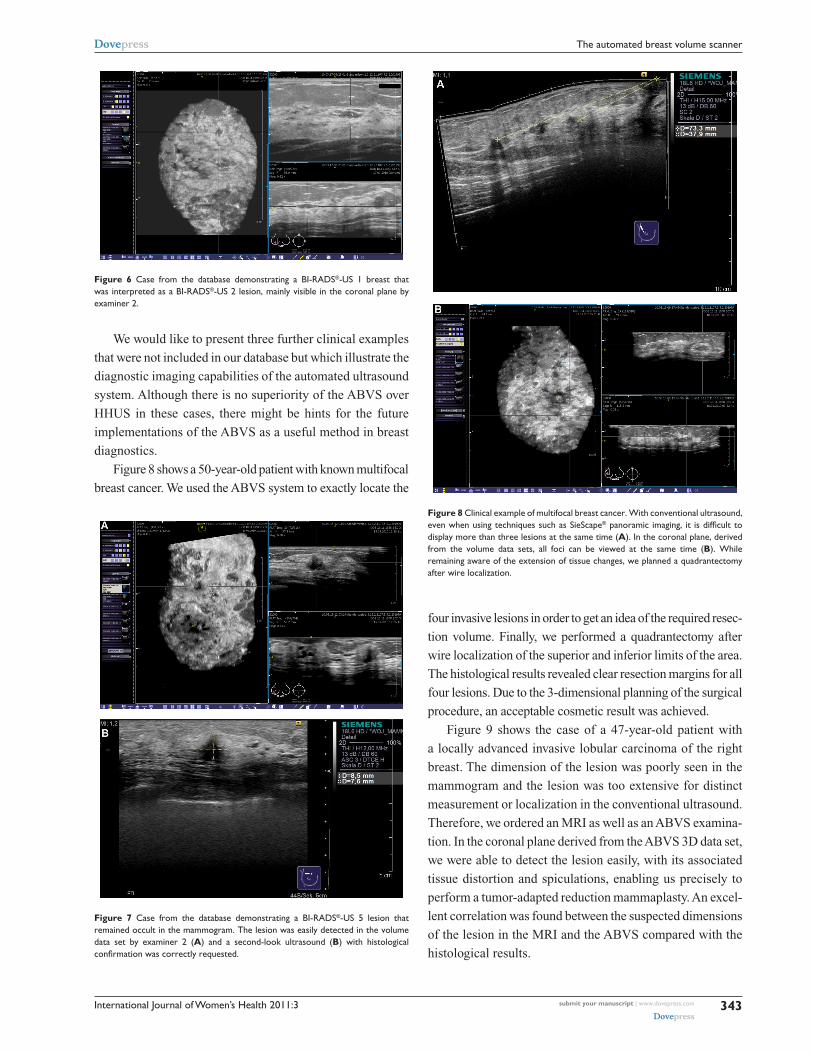
clinical examplesFigure 7 shows a case from the database that was correctly clas-
sified as BI-RADS®-US 5 (Figure 7). The 53-year-old patient
was asymptomatic and had had a screening mammogram
6 months earlier with no evidence of a malignant breast lesion.
The breast density had been categorized as ACR III. The patient
reported menopause one year earlier. She had given birth to
three children (first child at the age of 20 years), but there was
no history of breast feeding. Her body mass index was 21.4 at
the time of presentation and her bra cup size was B. The patient
reported no hormone replacement therapy and no other relevant
intake of medications. There was no family history of cancer.
The patient was sent to our breast cancer center because of a
suspicious finding in a conventional breast ultrasound that had
been performed for screening purposes. The lesion remained
occult in the directly repeated mammogram. The occult lesion
could also be easily detected by the ABVS system.
Table 2 Agreement between examiner 1 (gold standard) and examiner 2 (experimental ABVs data interpretation) focusing on the correct classification according to the ACR BI-RADS®-Us system
Classification by examiner 1 using all information and HHUS (reference standard) Total
BI-RADS 1 BI-RADS 2 BI-RADS 0, 3, 4 (excluded) BI-RADS 5
Classification by examiner 2 analyzing the ABVS data (experimental method)BI-rADs 1 13 1 0 0 14BI-rADs 2 1 4 0 0 5BI-rADs 0, 3, 4 9 6 0 6 21BI-rADs 5 0 2 0 8 10Total 23 13 0 14 50
Abbreviations: ABVs, automated breast volume scanner; HHUs, handheld ultrasound.
International Journal of Women’s Health 2011:3 submit your manuscript | www.dovepress.com
Dovepress
Dovepress
343
The automated breast volume scanner
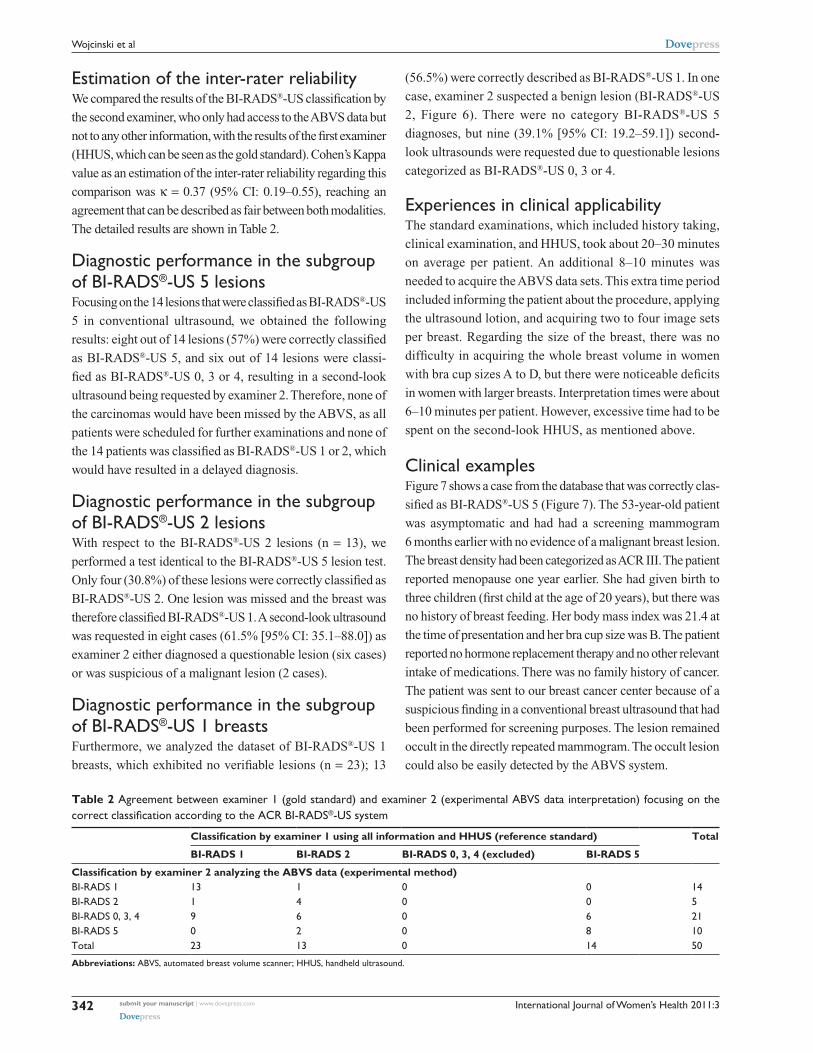
four invasive lesions in order to get an idea of the required resec-
tion volume. Finally, we performed a quadrantectomy after
wire localization of the superior and inferior limits of the area.
The histological results revealed clear resection margins for all
four lesions. Due to the 3-dimensional planning of the surgical
procedure, an acceptable cosmetic result was achieved.
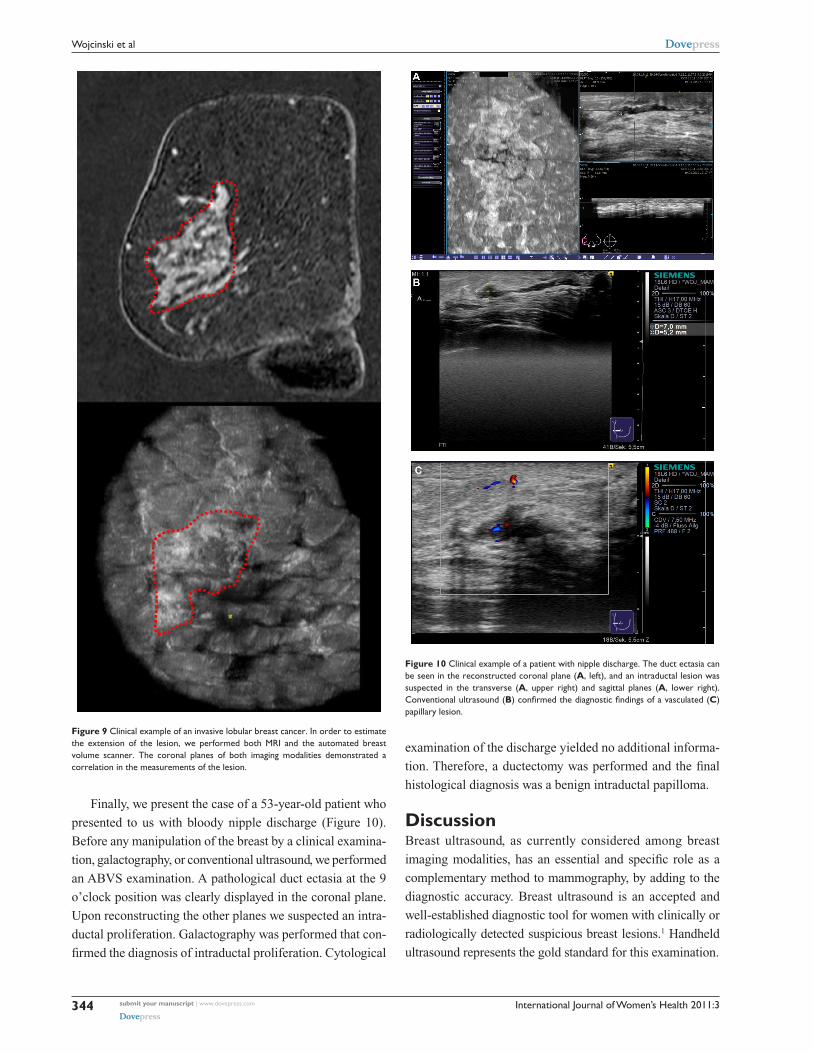
Figure 9 shows the case of a 47-year-old patient with
a locally advanced invasive lobular carcinoma of the right
breast. The dimension of the lesion was poorly seen in the
mammogram and the lesion was too extensive for distinct
measurement or localization in the conventional ultrasound.
Therefore, we ordered an MRI as well as an ABVS examina-
tion. In the coronal plane derived from the ABVS 3D data set,
we were able to detect the lesion easily, with its associated
tissue distortion and spiculations, enabling us precisely to
perform a tumor-adapted reduction mammaplasty. An excel-
lent correlation was found between the suspected dimensions
of the lesion in the MRI and the ABVS compared with the
histological results.
Figure 6 case from the database demonstrating a BI-rADs®-Us 1 breast that was interpreted as a BI-rADs®-Us 2 lesion, mainly visible in the coronal plane by examiner 2.
Figure 7 case from the database demonstrating a BI-rADs®-Us 5 lesion that remained occult in the mammogram. The lesion was easily detected in the volume data set by examiner 2 (A) and a second-look ultrasound (B) with histological confirmation was correctly requested.
We would like to present three further clinical examples
that were not included in our database but which illustrate the
diagnostic imaging capabilities of the automated ultrasound
system. Although there is no superiority of the ABVS over
HHUS in these cases, there might be hints for the future
implementations of the ABVS as a useful method in breast
diagnostics.
Figure 8 shows a 50-year-old patient with known multifocal
breast cancer. We used the ABVS system to exactly locate the
Figure 8 clinical example of multifocal breast cancer. With conventional ultrasound, even when using techniques such as siescape® panoramic imaging, it is difficult to display more than three lesions at the same time (A). In the coronal plane, derived from the volume data sets, all foci can be viewed at the same time (B). While remaining aware of the extension of tissue changes, we planned a quadrantectomy after wire localization.
International Journal of Women’s Health 2011:3submit your manuscript | www.dovepress.com
Dovepress
Dovepress
344
Wojcinski et al
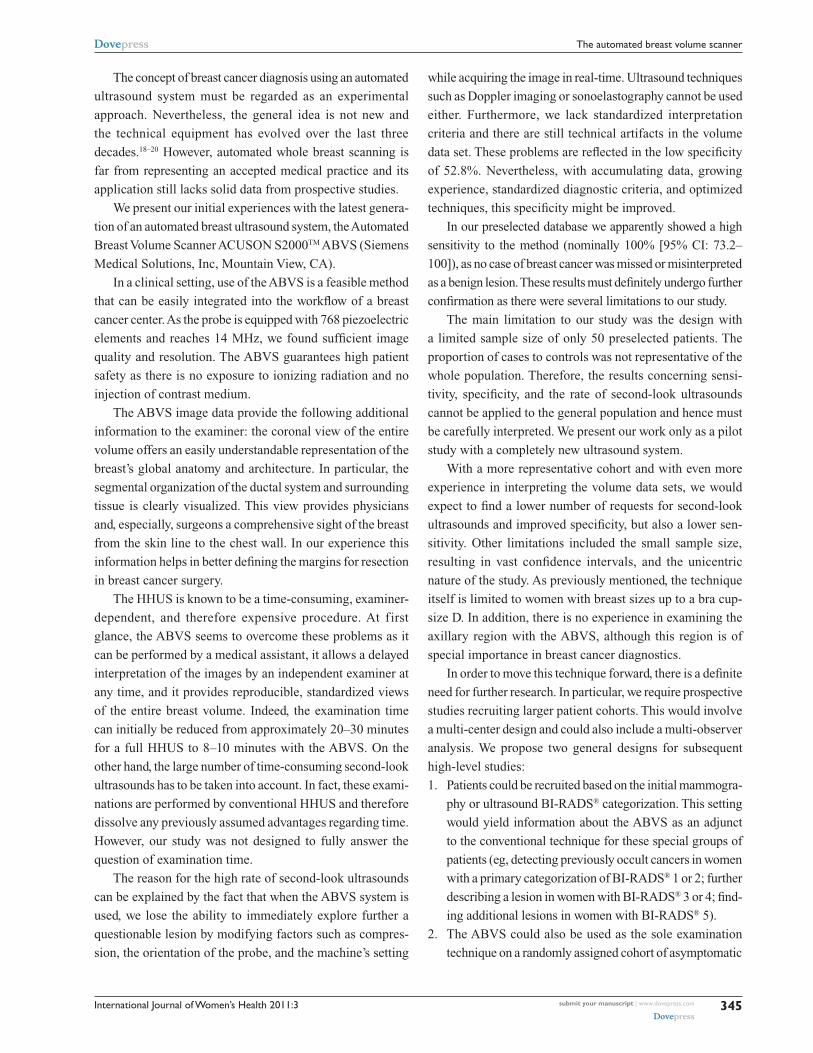
Finally, we present the case of a 53-year-old patient who
presented to us with bloody nipple discharge (Figure 10).
Before any manipulation of the breast by a clinical examina-
tion, galactography, or conventional ultrasound, we performed
an ABVS examination. A pathological duct ectasia at the 9
o’clock position was clearly displayed in the coronal plane.
Upon reconstructing the other planes we suspected an intra-
ductal proliferation. Galactography was performed that con-
firmed the diagnosis of intraductal proliferation. Cytological
examination of the discharge yielded no additional informa-
tion. Therefore, a ductectomy was performed and the final
histological diagnosis was a benign intraductal papilloma.
DiscussionBreast ultrasound, as currently considered among breast
imaging modalities, has an essential and specific role as a
complementary method to mammography, by adding to the
diagnostic accuracy. Breast ultrasound is an accepted and
well-established diagnostic tool for women with clinically or
radiologically detected suspicious breast lesions.1 Handheld
ultrasound represents the gold standard for this examination.
Figure 9 clinical example of an invasive lobular breast cancer. In order to estimate the extension of the lesion, we performed both MrI and the automated breast volume scanner. The coronal planes of both imaging modalities demonstrated a correlation in the measurements of the lesion.
Figure 10 clinical example of a patient with nipple discharge. The duct ectasia can be seen in the reconstructed coronal plane (A, left), and an intraductal lesion was suspected in the transverse (A, upper right) and sagittal planes (A, lower right). conventional ultrasound (B) confirmed the diagnostic findings of a vasculated (C) papillary lesion.
International Journal of Women’s Health 2011:3 submit your manuscript | www.dovepress.com
Dovepress
Dovepress
345
The automated breast volume scanner
The concept of breast cancer diagnosis using an automated
ultrasound system must be regarded as an experimental
approach. Nevertheless, the general idea is not new and
the technical equipment has evolved over the last three
decades.18–20 However, automated whole breast scanning is
far from representing an accepted medical practice and its
application still lacks solid data from prospective studies.
We present our initial experiences with the latest genera-
tion of an automated breast ultrasound system, the Automated
Breast Volume Scanner ACUSON S2000TM ABVS (Siemens
Medical Solutions, Inc, Mountain View, CA).
In a clinical setting, use of the ABVS is a feasible method
that can be easily integrated into the workflow of a breast
cancer center. As the probe is equipped with 768 piezoelectric
elements and reaches 14 MHz, we found sufficient image
quality and resolution. The ABVS guarantees high patient
safety as there is no exposure to ionizing radiation and no
injection of contrast medium.
The ABVS image data provide the following additional
information to the examiner: the coronal view of the entire
volume offers an easily understandable representation of the
breast’s global anatomy and architecture. In particular, the
segmental organization of the ductal system and surrounding
tissue is clearly visualized. This view provides physicians
and, especially, surgeons a comprehensive sight of the breast
from the skin line to the chest wall. In our experience this
information helps in better defining the margins for resection
in breast cancer surgery.
The HHUS is known to be a time-consuming, examiner-
dependent, and therefore expensive procedure. At first
glance, the ABVS seems to overcome these problems as it
can be performed by a medical assistant, it allows a delayed
interpretation of the images by an independent examiner at
any time, and it provides reproducible, standardized views
of the entire breast volume. Indeed, the examination time
can initially be reduced from approximately 20–30 minutes
for a full HHUS to 8–10 minutes with the ABVS. On the
other hand, the large number of time-consuming second-look
ultrasounds has to be taken into account. In fact, these exami-
nations are performed by conventional HHUS and therefore
dissolve any previously assumed advantages regarding time.
However, our study was not designed to fully answer the
question of examination time.
The reason for the high rate of second-look ultrasounds
can be explained by the fact that when the ABVS system is
used, we lose the ability to immediately explore further a
questionable lesion by modifying factors such as compres-
sion, the orientation of the probe, and the machine’s setting
while acquiring the image in real-time. Ultrasound techniques
such as Doppler imaging or sonoelastography cannot be used
either. Furthermore, we lack standardized interpretation
criteria and there are still technical artifacts in the volume
data set. These problems are reflected in the low specificity
of 52.8%. Nevertheless, with accumulating data, growing
experience, standardized diagnostic criteria, and optimized
techniques, this specificity might be improved.
In our preselected database we apparently showed a high
sensitivity to the method (nominally 100% [95% CI: 73.2–
100]), as no case of breast cancer was missed or misinterpreted
as a benign lesion. These results must definitely undergo further
confirmation as there were several limitations to our study.
The main limitation to our study was the design with
a limited sample size of only 50 preselected patients. The
proportion of cases to controls was not representative of the
whole population. Therefore, the results concerning sensi-
tivity, specificity, and the rate of second-look ultrasounds
cannot be applied to the general population and hence must
be carefully interpreted. We present our work only as a pilot
study with a completely new ultrasound system.
With a more representative cohort and with even more
experience in interpreting the volume data sets, we would
expect to find a lower number of requests for second-look
ultrasounds and improved specificity, but also a lower sen-
sitivity. Other limitations included the small sample size,
resulting in vast confidence intervals, and the unicentric
nature of the study. As previously mentioned, the technique
itself is limited to women with breast sizes up to a bra cup-
size D. In addition, there is no experience in examining the
axillary region with the ABVS, although this region is of
special importance in breast cancer diagnostics.
In order to move this technique forward, there is a definite
need for further research. In particular, we require prospective
studies recruiting larger patient cohorts. This would involve
a multi-center design and could also include a multi-observer
analysis. We propose two general designs for subsequent
high-level studies:
1. Patients could be recruited based on the initial mammogra-
phy or ultrasound BI-RADS® categorization. This setting
would yield information about the ABVS as an adjunct
to the conventional technique for these special groups of
patients (eg, detecting previously occult cancers in women
with a primary categorization of BI-RADS® 1 or 2; further
describing a lesion in women with BI-RADS® 3 or 4; find-
ing additional lesions in women with BI-RADS® 5).
2. The ABVS could also be used as the sole examination
technique on a randomly assigned cohort of asymptomatic
International Journal of Women’s Health
Publish your work in this journal
Submit your manuscript here: http://www.dovepress.com/international-journal-of-womens-health-journal
The International Journal of Women’s Health is an international, peer-reviewed open-access journal publishing original research, reports, reviews and commentaries on all aspects of women’s healthcare includ-ing gynecology, obstetrics, and breast cancer. Subject areas include: Chronic conditions (migraine headaches, arthritis, osteoporosis);
Endocrine and autoimmune syndromes; Sexual and reproductive health; Psychological and psychosocial conditions. The manuscript management system is completely online and includes a very quick and fair peer-review system. Visit http://www.dovepress.com/ testimonials.php to read real quotes from published authors.
International Journal of Women’s Health 2011:3submit your manuscript | www.dovepress.com
Dovepress
Dovepress
Dovepress
346
Wojcinski et al
women. The cohort could then be compared with age-
matched controls who are examined by the conventional
techniques. This setting would yield data about the per-
formance of the ABVS as an ultrasound-based screening
tool (eg, in the general population, in young women with
dense breasts, in high-risk populations, and for detecting
small lesions, for example).
SummaryAs there is a lack of definite data, the ABVS should be used
only within approved study protocols. So far, we do not recom-
mend integrating the ABVS into routine diagnostic procedures,
neither as an adjunct nor as an alternative for HHUS.
In the future, the ABVS might demonstrate greater
usefulness with further improvements in technology and when
the distinct diagnostic criteria have become standardized.
Currently, whether or not there will be an improvement in
cancer detection or a reduction in unnecessary biopsies when
using the ABVS as a diagnostic modality, remains unclear.
Appropriate clinical indications for this examination need
to be developed and this method must undergo standardized
imaging methodology evaluation and validation studies.
Therefore, currently, the ABVS should remain a topic of future
discussion and research within the proposed study designs.
Authors’ contributionsSW and AF contributed to the conception and design of
the study and performed the ultrasound examinations, data
collection, and analysis. SG, UH, and PH contributed to the
statistical analysis, a more advanced interpretation of the data
and the writing and reviewing of the manuscript. JW provided
the radiological material and reviewed the radiological report
data. FD and AS conducted final reviews of the database and
the manuscript and FD provided methodological advice.
DisclosureThe authors report no conflicts of interest in this work.
References1. Zonderland HM, Coerkamp EG, Hermans J, van de Vijver MJ,
van Voorthuisen AE, et al. Diagnosis of breast cancer: contribution of US as an adjunct to mammography. Radiology. 1999;213:413–422.
2. Buchberger W, Niehoff A, Obrist P, et al. Clinically and mammographi-cally occult breast lesions: detection and classification with high resolu-tion sonography. Semin Ultrasound CT MR. 2000;21:325–336.
3. Corsetti V, Ferrari A, Ghirardi M, et al. Role of ultrasonography in detecting mammographically occult breast carcinoma in women with dense breasts. Radiol Med. 2006;111:440–448.
4. Gordon PB, Goldenberg SL. Malignant breast masses detected only by ultrasound. A retrospective review. Cancer. 1995;76:626–630.
5. Kolb TM, Lichy J, Newhouse JH. Occult cancer in women with dense breasts: detection with screening US – diagnostic yield and tumor characteristics. Radiology. 1998;207:191–199.
6. Nothacker M, Duda V, Hahn M, et al. Early detection of breast cancer: benefits and risks of supplemental breast ultrasound in asymptomatic women with mammographically dense breast tissue. A systematic review. BMC Cancer. 2009;9:335.
7. Wild JJ, Neal D. Use of high-frequency ultrasonic waves for detecting changes of texture in living tissue. Lancet. 1951;1:655–657.
8. Wild JJ, Reid JH. Echographic visualization of the living intact human breast. Cancer Res. 1954;14:227–282.
9. Maturo VG, Zusmer NR, Gilson AJ, et al. Ultrasound of the whole breast utilizing a dedicated automated breast scanner. Radiology. 1980;137:457–463.
10. Mendelson EB, Baum JK, Berg WA, et al. BI-RADS: Ultrasound. In: D’Orsi CJ, Mendelson EB, Ikeda DM, et al, editors. Breast Imaging Reporting and Data System: ACR BI-RADS – Breast Imaging Atlas. Reston, VA, American College of Radiology; 2003.
11. Tozaki M, Isobe S, Yamaguchi M, et al. Optimal scanning technique to cover the whole breast using an automated breast volume scanner. Jpn J Radiol. 2010;28:325–328.
12. Deutsche Gesellschaft für Ultraschall in der Medizin (DEGUM). Mehrstufenkonzept Mammasonographie. Available from: http://www.degum.de/Mehrstufenkonzept_Mammasonogra.634.0.html. Accessed July 3, 2011.
13. Kusano AS, Trichopoulos D, Terry KL, Chen WY, Willet WC, Michels KB. A prospective study of breast size and premenopausal breast cancer incidence. Int J Cancer. 2006;118:2031–2034.
14. Wright MC. Graphical analysis of bra size calculation procedures. Int J Cloth Sci Technol. 2002;14:41–45.
15. [German Federal Association of Fund Doctors. Ultrasound regulations]. Available from: http://www.kbv.de/rechtsquellen/2488.html. Accessed July 3, 2011. German.
16. Cohen J. A coefficient of agreement for nominal scales. Educ Psych Meas. 1960;20:37–46.
17. Landis JR, Koch GG. The measurement of observer agreement for categorical data. Biometrics. 1977;33:159–174.
18. Egan RL, Egan KL. Automated water-path full-breast sonography: correlation with histology of 176 solid lesions. AJR Am J Roentgenol. 1984;143:499–507.
19. Kelly KM, Dean J, Lee SJ, Comulada WS. Breast cancer detection: radiologists’ performance using mammography with and without automated whole-breast ultrasound. Eur Radiol. 2010;20:2557–2564.
20. Wenkel E, Heckmann M, Heinrich M, et al. Automated breast ultra-sound: lesion detection and BI-RADS classification – a pilot study. Rofo. 2008;180:804–808.