Embed Size (px)
Citation preview

Mar. Drugs 2012, 10, 1-19; doi:10.3390/md10010001
Marine Drugs ISSN 1660-3397
www.mdpi.com/journal/marinedrugs
Article
Sarcophine-Diol, a Skin Cancer Chemopreventive Agent, Inhibits Proliferation and Stimulates Apoptosis in Mouse Melanoma B16F10 Cell Line
Pawel T. Szymanski 1, Bhimanna Kuppast 1, Safwat A. Ahmed 2, Sherief Khalifa 3 and
Hesham Fahmy 1,*
1 Department of Pharmaceutical Sciences, College of Pharmacy, South Dakota State University,
Brookings, SD 57007, USA; E-Mails: [email protected] (P.T.S.);
[email protected] (B.K.) 2 Department of Pharmacognosy, Faculty of Pharmacy, Suez Canal University, Ismailia 41522,
Egypt; E-Mail: [email protected] 3 College of Pharmacy, Qatar University, Doha 02713, Qatar; E-Mail: [email protected]
* Author to whom correspondence should be addressed; E-Mail: [email protected];
Tel.: +1-605-688-4243; Fax: +1-605-688-5993.
Received: 16 November 2011; in revised form: 7 December 2011 / Accepted: 20 December 2011 /
Published: 22 December 2011
Abstract: Sarcodiol (SD) is a semi-synthetic derivative of sarcophine, a marine natural
product. In our previous work, we reported the significant chemopreventive effects of SD
against non-melanoma skin cancer both in vitro and in vivo mouse models. In this
investigation, we extended this work to study the effect of sarcodiol on melanoma
development, the more deadly form of skin cancer, using the mouse melanoma B16F10 cell
line. In this study we report that SD inhibits the de novo DNA synthesis and enhances
fragmentation of DNA. We also evaluated the antitumor effect of SD on melanoma cell
viability using several biomarkers for cell proliferation and apoptosis. SD inhibits the
expression levels of signal transducers and activators of transcription protein (STAT-3) and
cyclin D1, an activator of cyclin-dependent kinase 4 (Cdk4). SD treatment also enhances
cellular level of tumor suppressor protein 53 (p53) and stimulates cleavage of the nuclear
poly (ADP-ribose) polymerase (cleaved-PARP). SD also enhances cellular levels of
cleaved Caspase-3, -8, -9 and stimulates enzymatic activities of Caspase-3, -8 and -9.
These results, in addition to inhibition of cell viability, suggest that SD inhibits melanoma
cell proliferation by arresting the cell-division cycle in a Go quiescent phase and activates
programmed cell death (apoptosis) via extrinsic and intrinsic pathways. Finally, these
OPEN ACCESS

Mar. Drugs 2012, 10 2
studies demonstrate that SD shows a very promising chemopreventive effect in melanoma
B16F10 tumor cells.
Keywords: sarcophine; sarcodiol; chemoprevention; skin cancer; melanoma
1. Introduction
According to the American Academy of Dermatology, one in five Americans will develop some
form of skin cancer in their life [1–4]. Fortunately most skin cancers can be detected in their early
stages because skin tumors are more visible than others. Three types of cancer account for virtually
100% of skin cancer cases. The non-melanoma skin cancers, including basal cell carcinoma and
squamous cell carcinoma are not lethal and are easily cured [5]. Malignant melanoma is the third and
most deadly type of skin cancer causing the majority (about 75%) of deaths related to skin cancer [6].
Melanoma is a cancer that develops in melanocytes, the pigment cells in the skin. It can be more
serious than the other types of skin cancer. It may spread to other parts of the body (metastasize) and
cause serious illness and death. One historical example lies in 1960s examination of nine Peruvian
mummies, radiocarbon dated to be approximately 2400 years old, which showed apparent signs of
melanoma: melanoma masses in the skin and diffuse metastases to the bones [7]. It is also worth
mentioning that about 70,000 new cases of melanoma cancer were diagnosed in the United States
in 2004 [8].
Currently, surgical intervention is the most common form for skin cancer treatment. The goal of
excision is to remove tumor, prevent spreading of the cancer and to restore normal function of the skin.
The survival rates for patients with melanoma cancer vary, depending on how early the cancer was
detected and surgically removed as well as the precision of the tumor removal, which is not always
100% accurate.
Recently, there has been considerable interest in the use of marine natural products for
chemopreventive activity against skin cancer development [1,9–12]. Sarcophytol A, a cembranoid
isolated from the Okinawan soft coral Sarcophyton glaucum, was reported to have anti-cancer activity,
particularly against skin tumors [13,14]. It has already been studied by the National Cancer Institute
at a preclinical trial level [1]. However, the major limitation with sarcophytol A is its supply.
Sarcophytol A is available only in very small quantities in the soft coral.
For this particular reason, in our laboratory, studies have been carried out on sarcophine.
Sarcophine is one of the most abundant cembranolides isolated from the red Sea coral Sarcophyton
glaucum, with yields up to 3% of animal dry weight [15]. We have reported that structural
modifications of sarcophine yielded sarodiol (SD) and sarcotriol (ST). Our studies demonstrated that
SD displayed a very promising chemopreventive effect against Non-melanoma skin cancer both
in vitro and in vivo as well as using several biomarkers for cell proliferation and apoptosis. We
demonstrated that topical application of SD decreases expression level of cyclooxygenase-2 (Cox-2), a
protein marker for inflammation and enhances cellular expression levels of cleaved-Caspase-3 and -8,
molecular markers for apoptosis in female CD-1 mice with 7,12-dimethybenz(a)antracene (DMBA)
initiated and 12-0-tetradecanoylphorbol-13-acetate (TPA) promoted skin cancer [1]. We also found

Mar. Drugs 2012, 10 3
that SD treatment inhibits skin tumor development (both incidence and multiplicity) in both chemically
induced skin cancer in female CD-1 mice and also UVB-induced skin cancer in SKH-1 hairless
mice [2]. Topical application of SD also enhances cellular expression levels of cleaved-Caspase-3
and -8, and increases the rates of DNA fragmentation in skin cells isolated these mice [2]. Our
subsequent studies demonstrated that SD decreases cell viability in the human epidermoid carcinoma
A431 cell line in a concentration-dependent manner [3]. These findings also showed that SD inhibits
cell proliferation, as determined by lower levels of incorporation of the thymidine analogue
5-bromo-2′-deoxyuridine (BrdU) onto de novo synthesized DNA and simultaneously enhances
fragmentation of DNA in the human epidermoid carcinoma A431 cell line [3]. Moreover, these studies
showed that SD increases expression cellular expression levels of caspase-3 through activation of
upstream caspase-8 in these cancer cells. (Structures of compounds are shown in Figure 1).
Figure 1. Structures of sarcophine and sarcophine-diol.
OOH
OH
Sarcophine diol
O
O O
Sarcophine
In the present investigation, we have extended our previous research to evaluate the effect of
sarcodiol on melanoma using mouse melanoma B16F10 cell line. Our results show that SD inhibits
de novo DNA synthesis and enhances fragmentation of DNA. We also demonstrate that SD inhibits the
expression levels of signal transducer and activator of transcription protein (STAT-3) and cyclin D1,
an activator of cyclin-dependent kinase 4 (Cdk4) and markers of cell proliferation. SD treatment also
enhances cellular level of tumor suppressor protein 53 (p53) and stimulates cleavage of the nuclear
poly (ADP-ribose) polymerase (cleaved-PARP) and also Caspase-3, -8, -9. SD treatment stimulates
enzymatic activities of Caspase-3, -8 and -9. All these findings, in addition to the observation that SD
inhibits cell viability, suggest that SD inhibits melanoma cell proliferation by arresting the cell-division
cycle in a Go quiescent phase and also activates the programmed cell death (apoptosis) via extrinsic
and intrinsic pathways. Finally, these studies demonstrate that SD, in a relatively low concentration,
displays a very promising inhibiting effect on melanoma B16F10 tumor cells.
2. Results
2.1. The Effect of Cell Density on Cell Viability
Prior to conducting studies on the effects of SD on melanoma cell proliferation, we determined the
effect of cell density on melanoma cell viability to optimize cell concentration for further assays, and
to minimize negative effects of nutrients shortage on cell growth during extended (72 h) cell cultures.
Variable concentrations of melanoma cells (from 1 × 10²/0.2 mL well to 1.5 × 10⁴/0.2 mL well) were
placed into 96 wells plate and incubated at 37 °C in standard conditions. After 24 h, 48 h and 72 h the

Mar. Drugs 2012, 10 4
cell viability was determined by MTT assay. As illustrated in Figure 2 the relative activities of
mitochondrial reductase increase as the concentrations of the cells increase until reaching a plateau. In
the case of 24 h incubation time, the plateau was observed at ~6 × 10³ seeded cells/0.2 mL media. For
48 h of incubation the plateau was observed at ~2 × 10³ seeded cells/0.2 mL media, whereas for
72 h the plateau was observed at ~1 × 10³ seeded cell/0.2 mL media.
Figure 2. The effect of the increasing cell concentration on viability of the B16F10 melanoma
cells by MTT assay during 24 h (rombus), 48 h (squares) and 72 h (triangles) incubation
time with a starting concentration of 100 cells/0.2 mL well.
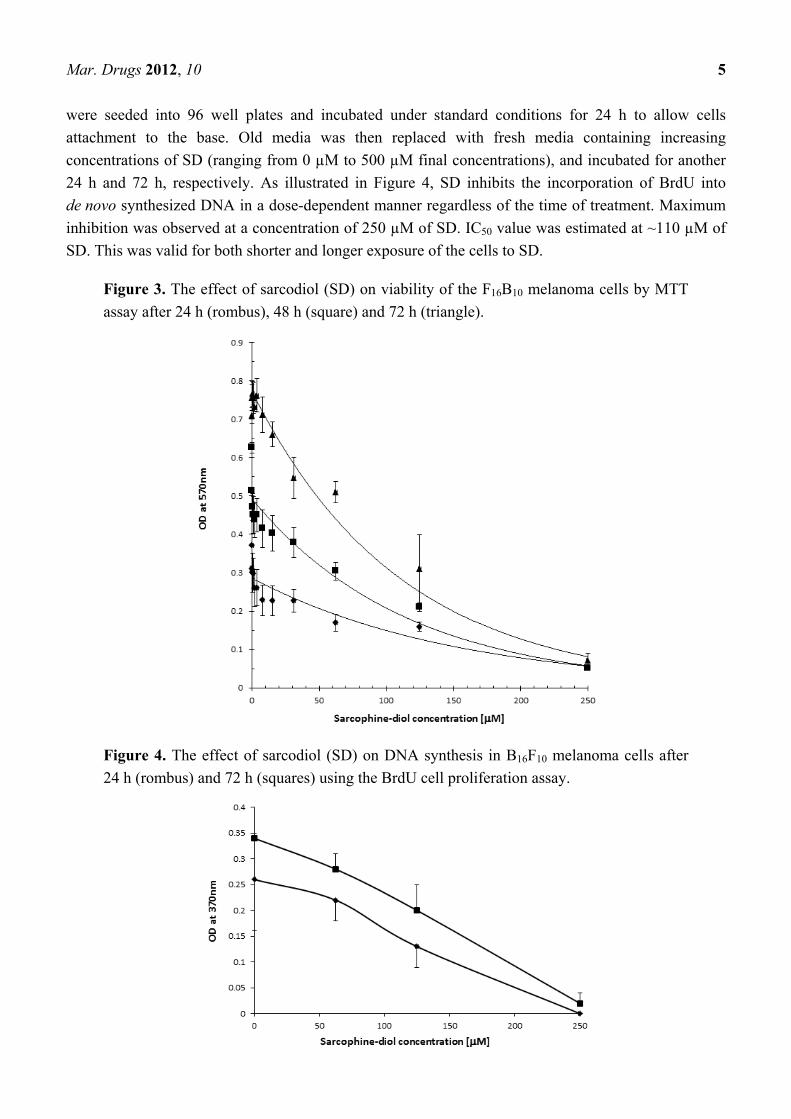
2.2. SD Reduces Viability of the B16F10 Melanoma Cells
The effects of the increasing SD concentrations on melanoma cells viability were determined. Cells
were seeded into 96 wells plate at a concentration of 3 × 10²/0.2 mL well and incubated for 24 h at
37 °C under standard conditions. Old media was replaced by fresh media containing an increasing
concentrations of SD (ranging from 0 µM to 250 µM final concentrations), and cells were incubated
for another 24 h, 48 h and 72 h, respectively. The viability of cells was determined by MTT assay. As
illustrated in Figure 3, addition of increasing concentrations of SD (ranging from 0 µM to 250 µM)
produces a concentration-dependent decrease in formation of the purple formazan crystals by cells. A
maximum of ~90–95% inhibition of cell viability was observed at a 250 µM concentration of SD, and
these values are valid for both short and longer exposure of cell to SD. The IC50 value was estimated at
~70–80 µM concentration of SD and this value is valid for 24 h, 48 h and 72 h incubation times. It is
worth mentioning that SD treatment for 72 h at 800 µM inhibited 44% of cell viability in monkey
kidney CV-1 cells [3] compared to 80 µM that inhibited 50% of melanoma B16F10 cells which suggest
that SD exhibits much less cytotoxicity in normal cells that in melanoma cells.
2.3. SD Inhibits de Novo DNA Synthesis
To better understand the inhibitory effect of SD on cell viability, we examined whether SD treatment
affects DNA synthesis. Cell concentrations ranging from 5 × 10²/0.2 mL well and 2 × 10³/0.2 mL well
Mar. Drugs 2012, 10 5
were seeded into 96 well plates and incubated under standard conditions for 24 h to allow cells
attachment to the base. Old media was then replaced with fresh media containing increasing
concentrations of SD (ranging from 0 µM to 500 µM final concentrations), and incubated for another
24 h and 72 h, respectively. As illustrated in Figure 4, SD inhibits the incorporation of BrdU into
de novo synthesized DNA in a dose-dependent manner regardless of the time of treatment. Maximum
inhibition was observed at a concentration of 250 µM of SD. IC50 value was estimated at ~110 µM of
SD. This was valid for both shorter and longer exposure of the cells to SD.
Figure 3. The effect of sarcodiol (SD) on viability of the F16B10 melanoma cells by MTT
assay after 24 h (rombus), 48 h (square) and 72 h (triangle).
Figure 4. The effect of sarcodiol (SD) on DNA synthesis in B16F10 melanoma cells after
24 h (rombus) and 72 h (squares) using the BrdU cell proliferation assay.
Mar. Drugs 2012, 10 6
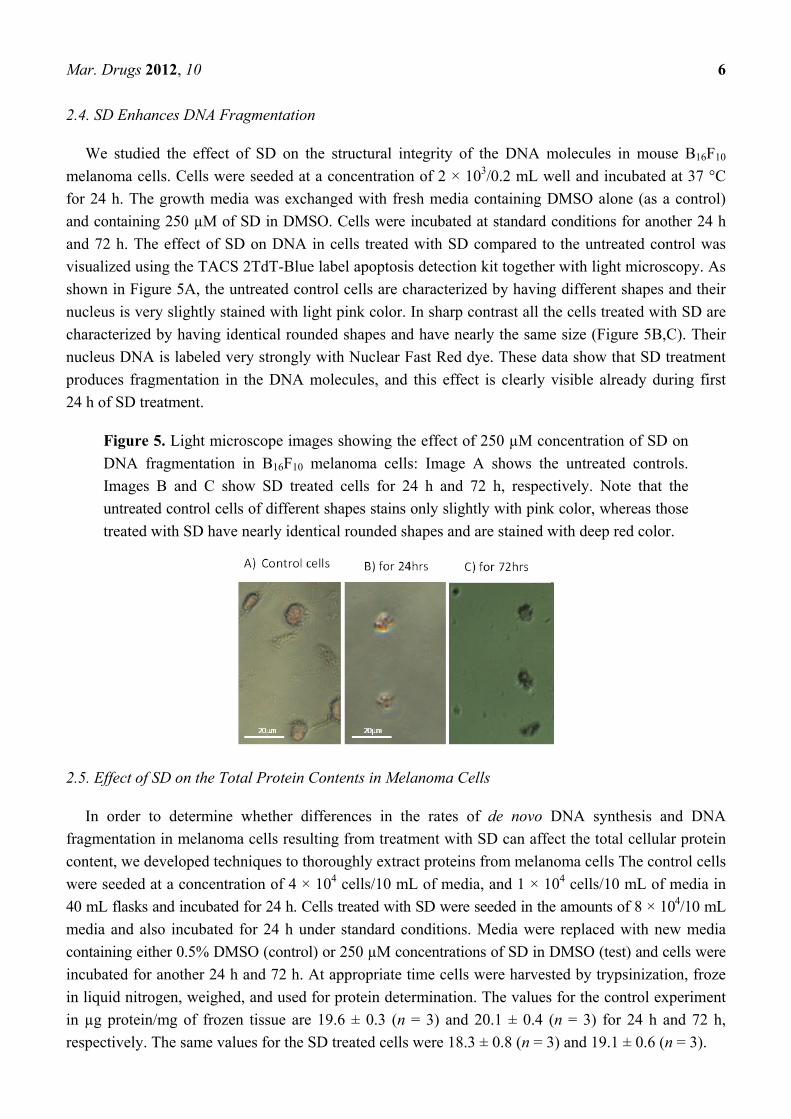
2.4. SD Enhances DNA Fragmentation
We studied the effect of SD on the structural integrity of the DNA molecules in mouse B16F10
melanoma cells. Cells were seeded at a concentration of 2 × 10³/0.2 mL well and incubated at 37 °C
for 24 h. The growth media was exchanged with fresh media containing DMSO alone (as a control)
and containing 250 µM of SD in DMSO. Cells were incubated at standard conditions for another 24 h
and 72 h. The effect of SD on DNA in cells treated with SD compared to the untreated control was
visualized using the TACS 2TdT-Blue label apoptosis detection kit together with light microscopy. As
shown in Figure 5A, the untreated control cells are characterized by having different shapes and their
nucleus is very slightly stained with light pink color. In sharp contrast all the cells treated with SD are
characterized by having identical rounded shapes and have nearly the same size (Figure 5B,C). Their
nucleus DNA is labeled very strongly with Nuclear Fast Red dye. These data show that SD treatment
produces fragmentation in the DNA molecules, and this effect is clearly visible already during first
24 h of SD treatment.
Figure 5. Light microscope images showing the effect of 250 µM concentration of SD on
DNA fragmentation in B16F10 melanoma cells: Image A shows the untreated controls.
Images B and C show SD treated cells for 24 h and 72 h, respectively. Note that the
untreated control cells of different shapes stains only slightly with pink color, whereas those
treated with SD have nearly identical rounded shapes and are stained with deep red color.
2.5. Effect of SD on the Total Protein Contents in Melanoma Cells
In order to determine whether differences in the rates of de novo DNA synthesis and DNA
fragmentation in melanoma cells resulting from treatment with SD can affect the total cellular protein
content, we developed techniques to thoroughly extract proteins from melanoma cells The control cells
were seeded at a concentration of 4 × 10⁴ cells/10 mL of media, and 1 × 10⁴ cells/10 mL of media in
40 mL flasks and incubated for 24 h. Cells treated with SD were seeded in the amounts of 8 × 10⁴/10 mL
media and also incubated for 24 h under standard conditions. Media were replaced with new media
containing either 0.5% DMSO (control) or 250 µM concentrations of SD in DMSO (test) and cells were
incubated for another 24 h and 72 h. At appropriate time cells were harvested by trypsinization, froze
in liquid nitrogen, weighed, and used for protein determination. The values for the control experiment
in µg protein/mg of frozen tissue are 19.6 ± 0.3 (n = 3) and 20.1 ± 0.4 (n = 3) for 24 h and 72 h,
respectively. The same values for the SD treated cells were 18.3 ± 0.8 (n = 3) and 19.1 ± 0.6 (n = 3).
Mar. Drugs 2012, 10 7
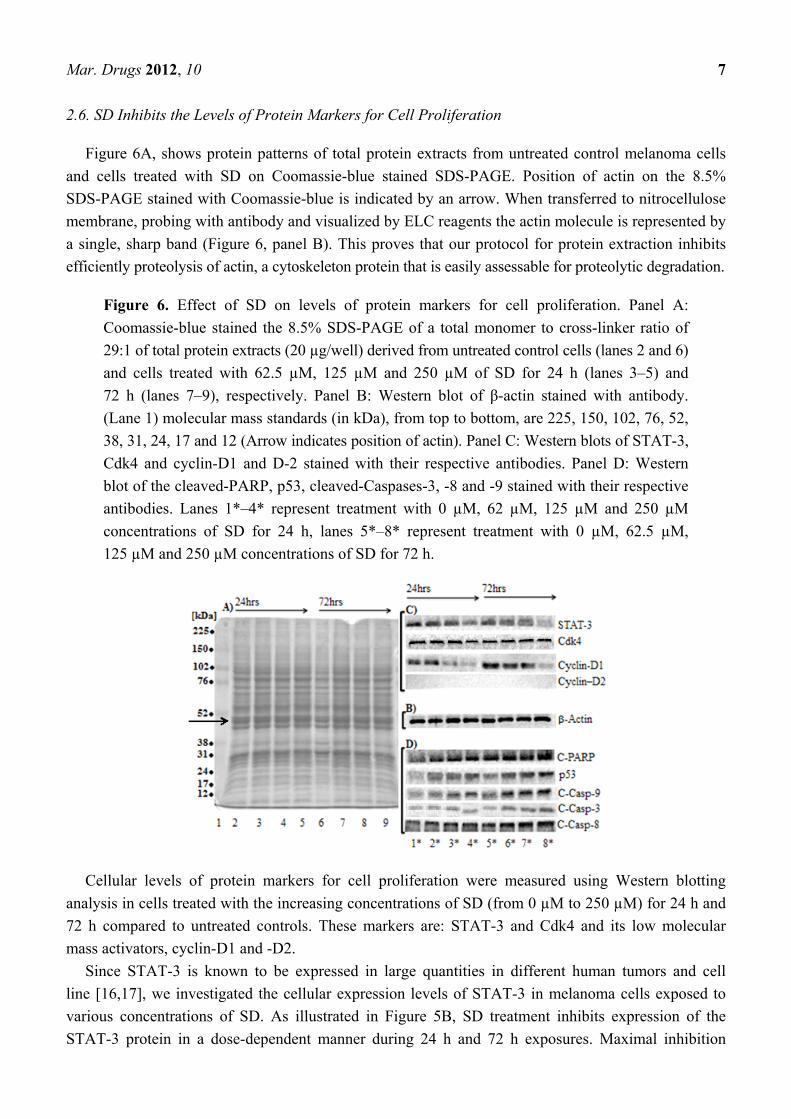
2.6. SD Inhibits the Levels of Protein Markers for Cell Proliferation
Figure 6A, shows protein patterns of total protein extracts from untreated control melanoma cells
and cells treated with SD on Coomassie-blue stained SDS-PAGE. Position of actin on the 8.5%
SDS-PAGE stained with Coomassie-blue is indicated by an arrow. When transferred to nitrocellulose
membrane, probing with antibody and visualized by ELC reagents the actin molecule is represented by
a single, sharp band (Figure 6, panel B). This proves that our protocol for protein extraction inhibits
efficiently proteolysis of actin, a cytoskeleton protein that is easily assessable for proteolytic degradation.
Figure 6. Effect of SD on levels of protein markers for cell proliferation. Panel A:
Coomassie-blue stained the 8.5% SDS-PAGE of a total monomer to cross-linker ratio of
29:1 of total protein extracts (20 µg/well) derived from untreated control cells (lanes 2 and 6)
and cells treated with 62.5 µM, 125 µM and 250 µM of SD for 24 h (lanes 3–5) and
72 h (lanes 7–9), respectively. Panel B: Western blot of β-actin stained with antibody.
(Lane 1) molecular mass standards (in kDa), from top to bottom, are 225, 150, 102, 76, 52,
38, 31, 24, 17 and 12 (Arrow indicates position of actin). Panel C: Western blots of STAT-3,
Cdk4 and cyclin-D1 and D-2 stained with their respective antibodies. Panel D: Western
blot of the cleaved-PARP, p53, cleaved-Caspases-3, -8 and -9 stained with their respective
antibodies. Lanes 1*–4* represent treatment with 0 µM, 62 µM, 125 µM and 250 µM
concentrations of SD for 24 h, lanes 5*–8* represent treatment with 0 µM, 62.5 µM,
125 µM and 250 µM concentrations of SD for 72 h.
Cellular levels of protein markers for cell proliferation were measured using Western blotting
analysis in cells treated with the increasing concentrations of SD (from 0 µM to 250 µM) for 24 h and
72 h compared to untreated controls. These markers are: STAT-3 and Cdk4 and its low molecular
mass activators, cyclin-D1 and -D2.
Since STAT-3 is known to be expressed in large quantities in different human tumors and cell
line [16,17], we investigated the cellular expression levels of STAT-3 in melanoma cells exposed to
various concentrations of SD. As illustrated in Figure 5B, SD treatment inhibits expression of the
STAT-3 protein in a dose-dependent manner during 24 h and 72 h exposures. Maximal inhibition
Mar. Drugs 2012, 10 8
(60–70% inhibition) was occurred at a concentration of 250 µM concentrations of SD. 125 µM
concentrations of SD inhibit expression levels of STAT-3 to a lesser extent (~50% inhibition), whereas
62.5 µM concentrations of SD produced a minor inhibition.
High activity of the Cdk4-cyclin-D protein complex is restricted to the G1-S phase. Figure 5C shows
that SD treatment does not affect cellular level of Cdk4 protein compared to the untreated controls at
all concentrations used at either 24 h or 72 h exposure (Table 1). However, SD treatment has changed
the cellular levels of cyclin-D1 (an activator of Cdk4 kinase) (Figure 6C). The lowest expression levels
of cyclin-D1—barely detected in cells treated with 250 µM concentrations of SD both for 24 h and
for 72 h (Table 1). The cellular levels of cyclin-D2 were not detectable in all cell extracts.
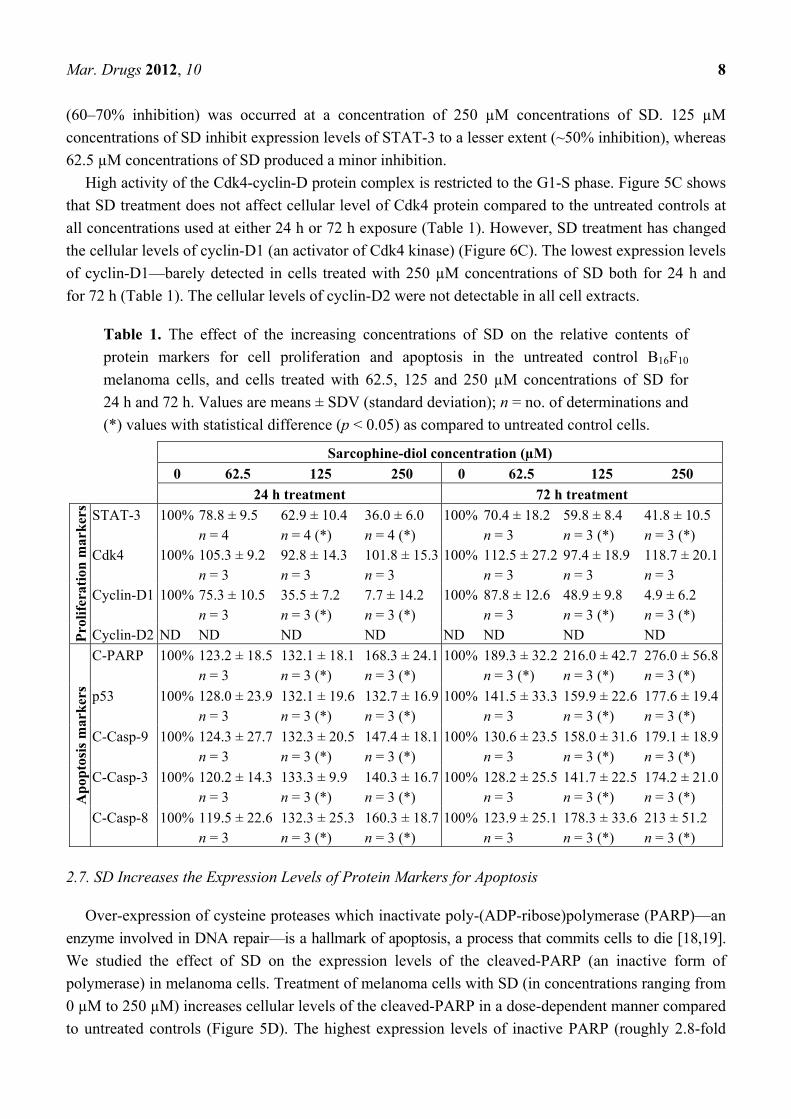
Table 1. The effect of the increasing concentrations of SD on the relative contents of
protein markers for cell proliferation and apoptosis in the untreated control B16F10
melanoma cells, and cells treated with 62.5, 125 and 250 µM concentrations of SD for
24 h and 72 h. Values are means ± SDV (standard deviation); n = no. of determinations and
(*) values with statistical difference (p < 0.05) as compared to untreated control cells.
Sarcophine-diol concentration (µM)
0 62.5 125 250 0 62.5 125 250
24 h treatment 72 h treatment
Pro
life
rati
on m
ark
ers
STAT-3 100% 78.8 ± 9.5 n = 4
62.9 ± 10.4 n = 4 (*)
36.0 ± 6.0 n = 4 (*)
100% 70.4 ± 18.2 n = 3
59.8 ± 8.4 n = 3 (*)
41.8 ± 10.5 n = 3 (*)
Cdk4 100% 105.3 ± 9.2 n = 3
92.8 ± 14.3 n = 3
101.8 ± 15.3 n = 3
100% 112.5 ± 27.2 n = 3
97.4 ± 18.9 n = 3
118.7 ± 20.1 n = 3
Cyclin-D1 100% 75.3 ± 10.5 n = 3
35.5 ± 7.2 n = 3 (*)
7.7 ± 14.2 n = 3 (*)
100% 87.8 ± 12.6 n = 3
48.9 ± 9.8 n = 3 (*)
4.9 ± 6.2 n = 3 (*)
Cyclin-D2 ND ND ND ND ND ND ND ND
Ap
opto
sis
mar
ker
s
C-PARP 100% 123.2 ± 18.5 n = 3
132.1 ± 18.1 n = 3 (*)
168.3 ± 24.1 n = 3 (*)
100% 189.3 ± 32.2 n = 3 (*)
216.0 ± 42.7 n = 3 (*)
276.0 ± 56.8 n = 3 (*)
p53 100% 128.0 ± 23.9 n = 3
132.1 ± 19.6 n = 3 (*)
132.7 ± 16.9 n = 3 (*)
100% 141.5 ± 33.3 n = 3
159.9 ± 22.6 n = 3 (*)
177.6 ± 19.4 n = 3 (*)
C-Casp-9 100% 124.3 ± 27.7 n = 3
132.3 ± 20.5 n = 3 (*)
147.4 ± 18.1 n = 3 (*)
100% 130.6 ± 23.5 n = 3
158.0 ± 31.6 n = 3 (*)
179.1 ± 18.9 n = 3 (*)
C-Casp-3 100% 120.2 ± 14.3 n = 3
133.3 ± 9.9 n = 3 (*)
140.3 ± 16.7 n = 3 (*)
100% 128.2 ± 25.5 n = 3
141.7 ± 22.5 n = 3 (*)
174.2 ± 21.0 n = 3 (*)
C-Casp-8 100% 119.5 ± 22.6 n = 3
132.3 ± 25.3 n = 3 (*)
160.3 ± 18.7 n = 3 (*)
100% 123.9 ± 25.1 n = 3
178.3 ± 33.6 n = 3 (*)
213 ± 51.2 n = 3 (*)
2.7. SD Increases the Expression Levels of Protein Markers for Apoptosis
Over-expression of cysteine proteases which inactivate poly-(ADP-ribose)polymerase (PARP)—an
enzyme involved in DNA repair—is a hallmark of apoptosis, a process that commits cells to die [18,19].
We studied the effect of SD on the expression levels of the cleaved-PARP (an inactive form of
polymerase) in melanoma cells. Treatment of melanoma cells with SD (in concentrations ranging from
0 µM to 250 µM) increases cellular levels of the cleaved-PARP in a dose-dependent manner compared
to untreated controls (Figure 5D). The highest expression levels of inactive PARP (roughly 2.8-fold
Mar. Drugs 2012, 10 9
higher) was observed at 250 µM concentration of SD for 72 h. 1.7-fold higher content of inactive
PARP was detected in cells exposed to the same high concentration of SD for 24 h. Treatment with
63 µM and 125 µM concentrations of SD for 24 h produces only slight increase in the cellular levels
of cleaved-PARP.
Because p53 protein is a tumor suppressor protein [20–22], we studied the effect of SD on the
cellular level of this protein. SD increases the expression levels of p53 in a dose-dependent manner
(Figure 5D). The highest expression level of p53 (roughly ~1.3-fold and ~1.8-fold increase compared
to untreated controls) was observed at 250 µM concentrations of SD for 24 h and 72 h (Table 1). Less
levels of p53 were observed in cells treated with SD concentrations of 62.5 µM and 125 µM for 72 h.
Caspases are the cysteine proteases that are synthesized as inactive precursors and activated by
enzymatic cleavage during programmed cell death [18,19]. Because cleaved-Caspase-3 can be
considered as biomarkers for apoptosis, we studied the effect of SD on activating the caspase’s
pathway(s). As illustrated in Figure 5D, SD increases the cellular level of cleaved-Caspase-3 in the
B16F10 melanoma cells in a dose-dependent manner. Highest expression levels of cleaved-Caspase-3
was observed in cells treated with 250 µM concentrations of SD, for both 24 h and 72 h exposure. Less
levels of cleaved-Caspase-3 (around 50–70%) were observed in cells treated with 125 µM and
62.5 µM concentrations of SD (Table 1).
As illustrated in Figure 6D and summarized in Table 1, SD enhances cleavage of Caspase-8 and
Caspase-9 in a dose-dependent manner. The highest levels of these proteins (roughly 2.1-fold and
~1.8-fold compared to untreated controls) were observed in cells treated with 250 µM concentrations
of SD for 72 h. Smaller values were observed in cells treated with 250 µM concentrations of SD for
24 h although the cellular levels of active Caspase-8 and -9 in these cells are ~1.6-fold higher and
~1.5-fold higher than in the untreated controls. Treatment with 62.5 µM concentrations of SD
produces only slight (roughly 1.3-fold) increase in levels of cleaved Caspase-8 and -9 in both 24 h and
72 h exposures.
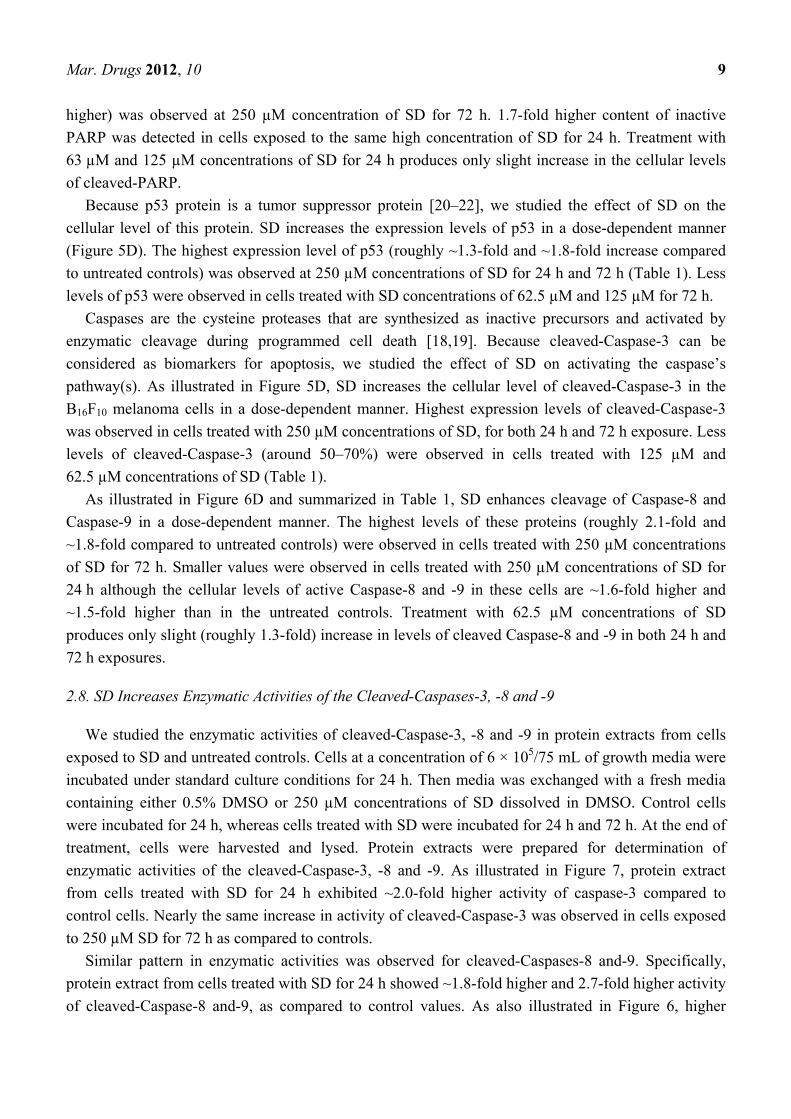
2.8. SD Increases Enzymatic Activities of the Cleaved-Caspases-3, -8 and -9
We studied the enzymatic activities of cleaved-Caspase-3, -8 and -9 in protein extracts from cells
exposed to SD and untreated controls. Cells at a concentration of 6 × 10⁵/75 mL of growth media were
incubated under standard culture conditions for 24 h. Then media was exchanged with a fresh media
containing either 0.5% DMSO or 250 µM concentrations of SD dissolved in DMSO. Control cells
were incubated for 24 h, whereas cells treated with SD were incubated for 24 h and 72 h. At the end of
treatment, cells were harvested and lysed. Protein extracts were prepared for determination of
enzymatic activities of the cleaved-Caspase-3, -8 and -9. As illustrated in Figure 7, protein extract
from cells treated with SD for 24 h exhibited ~2.0-fold higher activity of caspase-3 compared to
control cells. Nearly the same increase in activity of cleaved-Caspase-3 was observed in cells exposed
to 250 µM SD for 72 h as compared to controls.
Similar pattern in enzymatic activities was observed for cleaved-Caspases-8 and-9. Specifically,
protein extract from cells treated with SD for 24 h showed ~1.8-fold higher and 2.7-fold higher activity
of cleaved-Caspase-8 and-9, as compared to control values. As also illustrated in Figure 6, higher
Mar. Drugs 2012, 10 10
difference in the activities of cleaved-Caspase-8 and -9 (~roughly 3-fold increase and 6.0-fold
increase) were observed in cells exposed to SD for 72 h as compared to control cells.
Figure 7. The effect of SD on the enzymatic activities of the cleaved-Caspase-3, -8 and -9,
respectively, in the B16F10 melanoma cell protein extracts for 24 h and 72 h. Each bar
represents mean ± SDV of 3 independent determinations with 3 estimates each, and (*)
values with statistical difference (p < 0.05) as compared to untreated control cells.
2.9. Discussion
Cell viability can be determined by measuring the mitochondrial metabolic activity. The enzymatic-based
assay which measures reduction of soluble tetrazolium salts to insoluble formazans by mitochondrial
reductase has been widely used to assess potency of chemotherapeutic anticancer drugs [23,24]. As
this is the first time to determine the anti-cancer activity of SD against melanoma cells, we conducted
the MTT assay to determine the effects of SD on viability of melanoma B16F10 cells. We demonstrated
that SD treatment induces a concentration-dependent inhibition of mitochondrial metabolic activity in
our melanoma cells. It is worth mentioning that these values are valid for 24 h, 48 h and 72 h exposure
of melanoma cells to SD. The next step was to investigate the inhibitory effects of SD on melanoma
cell proliferation. At first, we investigated the effect of SD treatment on DNA synthesis. Cell
proliferation requires replication of cellular DNA content and the monitoring of DNA synthesis is
more direct parameter for cell proliferation as compared to mitochondrial metabolic activity. Using
Elisa colorimetric-based assay we investigated the incorporation of BrdU into the DNA molecule. We
found that SD inhibits the rates of BrdU incorporation onto DNA during its de novo synthesis. Our
data also show that the inhibitory effect of SD on DNA synthesis depends on SD concentrations.
SD at a concentration of 250 µM completely inhibits DNA synthesis. To investigate the possible
mechanism(s) by which SD inhibits the incorporation of BrdU onto de novo synthetized the DNA
molecule, we studied the expression levels of p53 and STAT-3 proteins cells treated with SD as
compared with untreated control.
The p53 protein, is a tumor suppressor protein, and commonly accepted as an important indicator
for inducing apoptosis [20,21]. p53 protein was demonstrated to activate transcription of many
Mar. Drugs 2012, 10 11
pro-apoptotic factors such as BAX, Bak, Fas/APO-1, PIDD, etc. It was also found to suppress the
transcription of many anti-apoptotic genes. These suppressed genes include Bcl-2, Bcl-XL, etc. [25,26]. In
addition, tumor suppressor protein itself shows capability for up-regulating apoptosis, without
transcription, by directly localizing to mitochondria following the DNA damage and interacting with
anti-apoptotic proteins to free pro-apoptotic proteins such as BAX [20,25–27]. It also was
demonstrated that under stress conditions, p53 can contribute to apoptosis by facilitating transport of
death receptors such as Fas/APO-1 and/or Killer/DR5 from cytoplasmic stores to the cell surface as
required for programmed cell death [26,28]. In these studies, we did not investigate a molecular
mechanism(s) of SD stimulated apoptosis via p53 signaling pathway(s). Based on studies by
Boni et al. [29], it is unlikely that high cellular content of p53 in melanoma cells could override the
activities of many Calcium binding proteins that are involved in cell proliferation. One of those
calcium binding proteins, 21 KDa S100B, was found to have an ability to directly interact with the p53
tumor suppressor protein in melanoma cells [30,31]. It was found that p53 inhibits the pro-apoptotic
functions of this protein [31–33].
STAT-3 belongs to the protein family of cytoplasmic transcription factors that have been identified
to play a role in genes expression that are involved in cell survival, proliferation, chemo-resistance,
and angiogenesis [34,35]. Activation of STAT-3 occurs through phosphorylation of its critical tyrosine
and serine residues and occurs in response to cytokine and growth factor receptor signaling [36,37].
Once activated, STAT-3 translocates from the cytoplasm into the nucleus and binds to specific areas of
DNA. STAT-3 is known to exist in a high concentration in different human tumors and tumor cell
lines [38–40], therefore it becomes an attractive target for cancer therapy [16,17]. Several studies
demonstrated that inhibition of STAT-3 activation, as regards to both phosphorylation and expression,
correlates with suppression of human malignant cells in experimental systems both in the in vitro and
in vivo conditions [16,17,40]. We studied the effect of SD on total protein expression level of STAT-3
in melanoma cells, and found that it decreases the content of STAT-3 in B16F10 melanoma cells, and
this observation is in agreement with findings by others that inhibition of cell proliferation
characterizes in lower cellular level of STAT-3 [40]. Owing to the fact that the anti-STAT-3 antibody
that we used recognizes both phosphorylated and unphosphorylated isoforms of STAT-3, it is very
likely that SD also inhibits phosphorylation of STAT-3 protein, and this process could additionally
inhibit pro-proliferation activity of STAT-3 in melanoma cells.
To better understand the inhibitory effect of SD on melanoma cell proliferation, we were interested
in whether SD treatment could also stimulate DNA fragmentation. Using a TACS2TdT-Blue Label
in situ kit, we tested this hypothesis. We compared the extent of DNA fragmentation in control
melanoma cells with identical cells treated with 250 µM SD for 24 h and 72 h. As illustrated in
Figure 4A–C, SD enhances DNA fragmentation, and this effect seems to be identical regardless time
of cells exposure to SD whether it was 24 h or 72 h. Labeling of DNA by Nuclear Fast Red is
completely different in control untreated cells than those exposed to SD. While untreated cells of the
irregular shapes are labeled only slightly with pink dye, cells treated with SD that characterize in
having quite identical rounded shapes have nucleus strongly stained with deep red color.
Since degradation of DNA occurs in the quiescent Go state, we were also interested in whether SD
affects the cell-division cycle. It is commonly accepted that upon entering the quiescent state, cells do
not divide, and our studies with the use of MTT show that SD inhibits B16F10 melanoma cell
Mar. Drugs 2012, 10 12
proliferation. In view of these findings, we determined the expression level of Cdk4 kinase and its
activators (cyclin-D1 and cyclin-D2) in control cells and cells treated with SD. Cdk4, a member of
cyclin-dependent serine/threonine protein kinases family is positively expressed in cells, whereas
cyclins, their activators are synthesized at the specific stages of the cell-division cycle, in response to
various molecular signals. Once it is associated, the cyclin-CDK protein complex moves from cytosol
to the nucleus [41,42] and becomes involved in the activation of target protein(s) via phosphorylation
in order to orchestrate coordinated entry of the cell into the next phase of the cell-division cycle. High
activity of the complexes between Cdk4 and the D-type cyclins is restricted to the G1-S phase that is
characterizes by cell size increase, preparation for DNA synthesis and, finally, DNA replication [43,44].
While in agreement with findings by other investigators [45] our data show that SD does not affect the
cellular level of Cdk4, and this is valid for both longer and shorter exposures of the cells to SD.
Interestingly, SD in a concentration dependent-manner inhibits expression level of cyclin-D1. This
latter observation suggests that SD inhibits entry of cells into the G1-S phase, arresting them in the
quiescent Go state. While also in agreement with findings by other investigators [45] our data show a
lack of expression of cyclin-D2 in melanoma B16F10 cells.
The latter two findings raise the question of whether the content of cleaved-PARP is different in the
control cells versus SD-treated cells. The intact PARP molecule is a 116 kDa nuclear poly-(ADP
ribose) polymerase that appears to be involved in DNA repair in response to environmental stress [46]
and helps cells to maintain their viability. Inactivation of PARP can be facilitated by many ICE-like
caspases in vitro [47], and it is one of the main cleavage targets for Caspase-3 in situ, the key
executioners of apoptosis [48]. In human PARP, cleavage occurs between Asp214 and Gly215,
separating the NH2-terminal DNA binding domain of molecular mass of 24 kDa from the 89kDa
COOH-half fragment [47]. The 89 kDa fragment of PARP contains catalytic and an auto-modification
domains. The latter domain is responsible for dissociation of the intact PARP molecule from the DNA
after repairing the damaged DNA. The NH2-terminal fragment of PARP facilitates a permanent
interaction of PARP with DNA. Since the interaction between the NH2-terminal domain of PARP with
the DNA molecule inhibits binding of the native PARP to DNA, and since this binding reduces
PARP’s ability for repairing the damaged DNA [49], it is very likely that this mechanism enables the
SD treated cells to repair the damaged DNA, and leads to apoptosis [49]. Our data showing that
treatment with SD enhances cellular level of the 89 kDa COOH-half fragment of PARP are in
agreement with this hypothesis.
It is commonly accepted that active Caspase-3 is capable of inactivating PARP via PARP cleavage
into the COOH-half and the NH2-terminal DNA-binding domain [19,50]. Proteolytic enzymes of the
Caspase family are a hallmark for apoptotic cell death [51,52]. Cleaved-Caspase-3 is a final
executioner of classic apoptotic pathway. Two processes have been identified to activate caspase-3. In
some forms of apoptosis, the extrinsic apoptotic pathway that is initiated by activation of the apical
Caspase-8 following death receptor ligation directly activates Caspase-3 [52]. Cleaved-Caspase-8 is an
active form of Caspase-8. Our data shows that both protein expression levels and enzymatic activity of
cleaved-Caspase-8 are higher in cells treated with SD as compared to those untreated controls
suggesting that SD treatment activates Caspase-8 cascade. In another form of apoptosis, cellular stress
leads to activation of the intrinsic apoptotic pathway initiated by the apical Caspase-9 [53] that
also remains under control of Caspase-8. In this route of apoptosis cleaved-Caspase-9 activates
Mar. Drugs 2012, 10 13
caspase-3 [54,55]. Our data show that SD treatment also activates the Caspase-9 apoptotic pathway.
Certainly, more studies are needed to explore the molecular mechanism(s) of SD inhibition of cell
proliferation and activation of apoptosis in melanoma cells.
3. Experimental Section
3.1. Materials and Reagents
The gel apparatus and material for electrophoresis were purchased from Hoefer (San Francisco, CA,
USA) and Bio-Rad (Richmond, CA, USA). The nitrocellulose transfer membranes having a pore size
of 0.22 µm in diameter was purchased from Santa Cruz Biotechnology, Inc. (Santa Cruz, CA, USA).
All the commonly used reagents, mouse monoclonal anti-p53 antibodies, 10,000 units of Penicillin
and 10 mg Streptomycin stock solution and Trypsin-EDTA 10X-solution were purchased from
Sigma-Aldrich (St. Louis, MO, USA). Mouse monoclonal antibodies against cleaved-PARP,
cleaved-Caspase-8 and rabbit monoclonal antibodies against cleaved-Caspase-3, and cleaved-Caspase-9
were purchased from Cell Signaling (Danvers, MA, USA). Mouse monoclonal antibodies against
β-actin, Cdk4 and STAT-3, rabbit antibodies against cycline D1 and D2, goat anti-mouse and goat
anti-rabbit both horseradish-conjugated (HRP) secondary antibodies were purchased from Santa Cruz
Biotechnology, Inc. (Santa Cruz, CA, USA). The B16F10 mouse melanoma cell line, Dulbecco’s
Modified Eagle’s Media (DMEM) supplemented with L-glutamine and Fetal Bovine Serum (FBS)
were purchased from the American Type Culture Collection (ATCC) (Manassas, VA, USA).
3.2. Synthesis of SD
Sarcophine was isolated from the soft coral Sarcophyton glaucum using the reported procedure [10,14],
Sarcodiol (SD) was synthesized following our reported procedure [3]. SD was dissolved in 100%
dimethyl sulfoxide (DMSO) to prepare 50 mM stock solution. The 50 mM stock solution of SD was
further diluted in DMSO to obtain the appropriate concentrations. In all assays the final concentration
of DMSO in growth media was 0.5%, whereas the final concentrations of SD vary from 0 µM to 250 µM.
3.3. Cell Culture
Mouse melanoma B16F10 cell line was grown in DMEM media supplemented with 10% FBS and a
1% solution containing 100 U/mL penicillin and 100 mg/mL streptomycin to inhibit bacteria growth.
Cells were grown in 37 °C in a humidified atmosphere containing 5% CO2 and 95% air.
3.4. Total Cellular Protein Extract
Cells were detached from the surface of culture flasks by short exposure to a minimal amount of
trypsin. Immediately after detachment, the cell suspension was diluted with 10-fold excess of growth
media to inhibit proteolytic activity of trypsin. Upon transfer to the centrifuge tubes, cells were
pelleted by centrifugation in 25 °C at 1700 rpm for 5 min. The supernatant was discarded whereas the
cell pellet was thoroughly washed with phosphate buffered saline (PBS) to remove protein
contamination from FBS. The washing procedure was repeated 3 times. Cells were then solubilized in
Mar. Drugs 2012, 10 14
3–5 volume of an ice-cold extraction buffer by passing several times through a pipet tip. Cell lysate
was then kept in an ice-cold extraction buffer for 10–15 min and then spin down in 4 °C at 14,000 rpm
for 20 min. The supernatant was collected and stored at −20 °C for determination of protein content
and Western blot analyses.
For routine assays, the extraction buffer contained: 20 mM Tris(hydroxymethyl)aminomethane
(Tris)-HCl, pH 7.8; 150 mM NaCl; 1% octylphenoxypolyethoxyethanol (Triton X-100); 1% sodium
deoxycholate; 0.1% sodium dodecyl sulfate (SDS); 2 mM ethylenediaminetetraacetic acid (EDTA),
2 mM ethylenebis(oxyethylenenitrilo)tetraacetci acid (EGTA), 2 mM sodium azide (NaN3), 2 mM
dithiothreitol (DTT). To minimize proteolytic degradation during extraction, we supplemented the
extraction buffer with a protease inhibitor cocktail (Roche Diagnostic GmbH, Mannheim, Germany)
according to the manufacturer’s protocol (one tablet of protease inhibitors was diluted in 1 mL of
double distilled water and added to 7 mL of extraction buffer prior to use).
3.5. Determination of Protein Content
Total protein content in the cell extract was determined colorimetrically using a detergent
compatible bicinchoninic acid (BCA) protein assay kit according the manufacturer’s protocol (Pierce,
BCA, Rockford, IL, USA), using bovine serum albumin (BSA) as a standard.
3.6. Western Blot Analyses of Protein Markers for Cell Proliferation and Apoptosis
The total cell protein extract in the amounts of ~15–20 μg protein/well was resolved the 8.5%
SDS-PAGE, using a total monomer to cross-linker ratio of 29:1. Once separated, proteins were
transferred in electric field onto the nitrocellulose membrane. Transferred proteins were identified
following this procedure: The nonspecific binding sites were blocked by Tris-buffered saline, pH 7.5
supplemented with 0.05% polyoxyethylenesorbitan monolaurate (Tween 20) and 5% non-fat milk at
room temperature for 1 h. Membranes were then probed with primary antibodies at room temperature
for 1.5 h using the a dilutions of 1:1000 for β-actin, cleaved-PARP, cleaved-Caspase-3, -8, -9, Cdk4
and cyclin-D1 and -D2, and a dilution of 1:500 for STAT-3. Primary antibodies were diluted in
Tris-buffer saline, pH 7.5 containing 0.05% Tween 20 and 1% non-fat milk. After removal of unbound
antibodies, membranes were thoroughly washed with Tris-buffer saline, pH 7.5 containing 0.05%
Tween 20. Secondary antibodies were then applied. All secondary antibodies were diluted in
Tris-buffer saline, pH 7.5 supplemented with 0.05% Tween 20, using a dilution of 1:2000 for detection
of β-actin, cleaved-PARP, cleaved Caspase-3, -8, -9, Cdk4 and cyclin-D1 and -D2 and a dilution of
1:1000 for probing the STAT-3 protein. Membranes were exposed to secondary antibodies at room
temperature for 1 h. Then membranes were thoroughly washed with Tris-buffer saline, pH 7.5 to
remove unbound antibodies. Protein bands were visualized by Western Blotting Luminol Reagent
(Santa Cruz Biotechnology, Inc., Santa Cruz, CA, USA) and then quantified using UVP Biochem Gel
Documentation System (UVP, Inc., Upland, CA, USA).
Mar. Drugs 2012, 10 15
3.7. Cell Viability Assays
3.7.1. Staining of the Cells with Trypan-Blue
For the purpose of preparing cell suspension having defined amounts of living cells, a quick
Trypan-blue exclusion staining method was used. Briefly, cell suspension in growth media was diluted
twice with a 0.4% Trypan-blue solution (AMRESCO, Solon, OH, USA). Concentrations of living cells
were determined with the use of Cellometer Auto T4 Plus Cell Counter (Nexcelom Bioscience LLC,
Lawrence, MA, USA) equipped with Cellometer Automated Cell Counts software.
3.7.2. MTT Assay
Cell viability was also determined by the Elisa-type MTT kit following the manufacturer’s protocol
(Biotium, Inc., Hayward, CA, USA). This colorimetric assay is based on reduction of the yellow
tetrazolium salt to a purple formazan crystal by mitochondrial reductase which is active in living cells.
This method was used for studying the effects of SD on melanoma cell viability. We performed MTT
assay in a 96 well plate. 10 μL of MTT solution/0.1 mL media was added to each well. The reaction
mixture was then incubated at 37 °C for 4 h. 200 μL of DMSO was added to dissolve the purple
formazan crystals. Color absorbance of samples was measured at 570 nm with a reference wavelength
of 630 nm to correct background for the blank sample (growth media without cells) using a Type M2
Spectra Max Microplate Reader (Sunnyvale, CA, USA) equipped with SoftMax PRO4.8 software.
3.8. Determination of DNA Synthesis
The rates of DNA synthesis were determined by measuring BrdU incorporation into de novo
synthetized DNA and were carried out using the BrdU Elisa-type kit according to the manufacture’s
protocol (Roche Diagnostics, GmbH, Mannheim, Germany). At the end of incubation period, 10 μL of
BrdU labeling solution per 0.1 mL media was added to each well and the reaction mixture was placed
at 37 °C for 4 h. Following removal of the medium, 200 μL of FixDenat solution was added and the
cells were incubated at room temperature for another 30 min. After emptying the wells, a 100 μL of
the anti-BrdU solution was added and the reaction mixture was incubated at room temperature for
another 90 min. After removal of the antibodies and after several washes with PBS, 100 μL of the
Substrate Solution was added to each well. After incubation at room temperature for 30 min, the color
absorbance of the samples was measured at 570 nm with a reference wavelength of 630 nm to correct
background for blank sample (growth media without cells) using a Type M2 Spectra Max Microplate
Reader (Sunnyvale, CA, USA) equipped with SoftMax PRO4.8 software.
3.9. Determination of DNA Fragmentation in Situ
To visualize the effect of SD on DNA fragmentation in situ we used TACS 2TdT-Blue Label
Detection kit from R & D Systems (Minneapolis, MN) together with a light microscope. We
performed this assay using cells cultured in a 96 well plate and exposed to 0.5% DMSO alone and a
250 μM concentration of SD for 24 h and 72 h. At appropriate time, cells were quickly rinsed with
PBS buffer. Then, 3.7% formaldehyde in PBS buffer was added and the cells were fixed at room

Mar. Drugs 2012, 10 16
temperature for 10 min and thoroughly washed with PBS buffer to remove formaldehyde. Cell
membranes were then permeabilized with Proteinase K Solution at room temperature for 20 min, and
then washed with distilled water. After a treatment with Quenching Solution for 5 min and washing
with PBS, cells were treated with the TdT Labeling Buffer at room temperature for 5 min. Cells were
then incubated in the Labeling Reaction Mix at 37 °C for 1 h in humidifying chamber. Cells were
immersed in the TdT Stop Buffer Solution at room temperature for 5 min. After washing with PBS, the
Stop-HRP Solution was applied for 10 min. Following several washes with PBS, the cells were
immerse in TACS-Blue Label Solution for 3 min, then washed for a few times with deionized water
and counterstained with Nuclear Fast Red for 1 min. After several washes with ethanol to remove the
excess staining solution, cells were covered with double distilled water and examined under a model
AX10 light microscope connected to AxioVision Rel. 4.7 software via camera model AxioCam MRc5
(Zeiss, Germany).
3.10. Determination of Enzymatic Activities of the Cleaved-Caspases-3, -8 and -9
Enzymatic activities of Caspase-3, -8 and -9 in the cell extract were measured using ApoTarget kit,
according to the manufacturer’s protocol (Invitrogen Corp., Camarillo, CA, USA). At the end of
experiment, cells (test and control) were harvested by trypsinization, washed thoroughly with ice-cold
PBS buffer and lysed using a chilled cell lysis buffer provided by the manufacturer for 10 min.
Proteins were collected by centrifugation at 10,000 rpm for 5 min. Protein concentration in each
supernatant fraction was diluted to the same concentration. Each sample containing 100 μg of protein
in 50 μL of lysis buffer was added to reaction buffer containing 200 μM of Caspase substrate, which is
a synthetic peptide conjugated to a chromophore p-anilide (pNA). For determination of the
cleaved-Caspase-3 activity, DVED-pNA was used. For the cleaved-Casspase-8, LETD-pNA was used
and for cleaved-Caspase-9, LEHD-pNA was used. The reaction mixtures were then incubated at 37 °C
for 4 h. Following cleavage, light absorption by the released pNA was measured at 400 nm using a
Type M2 Spectra Max Microplate Reader (Sunnyvale, CA, USA) equipped with SoftMax PRO4.8
software. The rates of caspase activities in control cells and cells treated with SD were calculated after
subtraction of background absorbance.
3.11. Statistical Analysis
All values are expressed as means ± SDV. A Student’s t-test was used for statistical analysis, and a
confidence level of P < 0.05 was chosen as indication of statistical difference.
Acknowledgements
This work was supported by the National Institute of Health Academic Research Enhancement
Award (AREA) Grant number 1R15CA134049-01A1 and The Translational Cancer Research Center
(TCRC) funded by The Research and Commercialization Council, State of South Dakota, USA.

Mar. Drugs 2012, 10 17
References
1. Zhang, X.; Kundoor, V.; Khalifa, S.; Zeman, D.; Fahmy, H.; Dwivedi, C. Chemopreventive effects
of sarcophine-diol on skin tumor development in CD-1 mice. Cancer Lett. 2007, 253, 53–59.
2. Zang, X.; Bommareddy, A.; Chen, W.; Hildreth, M.B.; Kaushik, R.S.; Zeman, D.; Khalifa, S.;
Fahmy, H.; Dwivedi, C. Chemopreventive effects of sarcophine-diol on ultraviolet B-induced skin
tumor development in SKH-1 hairless mice. Mar. Drugs 2009, 7, 153–165.
3. Zhang, X.; Bommareddy, A.; Chen, W.; Khalifa, S.; Kaushik, R.S.; Fahmy, H.; Dwivedi, C.
Sarcophine-diol, a chemopreventive agent of skin cancer, inhibits apoptosis through extrinsic
pathway in human epidermoid carcinoma A431 Cells. Trans. Oncol. 2009, 2, 21–30.
4. Rigel, D.S.; Friedman, R.J.; Kopf, A.W. Lifetime risk for development of skin cancer in US
population: Current estimate is now 1 in 5. J. Am. Acad. Dermatol. 1996, 35, 1012–1013.
5. Sarasin, A. The molecular pathways of ultraviolet-induced carcinogenesis. Mutat. Res. 1999, 428,
5–10.
6. Jarnat, A.F.; Johnson, J.T.; Sheridan, C.D.; Caffrey, T.J. Early detection and treatment of skin
cancer. Am. Fam. Physician 2000, 62, 357–368, 375–376, 381–382.
7. Urteaga, O.; Pack, G. On the antiquity of melanoma. Cancer 1966, 19, 607–610.
8. National Cancer Institute. Skin Cancer Facts. Available online: http://www.skincancer.org
(accessed on 3 October 2005).
9. Haefner, B. Chemoprevention of cancer. Cancer Res. 2003, 45, 1–8.
10. Fahmy, H.; Khalifa, S.; Konoshima, T.; Zjawiony, J.K. An improved synthesis of
7,8-epoxy-1,3,11-cembratriene-15R(α), 16-diol, a cembranoid of marine origin with a potent
cancer chemopreventive activity. Mar. Drugs 2004, 2, 1–7.
11. Fahmy, H.; Zjawiony, J.K.; Konoshima, T.; Tokuda, H.; Khan, S.; Khalifa, S. Potent skin cancer
chemopreventing activity of some novel semi-synthesis cembranoids from marine sources.
Mar. Drugs 2006, 4, 1–9.
12. Kundoor, V.; Zhang, X.; Khalifa, S.; Fahmy, H.; Dwivedi, C. A possible mechanism of action of
the chemopreventive effects of sarcotriol on skin tumor development in CD-1 mice. Mar. Drugs
2006, 4, 274–285.
13. Fujiki, H.; Suganuma, M.; Takagi, K. Sarcophytol A and Its Analogs. In Cancer Preventive
Activity in Phenolic Compounds in Food and Their Effects on Health II, Antioxidants and Cancer
Prevention; Huang, M.T., Ho, C.T., Lee, C.Y., Eds.; American Chemical Society: Washington,
DC, USA, 1992; pp. 380–387.
14. Katsuyama, I.; Fahmy, H.; Zjawiony, J.K.; Khalifa, S.; Kilada, R.W.; Konoshima, T.; Takasaki, M.;
Tokuda, H. Semisynthesis of new sarcophine derivatives with chemopreventive activity. J. Nat.
Prod. 2002, 65, 1809–1814.
15. Sawant, S.; Youssef, D.; Mayer, A.; Sylvester, P.; Wali, V.; Arant, M.; Sayed, K.E. Anticancer
and anti-inflammatory sulfur-containing semisynthetic derivatives of sarcophine. Chem. Pharm.
Bull. 2006, 54, 1119–1123.
16. Darnell, J.E., Jr. Transcription factors as targets for cancer therapy. Nat. Rev. Cancer 2002, 2,
740–749.
17. Darnell, J.E. Validating STAT3 in cancer therapy. Nat. Med. 2005, 11, 595–596.

Mar. Drugs 2012, 10 18
18. Earnshaw, W.C.; Martins, L.M.; Kaufmann, S.H. Mammalian caspases: Structure, activation,
substrates and functions during apoptosis. Annu. Rev. Biochem. 1999, 68, 383–424.
19. Thornberry, N.; Lazebnik, Y. Caspases: Enemies within. Science 1998, 281, 1312–1316.
20. Mihara, M.; Erster, S.; Zaika, A.; Petrenko, O.; Chittenden, T.; Pancoska, P.; Moll, U.M. p53 has
a direct apoptogenic role at the mitochondria. Mol. Cell 2003, 11, 577–590.
21. Bate, S.; Vousden, K.H. p53 in signaling checkpoint arrest in apoptosis. Curr. Opin. Genet. Dev.
1996, 6, 12–18.
22. Ziemer, M.A.; Mason, A.; Carlson, D.M. Cell-free translations of proline-rich protein mRNAs.
J. Biol. Chem. 1982, 257, 11176–11180.
23. Black, M.M.; Speer, F.D. Effects of cancer chemotherapeutic agents on dehydrogenase activity of
human cancer tissue in vitro. Am. J. Clin. Pathol. 1953, 23, 218–227.
24. Altman, F.P. Tetrazolium salts and formazans. Prog. Histochem. 1977, 9, 1–56.
25. Benchimol, S. p53-dependent pathways of apoptosis. Cell Death Diff. 2001, 8, 1049–1051.
26. Hoffman, W.H.; Biade, S.; Zilfou, J.T.; Chen, J.; Murphy, M. Transcriptional repression of the
anti-apoptotic surviving gene by wild type p53. J. Biol. Chem. 2002, 277, 3247–3257.
27. Chipuk, J.E.; Kuwana, T.; Bouchier-Hayes, L.; Droin, N.M.; Newmeyer, D.D.; Schuler, M.;
Green, D.R. Direct activation of Bax by p53 mediates mitochondrial membrane permeabilization
and apoptosis. Science 2004, 303, 1010–1014.
28. Bennett, M.; Macdonald, K.; Chan, S.W.; Luzio, J.P.; Simari, R.; Weissberg, P. Cell surface
trafficking of Fas: A rapid mechanism of p53-mediated apoptosis. Science 1998, 282, 290–293.
29. Boni, R.; Burg, G.; Doguoglu, A.; Ilg, E.C.; Schafer, B.W.; Muller, B.; Heizmann, C.W.
Immunihistochemical localization of Ca2+ binding S100 proteins in normal human skin and
melanocytic lesions. Br. J. Dermatol. 1977, 137, 39–43.
30. Delphin, C.; Ronjat, M.; Deloulme, J.C.; Garin, G.; Debussche, L.; Highasimoto, Y.; Sakaguchi, K.;
Baudier, J. Calcium-dependent interaction of S100B with the C-terminal domain of the tumor
suppressor p53. J. Biol. Chem. 1999, 274, 10539–10544.
31. Lin, J.; Yang, Q.; Yan, Z.; Markowitz, J.; Wilder, P.T.; Carrier, F.; Weber, D.J. Inhibiting S100B
restores p53 levels in primary malignant melanoma cancer cells. J. Biol. Chem. 2004, 279,
34071–34077.
32. Lin, J.; Blake, M.; Tang, C.; Zimmer, D.; Rustandi, R.R.; Weber, D.J.; Carrier, F. Inhibition of
p53 transcriptional activity by the S100B calcium-binding protein. J. Biol. Chem. 2001, 276,
35037–35041.
33. Lin, J.; Yang, Q.; Wilder, P.T.; Carrier, F.; Weber, D.J. The calcium-binding protein S100B
down-regulates p53 and apoptosis in malignant melanoma. J. Biol. Chem. 2010, 285, 27487–27498.
34. Ihle, J.N. STAT’s signal transducers and activators of transcription. Cell 1996, 84, 331–334.
35. Bromberg, J.F.; Wrzeszczynska, M.H.; Devgan, G.; Zhao, Y.; Pestell, R.G.; Albanese, C.;
Darnell, J.E., Jr. STAT3 as an oncogene. Cell 1999, 98, 295–303.
36. Horvath, C.M.; Darnell, J.E. The state of the STAT’s: recent developments in the study of signal
transduction to the nucleus. Curr. Opin. Cell Biol. 1997, 9, 233–239.
37. Brivanlou, A.H.; Darnell, J.E., Jr. Signal transduction and the control gene expression. Science
2002, 295, 813–818.
Mar. Drugs 2012, 10 19
38. Coffer, P.J.; Koenderman, L.; de Groot, R.P. The role of STATs in myeloid differentiation and
laukemia. Oncogene 2000, 19, 2511–2522.
39. Quintanilla-Martinez, L.; Kremer, M.; Specht, K.; Calzada-Wack, J.; Nathrath, M.; Schaich, R.;
Hofler, H.; Freud, F. Analysis of signal transducer and transcription 3 (STAT3) pathway in
multiple myelonoma: STAT3 activation and cyclin D1 dysregulation are mutually exclusive
events. Am. J. Pathol. 2003, 162, 1449–1461.
40. Mora, L.B.; Buettner, R.; Seigne, J.; Diaz, J.; Ahmad, N.; Bowman, T.; Falcone, R.; Fairelough, R.;
Cantor, A.; Moro-Cacho, C.; et al. Constitutive activation of STAT3 in human prostate tumors
and cell lines: direct inhibition of STAT3 signaling induces apoptosis of prostate cancer cells.
Cancer Res. 2002, 62, 6659–6666.
41. Norbury, C.; Nurse, P. Animal cell cycles and their control. Annu. Rev. Biochem. 1992, 61, 441–470.
42. Morgan, D.O. Cyclin-dependent kinases: Engines, clocks, and microprocessors. Annu. Rev. Cell
Dev. Biol. 1997, 13, 261–291.
43. Kato, Y.T. Control of G1 progression by D-type cyclins; key event for cell proliferation.
Leukemia 1997, 11, S347–S351.
44. Sherr, C.J. Growth factor-regulated G1 cyclins. Stem Cells 1994, 12, S47–S55.
45. Taules, M.; Rius, E.; Talaya, D.; Lopez-Garcia, A.; Bachs, O.; Agell, N. Calmodulin is essential
for cyclin-dependent kinase 4 (Cdk4) activity and nuclear accumulation of cyclin D1-Cdk4 during
G1. J. Biol. Chem. 1998, 273, 33279–33286.
46. Satoh, M.S.; Lindahl, T. Role of poly(ADP-ribose) formation in DNA repair. Nature 1992, 356,
356–358.
47. Lazebnik, Y.A.; Kaufman, S.H.; Desnoyers, S.; Poirier, G.G.; Earnshaw, W.C. Cleavage of
poly(ADP-ribose) polymerase by a proteinase with properties of ICE. Nature 1994, 371, 346–347.
48. Cohen, G.M. Caspases: Executioners of apoptosis. Biochem. J. 1997, 326, 1–16.
49. Oliver, F.J.; dela Rubia, G.; Rolli, V.; Ruiz-Ruiz, M.C.; de Murcia, G.; Murcia, J.M. Importance
of poly(ADP-ribose) polymerase and its cleavage in apoptosis: lesson from an uncleavable
mutant. J. Biol. Chem. 1998, 273, 33533–33539.
50. Earnshaw, W.C.; Martins, L.M.; Kaufmann, S.H. Mammalian caspases: structure, substrates and
functions during apoptosis. Annu. Rev. Biochem. 1999, 68, 383–424.
51. Chinnaiyan, A.M.; Dixit, V.M. The cell-death machine. Curr. Biol. 1996, 6, 555–562.
52. Salvesen, G.S.; Dixit, V.M. Caspases: Intracellular signaling by proteolysis. Cell 1997, 91, 443–446.
53. Green, D.; Kroemer, G. The central executioners of apoptosis: Caspases or mitochondria? Trends
Cell Biol. 1998, 8, 267–271.
54. Nicholson, D.W.; Thornberry, N.A. Caspases: Killer proteases. Trends Biochem. Sci. 1997, 22,
299–306.
55. Debatin, K. Apoptosis pathway in cancer and cancer therapy. Cancer Immunol. Immunother.
2004, 53, 153–159.
Samples Availability: Available from the authors.
© 2012 by the authors; licensee MDPI, Basel, Switzerland. This article is an open access article
distributed under the terms and conditions of the Creative Commons Attribution license
(http://creativecommons.org/licenses/by/3.0/).