Embed Size (px)
Citation preview
World Journal of Environmental Biosciences
All Rights Reserved Euresian Publication © 2014 eISSN 2277- 8047
Available Online at: www.environmentaljournals.org
Volume 3, Issue 1: 42-55
Open Access Research Article
42
Babar et al.
Avian Community Analysis from the Vicinity of Morawane and Natuwadi Dams in Ratnagiri
District (M. S.), India
Babar H. T., G. B. Raje, P. V. Korochikar and 1V. M. Gaikwad
Department of Zoology, D. B. J. College, Chiplun – 415 605 1Department of Mathematics, D. B. J. College, Chiplun – 415 605
Corresponding author: [email protected]; [email protected]
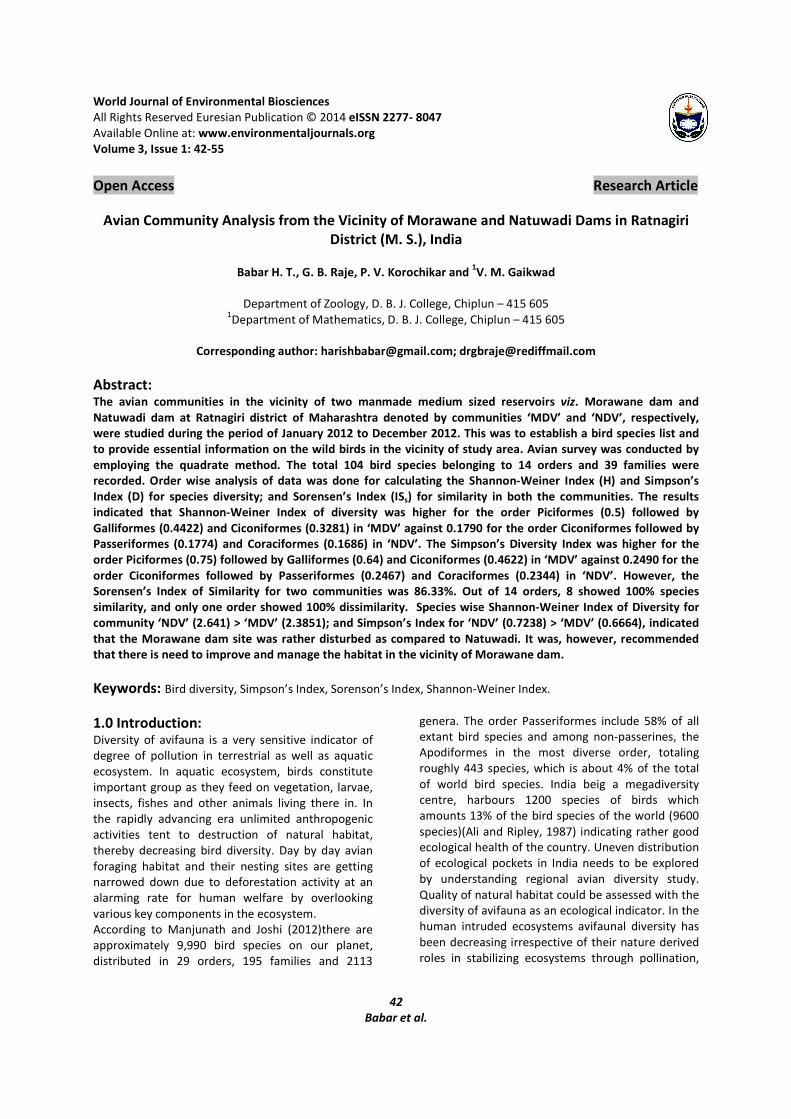
Abstract: The avian communities in the vicinity of two manmade medium sized reservoirs viz. Morawane dam and
Natuwadi dam at Ratnagiri district of Maharashtra denoted by communities ‘MDV’ and ‘NDV’, respectively,
were studied during the period of January 2012 to December 2012. This was to establish a bird species list and
to provide essential information on the wild birds in the vicinity of study area. Avian survey was conducted by
employing the quadrate method. The total 104 bird species belonging to 14 orders and 39 families were
recorded. Order wise analysis of data was done for calculating the Shannon-Weiner Index (H) and Simpson’s
Index (D) for species diversity; and Sorensen’s Index (ISs) for similarity in both the communities. The results
indicated that Shannon-Weiner Index of diversity was higher for the order Piciformes (0.5) followed by
Galliformes (0.4422) and Ciconiformes (0.3281) in ‘MDV’ against 0.1790 for the order Ciconiformes followed by
Passeriformes (0.1774) and Coraciformes (0.1686) in ‘NDV’. The Simpson’s Diversity Index was higher for the
order Piciformes (0.75) followed by Galliformes (0.64) and Ciconiformes (0.4622) in ‘MDV’ against 0.2490 for the
order Ciconiformes followed by Passeriformes (0.2467) and Coraciformes (0.2344) in ‘NDV’. However, the
Sorensen’s Index of Similarity for two communities was 86.33%. Out of 14 orders, 8 showed 100% species
similarity, and only one order showed 100% dissimilarity. Species wise Shannon-Weiner Index of Diversity for
community ‘NDV’ (2.641) > ‘MDV’ (2.3851); and Simpson’s Index for ‘NDV’ (0.7238) > ‘MDV’ (0.6664), indicated
that the Morawane dam site was rather disturbed as compared to Natuwadi. It was, however, recommended
that there is need to improve and manage the habitat in the vicinity of Morawane dam.
Keywords: Bird diversity, Simpson’s Index, Sorenson’s Index, Shannon-Weiner Index.
1.0 Introduction: Diversity of avifauna is a very sensitive indicator of
degree of pollution in terrestrial as well as aquatic
ecosystem. In aquatic ecosystem, birds constitute
important group as they feed on vegetation, larvae,
insects, fishes and other animals living there in. In
the rapidly advancing era unlimited anthropogenic
activities tent to destruction of natural habitat,
thereby decreasing bird diversity. Day by day avian
foraging habitat and their nesting sites are getting
narrowed down due to deforestation activity at an
alarming rate for human welfare by overlooking
various key components in the ecosystem.
According to Manjunath and Joshi (2012)there are
approximately 9,990 bird species on our planet,
distributed in 29 orders, 195 families and 2113
genera. The order Passeriformes include 58% of all
extant bird species and among non-passerines, the
Apodiformes in the most diverse order, totaling
roughly 443 species, which is about 4% of the total
of world bird species. India beig a megadiversity
centre, harbours 1200 species of birds which
amounts 13% of the bird species of the world (9600
species)(Ali and Ripley, 1987) indicating rather good
ecological health of the country. Uneven distribution
of ecological pockets in India needs to be explored
by understanding regional avian diversity study.
Quality of natural habitat could be assessed with the
diversity of avifauna as an ecological indicator. In the
human intruded ecosystems avifaunal diversity has
been decreasing irrespective of their nature derived
roles in stabilizing ecosystems through pollination,
World Journal of Environmental Biosciences
43
Babar et al.
seed dispersal, pest control and scavenging waste. A
number of bird species are facing threat to their
existence (Newton et. al., 1986 and Ghosal, 1995).
Though all the birds are not aquatic they have to
visit frequently freshwater bodies to overcome
thrust. Therefore, adjoining natural areas of the
aquatic bodies are the best places to study diversity
of avifauna and to assess the community status
there in, which compelled authors to undertake the
present investigations.
Therefore, we selected vicinities of two freshwater
dams viz. Morawane (Chiplun Tehsil) and Natuwadi
(Khed Tehsil) embraced by the Western Ghats in
Ratnagiri district of Maharashtra. The status of
ecosystems at the Morawane and Natuwadi could
be assessed by calculating the Index of Species
Diversity as Shannon-Weiner Index, H = - Pi
log2Pi and Simpson’s Index, D = 1- Pi2
, that
gives more weight to the bird species common to
both the habitats, along with the Sorensen’s Index of
Similarity, ISs = 2C/(A+B) X 100. Such type of
community evaluation has not been done so far in
Ratnagiri district of Maharashtra; hence, the
attention was paid to the present study.
2.0 Materials and Methods: The present study was conducted from January 2012
to December 2012 in the vicinity of two manmade
medium sized reservoirs, namely, Morawane dam
(MDV) and Natuwadi dam (NDV) at Ratnagiri district
of Maharashtra, India. The Morawane site is located
at the Latitude 17032
’55
” N and the Longitude
73036
’40
” E; and Natuwadi at the Latitude 17
050
’00
”
N and the Longitude 73054
’00
” E. The avian survey
was conducted in 1 sq. km quadrates by monthly
visit to the study area.
Photo showing Morawane Dam and its vicinity
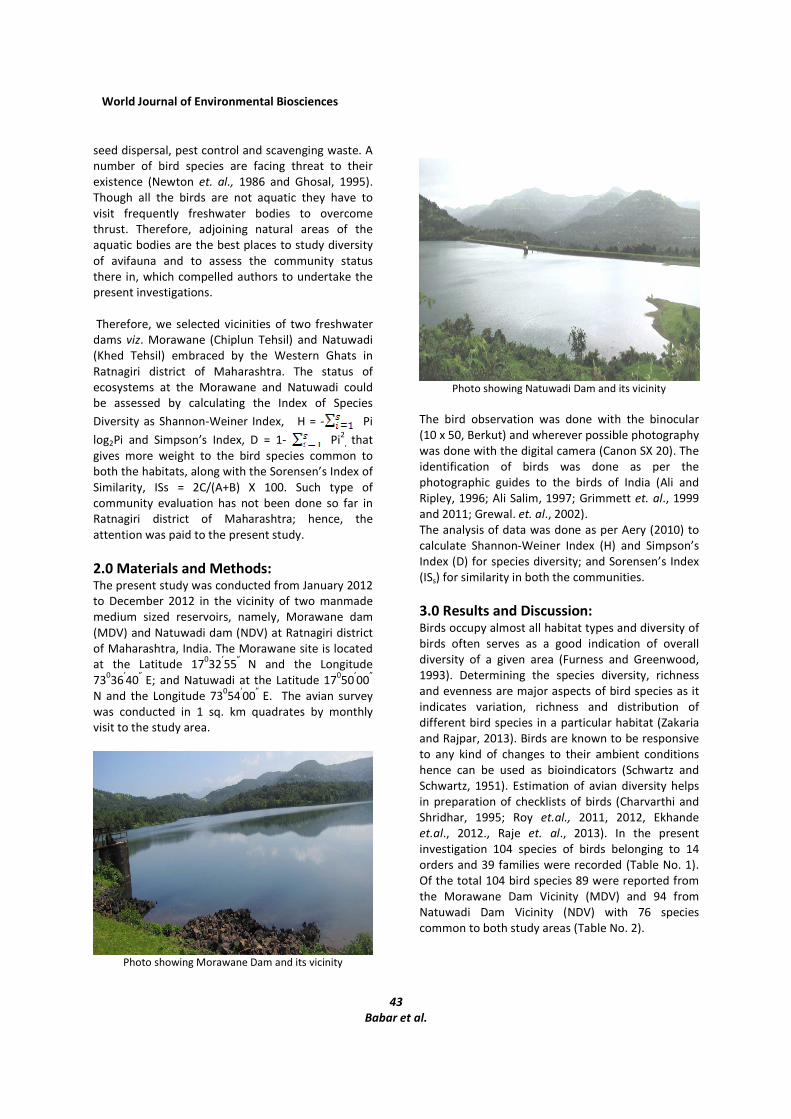
Photo showing Natuwadi Dam and its vicinity
The bird observation was done with the binocular
(10 x 50, Berkut) and wherever possible photography
was done with the digital camera (Canon SX 20). The
identification of birds was done as per the
photographic guides to the birds of India (Ali and
Ripley, 1996; Ali Salim, 1997; Grimmett et. al., 1999
and 2011; Grewal. et. al., 2002).
The analysis of data was done as per Aery (2010) to
calculate Shannon-Weiner Index (H) and Simpson’s
Index (D) for species diversity; and Sorensen’s Index
(ISs) for similarity in both the communities.
3.0 Results and Discussion: Birds occupy almost all habitat types and diversity of
birds often serves as a good indication of overall
diversity of a given area (Furness and Greenwood,
1993). Determining the species diversity, richness
and evenness are major aspects of bird species as it
indicates variation, richness and distribution of
different bird species in a particular habitat (Zakaria
and Rajpar, 2013). Birds are known to be responsive
to any kind of changes to their ambient conditions
hence can be used as bioindicators (Schwartz and
Schwartz, 1951). Estimation of avian diversity helps
in preparation of checklists of birds (Charvarthi and
Shridhar, 1995; Roy et.al., 2011, 2012, Ekhande
et.al., 2012., Raje et. al., 2013). In the present
investigation 104 species of birds belonging to 14
orders and 39 families were recorded (Table No. 1).
Of the total 104 bird species 89 were reported from
the Morawane Dam Vicinity (MDV) and 94 from
Natuwadi Dam Vicinity (NDV) with 76 species
common to both study areas (Table No. 2).

World Journal of Environmental Biosciences
44
Babar et al.
Manjunath et. al., (2005) recorded 42 species of
birds; 58 species of birds belonging to 9 orders and
29 families were recorded by Arun (2012); 117
species of birds belonging to 42 families by Roy et.
al. (2012); 58 species by Ekhande et. al., (2012); 102
species by Zakazria and Rajpar (2013) and 183
species belonging to 15 orders and 48 families by
Raje et. al., (2013). Passeriformes is the largest order
followed by Ciconniformes and Coraciformes with
total number of bird species 53, 15 and 8,
respectively. The maximum bird species (53)
belonging to 14 families of order Passeriformes were
reported in the present study (Table No. 1).
Out of total 89 species reported in MDV 49 (55.05%),
11 (12.35%) and 07 (7.86%) were from order
Passeriformes, Ciconiformes and Coraciformes,
respectively (Table No. 2), similar trend was
observed in NDV. Raje et. al., (2013) also reported 11
species of birds in each of family Accipitridae and
Ardeidae.
Samples of bird species from communities collected
at the same or different locations at different times
are always different (Colwell and Coddington, 1994;
Lande, 1996). Even parallel samples from the same
locality taken at the same time differ because many
species tend to be rare in the samples, so that their
presence is a stochastic event (Magurran, 2004). The
result of the present investigation well synchronizes
with the above findings as out of total 104 species of
birds 89 were reported from the MDV and 94 from
the NDV with 79 bird species common to both the
study areas. The study clearly indicated that there is
difference in the number of bird species belonging to
the study areas. This might be due to variations in
time of bird observations in two study areas and
seasonal variations accomplished with the changes
in availability of food.
Out of 14 Orders 8 Orders viz. Anseriformes,
Gruiformes, Turniciformes, Columbiformes,
Psittaciformes, Cuculiformes, Stringiformes and
Upupiformes showed 100% species similarity in MDV
and NDV with Sorenson’s Similarity Index 86.33%
(Table 2). Jayson and Mathew (2000) also reported
that out of 137 species recorded in the evergreen
forest of Salient valley and moist deciduous forest of
Mukkali, only 56 species were common to both the
sites. Of the three similarity indices computed by
them, Jaccard and Sorenson’s quantitative shows a
similarity above 40% and Sorenson’s Index shows a
similarity of 57% between Salient valley and Mukkali.
Rajan et. al., (2013) calculated Sorenson’s quotient
of similarity (Q/S), deciduous and scrubby area.
According to them the highest values of Q/S was
79.12%. Results pertaining to the Sorenson’s
similarity index of the present investigation revealed
that the two study areas, to some extent, have same
level of ecological condition.

World Journal of Environmental Biosciences
45
Babar et al.
Table No. 1: Bird Diversity in the vicinity of Morawane dam and Natuwadi dam during January 2012 to December 2012
Order
Family
Common and scientific
name of bird species
Status /
Occurrenc
e
Dam
Months
Jan Feb Ma
r
Apr Ma
y
June July Aug Sep
t
Oct No
v
Dec
1. GALLIFORMES
Phasianidae
Common Quail
Coturnix coturnix
RM, N M
N √ √
Jungle Bush Quail
Purdicula asiatica
R, O M √ √
N √ √
Red Spur fowl
Galloperdix spadicera
R, N M √ √
N √ √ √
Grey Jungle fowl
Gallus sonneratti
R, C M √ √
N √ √ √ √ √ √
Indian Peafowl
Pava cristatus
R, C M
N √ √ √
2. ANSERIFORMES
Dendrocygnid
ae
Lesser Whistling-duck
Dendrocygna javanica
R, O M √
N √
3. CICONIFORMES
Ardeidae
Indian Pond heron
Ardeola graii
R, C M √ √ √ √ √
N √ √
Grey Heron
Ardea cenerea
RM, C M
N √ √
Cattle Egret
Bubulcus ibis
RM, C M √ √ √ √
N √ √ √ √ √ √ √
Little Egret
Egreta garzetta
R, C M √ √ √ √
N √ √ √
Great Egret
Casmerodicus albus
RM, C M √ √
N √ √ √
Phalacrocoraci
dae
Little Cormorant
Phalacrocorax niger
RM, C M √ √ √ √
N √ √ √ √ √ √ √ √ √
Accipitridae
Black-winged Kite
Elanus caeruleus
R, C M √ √
N
Black Kite
Milvus migrans
R, C M
N √ √
Brahminy Kite
Haliastrus indus
R, C M √ √ √ √
N √ √ √

World Journal of Environmental Biosciences
46
Babar et al.
Crested Serpent Eagle
Spilornis cheela
R, C M √ √ √ √
N √ √ √ √
Crested Hawk Eagle
Nisaetus cirrhatus
R, C M √ √
N √ √
Shikra
Accipitor badius
R, C M
N √ √ √
Scolopacidae Common Sandpiper
Actitis hypoleucos
RM, C M √ √ √ √ √ √
N
Charadriidae
Red-wattled Lapwing
Vanellus indicus
R, C M √ √ √ √ √ √ √ √ √
N √ √ √ √ √
Laridae
River Tern
Sterna aurantia
R, O M
N √ √ √ √ √ √
4. GRUIFORMES
Rallidae
White-breasted Water
hen
Amaurornis
phoenicurus
R, C M √ √
N √ √
5. TURNICIFORMES
Turnicidae
Small button Quail
Turnix sylvaticus
R, N M √ √
N √ √
6. COLUMBIFORMES
Columbidae
Common Pigeon
Columba livia
R, C M √ √ √
N √ √ √
Yellow-footed Green
Pigeon
Treron phoenicopterus
R, C M √ √ √
N √ √
Emerald dove
Chalcophaps indica
R, O M √ √
N √ √
Spotted Dove
Stigmatopelia chinensis
R, C M √ √ √
N √ √ √ √
7. PSITTACIFORMES
Psittacidae
Rose – Ringed
Parakeet
Psittacula finschii
R, C M √ √ √
N √ √
8. CUCULIFORMES
Cuculidae
Jacobin Cuckoo (Pied)
Clamator jacobinus
RM, O M √ √
N √ √ √
Asian Koel
Eudynamys
scolopaceus
R, C M √ √ √
N √ √ √
Centropodidae Southern Coucal
Centropus parroti
R, C M √ √ √
N √ √ √

World Journal of Environmental Biosciences
47
Babar et al.
9. STRIGIFORMES
Strigidae
Indian Scops Owl
Otus bakkamoena
R, O M √ √
N √
Caprimulgidae
Jungle Nightjar
Cprimulgus indicus
RM, O M √
N √ √
Indian Nightjar
Caprimulgus asiaticus
R, C M √ √ √
N √ √
Hemiprocnida
e
Crested Tree Swift
Hemiprocne coronata
R, C M √ √ √
N √ √ √
Little Swift (House
swift)
Apus affinis
RM, C M √
N √ √
10. UPUPIFORMES
Upupidae
Common Hoopoe
Upupa epops
RM, C M √
N √
11. CORACIFORMES
Coracidae
Indian Roller
Coracias benghalensis
R, C M √ √
N
Halcyonidae
White Throated
Kingfisher
Halcyon smyrnesis
R,C M √ √ √ √
N √ √ √ √ √
Black Capped
Kingfisher
Halcyon pileata
R,O M √ √
N √ √
Alcediniae
Oriental Dwarf
Kingfisher
Ceyx erithaca
R, O M √ √ √
N √ √ √
Blue-eared Kingfisher
Alcedo meninting
R, C M
N √ √ √ √
Common Kingfisher
Alcedo atthis
R, C M √ √ √ √ √ √
N √ √ √
Cerylidae
Pied Kingfisher
Ceryle rudis
R, C M √ √ √ √ √ √ √ √
N √ √ √
Meropidae
Green Bee-eater
Merops orientalis
R, C M √ √
N √
12.BUCEROTIFORME
S
Indian Grey Hornbill
Ocyceros birostris
R, R M
N √ √ √
Malabar Pied Hornbill
Anthracoceros
R, C M
N √ √ √ √ √ √ √ √

World Journal of Environmental Biosciences
48
Babar et al.
coronatus
13. PICIFORMES
Megalaimidae
Brown Headed Barbet
Megalaima Zeylanica
R, C M
N √ √ √ √
White-cheeked Barbet
Megalaima viridis
R, R M √ √
N √ √ √
Coppersmith Barbet
Megalaima
haemacephala
R, C M √ √ √
N √ √ √ √
Picidae
Lesser Goldenback
Dinopium benghalense
R, C M
N √ √
14. PASSERIFORMES
Pittidae
Indian Pitta
Pitta brachyura
R, C M √ √ √
N √ √ √
Lanidae
Bay- backed Shrike
Lanius vittatus
R, O M √
N √ √
Corvidae
Common Iora
Aegithina tiphis
R, C M √ √
N √ √ √
White- bellied Drongo
Dicrurus caerulescens
R, O M √ √
N √ √ √
Black Drongo
Dicrurus macrocercus
R, C M √ √
N √ √ √ √
Indian Golden Oroile
Oriolus kundoo
RM, C M √ √ √
N
Black-hooded Oriole
Oriolus xanthornus
R, C M √ √ √
N √ √ √
White-spotted Fantail
Rhipidura albogularis
R, C M √ √
N √ √ √
White browed Fantail
Rhipidura aureola
R, N M √ √ √
N √ √ √
Asian Paradise-
flycatcher
Terspiphone paradisi
RM, C M √
N √ √ √
Black-naped Monarch
Hypothymis azurea
R, C M
N √ √
Rufous Treepie
Dendrocitta vagobunda
R, C M √ √ √
N √ √ √ √ √
Indian Jungle Crow
Corvus culminatus
R, C M √ √ √
N √ √ √ √

World Journal of Environmental Biosciences
49
Babar et al.
House Crow
Corvus spendens
R, C M √ √ √ √ √
N √ √ √
Hirundinidae
Dusky Crag Martin
Ptyonoprogne concolor
R, C M √ √
N √ √ √ √
Wire-tailed Swallow
Hirundo smitti
R, C M √
N √ √ √ √ √ √ √ √ √ √ √ √
Red-rumped Swallow
Cecropis daurica
RM, C M √ √ √ √ √ √
N √ √ √ √ √ √
Alaudidae
Rufous-tailed Lark
Ammomanes
phoenicura
R, C M √ √
N √ √ √ √
Pycnonotidae
Red-whiskered Bulbul
Pycnonotus jocosus
R, C M √ √ √
N √ √ √
Red-vented Bulbul
Pycnonotus cafer
R, C M √ √ √ √ √ √ √ √
N √ √ √ √ √ √ √ √
Cisticolidae
Jungle Prinia
Prinia sylvatica
R, C M √ √
N √ √
Ashy Prinia
Prinia prinia
R, C M √ √
N √ √ √
Plain Prinia
Prinia inornata
R, O M √ √
N √ √
Sylviidae
Common Tailor bird
Orthotomus sutorius
R, C M √
N √ √ √
Common Babbler
Turdoides caudata
R, C M √ √
N √ √ √
Large Grey Babbler
Turdoides malcolmi
R, C M √
N √ √ √
Jungle Babbler
Turdoides striata
R, C M √ √ √ √
N √ √ √ √ √ √
Zosteropidae
Oriental White- eye
Zosterops palpebrosus
R, C M
N √
Sturnidae
Jungle Myna
Acridotheres fuscus
R, C M √ √ √ √
N √ √ √ √
Common Myna
Acridotheres tristis
R, C M √ √ √ √
N √ √ √
Brahminy Starling R, O M √ √

World Journal of Environmental Biosciences
50
Babar et al.
Staurnia pagodarum N √ √
Rosy Starling
Paster roseus
M, O M √ √ √ √ √
N
Muccicapidae
Orange-headed Thrush
Zoothera citrina
RM, O M √ √ √ √
N √ √ √ √
Eurasian Blackbird
Turdus merula
RM, C M √ √ √
N √ √ √
Oriental Magpie Robin
Copsychus saularia
R, C M √ √ √
N √ √ √
Indian Robin
Saxicoloides fulicatus
R, C M √ √ √
N √ √ √
Tickells Blue Flycatcher
Cyornis tickelliae
R, C M √ √
N √ √
Irenidae
Jerdens Leafbird
Chloropsis jerdoni
R, O M √
N √ √
Nectariniidae
Pale-billed
Flowerpecker
Dicaeum
erythrorhynchos
R, C M √
N √ √
Purple-rumped
Sunbird
Leptocoma zeylonica
R, C M
N √ √
Crimson-backed
Sunbird
Leptocoma minima
R, C M √ √ √
N √ √
Purple Sunbird
Cinnyris asiaticus
R, C M √ √ √
N
Loten’s Sunbird
Cinnyris lotenia
R, O M √ √ √
N √ √
Crimson Sunbird
Aethopyga siparaja
R, C M
N √ √
Passeridae
House Sparrow
Passer domesticus
R, C M √ √ √ √
N √ √ √
Baya Weaver
Ploceus philippinus
R, C M √ √ √
N √ √
Indian Silverbill
Euodice malabarica
R, C M √ √
N

World Journal of Environmental Biosciences
51
Babar et al.
White-rumped Munia
Lonchura striata
R, C M √ √ √ √
N √ √ √
Scaly-breasted Munia
Lonchura punctulata
R, C M √ √
N
Black-headed Munia
Lonchura malcca
R, O M √ √ √
N √ √
Yellow Wagtail
Motacilla flava
RM, C M √
N
White-browed Wagtail
Motacilla
maderaspatensis
R, C M √ √ √ √ √ √
N √ √ √ √ √ √
Paddy field Pipit
Anthus rufulus
R, C M √ √ √
N
# M: Morawane dam vicinity; N: Natuwadi dam vicinity. * Status: - R: Resident, RM: Resident migrant, M: Migratory, @ Occurrence: - C:
Common, O: Occasional, R: Rare,
Table 2: Order wise distribution of bird species in MDV and NDV during January 2012 to December 2012 with Sorensen’s Similarity Index (ISs).
Order
Total No. of
species
Species reported in
Species
common to
‘MDV’ & ‘NDV’
ISs
(%)
MDV NDV
Galliformes 05 03 05 03 75%
Anseriformes 01 01 01 01 100%
Ciconiformes 15 11 13 09 75%
Gruiformes 01 01 01 01 100%
Turniciformes 01 01 01 01 100%
Columbiformes 04 04 04 04 100%
Psittaciformes 01 01 01 01 100%
Cuculiformes 03 03 03 03 100%
Strigiformes 05 05 05 05 100%
Upupiformes 01 01 01 01 100%
Coraciformes 08 07 07 06 85.71%
Bucerotiformes 02 00 02 00 -
Piciformes 04 02 04 02 66.66%
Passeriformes 53 49 46 42 88.42%
104 89 94 79 86.33%

World Journal of Environmental Biosciences
52
Babar et al.
Table 3: Order wise Shannon-Weiner Index (H) and Simpson’s Index (D) for bird diversity in MDV and NDV.
Order Total
No. of
species
MDV NDV
Pi Pi2 H D Pi Pi
2 H D
Galliformes 05 0.6 0.36 0.4422 0.64 1 1 0 0
Anseriformes 01 01 1 0 0 1 1 0 0
Ciconiformes 15 0.7334 0.5378 0.3281 0.4622 0.8666 0.7510 0.1790 0.249
Gruiformes 01 01 0 0 0 01 1 0 0
Turniciformes 01 01 0 0 0 01 1 0 0
Columbiformes 04 01 0 0 0 01 1 0 0
Psittaciformes 01 01 0 0 0 01 1 0 0
Cuculiformes 03 01 0 0 0 01 1 0 0
Strigiformes 05 01 0 0 0 01 1 0 0
Upupiformes 01 01 0 0 0 01 1 0 0
Coraciformes 08 0.875 0.7656 0.1686 0.2344 0.875 0.7656 0.1686 0.2344
Bucerotiformes 02 0 0 0 0 1 1 0 0
Piciformes 04 0.5 0.25 0.5 0.75 1 1 0 0
Passeriformes 53 0.9245 0.8547 0.1047 0.1453 0.8679 0.7533 0.1774 0.2467
Table 4: Species wise Shannon-Weiner Index (H) and Simpson’s Index (D) in ‘MDV’ and ‘NDV’.
Sr.
No.
MDV NDV
Pi Pi2 Pilog2Pi ‘H’/ ‘D’ Pi Pi
2 Pilog2Pi ‘H’/ ‘D’
1 0.03371 0.001136 -0.1649 H =
-ΣPilog2Pi
H=2.3851
0.05319 0.00283 -0.2251 H =
-ΣPilog2Pi
H= 2.641
2 0.01124 0.000126 -0.0728 0.01064 0.0001132 -0.0697
3 0.1236 0.0153 -0.3728 0.13829 0.019124 -0.3947
4 0.01124 0.000126 -0.0728 0.01064 0.0001132 -0.0697
5 0.01124 0.000126 -0.0728 0.01064 0.0001132 -0.0697
6 0.0445 0.00198 -0.1998
D = 1- Σ Pi2
D= 1 -
0.336
D=0.6664
0.04255 0.001958 -0.1938
D = 1- Σ Pi2
D= 1 -0.2762
D=0.7238
7 0.01124 0.000126 -0.0728 0.01064 0.0001132 -0.0697
8 0.03371 0.001136 -0.1649 0.03191 0.001018 -0.1585
9 0.05618 0.003156 -0.2334 0.05319 0.00283 -0.2251
10 0.01124 0.000126 -0.0728 0.01064 0.0001132 -0.0697
11 0.07865 0.006186 -0.2885 0.07446 0.00554429 -0.2790
12 00 00 - 0.02128 0.0004528 -0.1182
13 0.02247 0.000504 -0.1230 0.04255 0.001958 -0.1938
14 0.5510 0.3036 -0.4738 0.4899 0.24 -0.5043
Σ Pi2
= 0.3336
ΣPilog2Pi
= -2.3851
Σ Pi2
= 0.2762
ΣPilog2Pi
= -2.641

World Journal of Environmental Biosciences
53
Babar et al.
Fig. 1: Orderwise distribution of number of bird species in MDV and NDV during study period.
Order wise Shannon-Weiner Indices for bird diversity
gives rather broader sense of order wise distribution
of bird species along with dominant order
supporting status of habitat and nature of
vegetation in there. But efforts have not been taken
by researchers to correlate order wise bird diversity
with the habitat status. In the present investigation
order wise Shannon-Weiner Indices were 0.51 for
Piciformes followed by 0.4422 for Galliformes and 0.
3281 for Ciconiformes; where as in the NDV they
were 0.1790 for the order Ciconiformes followed by
0.1774 for Passeriformes and 0.1686 for
Coraciformes. The order wise Shannon-Weiner
Indices for the bird diversity in both the study areas
were well supported by Simphson’s Indices by
following similar trend (Table 3). The order wise
Simpson’s Indices (D) were 0.75 for Piciformes
followed by 0.64 for Galiformes and 0.4622 for
Ciconiformes in the MDV; where as it was 0.249 for
Ciconiformes followed by 0.2467 for Passeriformes
and 0.2344 for Coraciformes (Table 3).
The above findings clearly indicated that order
Piciformes is dominant in MDV where as order
Ciconiformes is dominant in the NDV. In the MDV
dominant order Piciformes includes two families
such as Megalaimidae and Picidae. Brown Headed
Barbet, White-chicked Barbet, Copper-smith Barbet
and Lesser Golden-back are the common bird
species of the families that prefer woody forest
habitat, which is the characteristic feature of MDV
lying in the heart of the Western Ghats. In the NDV
Waders and Cormorants from families Ardidae,
Scolopacidae, Phalacrocoracidae, Charadriidae and
Laridae are very common hence the Birds of prey,
belonging to family Accipitredae, like Brahmany Kite,
Crested Serpent Eagle, and Crested Hawk Eagle and
others have occupied the habitat. This might be due
to comparatively more open water area, less dense
vegetation and rather away from the Western Ghats.
The species wise Shannon-Weiner Index in MDV was
2.3851 and that for NDV was 2.641 where as the
Simpson’s Index for species diversity in MDV was 0.
6664 and that for NDV was 0.7238 (Table 4). Jayson
and Mathew (2000) reported Shannon-Weiner Index
for Salient valley (3.30) and Mukkali (3.45) along
with Simpson’s Index 0.07 and 0.06, respectively.
According to Sharat et. al., (2011) the Shannon-
Weiner diversity index is higher in non human
habitat (H=3.098) than human habitat (H= 2.823).
Utpal et. al., (2012) also calculated Shannon-Weiner
diversity index 3.86, 2.84 and 3.64 from GNP, BTR
and RBWC, respectively. Their results of Shannon-
Weiner diversity index well synchronized with the
Simpson’s index, 0.97, 0.88 and 0.96 for GNP, BTR
and RBWC, respectively. Shannon-Weiner index for
bird diversity changes from season to season.
Ekhande et. al., (2012) reported rather higher values
of Shannon-Weiner index (3.5) during winter as
compared to monsoon (2.4) for the birds at the
Yashwant Lake. Our results are further supported by

World Journal of Environmental Biosciences
54
Babar et al.
the work of Rajan et. al., (2013), wherein they
reported H=3.86 at mixed deciduous forest and
H=3.17 at cultivated area. They further reported
greater Simpson’s index (0.067) for cultivated area
and lowest (0.027) for mixed deciduous forest.
Monthly variations in the Shannon-Weiner diversity
index have been reported by Hailenmariam et. al.,
(2013). According to them there was more species
diversity (H=2.89) in December and less (H=0.5) in
November in the selected Church forests in Ethiopia.
Conclusion: The Shannon-Weiner Index and the Simpson’s
diversity index for the bird diversity at NDV were
greater than MDV, indicating that the NDV is
comparatively better than the MDV, where habitat
improvement and management is required. The
variation in species diversity at two study areas may
be due to difference in availability of food to the
birds, nesting sites, changes in climatic conditions
and consequent emigration and immigration.
References: 1) Ali, S. and Repley, S. D. (1987): A compact Handbook
of the Birds of India and Pakistan, Secons Edition.
Oxford University Press, Delhi, 737 pp.
2) Ali, Salim and Ripley, S. D. (1996): A Pictorial Guide
to the Birds of the Indian Subcontinent, BNHS,
Oxford University Press, Mumbai.
3) Ali, Salim (1997): The Book of Indian Birds, BNHS,
Oxford University Press, Mumbai.
4) Arey N. C. (2010): Manual of environmental analysis.
Ane Books Pvt. Ltd. New Delhi.
5) Arun, M. Chilke (2012): Avian diversity in and around
Bamanwada Lake of Rajura, District Chandrapur
(Maharastra), Annals of Biological Research, 3 (4):
2014-2018.
6) Charavarthy, A. K. and Sridhar, S. (1995): Bird
diversity and conservation. Ornithology Society of
India, Bangalore.
7) Colwell, R. K. and Coddington, J. A. (1994):
Estimating terrestrial biodiversity by extrapolation. –
Phil. Trans. R. Soc. B, (345): 101-118.
8) Ekhande, A. P., Patil, J. V. and Padate, G. S. (2012):
Study of birds of Yashawant lake with respect to
densities, species richness and Shannon-Weiner
indices and its correlation with lake dynamics.
European Journal of Zoological Research, 1 (1): 6-15.
9) Furness, R. W. and Greenwood J. J. D. (1993): Bird as
Monitor of Environmental Change. Chapman and
Hall, London.
10) Ghosal D. N. (1995): Avifauna of conservation areas,
No. 7, Fauna of Kanha Tiger Reserve. Zoological
Survey of India (ZSI), pp. 63-91.
11) Grewal, B., Harvey, B. and Pfister, O. (2002): A
Photographic Guide to the Birds of India, Periplus
Edition, (HK) Ltd.
12) Grimmett, R., Inskipp, C. and Inskipp, T. (1999):
Pocket guide to the Birds of the Indian Subcontinent
(1st
Ed.), Oxford University Press, New Dehli.
13) Grimmett, R., Inskipp, C. and Inskipp, T. (2011): Birds
of the Indian Subcontinent (2nd
Ed.), Oxford
University Press, London (UK).
14) Hailenmariam, Areayn, Meheretu Yonas and
Tsegazeabe Hadush Haileselasie (2013): Community
composition and abundance of residential birds in
selected forests, Tigray Region, Northern Ethiopia.
Scientific Research and Essays, 8 (22) pp. 1038-1047.
15) Jayson, E. A. and D. N. Mathew (2000): Diversity and
species-abundance distribution of birds in the
Tropical forests of Silent Valley, Kerala. Journal,
Bombay Natural History Society, 97 (3): 390-399.
16) Lande, R. (1996): Statistics and partitioning of
species diversity and similarity among multiple
communities. – Oikos, 76: 5-13.
17) Magurran, A. E. (2004): Measuring biological
diversity. – Blackwell.
18) Manjunath and Joshi Bhaskar (2012): Avifaunal
diversity in Gulbarga region, North Karnatak.
Recent Research in Science and Technology, 4(7):
27-34.
19) Manjunath, P., Subbarao P. and Bhat H. (2005):
Water bird diversity at the tank of North Bangalore.
In: Proc. Of the national seminar on bird ecology
and conservation (Eds: A. Vergese, S. Sridhar, A. K.
Chakravarthy, H. R. Bhat, K. P. Karanth). Bangolore,
Nov. 12-13. Pp. 97-99.
20) Newton P. N., S. Brudin and J. Guy (1986): The birds
of Kanha Tiger Reserve, M. P., India, J. Bom. Nat.
Hist. Society, 83 (3) 977-998.
21) Rajan, S., D.N. Kour, F. Ahmad and D. N. Sahi
(2013): Species diversity, relative abundance and
habitat use of the bird communities of Tehsil
Chenani, District Udhampur, Jammu and Kashmir,
India. Indian J.L.Sci. 2 (2): 81-90.
22) Raje, G. B., H. T. Babar, S. S. Waghmode and Sachin
Palkar (2013): Bird diversity in Chiplun Town (M.S.),
Current Trends in Life Science, 81-92; Lambert
Academic Publishing Gmbh and Co.KG. Germany.
23) Roy, U. S., A. Pal, P. Banerjee and S. K.
Mukhopdhyay (2011): Comparison of avifaunal
diversity in and around Neora Valley National Park,

World Journal of Environmental Biosciences
55
Babar et al.
West Bengal, India. Journal of Threatened Taxa. 3
(10): 2136-2142.
24) Schwartz, C. W. and Schwartz E. R. (1951): An
ecological reconnaissance of the pheasants of
Hawaii. Auk. 68: 281-314.
25) Sharat, K. P., A. V. Ponkshe and U. Dhar (2011):
Habitat enrichment and its impact on avian
diversity: A study at GBPIHED, Kosi-Katermal,
Uttarakhand, India. Current Science, 100 (11): 1681-
1689.
26) Utpal, S. Roy., P. Banerjee and S. K. Mukhopadhyay
(2012): Study of avifaunal diversity from three
different regions of North Bengal, India, Asian
Journal of conservation Biology. 1 (2): Pp. 120-129.
27) WWW. Wikipedia. Org
28) Zakaria, M. and M. N. Rajpar (2013): Density and
diversity of water birds and Terrestrial birds in
Man-made Marsh, Malaysia. Sains Malaysiana. 42
(10): 1483-1492.