Embed Size (px)
Citation preview

Monetary costs of agitation in olderadults with Alzheimer’s disease in theUK: prospective cohort study
Stephen Morris,1 Nishma Patel,1 Gianluca Baio,2 Lynsey Kelly,3
Elanor Lewis-Holmes,3 Rumana Z Omar,2 Cornelius Katona,3 Claudia Cooper,3
Gill Livingston3
To cite: Morris S, Patel N,Baio G, et al. Monetary costsof agitation in older adultswith Alzheimer’s disease inthe UK: prospective cohortstudy. BMJ Open 2015;5:e007382. doi:10.1136/bmjopen-2014-007382
▸ Prepublication history andadditional material isavailable. To view please visitthe journal (http://dx.doi.org/10.1136/bmjopen-2014-007382).
Received 5 December 2014Revised 11 February 2015Accepted 13 February 2015
For numbered affiliations seeend of article.
Correspondence toProfessor Stephen Morris;[email protected]
ABSTRACTObjective: While nearly half of all people withAlzheimer’s disease (AD) have agitation symptomsevery month, little is known about the costs of agitationin AD. We calculated the monetary costs associatedwith agitation in older adults with AD in the UK from aNational Health Service and personal social servicesperspective.Design: Prospective cohort study.Setting: London and the South East Region of the UK(LASER-AD study).Participants: 224 people with AD recruited betweenJuly 2002 and January 2003 and followed up for54 months.Primary and secondary outcome measures: Theprimary outcome was health and social care costs,including accommodation costs and costs of contactswith health and social care services. Agitation wasassessed using the Neuropsychiatric Inventory (NPI)agitation score.Results: After adjustment, health and social care costsvaried significantly by agitation, from £29 000 over a1 year period with no agitation symptoms (NPI agitationscore=0) to £57 000 at the most severe levels ofagitation (NPI agitation score=12; p=0.01). The meanexcess cost associated with agitation per person withAD was £4091 a year, accounting for 12% of the healthand social care costs of AD in our data, and equating to£2 billion a year across all people with AD in the UK.Conclusions: Agitation in people with AD represents asubstantial monetary burden over and above the costsassociated with cognitive impairment.
INTRODUCTIONThe monetary cost of dementia is huge, withan estimated global burden in 2010 of US$604 billion incurred by health (16% of thetotal) and social care (42%) services andinformal care (42%).1 Around 70% of world-wide costs occur in North America andWestern Europe1; estimates for the UK showthat the total monetary cost of dementia in2014 was £26 billion.2 Alzheimer’s disease
(AD) is the most common form of dementia,accounting for around 62% of cases.2
Nearly half of all people with AD have agi-tation symptoms every month.3 These arepositively correlated with institutionalisation,4
pharmacological treatment and use ofmedical services,3 but there is no evidenceon the costs of agitation in people withAD.5 6 The aim of this paper is to calculatethe monetary costs associated with agitationin AD.
METHODSParticipantsWe calculated National Health Service(NHS) and personal social services (PSS)costs associated with different levels of agita-tion using data from a naturalistic prospect-ive cohort study of people with AD, covering
Strengths and limitations of this study
▪ This study used detailed, prospectively collectedhealth and social care resource use data plusdata on frequency and severity of agitation symp-toms over a 54-month period to calculate thecosts of agitation in people with Alzheimer’sdisease (AD).
▪ There is no previous evidence about the cost ofagitation in AD, even though nearly half of allpeople with AD have agitation symptoms everymonth; this study calculated that the meanexcess cost associated with agitation per personwith AD was £4091 a year.
▪ A limitation of the study is that it is based on arelatively small data set of 224 people, recruitedto be representative of those with AD betweenJuly 2002 and January 2003 and followed up to54 months.
▪ We did not include the costs of informal care;these data were not collected and UK guidelinesfor undertaking economic evaluations recom-mend taking a health and social care perspectivewhen measuring costs.
Morris S, et al. BMJ Open 2015;5:e007382. doi:10.1136/bmjopen-2014-007382 1
Open Access Research
on February 17, 2022 by guest. P
rotected by copyright.http://bm
jopen.bmj.com
/B
MJ O
pen: first published as 10.1136/bmjopen-2014-007382 on 13 M
arch 2015. Dow
nloaded from
on February 17, 2022 by guest. P
rotected by copyright.http://bm
jopen.bmj.com
/B
MJ O
pen: first published as 10.1136/bmjopen-2014-007382 on 13 M
arch 2015. Dow
nloaded from
on February 17, 2022 by guest. P
rotected by copyright.http://bm
jopen.bmj.com
/B
MJ O
pen: first published as 10.1136/bmjopen-2014-007382 on 13 M
arch 2015. Dow
nloaded from
on February 17, 2022 by guest. P
rotected by copyright.http://bm
jopen.bmj.com
/B
MJ O
pen: first published as 10.1136/bmjopen-2014-007382 on 13 M
arch 2015. Dow
nloaded from
on February 17, 2022 by guest. P
rotected by copyright.http://bm
jopen.bmj.com
/B
MJ O
pen: first published as 10.1136/bmjopen-2014-007382 on 13 M
arch 2015. Dow
nloaded from
on February 17, 2022 by guest. P
rotected by copyright.http://bm
jopen.bmj.com
/B
MJ O
pen: first published as 10.1136/bmjopen-2014-007382 on 13 M
arch 2015. Dow
nloaded from
on February 17, 2022 by guest. P
rotected by copyright.http://bm
jopen.bmj.com
/B
MJ O
pen: first published as 10.1136/bmjopen-2014-007382 on 13 M
arch 2015. Dow
nloaded from
on February 17, 2022 by guest. P
rotected by copyright.http://bm
jopen.bmj.com
/B
MJ O
pen: first published as 10.1136/bmjopen-2014-007382 on 13 M
arch 2015. Dow
nloaded from
on February 17, 2022 by guest. P
rotected by copyright.http://bm
jopen.bmj.com
/B
MJ O
pen: first published as 10.1136/bmjopen-2014-007382 on 13 M
arch 2015. Dow
nloaded from
on February 17, 2022 by guest. P
rotected by copyright.http://bm
jopen.bmj.com
/B
MJ O
pen: first published as 10.1136/bmjopen-2014-007382 on 13 M
arch 2015. Dow
nloaded from
on February 17, 2022 by guest. P
rotected by copyright.http://bm
jopen.bmj.com
/B
MJ O
pen: first published as 10.1136/bmjopen-2014-007382 on 13 M
arch 2015. Dow
nloaded from

the London and the South East Region of the UK(LASER-AD study).3 7–9 Two hundred and twenty-fourpeople were recruited between July 2002 and January2003 and followed up to 54 months. The cohort was pur-posively and prospectively recruited, using overall figuresfrom a review of the epidemiology of AD, to be a repre-sentative sample of people with AD in terms of sex,living setting and severity of cognitive impairment in thecommunity.9 Participants and their carers wereapproached through local community mental healthteams, dementia specialist nurses, the voluntary sector,memory clinics, nursing and residential homes, day hos-pitals, day centres and inpatient units. Written informedconsent was obtained from all carers. Where the personwith AD lacked capacity to consent, the study only pro-ceeded if the carer consented and thought the personthey cared for would have agreed to participate if theycould. Measures were collected at baseline, and 18, 30,42 and 54 months after baseline. Data were obtainedfrom interviews with the patients with AD and theircarers, carried out at a place of their choice. They wereconducted by trained, experienced health professionals,and were terminated if the interviewee became dis-tressed or appeared to want to stop.
MeasuresThe Neuropsychiatric Inventory (NPI) uses responsesfrom caregivers in a structured interview format to assess10 behavioural domains (delusions, hallucinations, agita-tion, dysphoria, anxiety, apathy, irritability, euphoria, dis-inhibition, aberrant motor behaviour);10 two additionaldomains (night-time behavioural disturbance, appetite/weight changes) are commonly added, giving 12domains in total.11 Within each domain, behaviours arerated by caregivers in terms of frequency (1=occasionally—less than once per week, 2=often—about once perweek, 3=frequently—several times per week but less thanevery day, 4=very frequently—once or more per day)and severity (1=mild, 2=moderate, 3=severe). A score foreach domain is calculated as the product of the fre-quency and severity scores, giving nine possible values(0, 1, 2, 3, 4, 6, 8, 9, 12), including no symptoms (=0).A score >3 on any domain is usually regarded as clinic-ally significant.3 12–14 A total NPI score is obtained bysumming all the individual domain scores across the 12domains, giving a range from 0 to 144. Agitation wasassessed at each time point in the LASER-AD studyusing the agitation domain of the NPI, with highervalues indicating more severe levels of agitation.
Resource use and costingResource use was measured using the Client ServiceReceipt Inventory, amended for use with older people15
and collected from participant responses and caregiverreports for the previous 3 months at each time point.This incorporated information on where the person wasliving (at home, residential respite care, day respite care,residential care home (where staff typically do not have
nursing qualifications), nursing care home, shelteredhousing with a warden in the premises during the day,hospital awaiting placement), and their contacts withhealth and social care services (general practitioner(GP), practice nurse at the GP surgery, district nurse atthe person’s home, dietician, community psychiatricnurse, home help, meals on wheels, physiotherapist,chiropodist, optician, dentist, audiologist, psychologist,psychiatrist, day centre, hospital outpatient visits andinpatient stays). We did not include the costs of informalcare—these data were not collected; we focused onhealth and social care costs, which is the costing per-spective recommended in economic analyses in theUK.16 We applied unit costs from routine sources17 18 in2011 UK£ and calculated 3-month costs for each partici-pant at each follow-up point. Three-month costs weremultiplied by 4 to create 12-month figures.
Statistical analysesWe calculated unadjusted mean and median 12-monthcosts by NPI agitation score (≤3, >3) and examinedbetween-group differences using one-way analysis of vari-ance (ANOVA), and the Mann-Whitney two-sample test.We examined associations between NPI agitation scoreand demographic variables, coexisting conditions andcognitive impairment using χ2 tests. We calculateddescriptive statistics for caregivers, who assessed beha-viours using the NPI and recorded resource use. We cal-culated unadjusted mean and median 12-month costs byindividual NPI agitation score and tested for significantdifferences using one-way ANOVA with Bonferroni cor-rection for multiple tests, and χ2 tests on the equality ofmedians. Use of health and social services amongpeople with AD who are agitated may be affected by theextent of cognitive decline, demographic factors andcomorbidities; to isolate the costs associated with agita-tion, we ran analyses adjusting for these factors. Toaccount for skewness of the cost data, we used a general-ised linear model with γ family and log link,19 adjustingfor gender and age (using five 10-year bands) at base-line, marital status (6 categories), ethnic group (9 cat-egories), highest level of education (5 categories),previous employment (9 categories), rurality (2 categor-ies), coexisting conditions (diabetes, stroke, hyperten-sion, heart disease), total NPI agitation score (in ourdata the range of scores was 0–82 with 66 unique values;we included categorical indicators for each score, includ-ing 66 categories in total), cognitive impairment (mea-sured using the Mini-Mental State Examination;20 31categories), and follow-up point (baseline, 18, 30, 42,54 months). We also considered using log Normal,Gaussian, inverse Gaussian and negative binomial distri-butions, but the γ model gave the best fit in terms ofresidual plots and the Akaike Information Criterion. Weadjusted for clustering for repeated measures by partici-pant using clustered sandwich estimators for the SE thatallowed for intragroup correlation within participants.We predicted 12-month health and social care mean
2 Morris S, et al. BMJ Open 2015;5:e007382. doi:10.1136/bmjopen-2014-007382
Open Access
on February 17, 2022 by guest. P
rotected by copyright.http://bm
jopen.bmj.com
/B
MJ O
pen: first published as 10.1136/bmjopen-2014-007382 on 13 M
arch 2015. Dow
nloaded from

costs by NPI agitation score, controlling for the covari-ates. The differences in adjusted means were testedusing Wald tests. In intervention studies, outcomes aresometimes measured in terms of change in NPI agita-tion scores, so we re-ran the analyses including NPI agi-tation scores as a linear term rather than categoricalindicators.
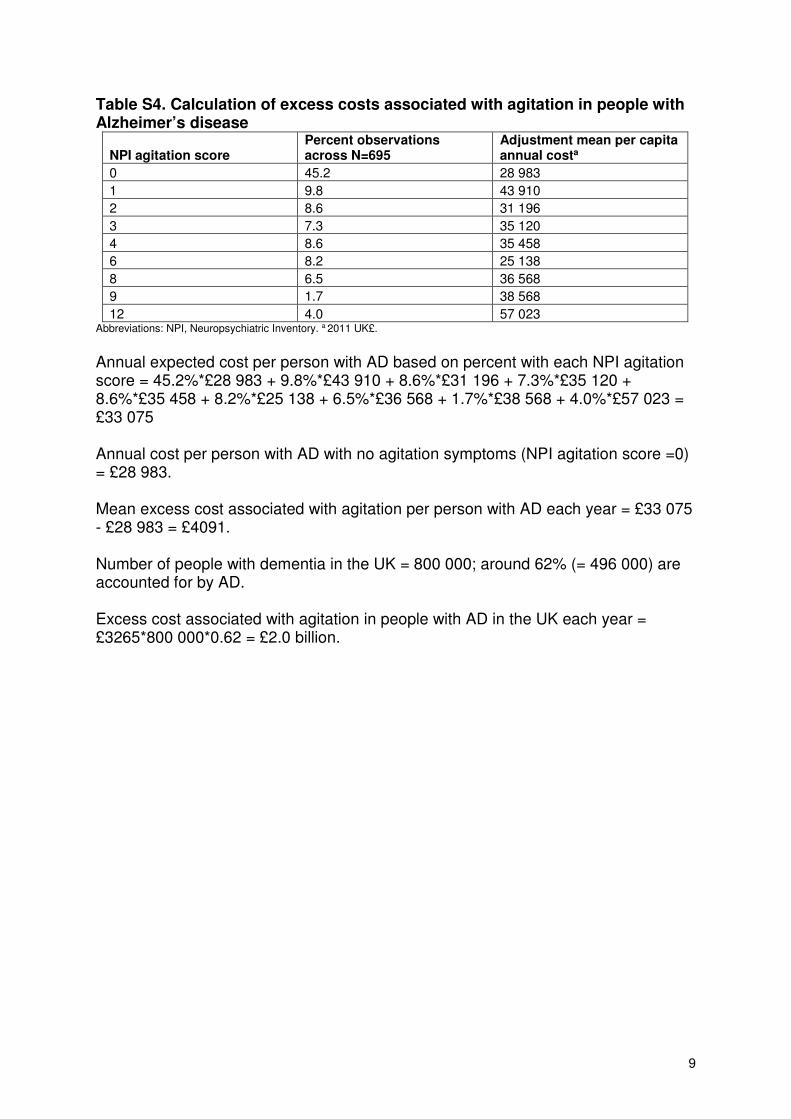
Excess costs associated with agitationWe combined the adjusted annual costs per person atdifferent levels of NPI agitation score with prevalencerates in the LASER-AD study to calculate the annualexpected cost per person with AD based on the per centwith each NPI agitation score. From this, we subtractedthe adjusted annual costs per person with no agitationsymptoms (NPI score=0) to estimate the mean excesscosts associated with agitation per person each year. Wealso calculated UK-specific excess costs of agitationbased on the prevalence of AD in the UK.
RESULTSBaseline characteristics of caregiversThe mean age of caregivers (SD) was 63 years (14 years).Most caregivers were female (69%), married (69%), hadno children living at home (75%) and were living withthe person with AD (56%; see online supplementarytable S2). The modal relationship to the person with ADwas ‘Child’ (35%).
Health and social care costs associated with agitationOf the 224 participants in the LASER-AD study, 111 haddied by 54 months; our data set had 695 data points(person follow-ups). We applied unit costs to theresource use data in the LASER-AD study (see onlinesupplementary table S1). Unadjusted mean (SD) percapita annual costs for participants with NPI agitationscore ≤3 and >3 were £27 752 (£38 413) and £38 910(£46 150; p<0.001, table 1). Median (IQR) values were£24 796 (£3512–£38 656) and £28 492 (£11 680–£40 164;p=0.001). Cost data were highly skewed (see onlinesupplementary figure S1). The mode and median NPIagitation score were 0 and 1, respectively (table 2).Table 1 shows the per cent of the sample with differentdemographic variables, coexisting conditions and cogni-tive impairment by NPI agitation score. People with agi-tation scores >3 had a higher mean and median totalNPI score, were more likely to be single and divorcedand less likely to be married, less likely to be educatedto secondary level and more likely to be educated to ter-tiary level, more likely to have heart disease, and morelikely to have severe cognitive impairment (p<0.05).Unadjusted mean and median costs increased with
agitation score (p≤0.001; table 2).After adjusting for demographic variables, coexisting
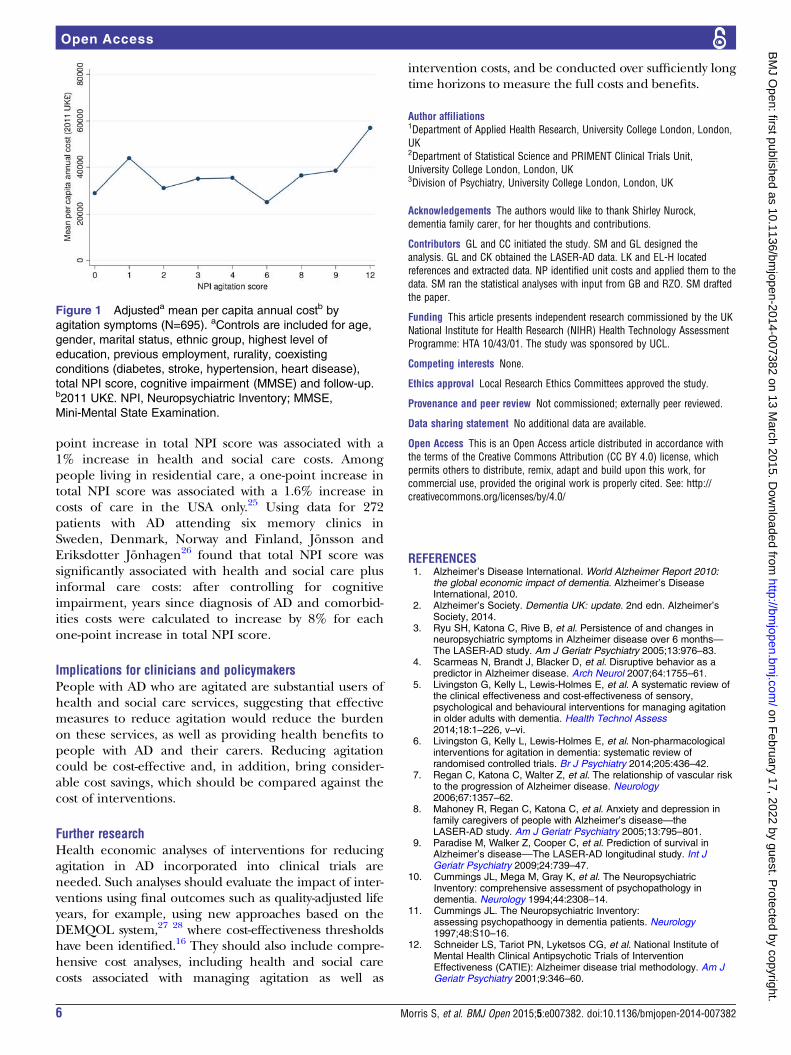
conditions, cognitive impairment, follow-up and individualclustering for repeated measures, mean costs varied byNPI agitation scores, from £29 000 over a 12-month period
with no agitation symptoms (NPI agitation score=0) up to£57 000 at the most severe levels of agitation (NPI agitationscore=12; p=0.01, table 2 and figure 1). Costs also variedsignificantly by age and gender, marital status, ethnicgroup, highest level of education, total NPI score and cog-nitive impairment (p<0.05, see online supplementarytable S3).When we reran the model including NPI agitation
scores as a linear term rather than categorical indicators,we found that a one-unit increase in NPI agitation scoreswas associated with a £1736 increase in costs per patientover a 12-month period (95% CI £644 to £2807, p=0.001)in an unadjusted model, and £1064 (95% CI −£34 to£2162, p=0.058) when adjusting for the covariates.
Excess costs associated with agitation in the UKThe adjusted annual expected cost per person with ADbased on the per cent with each NPI agitation score inour sample was £33 075 and the adjusted annual costsper person with no agitation symptoms was £28 983 (seeonline supplementary table S4). Hence, the excess costassociated with agitation per person with AD was £4091a year. This suggests that on average agitation accountsfor 12% (£4091/£33 075) of the health and social carecosts of AD each year. In the UK, there are 800 000people with dementia and around 62% of cases areaccounted for by AD.2 The expected excess cost asso-ciated with agitation in people with AD is therefore £2.0billion a year (£4091×800 000×0.62).
DISCUSSIONPrincipal findingsAmong people with AD, health and social care costsvaried significantly by the level of agitation, from£29 000 over a 12-month period in people with no agita-tion symptoms up to around £57 000 at the most severelevels of agitation. On average, agitation symptomsaccount for 12% of the health and social care costs ofAD. The excess cost associated with agitation was £2billion a year across all people with AD in the UK.
Strengths and weaknessesOur analysis is based on a unique data set containingvery detailed information on frequency and severity ofagitation symptoms and use of health and social care ser-vices over a 54-month time period. The data alsoinclude a range of demographic variables, coexistingconditions and cognitive impairment that can beincluded to isolate the costs associated with agitation.With regard to limitations, the data set is relatively
small, containing 224 people with AD. Given the largenumber of covariates included in our models, the factthat agitation is a significant predictor of costs suggeststhat the relationship is a strong one. Participants wererecruited between July 2002 and January 2003 and fol-lowed up to 54 months; hence, the data are relatively oldand the prevalence of agitations symptoms among
Morris S, et al. BMJ Open 2015;5:e007382. doi:10.1136/bmjopen-2014-007382 3
Open Access
on February 17, 2022 by guest. P
rotected by copyright.http://bm
jopen.bmj.com
/B
MJ O
pen: first published as 10.1136/bmjopen-2014-007382 on 13 M
arch 2015. Dow
nloaded from

Table 1 Descriptive statistics of sample by agitation symptoms
NPI agitation score ≤3 (N=493) NPI agitation score >3 (N=202) p Value
Mean and median
Per capita annual cost*
Mean (SD) 27 752 (38 413) 38 910 (46 150) <0.001
Median (IQR) 24 796 (3512–38 656) 28 492 (11 680–40 164) 0.001
Total NPI score
Mean (SD) 14 (11) 32 (16) <0.001
Median (IQR) 12 (6–19) 29 (21–42) <0.001
Per cent
Gender
Male 27.8 28.7 0.80
Female 72.2 71.3
Age category (years)
50–59 1.4 1.5
60–69 8.1 5.9
70–79 33.7 45.5 0.06
80–89 46.9 37.6
90–99 9.9 9.4
Marital status
Single 4.9 8.4
Married 40.6 34.7
Separated 1.4 0.5 0.01
Divorced 2.4 5.0
Widower 50.5 49.5
Other 0.2 2.0
Ethnic group
White British 78.5 75.3
White Irish 7.1 8.9
White other 9.5 8.9
Greek 0.4 1.0
Black Caribbean 2.6 3.0 0.65
Black other 0.4 1.5
Indian 0.2 0.0
Pakistani 0.4 0.0
Other 0.8 1.5
Highest level of education
Primary 2.6 4.5
Secondary 82.2 69.3
Tertiary 9.9 13.9 0.002
Other 0.6 1.0
Not known 4.7 11.4
Previous employment
Manager/administrator 6.7 4.0
Professional 11.0 5.9
Associate professional 1.8 2.0
Clerical worker/secretary 18.9 17.8
Skilled labourer 18.5 23.8 0.23
Services/sales 15.2 15.4
Factory worker 11.2 8.9
Other 15.6 20.3
Don’t know 0.2 0.0
Rurality
Urban 90.7 90.6 0.98
Rural 9.3 9.4
Diabetes
No 89.9 95.1
Yes: IDDM 1.6 0.0 0.09
Yes: NIDDM—medically controlled 7.3 4.0
Yes: NIDDM—diet controlled 1.2 1.0
Continued
4 Morris S, et al. BMJ Open 2015;5:e007382. doi:10.1136/bmjopen-2014-007382
Open Access
on February 17, 2022 by guest. P
rotected by copyright.http://bm
jopen.bmj.com
/B
MJ O
pen: first published as 10.1136/bmjopen-2014-007382 on 13 M
arch 2015. Dow
nloaded from

people with AD may have changed over time. In add-ition, management practices might have changed overtime. For example, in 2006, the National Institute forHealth and Care Excellence in England first publishedguidance on the use of medications and treatments forAD; this was amended in 2007 and 2009, and newupdated guidance that recommended extending the useof drug treatment in AD was issued in 2011.21
Prescribing practices have changed over time with amarked reduction in antipsychotic drug use in peoplewith dementia: the mean prevalence of antipsychoticuse on diagnosis of dementia fell in the UK from 19.9%in 1995 to 7.4% in 2011.22 While participants wereselected to be representative of patients with AD, theywere recruited from one geographical area, potentiallylimiting generalisability. We did not include the costs ofinformal care, though these have been estimated toaccount for a substantial proportion of the total costs ofdementia.1 2 23 These data were not collected in theLASER-AD study. UK guidelines for undertaking eco-nomic evaluations recommend taking a health andsocial care perspective when measuring costs.16
Comparison with other studiesSeveral studies have evaluated the relationship betweenbehavioural symptoms and costs of care associated withAD, but none have specifically evaluated the monetarycost of agitation in AD. The studies evaluating theimpact of behavioural symptoms on costs of care havetended to find a positive relationship. For example,using data from the USA on 128 patients with ADMurman et al24 found that after controlling for cognitiveimpairment and comorbidities behavioural symptomsmeasured using the NPI significantly increased totaldirect costs (healthcare costs plus informal care costs): aone-point increase in total NPI score was associated withan annual increase of between US$247 and US$409 intotal direct costs, depending on the value of unpaidcaregiving. Gustavsson et al found that in a sample of1222 patients with AD from Spain, Sweden, the UK, andthe USA, there was a significant relationship betweenbehavioural symptoms measured using total NPI scoreand cost of health and social care among people livingin the community after controlling for ability to performactivities of daily living and cognitive impairment: a one-
Table 1 Continued
NPI agitation score ≤3 (N=493) NPI agitation score >3 (N=202) p Value
Stroke
No 90.7 92.1 0.55
Yes 9.3 7.9
Hypertension
No 63.5 69.8 0.11
Yes 36.5 30.2
Heart disease
No 95.9 91.6 0.02
Yes 4.1 8.4
Cognitive impairment
Mild (MMSE 21–30) 26.4 8.9
Moderate (MMSE 10–20) 37.7 28.2 <0.001
Severe (MMSE ≤9) 35.9 62.9
*2011 UK£.IDDM, insulin-dependent diabetes mellitus; MMSE, Mini-Mental State Examination; NIDDM, non-insulin-dependent diabetes mellitus;NPI, Neuropsychiatric Inventory.
Table 2 Association between agitation symptoms and per capita annual cost*: unadjusted and adjusted analyses (N=695)
NPI agitation score Number (%) Mean (SD) Median (IQR) Adjusted mean (95% CI)†
0 314 (45.2) 28 218 (43 332) 13 962 (3048–36 444) 28 983 (24 364 to 33 603)
1 68 (9.8) 22 596 (24 266) 22 352 (2666–32 149) 43 910 (30 618 to 57 203)
2 60 (8.6) 29 544 (34 427) 27 328 (8546–39 088) 31 196 (22 903 to 39 490)
3 51 (7.1) 29 653 (23 081) 28 216 (9089–39 076) 35 120 (25 592 to 44 648)
4 60 (8.6) 27 909 (23 353) 27 566 (6796–38 728) 35 458 (26 843 to 44 074)
6 57 (8.2) 35 324 (40 889) 27 648 (9720–39 028) 25 138 (17 918 to 32 358)
8 45 (6.5) 42 289 (48 695) 31 076 (23 616–42 532) 36 568 (25 590 to 47 545)
9 12 (1.7) 46 589 (41 302) 39 388 (18 017–64 726) 38 568 (11 867 to 65 269)
12 28 (4.0) 61 064 (76 070) 36 794 (27 126–44 468) 57 023 (31 861 to 82 186)
p Value 0.001 <0.001 0.01
*2011 UK£.†Controls are included for age, gender, marital status, ethnic group, highest level of education, previous employment, rurality, coexistingconditions (diabetes, stroke, hypertension, heart disease), total NPI score, cognitive impairment (MMSE) and follow-up.MMSE, Mini-Mental State Examination; NPI, Neuropsychiatric Inventory.
Morris S, et al. BMJ Open 2015;5:e007382. doi:10.1136/bmjopen-2014-007382 5
Open Access
on February 17, 2022 by guest. P
rotected by copyright.http://bm
jopen.bmj.com
/B
MJ O
pen: first published as 10.1136/bmjopen-2014-007382 on 13 M
arch 2015. Dow
nloaded from
point increase in total NPI score was associated with a1% increase in health and social care costs. Amongpeople living in residential care, a one-point increase intotal NPI score was associated with a 1.6% increase incosts of care in the USA only.25 Using data for 272patients with AD attending six memory clinics inSweden, Denmark, Norway and Finland, Jönsson andEriksdotter Jönhagen26 found that total NPI score wassignificantly associated with health and social care plusinformal care costs: after controlling for cognitiveimpairment, years since diagnosis of AD and comorbid-ities costs were calculated to increase by 8% for eachone-point increase in total NPI score.
Implications for clinicians and policymakersPeople with AD who are agitated are substantial users ofhealth and social care services, suggesting that effectivemeasures to reduce agitation would reduce the burdenon these services, as well as providing health benefits topeople with AD and their carers. Reducing agitationcould be cost-effective and, in addition, bring consider-able cost savings, which should be compared against thecost of interventions.
Further researchHealth economic analyses of interventions for reducingagitation in AD incorporated into clinical trials areneeded. Such analyses should evaluate the impact of inter-ventions using final outcomes such as quality-adjusted lifeyears, for example, using new approaches based on theDEMQOL system,27 28 where cost-effectiveness thresholdshave been identified.16 They should also include compre-hensive cost analyses, including health and social carecosts associated with managing agitation as well as
intervention costs, and be conducted over sufficiently longtime horizons to measure the full costs and benefits.
Author affiliations1Department of Applied Health Research, University College London, London,UK2Department of Statistical Science and PRIMENT Clinical Trials Unit,University College London, London, UK3Division of Psychiatry, University College London, London, UK
Acknowledgements The authors would like to thank Shirley Nurock,dementia family carer, for her thoughts and contributions.
Contributors GL and CC initiated the study. SM and GL designed theanalysis. GL and CK obtained the LASER-AD data. LK and EL-H locatedreferences and extracted data. NP identified unit costs and applied them to thedata. SM ran the statistical analyses with input from GB and RZO. SM draftedthe paper.
Funding This article presents independent research commissioned by the UKNational Institute for Health Research (NIHR) Health Technology AssessmentProgramme: HTA 10/43/01. The study was sponsored by UCL.
Competing interests None.
Ethics approval Local Research Ethics Committees approved the study.
Provenance and peer review Not commissioned; externally peer reviewed.
Data sharing statement No additional data are available.
Open Access This is an Open Access article distributed in accordance withthe terms of the Creative Commons Attribution (CC BY 4.0) license, whichpermits others to distribute, remix, adapt and build upon this work, forcommercial use, provided the original work is properly cited. See: http://creativecommons.org/licenses/by/4.0/
REFERENCES1. Alzheimer’s Disease International. World Alzheimer Report 2010:
the global economic impact of dementia. Alzheimer’s DiseaseInternational, 2010.
2. Alzheimer’s Society. Dementia UK: update. 2nd edn. Alzheimer’sSociety, 2014.
3. Ryu SH, Katona C, Rive B, et al. Persistence of and changes inneuropsychiatric symptoms in Alzheimer disease over 6 months—The LASER-AD study. Am J Geriatr Psychiatry 2005;13:976–83.
4. Scarmeas N, Brandt J, Blacker D, et al. Disruptive behavior as apredictor in Alzheimer disease. Arch Neurol 2007;64:1755–61.
5. Livingston G, Kelly L, Lewis-Holmes E, et al. A systematic review ofthe clinical effectiveness and cost-effectiveness of sensory,psychological and behavioural interventions for managing agitationin older adults with dementia. Health Technol Assess2014;18:1–226, v–vi.
6. Livingston G, Kelly L, Lewis-Holmes E, et al. Non-pharmacologicalinterventions for agitation in dementia: systematic review ofrandomised controlled trials. Br J Psychiatry 2014;205:436–42.
7. Regan C, Katona C, Walter Z, et al. The relationship of vascular riskto the progression of Alzheimer disease. Neurology2006;67:1357–62.
8. Mahoney R, Regan C, Katona C, et al. Anxiety and depression infamily caregivers of people with Alzheimer’s disease—theLASER-AD study. Am J Geriatr Psychiatry 2005;13:795–801.
9. Paradise M, Walker Z, Cooper C, et al. Prediction of survival inAlzheimer’s disease––The LASER-AD longitudinal study. Int JGeriatr Psychiatry 2009;24:739–47.
10. Cummings JL, Mega M, Gray K, et al. The NeuropsychiatricInventory: comprehensive assessment of psychopathology indementia. Neurology 1994;44:2308–14.
11. Cummings JL. The Neuropsychiatric Inventory:assessing psychopathoogy in dementia patients. Neurology1997;48:S10–16.
12. Schneider LS, Tariot PN, Lyketsos CG, et al. National Institute ofMental Health Clinical Antipsychotic Trials of InterventionEffectiveness (CATIE): Alzheimer disease trial methodology. Am JGeriatr Psychiatry 2001;9:346–60.
Figure 1 Adjusteda mean per capita annual costb by
agitation symptoms (N=695). aControls are included for age,
gender, marital status, ethnic group, highest level of
education, previous employment, rurality, coexisting
conditions (diabetes, stroke, hypertension, heart disease),
total NPI score, cognitive impairment (MMSE) and follow-up.b2011 UK£. NPI, Neuropsychiatric Inventory; MMSE,
Mini-Mental State Examination.
6 Morris S, et al. BMJ Open 2015;5:e007382. doi:10.1136/bmjopen-2014-007382
Open Access
on February 17, 2022 by guest. P
rotected by copyright.http://bm
jopen.bmj.com
/B
MJ O
pen: first published as 10.1136/bmjopen-2014-007382 on 13 M
arch 2015. Dow
nloaded from

13. Lyketsos CG, Lopez O, Jones B, et al. Prevalence ofneuropsychiatric symptoms in dementia and mild cognitiveimpairment: results from the Cardiovascular Health Study. JAMA2002;288:1475–83.
14. Selbæk G, Kirkevold O, Engedal K. The prevalence of psychiatricsymptoms and behavioural disturbances and the use of psychotropicdrugs in Norwegian nursing homes. Int J Geriatr Psychiatry2007;22:843–9.
15. Beecham J, Knapp MR. Costing psychiatric intervention. In:Thornicroft GJ, Brewin CR, Wing JK, eds. Measuring mental healthneeds. Gaskell, 1992.
16. National Institute for Health and Care Excellence (NICE). Guide tothe methods of technology appraisal 2013. NICE, 2013.
17. Curtis L. Unit costs of health and social care 2011. Personal SocialServices Research Unit, 2012.
18. Department of Health. 2010–2011 NHS reference costs. Departmentof Health, 2012.
19. Barber J, Thompson S. Multiple regression of cost data: use ofgeneralised linear models. J Health Serv Res Policy2004;9:197–204.
20. Folstein MF, Folstein SE, McHugh PR. “Mini-mental state”: apractical method for grading the cognitive state of patients for theclinician. J Psychiatr Res 1975;12:189–98.
21. National Institute for Health and Care Excellence. Donepezil,galantamine, rivastigmine and memantine for the treatment of
Alzheimer’s disease: NICE technology appraisal guidance 217.NICE, 2011.
22. Martinez C, Jones RW, Rietbrock S. Trends in the prevalence ofantipsychotic drug use among patients with Alzheimer’s disease andother dementias including those treated with antidementia drugs in thecommunity in the UK: a cohort study. BMJ Open 2013;3:e002080.
23. Alzheimer’s Society. Dementia UK: a report to the Alzheimer’sSociety by King’s College London and London School ofEconomics. Alzheimer’s Society, 2007.
24. Murman DL, Chen Q, Powell MC, et al. The incremental direct costsassociated with behavioral symptoms in AD. Neurology2002;59:1721–9.
25. Gustavsson A, Brinck P, Bergvall N, et al. Predictors of costs of carein Alzheimer’s disease: a multinational sample of 1222 patients.Alzheimers Dement 2011;7:318–27.
26. Jönsson L, Eriksdotter Jönhagen M. Determinants of costs of carefor patients with Alzheimer’s disease. Int J Geriatr Psychiatry2006;21:449–59.
27. Mulhern B, Smith SC, Rowen D, et al. Improving the measurementof QALYs in dementia: developing patient- and carer-reported healthstate classification systems using Rasch analysis. Value Health2012;15:323–33.
28. Rowen D, Mulhern B, Banerjee S, et al. Estimatingpreference-based single index measures for dementia usingDEMQOL and DEMQOL-Proxy. Value Health 2012;15:346–56.
Morris S, et al. BMJ Open 2015;5:e007382. doi:10.1136/bmjopen-2014-007382 7
Open Access
on February 17, 2022 by guest. P
rotected by copyright.http://bm
jopen.bmj.com
/B
MJ O
pen: first published as 10.1136/bmjopen-2014-007382 on 13 M
arch 2015. Dow
nloaded from

1
Online supplements Table S1. Unit costs Table S2. Baseline characteristics of caregivers (N=224) Figure S1. Distribution of per capita annual cost (N=695) Table S3. Association between agitation symptoms and per capita annual cost: adjusted analyses, full results (N=695) Table S4. Calculation of excess costs associated with agitation in people with Alzheimer’s disease

2
Table S1. Unit costs
Cost component Unit costa Unit Reference
General Practitioner (GP) 36 Per surgery consultation 17
Practice nurse/District nurse 60 Per hour 17
Dietician 35 Per hour 17
Community psychiatric nurse 50 Per hour 17
Occupational therapist 82 Per hour 17
Home help 27 Per hour 17
Meals on wheels 6. Per meal 17
Physiotherapist 34 Per hour 17
Chiropodist 31 Per hour 17
Optician 57 Per contact 18
Dentist 92 Per contact 18
Audiologist 67 Per contact 18
Psychiatrist 418 Per contact 17
Psychologist 135 Per hour 17
Day centre 34 Per visit 17
Hospital outpatient visit 100 Per visit 17
Hospital inpatient stay 321 Per day 17
Residential respite care 105 Per overnight stay 17
Day respite care 96 Per day 17
Residential care home 519 Per week 17
Nursing care home 741 Per week 17
Sheltered housing 155 Per week 17
Hospital awaiting placement 321 Per day 17
a 2011 UK£.

3
Table S2. Baseline characteristics of caregivers (N=224) Characteristic Baseline value (N=224)
Age (years)
Mean (SD) 63 (14)
Gender (%)
Male 31
Female 69
Marital status (%)
Single/unmarried 9
Married 69
Co-habiting 2
Widowed 5
Separated/divorced 7
Not known 8
Number of children at home (%)
0 75
1 8
2 7
3 2
4 1
Not known 7
Living with person with AD (%)
Yes 56
No 43
Not known 1
Relationship to person with AD (%)
Husband/partner 17
Wife/partner 20
Child 35
Friend 4
Other relative 9
Paid carer 14
Abbreviation: AD, Alzheimer’s disease

4
Figure S1. Distribution of per capita annual cost (N=695)
Tests for normality: Shapiro–Wilk normality test: P <0.01. Shapiro–Francia normality test: P <0.01.
01
02
03
04
0P
erc
en
t
0 50000 100000 150000 200000 250000 300000Total annual cost per person (2011 UK£)

5
Table S3. Association between agitation symptoms and per capita annual costa: adjusted analyses, full results (N=695)
Adjusted mean (95% CI)
NPI agitation scores
0 28 983 ( 24 364 to 33 603 )
1 43 910 ( 30 618 to 57203 )
2 31 196 ( 22 903 to 39 490 )
3 35 120 ( 25 592 to 44 648 )
4 35 458 ( 26 843 to 44 074 )
6 25 138 ( 17 918 to 32 358 )
8 36 568 ( 25 590 to 47 545 )
9 38 568 ( 11 867 to 65 269 )
12 57 023 ( 31 861 to 82 186 ) P value 0.01
Gender*age category (years) .
Male*60-69 106 172 ( 22 527 to 189 816 )
Male*70-79 20 838 ( 14 560 to 27 116 )
Male*80-89 27 740 ( 18 508 to 36 971 )
Male*90-99 37 134 ( 9778 to 64 490 )
Female*50-59 58 633 ( -23 297 to 140 563 )
Female*60-69 20 663 ( 8848 to 32 477 )
Female*70-79 30 443 ( 22 400 to 38 487 )
Female*80-89 43 813 ( 34 943 to 52 683 )
Female*90-99 36 165 ( 23 067 to 49 264 ) P value <0.001
Marital status
Single 61 977 ( 32 527 to 91 427 )
Married 22 821 ( 18 359 to 27 283 )
Separated 33 384 ( 6357 to 60 411 )
Divorced 28 087 ( 13 377 to 42 797 )
Widower 36 598 ( 30 183 to 43 013 )
Other 72 443 ( 14 808 to 130 077 ) P value 0.002
Ethnic group
White British 31 901 ( 27 905 to 35 896 )
White Irish 28 072 ( 16 285 to 39 859 )
White other 37 326 ( 23 133 to 51 518 )
Greek 2763 ( -960 to 6486 )
Black Caribbean 59 761 ( 25 301 to 94 220 )
Black other 35 488 ( -912 to 71 888 )
Indian 4226 ( 166 to 8286 )
Pakistani 63 600 ( 23 645 to 103 556 )
Other 39 098 ( 14 420 to 63 776 ) P value <0.001
Highest level of education
Primary 32 855 ( 3512 to 62 198 )
Secondary 33 992 ( 29 155 to 38 829 )
Tertiary 36 291 ( 16 018 to 56 565 )
Other 3136 ( 1207 to 5065 )
Not known 22 863 ( 17 604 to 28 122 ) P value <0.001
Previous employment
Manager/Administrator 39 121 ( 20 144 to 58 098 )
Professional 21 740 ( 12 042 to 31 438 )
Associate professional 28 380 ( 9253 to 47 507 )
Clerical worker/Secretary 33 826 ( 25 944 to 41 708 )
Skilled labourer 31 487 ( 23 055 to 39 918 )

6
Services/Sales 38 584 ( 28 147 to 49 020 )
Factory worker 27 280 ( 17 251 to 37 310 )
Other 35 395 ( 21 644 to 49 146 )
Don't know 40 168 ( 7614 to 72 723 ) P value 0.37
Rurality
Urban 33 298 ( 29 453 to 37 143 )
Rural 22 908 ( 13 076 to 32 739 ) P value 0.10
Diabetes
No 32 531 ( 28 909 to 36 152 )
Yes: IDDM 31 176 ( 10 046 to 52 307 )
Yes: NIDDM – medically controlled 30 498 ( 17 161 to 43 835 )
Yes: NIDDM – diet controlled 62 095 ( 19 912 to 104 278 ) P value 0.26
Stroke
No 32 006 ( 28 266 to 35 747 )
Yes 38 756 ( 25 394 to 52 118 ) P value 0.30
Hypertension
No 33 479 ( 28 254 to 38 704 )
Yes 30 746 ( 24 510 to 36 982 ) P value 0.55
Heart disease
No 32 346 ( 28 739 to 35 953 )
Yes 36 216 ( 19 148 to 53 285 ) P value 0.64
Total NPI score
0 23 593 ( 13 823 to 33 363 )
1 15 907 ( 8882 to 22 932 )
2 22 190 ( 11 085 to 33 294 )
3 24 164 ( 12 457 to 35 871 )
4 46 735 ( 28 502 to 64 969 )
5 30 567 ( 14 160 to 46 974 )
6 22 628 ( 10 565 to 34 690 )
7 40 133 ( 16 714 to 63 552 )
8 35 762 ( 24 854 to 46 671 )
9 27 722 ( 18 587 to 36 857 )
10 50 437 ( 27 556 to 73 318 )
11 43 285 ( 20 729 to 65 841 )
12 35 797 ( 25 150 to 46 444 )
13 39 215 ( 20 201 to 58 229 )
14 37 723 ( 21 893 to 53 554 )
15 23 841 ( 17 017 to 30 665 )
16 34 838 ( 22 421 to 47 255 )
17 21 277 ( 9213 to 33 341 )
18 31 299 ( 17 852 to 44 745 )
19 23 970 ( 16 782 to 31 157 )
20 55 337 ( 20 991 to 89 682 )
21 28 149 ( 17 217 to 39 081 )
22 40 379 ( 22 795 to 57 964 )
23 56 096 ( 30 241 to 81 951 )
24 13 821 ( 7610 to 20 032 )
25 18 446 ( 10 328 to 26 563 )
26 18 959 ( 2224 to 35 693 )
27 40 681 ( 5711 to 75 651 )
28 29 549 ( 13 015 to 46 083 )
29 43 221 ( 20 283 to 66 159 )

7
30 20 897 ( 9537 to 32 256 )
31 46 870 ( -868 to 94 608 )
32 24 717 ( 15 551 to 33 884 )
33 23 252 ( 4477 to 42 027 )
34 32 839 ( 862 to 64 816 )
35 18 022 ( 2413 to 33 632 )
36 45 720 ( -12 125 to 103 564 )
37 14 944 ( 5308 to 24 579 )
38 36 810 ( 23 078 to 50 542 )
39 20 524 ( 6476 to 34 572 )
40 22 872 ( 14 496 to 31 248 )
41 12 418 ( 1653 to 23 183 )
42 42 246 ( 7638 to 76 854 )
43 38 972 ( 4391 to 73 552 )
44 91 489 ( 50 078 to 132 900 )
45 35 315 ( 11 478 to 59 153 )
46 86 883 ( 7744 to 166 022 )
47 32 128 ( -5314 to 69 569 )
48 27 034 ( 10 312 to 43 757 )
49 25 890 ( 7565 to 44 215 )
50 36 616 ( 40 to 73 192 )
51 15 263 ( 6986 to 23 540 )
52 24 059 ( 1751 to 46 368 )
53 21 026 ( 5762 to 36 291 )
54 14 641 ( 5653 to 23 629 )
57 169 936 ( -24 228 to 364 099 )
59 54 625 ( 28 475 to 80 775 )
60 29 625 ( 16 477 to 42 773 )
61 30 444 ( -27 798 to 88 685 )
64 1673 ( 672 to 2674 )
65 1725 ( 531 to 2918 )
66 24 912 ( 9101 to 40 722 )
67 52 075 ( 13 525 to 90 626 )
69 47 684 ( -5887 to 101 256 )
79 7651 ( 1391 to 13 910 )
82 7435 ( 1774 to 13 096 ) P value <0.001
MMSE score
0 70 323 ( 54 271 to 86 375 )
1 39 663 ( 26 441 to 52 885 )
2 36 960 ( 20 551 to 53 370 )
3 45 878 ( 25 791 to 65 964 )
4 30 985 ( 14 793 to 47 177 )
5 53 935 ( 25 859 to 82 010 )
6 39 690 ( 16 784 to 62 596 )
7 22 396 ( 15 634 to 29 158 )
8 64 027 ( 35 175 to 92 878 )
9 35 884 ( 16 215 to 55 553 )
10 15 640 ( 5322 to 25 958 )
11 23 619 ( 13 114 to 34 124 )
12 30 401 ( 18 028 to 42 775 )
13 20 569 ( 12 682 to 28 456 )
14 14 157 ( 6889 to 21 424 )
15 27 900 ( 16 776 to 39 024 )
16 24 417 ( 14 756 to 34 078 )
17 20 616 ( 13 845 to 27 387 )
18 31 333 ( 19 682 to 42 984 )
19 11 466 ( 5544 to 17 388 )

8
20 18 803 ( 10 219 to 27 388 )
21 15 315 ( 9553 to 21 078 )
22 15 672 ( 9053 to 22 291 )
23 6427 ( 3235 to 9618 )
24 9784 ( 5026 to 14 542 )
25 7937 ( 3633 to 12 242 )
26 6250 ( 3165 to 9334 )
27 2901 ( 1308 to 4493 )
28 9377 ( 4141 to 14 612 )
29 11 295 ( 3436 to 19 155 )
30 2931 ( 1413 to 4449 ) P value <0.001
Follow-up
Baseline 35 161 ( 28 575 to 41 748 )
18 months 34 223 ( 28 028 to 40 418 )
30 months 31 898 ( 26 252 to 37 544 )
42 months 31 045 ( 25 696 to 36 395 )
54 months 29 432 ( 23 358 to 35 507 ) P value 0.78
Abbreviations: NPI, Neuropsychiatric Inventory; IDDM, insulin dependent diabetes mellitus; NIDDM, non-insulin dependent diabetes mellitus; MMSE, mini–mental state examination; CI, confidence interval. a 2011 UK£.
9
Table S4. Calculation of excess costs associated with agitation in people with Alzheimer’s disease
NPI agitation score Percent observations across N=695
Adjustment mean per capita annual costa
0 45.2 28 983
1 9.8 43 910
2 8.6 31 196
3 7.3 35 120
4 8.6 35 458
6 8.2 25 138
8 6.5 36 568
9 1.7 38 568
12 4.0 57 023 Abbreviations: NPI, Neuropsychiatric Inventory. a 2011 UK£.
Annual expected cost per person with AD based on percent with each NPI agitation score = 45.2%*£28 983 + 9.8%*£43 910 + 8.6%*£31 196 + 7.3%*£35 120 + 8.6%*£35 458 + 8.2%*£25 138 + 6.5%*£36 568 + 1.7%*£38 568 + 4.0%*£57 023 = £33 075 Annual cost per person with AD with no agitation symptoms (NPI agitation score =0) = £28 983. Mean excess cost associated with agitation per person with AD each year = £33 075 - £28 983 = £4091. Number of people with dementia in the UK = 800 000; around 62% (= 496 000) are accounted for by AD. Excess cost associated with agitation in people with AD in the UK each year = £3265*800 000*0.62 = £2.0 billion.