Embed Size (px)
Citation preview
Open agro-burning in Asia and potential impact on air quality and climate
Kim Oanh N.T. Asian Institute of Technology
Thailand
BAQ06-Yogjakarta

Highlights
Agro-residue burning and emission AIRPET findings on biomass burning
contribution to urban particulate pollution Rice straw burning emission and air
quality Emission characterization and study on
health effects and climate change properties at AIT

Methodology

Emission from Biomass Burning
Emission of large amount of PIC including CO, VOC, semi-VOC, fine PM
Local effects: health, visibility PM Toxic gases: CO, VOC, PAH, etc.
Regional and global effects
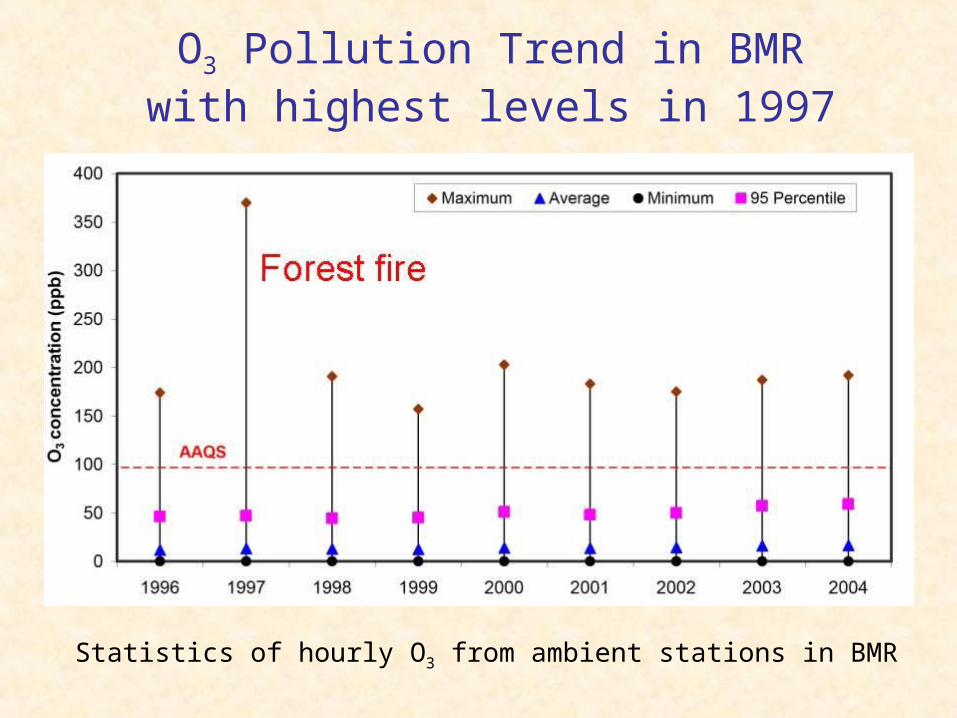
O3 Pollution Trend in BMR with highest levels in 1997
Statistics of hourly O3 from ambient stations in BMR
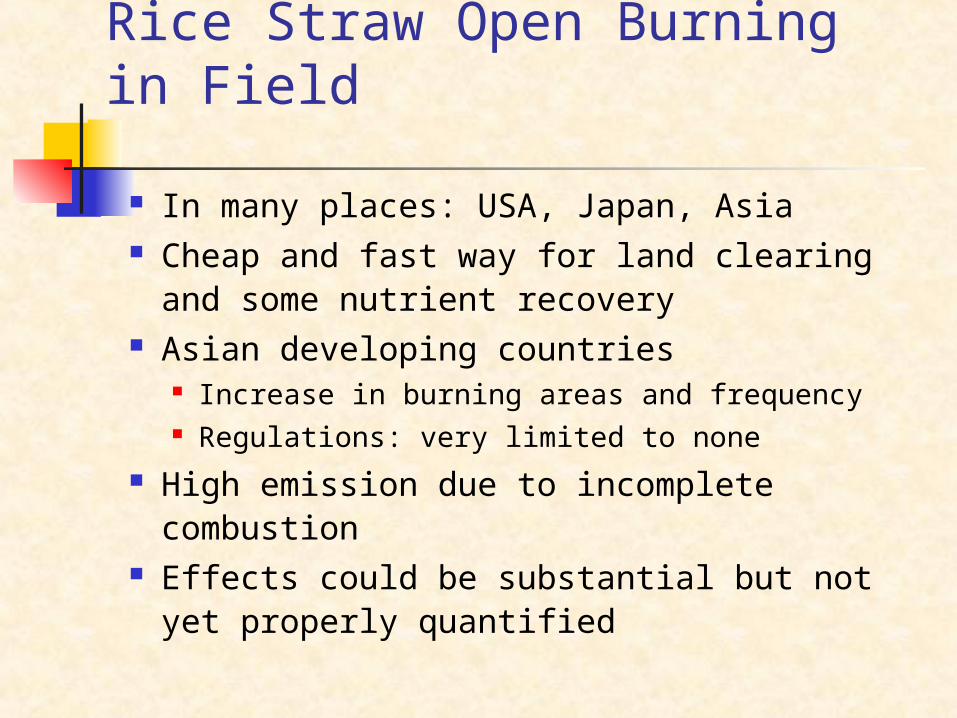
Rice Straw Open Burning in Field
In many places: USA, Japan, Asia Cheap and fast way for land clearing and
some nutrient recovery Asian developing countries
Increase in burning areas and frequency Regulations: very limited to none
High emission due to incomplete combustion
Effects could be substantial but not yet properly quantified
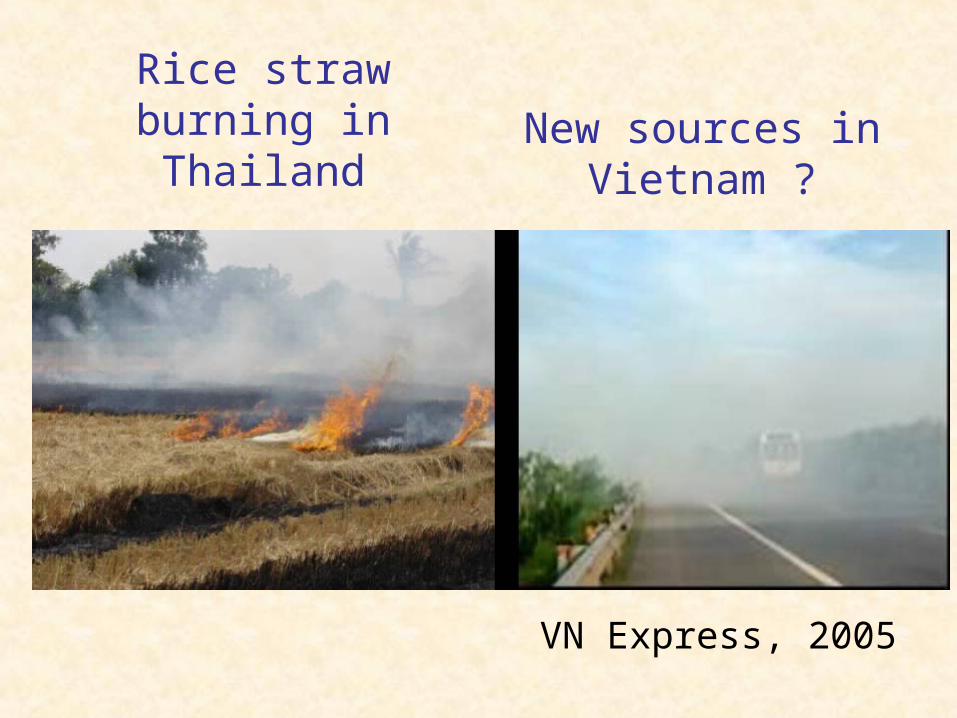
Rice straw burning in Thailand
New sources in Vietnam ?
VN Express, 2005
PM2.5 and PM10 in six Asian cities
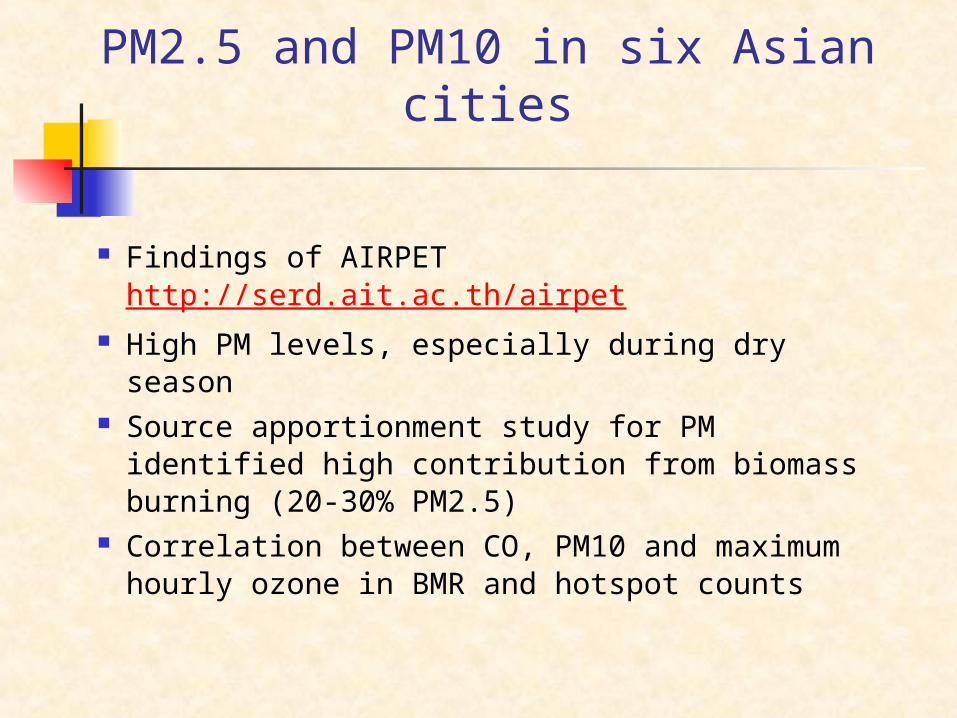
Findings of AIRPET http://serd.ait.ac.th/airpet High PM levels, especially during dry season Source apportionment study for PM identified
high contribution from biomass burning (20-30% PM2.5)
Correlation between CO, PM10 and maximum hourly ozone in BMR and hotspot counts
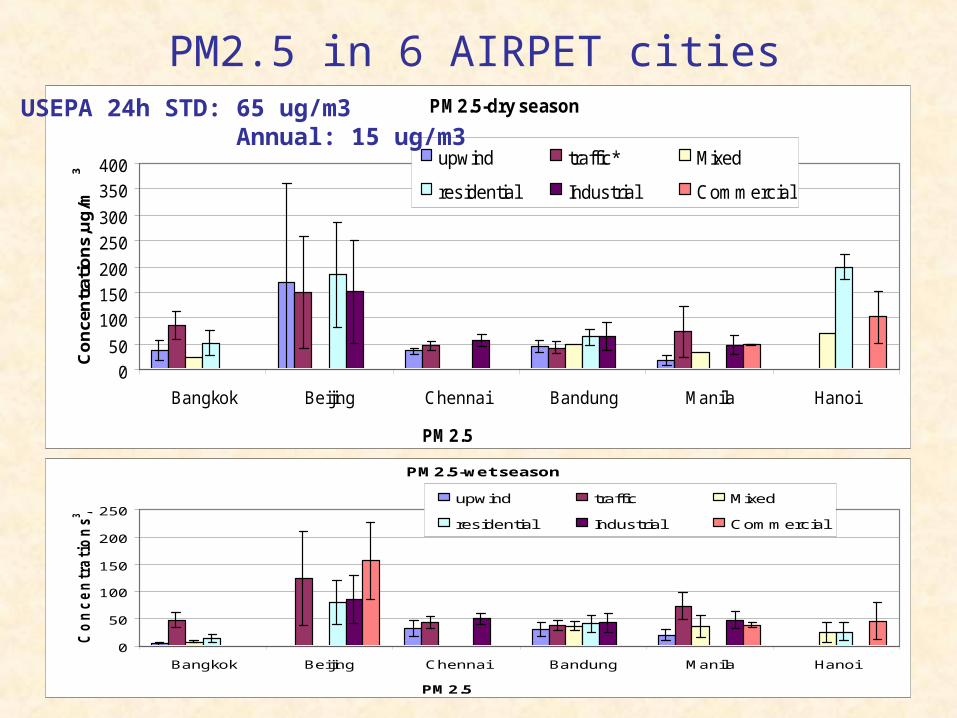
PM2.5 in 6 AIRPET cities
PM2.5-wet season
0
50
100
150
200
250
Bangkok Beijing Chennai Bandung Manila Hanoi
PM2.5
Co
nc
en
tra
tio
ns
,ug
/m3
upwind traffic Mixed
residential Industrial Commercial
PM2.5-dry season
0
50
100
150
200
250
300
350
400
Bangkok Beijing Chennai Bandung Manila Hanoi
PM2.5
Co
nce
ntr
atio
ns,
ug
/m3
upwind traffic* Mixed
residential Industrial Commercial
USEPA 24h STD: 65 ug/m3 Annual: 15 ug/m3


Hotspot detected by MODIS in year 2004 overlaid landuse map of BMR
Phuong, 2006 (AIT thesis)
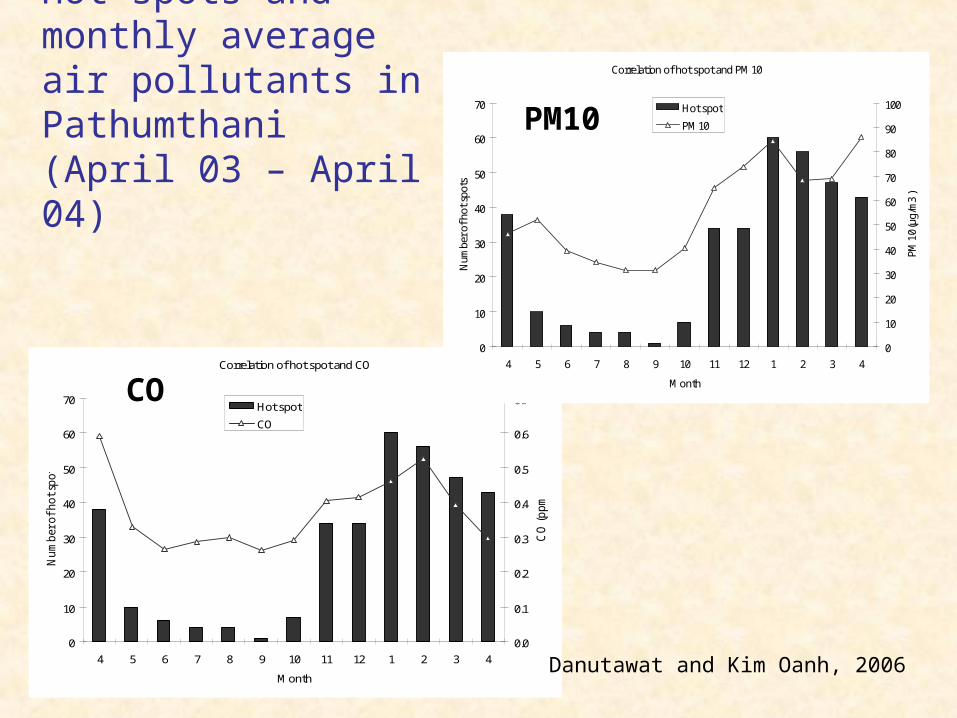
Hot spots and monthly average air pollutants in Pathumthani (April 03 – April 04)
Correlation of hot spot and CO
0
10
20
30
40
50
60
70
4 5 6 7 8 9 10 11 12 1 2 3 4
Month
Nu
mb
er o
f h
ot
spo
ts
0.0
0.1
0.2
0.3
0.4
0.5
0.6
0.7
CO
(p
pm
)
Hot spot
CO
Correlation of hot spot and PM10
0
10
20
30
40
50
60
70
4 5 6 7 8 9 10 11 12 1 2 3 4
Month
Num
ber o
f hot
spo
ts
0
10
20
30
40
50
60
70
80
90
100
PM10
(μg/
m3
)
Hot spot
PM10PM10
CO
Danutawat and Kim Oanh, 2006
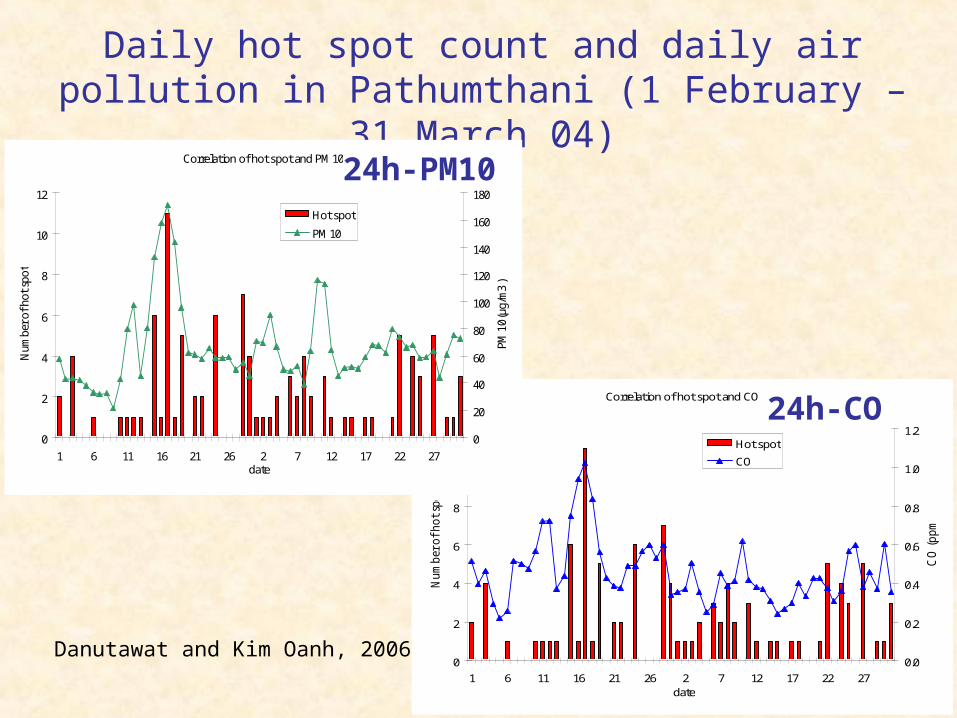
Daily hot spot count and daily air pollution in Pathumthani (1 February – 31 March 04)
Correlation of hot spot and CO
0
2
4
6
8
10
12
1 6 11 16 21 26 2 7 12 17 22 27date
Nu
mb
er o
f h
ot
spo
t
0.0
0.2
0.4
0.6
0.8
1.0
1.2
CO
(p
pm
)
Hot spot
CO
Correlation of hot spot and PM10
0
2
4
6
8
10
12
1 6 11 16 21 26 2 7 12 17 22 27date
Num
ber o
f hot
spo
t
0
20
40
60
80
100
120
140
160
180
PM10
(μg/
m3
)
Hot spot
PM10
24h-PM10
24h-CO
Danutawat and Kim Oanh, 2006

Correlation of Hotspot and Maximum ozone concentration - March, 2004
0
50
100
150
200
1 2 3 4 5 6 7 8 9 10 11 12 13 14 15 16 17 18 19 20 21 22 23 24 25 26 27 28 29 30 31
Ozo
ne C
once
ntra
ion
(ppb
)
0
5
10
15
20
25
Hot s
pot n
umbe
r Hot spot
Ozone
CO * 20
Hotspot counts and maximum hourly ozone in BMR, March
2004
Phuong, 2006 (AIT thesis)

Emission characterization and
exposure study by AIT team
0.00
20.00
40.00
60.00
80.00
100.00
120.00
140.00
160.00
180.00
200.00
5.0-10.0 um 1.0-5.0 um 0.7-1.0 um 0.5-0.7 um
5.8-10.0 um 1.1-5.8 um 0.7-1.1 um 0.4-0.7 um
Massco
ncen
trati
on
(u
g/m
3)
0.E+00
1.E+06
2.E+06
3.E+06
4.E+06
5.E+06
6.E+06
7.E+06
No
of
part
icle
s (
no
of
part
icle
s/m
3)
Mass
Number of particles
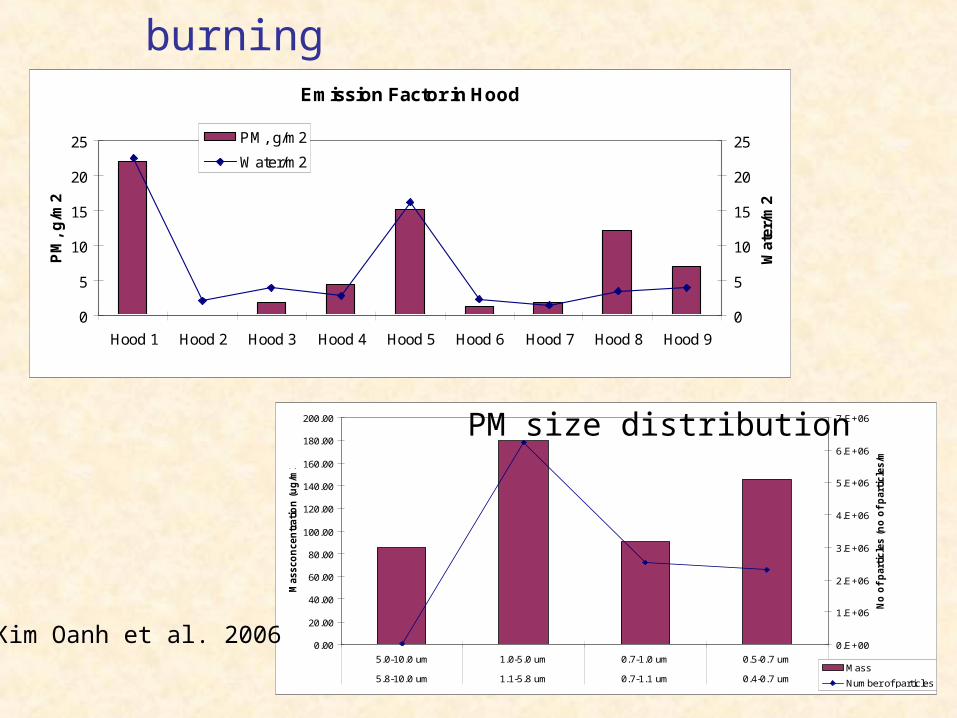
PM emission from rice straw burning
Emission Factor in Hood
0
5
10
15
20
25
Hood 1 Hood 2 Hood 3 Hood 4 Hood 5 Hood 6 Hood 7 Hood 8 Hood 9
PM
, g
/m2
0
5
10
15
20
25
Wat
er/m
2
PM, g/m2
Water/m2
Kim Oanh et al. 2006
PM size distribution

Estimated climate impact of rice straw open burning per ha of rice paddy
Species
Emission factor
kg/kg RS
Emission Kg/ha
GWP for100-year
Kg CO2 eq.,
100 years
GWP, 20-years
Kg CO2 eq., 20 years
CO2 1.3 8,840 1 8,840 1 8,840
CH4* 0.0027 18 23 420 62 1140
N20* 0.00007 0.5 296 140 275 130
CO 0.114 800 3 2,330 10 7,750
VOCs* 0.057 400 1.7 660 4.9 1900
EC 0.00068 5 650 3,000 2000 9,250
OC 0.0037 25 -75 -1,900 -250 -6,300
Total - - 13,500 22,700
Example: 200,000 ha x 2 crops/year in BMR

Acknowledgement
Swedish International Development Agency
Fogarty research foundation


![Young Marketers Elite W4 + [ Chinh + Oanh ]](https://img.pdfslide.net/doc/110x75/55a853a71a28abac4f8b48ca/young-marketers-elite-w4-chinh-oanh-.jpg)