Embed Size (px)
Citation preview

Open innovation: The role of geograph and locali ed socialgeography and localized social capital p
Keld LaursenDepartment of Innovation andDepartment of Innovation and Organizational Economics Copenhagen Business Schoolhttp://www.druid.dk/laursen/ E-mail: [email protected]

Open Innovation (ii)Open Innovation (ii)
• Recap, Chesbrough (2003):• The advantages that firm’s gain from internal g g
R&D expenditure have declined. • Accordingly, many innovative firms now
spend little on R&D • Yet they are able to successfully innovate by
d i i k l d d ti fdrawing in knowledge and expertise from wide range of external sources.

What is new?What is new?• Schumpeter mark I (1912) — probably the only “closed”
innovation model!• Schumpeter mark II (1942)• Earlier contributions:
• Nelson (1959);• Linder (1961);
R b (1963)• Rosenberg (1963); • Rothwell et al (1974); • von Hippel (1976, 1988,2005);
R b (1982)• Rosenberg (1982); • Lundvall (1984, 1988); • Pavitt (1984); • Cohen & Levinthal (1990);• Cohen & Levinthal (1990); • Baum, J., Calabrese, T., & Silverman, B. S. (2000) • + literally hundreds of additional contributions in innovation
studies, strategic management and in economics.studies, strategic management and in economics.
What is new?What is new?• So the idea of the importance of “distributed”So the idea of the importance of distributed
or “open” innovation processes is certainly not new.
• What is new is:• That there are drivers (stronger labor mobility, at t e e a e d e s (st o ge abo ob ty,
“software movements” & venture capital) that accelerate the process at this point in time.Th t fi h ld thi k b t it d f• That a firm should think about its degree of openness not only to specific external sources of innovation, but has to manage a portfolio ofinnovation, but has to manage a portfolio of external sources).

Context and OpenpInnovation• The OI literature is now moving
towards sorting out the importancetowards sorting out the importance of “context” (industry, appropriabilityconditions geography ect )conditions, geography ect.).
• A recent literature in this vain in management looks at external knowledge sourcing and geographyo edge sou c g a d geog ap y

The “geography turn” in g g p ymanagement research
• Almeida, P., B. Kogut. 1999. Localization of knowledge and the mobility of engineers in regionalAlmeida, P., B. Kogut. 1999. Localization of knowledge and the mobility of engineers in regional networks. Management Science 45(7) 905-917.
• Chung, W., J. Alcacer. 2002. Knowledge seeking and location choice of foreign direct investment in the. United States. Management Science 48(12) 1534-1555.Tallman S M Jenkins N Henry S Pinch 2004 Knowledge clusters and competitive• Tallman, S., M. Jenkins, N. Henry, S. Pinch. 2004. Knowledge, clusters and competitive advantage. Academy of Management Review 29(2) 258-271.
• Romanelli, E., O.M. Khessina. 2005. Regional Industrial Identity: Cluster Configurations and Economic Development. Organization Science 16(4) 344-358.
• Tallman, S., A. Phene. 2007. Leveraging knowledge across geographic boundaries. Organization Science 18(2) 252-260.
• Alcácer, J., W. Chung. 2007. Location Strategies and Knowledge Spillovers. Management Science 53(5) 760-776.( )
• Bell , S., P. Tracey, J. Heide. 2009. The organization of regional clusters. Academy of Management Review 34(4) 623-642.
• Arikan, A. 2009. Interfirm knowledge exchanges and the knowledge creation capability of clusters. Academy of Management Review 34(4) 658 676Academy of Management Review 34(4) 658-676.
• Whittington, K.B., J. Owen-Smith, W.W. Powell. 2009. Networks, Propinquity, and Innovation in Knowledge-intensive Industries. Administrative Science Quarterly 54(1) 90-122
• Gambardella, A., M.S. Giarratana. Forthcoming. Organizational Attributes and the Distribution of Rewards in a Region: Managerial Firms vs. Knowledge Clusters. Organization Science 2010.
• Leiponen, A., Helfat, C.E. Forthcoming. 'Location, Decentralization, and Knowledge Sources for Innovation', Organization Science.

Geography and open innovationGeography and open innovation
• Alcácer, J., W. Chung (2007) Location Strategies and Knowledge Spillovers Management Science 53(5) 760-776.776.
• Laursen, Masciarelli & Prencipe (2010), Regions matter: how regional characteristics affect innovation and external knowledge use.
• Laursen, K., T. Reichstein and A. Salter (forthcoming), 'Exploring the Effect of Geographical Distance and University Quality on Industry University Collaboration inUniversity Quality on Industry-University Collaboration in the UK', Regional Studies.
Geography and open innovationGeography and open innovation
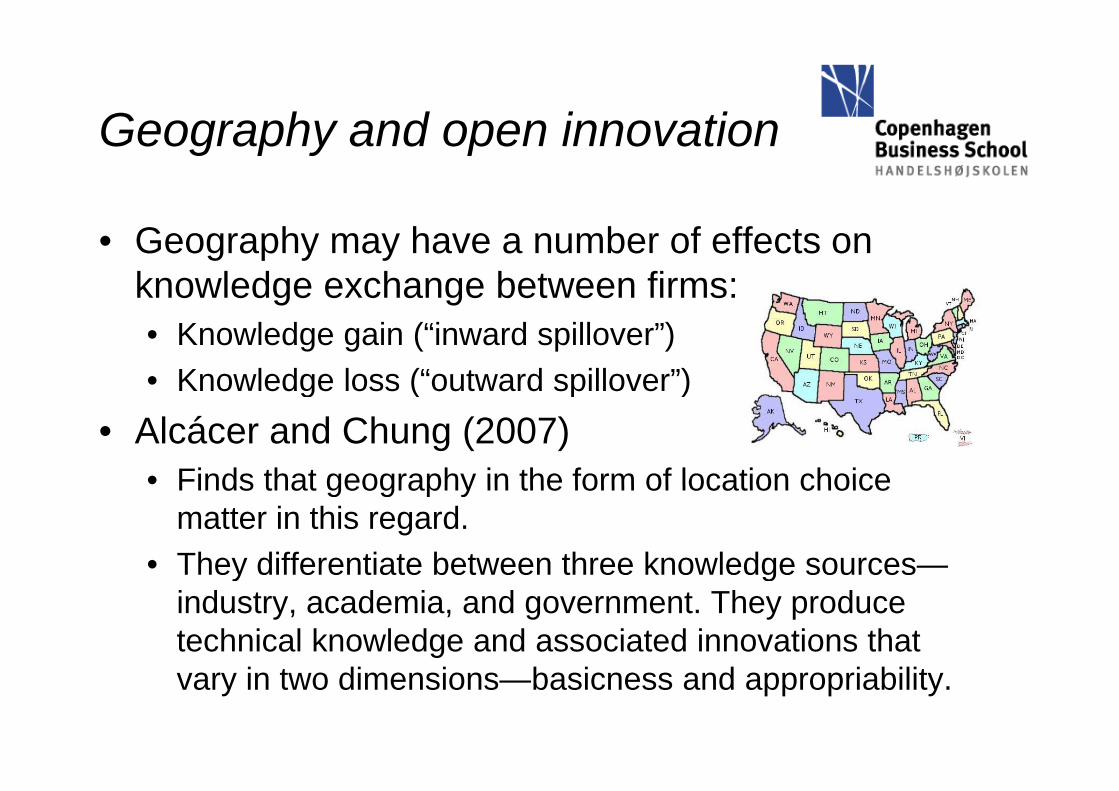
• Geography may have a number of effects on knowledge exchange between firms:• Knowledge gain (“inward spillover”)• Knowledge loss (“outward spillover”)g ( p )
• Alcácer and Chung (2007) • Finds that geography in the form of location choiceFinds that geography in the form of location choice
matter in this regard.• They differentiate between three knowledge sources—y g
industry, academia, and government. They produce technical knowledge and associated innovations that vary in two dimensions—basicness and appropriability.

Geography and open innovationGeography and open innovation
L ki t fi t ti t t i t th U it d St t f• Looking at first-time entrants into the United States from 1985 to 1994, Alcácer and Chung find differences in firms’ location strategies:location strategies:• While on average firms are indifferent to governmental and industrial
activity, and attracted to locations with academic activity, more nuanced and distinct results emerge when firm heterogeneity is introduced:distinct results emerge when firm heterogeneity is introduced:
• Less technically advanced firms favor locations with any level of academic activity and high levels of industrial innovative activity
• Technically advanced firms are attracted only to locations with high levels of academic activity but avoid economic areas with industrial activity. Given that laggards also like academia, by only choosing locations thick with
d i ti it l d t th t t ibl i facademic activity, leaders can get the greatest possible gains for themselves. By steering away from industrial activity, leading firms avoid competitors.
• These differences in strategies suggest that firms consider net spillovers—not only gains from inward knowledge spillover but also the potential cost of outward spillovers.

Geography and open innovationGeography and open innovation
• Unanswered questions: • What about location close to suppliersWhat about location close to suppliers
and users?• The interaction between geography• The interaction between geography
and appropriability mechanisms, such as patents?as patents?
• Licensing behavior and location h i ?choice?

Geography and open innovationGeography and open innovation
• Most studies infer spillovers but do not address the mechanism by which spillovers occur.
• The recent paper by Laursen, MasciarelliThe recent paper by Laursen, Masciarelli& Prencipe suggests that a key mechanism is social capital—particularlymechanism is social capital particularly in the form of social interaction.
• Regional social capital is defined as the
Robert D. Putnam (2006)
• Regional social capital is defined as the localized norms and networks that enable people to act collectively within a regionpeople to act collectively within a region (cf., Woolcock and Narayan’s 2000: 226).

Geography and open innovationGeography and open innovation
• The central argument in the paper is that geographically bound social capital facilitates j i t l i f i ti d d hjoint learning for innovation and reduces search and transaction costs of both contractual and non-contractual interaction among thenon contractual interaction among the economic actors in a region.
• In other words, geographically bound social ot e o ds, geog ap ca y bou d soc acapital is the key transmitter of knowledge spillovers within geographically constrained areas and that the resulting existence of localized social capital has implications for firms’ abilities to innovatefirms abilities to innovate.

Geography and open innovationGeography and open innovation
• Insights from the relational view of the firm and social capital theory is used to advance the thesis that social
it l i hi ll t i d hcapital is a geographically-constrained phenomenon that enhances firms’ abilities to introduce innovations.
• The distributed or open (Chesbrough 2003) nature of• The distributed or open (Chesbrough 2003) nature of the innovation process derives from its information and knowledge requirements: innovation requires o edge equ e e ts o at o equ escombinations of a variety of new and existing knowledge bases located inside and outside the focal firm.
• We develop the hypothesis that high levels of hi ll b d d i l it l i t f i lgeographically bounded social capital, in terms of social
interaction in the home region.

Geography and open innovationGeography and open innovation
S ill t t d d t d t t• Spillovers are context-dependent due to two interrelated factors:• An important component of knowledge is tacit difficult to• An important component of knowledge is tacit, difficult to
unbundle from its context (“sticky”), and complex; therefore, its transfer requires information-rich, face-to-face interactions (N l d Wi t 1982 S l ki 1996 Hi l 1994)(Nelson and Winter 1982; Szulanski 1996; von Hippel 1994).
• Personal contacts — the major means of face-to-face interaction — are fostered by proximity and are less likely to be y p y yestablished over larger geographical distances (Rosenthal and Strange 2003; Storper and Venables 2004).
Rosenthal and Strange 2003: “Information spillovers that require frequent contact between workers may dissipate over a short distance as walking to a meeting place becomes difficult or as random encounters become rare”.

Geography and open innovationGeography and open innovation
• Two assumptions:• Personal relationships overlap withPersonal relationships overlap with
work relationships since social capital is dependent upon individual attitudesis dependent upon individual attitudes and behaviors, which impinge on the collective behavior of firmscollective behavior of firms.
• Social capital is effective irrespective of the level of development in theof the level of development in the region (we control for level of development in the empiricaldevelopment in the empirical analysis).

HypothesesHypotheses• The idea central to social capital theory is that highThe idea central to social capital theory is that high
levels of social interaction provide information benefits in terms of access, i.e. the opportunity to obtain a valuable piece of information; of timing i eobtain a valuable piece of information; of timing, i.e. the opportunity to be informed early; and of referrals, i.e. having your name prominent at the right time in the right place (Burt 1992) theright time in the right place (Burt 1992)—the localized connectivity effect
• Localized social capital also improves the functioning of knowledge connections by alleviating potential moral hazard problems through the creation of trust—the localized trust effect.• H1: Firms operating in regions with high levels
of social capital in terms of social interaction are more likely to introduce product innovationsmore likely to introduce product innovations (through the localized connectivity and trust effects).

HypothesesHypotheses• “Restricted” internal R&D search has the advantage that• Restricted internal R&D search has the advantage that
in the majority of cases, it is the most efficient mode of search due to its relatively low costs, given that the h f fi di l ti ill b hi h ithichances of finding a solution will be higher within a
familiar domain (Rosenkopf and Almeida 2003).• However, there are limitations to familiar sources of
knowledge, such as in-house R&D, in that they may not provide sufficient inspiration or variety to enable combinations of knowledge required to producecombinations of knowledge required to produce innovation (Rosenkopf and Almeida 2003; Rosenkopfand Nerkar 2001):
H2: The effectiveness of internal R&D spending on• H2: The effectiveness of internal R&D spending on the likelihood of introducing product innovation is higher for firms operating in regions associated with hi h l l f i l i lhigh levels of social capital.

HypothesesHypotheses• There are a number of reasons why investments inThere are a number of reasons why investments in
externally acquired R&D could fail in delivering innovations to the acquiring firm.
• The relational view of the firm posits that social capital may work as an institutional reparation mechanism for the implied market failures, facilitating solutions to ex-ante and ex-post transaction cost problems.S i l i t ti d l ti i d di• Social interactions develop over time in dyadic relationships as formal exchange partners become more comfortable with each others’ competences andmore comfortable with each others competences and reliability in economic exchange:• H3:The effectiveness of externally acquired R&D on the likelihood of
introducing product innovation is higher for firms operating in regions associated with high levels of social capital.

Geography and open innovationGeography and open innovation
• Data• The firm level data on innovation come fromThe firm level data on innovation come from
Capitalia. 2,410 usable observations• Data social capital variables from the Italian p
National Institute of Statistics (Participation in cultural associations; Participation in
l t i ti P ti i ti ivoluntary associations; Participation in non-voluntary organizations; Number of voluntary associations per region; Meeting friendsassociations per region; Meeting friends regularly; Social meetings; Satisfaction as to relationships with friends).p )
• Dependent variable product innovation yes/no

Geography and open innovationIndependent variables
Geography and open innovation
• Social capital —social interaction (regional) • R&D intensity (firm)• External R&D acquisition (firm) q ( )• Size (firm)• Age (firm)• % of employees with a degree (firm)% o e p oyees a deg ee ( )• Customer satisfaction (firm)• Industry-level R&D intensity (industry)• Social capital — political participation (region)Social capital political participation (region)• Regional Human Capital (region)• Regional Expenditure on innovation (% of regional GDP) (region)• Population (in millions of people) (region)Population (in millions of people) (region)• Passengers by air (region)• Firms over the population (region)• Road Infrastructures (region)• Road Infrastructures (region)• Port Infrastructures (region)• Tax paid (region)

Results Model III Model IV
Coef. S.E. Coef. S.E. Social capital — social interaction 0.177 * [0.071] 0.323 *** [0.074]
& i i 4 [0 38] 96 [0 42]R&D intensity 5.554 ** [0.538] 5.965 *** [0.542]External R&D acquisition¤ 5.210 * [2.067] 5.156 † [2.116]Social interaction × R&D intensity 2.952 *** [0.514]Social interaction × External R&D acquisition¤ 5.839 * [2.802]Size 0.002 *** [0.000] 0.002 *** [0.000]Size 0.002 [0.000] 0.002 [0.000]Age 0.001 [0.002] 0.001 [0.002]% of employees with a degree 0.020 ** [0.007] 0.019 *** [0.007]Customer satisfaction 0.223 * [0.101] 0.227 * [0.102]Supplier dominated -0.394 *** [0.121] -0.372 *** [0.122]Scale intensive -0.498 *** [0.151] -0.472 *** [0.151]Science based -0.555 † [0.314] -0.449 [0.311]Specialized suppliers Benchmark Benchmark Industry-level R&D intensity 0.133 † [0.074] 0.138 [0.074]Social capital — political participation -0 063 [0 068] -0 084 [0 068]Social capital — political participation -0.063 [0.068] -0.084 [0.068]Regional human capital -0.014 [0.038] -0.011 [0.039]Regional expenditure on innovation (% of regional GDP) -0.135 [0.190] -0.103 [0.194]Population 0.000 * [0.000] 0.000 [0.000]Passengers by air -0.002 † [0.001] -0.001 [0.001]N. of firms over the population -2.225 [3.056] -2.005 [3.125]Constant -0.060 [0.337] -0.118 [0.343]Number of observations 2410 2410 Log likelihood -1439 8 -1425Log likelihood -1439.8 -1425Chi-square 412.71 *** 442.26 *** Pseudo R2 0.125 0.134
Notes: ¤ indicates a predicted variable from the first-step fractional response estimation. Two-tailed tests: †
p < .10; * p < .05; ** p < .01; *** p < .001. Standard deviations in parenthesis.

Geography and open innovationGeography and open innovation
• The three hypotheses are largely confirmed, but significance plotsconfirmed, but significance plots reveals that the effects are not equally distributed across firms:equally distributed across firms:

The significance of the interaction between gsocial interaction and R&D intensity
10z-statistics of Interaction Effects after Logit
589 3 percent of
0z-st
atis
tic
89.3 percent of cases at the two-sided 10 percent level
-5
percent level ~5 percent negative and significant
.2 .4 .6 .8 1Predicted Probability that y = 1
g

Significance of the interaction between social ginteraction and external R&D acquisition
10z-statistics of Interaction Effects after Logit
55
z-st
atis
tic
95.2 percent of observations
0
z observations significant
-5
.2 .4 .6 .8 1.2 .4 .6 .8 1Predicted Probability that y = 1

ContributionContributionThe paper’s contribution is threefold:The paper s contribution is threefold:• Location matters: firms located in regions
characteri ed b a high le el of str ct ral socialcharacterized by a high level of structural social capital in terms of social interaction display a higher propensity to innovatehigher propensity to innovate.
• Regional social interaction reduces learning myopia and too strong a focus on exploitation.
• Regions with high levels of structural social capital there is a higher probability that externally acquired R&D will be translated by firms into product innovations, making the buy option more attractive to managers.

The “geography turn” in g g p ymanagement research• Unanswered questions:
• How does social capital interact withHow does social capital interact with different external knowledge sources?
• What about the interplay between intra and• What about the interplay between intra and extra-region knowledge sourcing?D i l hi ll b d d• Does regional geographically bounded social capital influence internationalization? T h t t t ill h SC bl dTo what extent will such SC enable and constrain firms?

Research Context: Laursen, Reichstein & Salter (2010) RegionalReichstein & Salter (2010), Regional Studies
• Extent of interaction (Mansfield, 1991; Beise and Stahl, 1999; Schmoch and Meyer-Krahmer, 1998)
• Types of knowledge exchanged (Cohen, Nelson and Walsh, 2002)
I t i d t diff (Kl i k t l 1995)• Inter-industry differences (Klevorick et al, 1995)
• Impact of policy reform (Mowery, Nelson, Sampat and Ziedonis, 2001)2001)
• Motivation of firms (Mohnen and Hoareau, 2003; Laursen and Salter 2004; Feldman and Berkovitz 2006; Perkmann andSalter, 2004; Feldman and Berkovitz, 2006; Perkmann and Walsh, 2007)
• Impact of exchange on firms, universities and researchers’Impact of exchange on firms, universities and researchers behavior (Shane, 2004; Mowery et al, 2001, D’Este and Patel, 2007)
The Geography of U I InteractionThe Geography of U-I Interaction
• Impact of geographic proximity on U-I interactions• Arundel and Geuna (2004) – domestic vs. foreign
sources of university knowledgesources of university knowledge
• Fabrizio (2006) – distance to university cited in a patentpatent
• Abramovsky et al. (2007) – research activities of universities and location of R&D units
• Mansfield and Lee (1996) – research quality of the university shaping choice of partner
• ‘Sticky knowledge’ – need for face-to-face communication in U-I knowledge exchange (Pavitt, 1991)1991)

Challenges in Geography of U-I g g p yInteraction
• Limited attention to choices of firms and academics
• Sample size• Incomplete distance measures• Incomplete distance measures• Single sector focus — biotechnology• The search for the “importance” of
geographical proximity

Geography and open innovation:g p y pUniversity-industry interaction
• In the paper it is argued and substantiated empirically that thesubstantiated empirically, that the relationship between geographical proximity to a university and a firm’s p y ypropensity to collaborate with a local university in the innovation process, is i fl d b b th h i l di tinfluenced by both physical distance and the research quality of the local universityuniversity.

Geography and open innovationGeography and open innovation

Geography and open innovationGeography and open innovation
• We posit that a firm’s decision to collaborate with its local university is more likely if this is one of the top ti i ititier universities.
• Accordingly, is conjectured that geographical distance to the nearest top tier university isdistance to the nearest top tier university is positively related to the firm’s propensities to collaborate with a local university, and that there is co abo ate t a oca u e s ty, a d t at t e e sno or even a negative relationship between geographical distance to the nearest low tier university and the propensity to collaborate locally.
• Based on three ‘classes’ of universities in terms of h lit thi id llresearch quality, this paper provides overall
empirical support for these ideas.
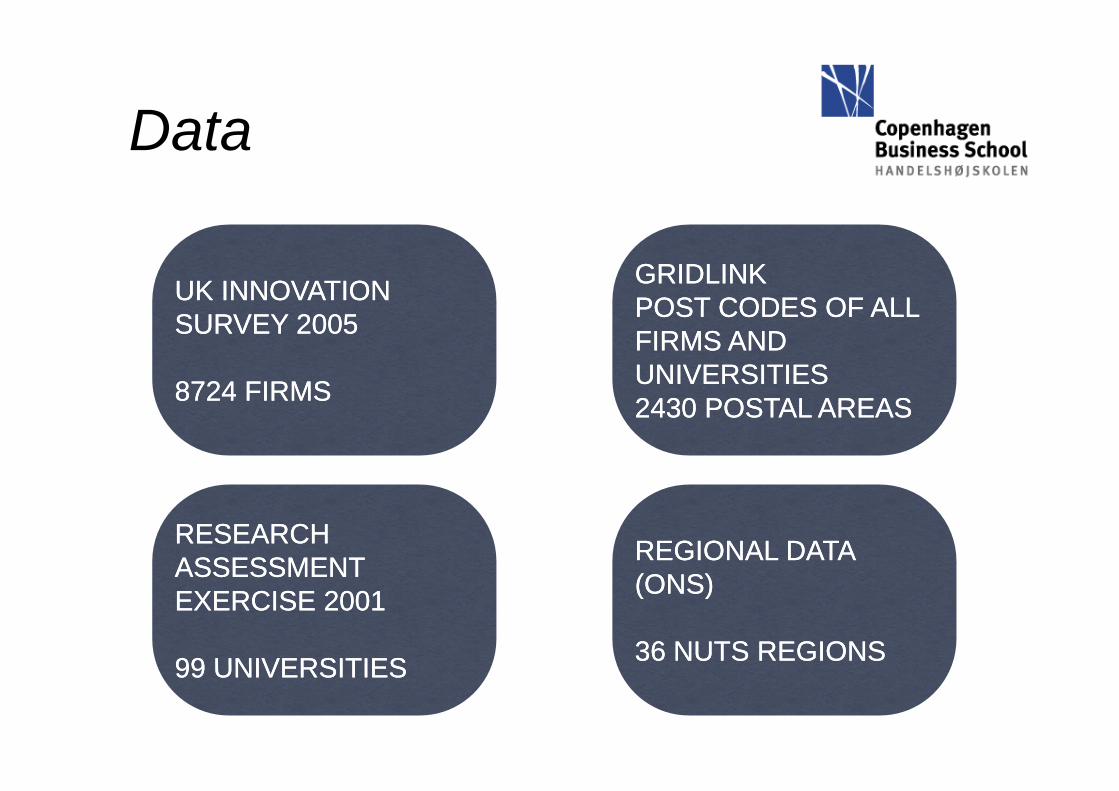
DataData
UK INNOVATION UK INNOVATION GRIDLINKGRIDLINKPOST CODES OF ALLPOST CODES OF ALLSURVEY 2005SURVEY 2005
8724 FIRMS8724 FIRMS
POST CODES OF ALL POST CODES OF ALL FIRMS AND FIRMS AND UNIVERSITIESUNIVERSITIES8724 FIRMS8724 FIRMS 2430 POSTAL AREAS2430 POSTAL AREAS
REGIONAL DATA REGIONAL DATA (ONS)(ONS)
RESEARCH RESEARCH ASSESSMENTASSESSMENT (ONS)(ONS)
36 NUTS REGIONS36 NUTS REGIONS
ASSESSMENT ASSESSMENT EXERCISE 2001EXERCISE 2001
99 UNIVERSITIES99 UNIVERSITIES99 UNIVERSITIES99 UNIVERSITIES

Dependent VariableDependent Variable
UK UK INNOVATIONINNOVATION
Innovation collaboration: ACTIVE PARTICIPATION INNOVATION INNOVATION
SURVEY 2005SURVEY 2005 WITH OTHER ENTERPRISES OR NON-COMMERCIAL
Do not Do not Collaborate Collaborate
COMMERCIAL INSTITUTIONS ON INNOVATION ACTIVITIES. BOTH PARTNERS DO NOT
Do Do Collaborate Collaborate with awith awith a with a
UniversityUniversityBOTH PARTNERS DO NOT NEED TO COMMERCIALLY BENEFIT. EXCLUDE PURE CONTRACTING OUT
with a with a UniversityUniversity
NonNon--L llL llLocallyLocally
CONTRACTING OUT WORK WITH NON ACTIVE CO-OPERATION (DTI,
LocallyLocallyyy2005)

Independent Variables IIndependent Variables I
• Categorizing universities according to research activitiesto research activities
• Research Assessment Exercise 2001 > % of FTE Researchers2001 -> % of FTE Researchers within 5 or 5* departments
• Generating 3 tiers of universities• 1st tier: 10 highest rankedg• 2nd tier: ranked 11th to 50th• 3rd tier: ranked 51st to 99th
• Investigated arbitrary splits

Independent Variables IIIndependent Variables II
• Measure: -Log(geographical distance)distance)
• Studying effect of being co-located ith i it dl fwith a university regardless of
ranking• Investigating the effect of ranked
universities —including a distanceuniversities —including a distance measure for each of the tier ni ersitiesuniversities

Control VariablesControl Variables• Firm level:
• Innovation new to the world (0/1)• R&D Intensity (%)• R&D Intensity (%)• Openness (Laursen & Salter, 2004, 2006)• Firm size (Log(employees))( g( p y ))• Public Support (0/1)• Market Orientation (0-3)
R i l i bl (NUTS2 36 UK i )• Regional variables (NUTS2 - 36 UK regions)• GVA of the Region (Log)• R&D Intensity of the regionR&D Intensity of the region
• Industry Dummies (11)

ModelModel• Nested Logit (McFadden, 1981)
• Decision to collaborate locally or non-locally is nested in the decision to collaborate at allnested in the decision to collaborate at all
• Reshaping of data• We use interaction effect between distanceWe use interaction effect between distance
measures and local/non-local dummies to generate variation between outcomes within individuals (Drucker & Puri, 2005)
• Distance measures drives local collaboration decisiondecision
• Control variables drives decision to collaborate• Split sample (High R&D intensive/Low R&D p p ( g
intensive)

ConclusionsConclusions• Yet, while our findings indicate that the first-best choice—
from the firms’ point of view—is to collaborate with a local, top-tier university, in the absence of a high-quality local university, the second-best choice would seem to be y,collaborating with a non-local (presumably high-quality) university rather than cooperating with a local, lower-tier universityuniversity.
• The study also shows that firm-university relationships are moderated by research and development (R&D) i t it fi ith b R&D i t it lintensity: firms with above-average R&D intensity are less prone to collaborate with (high-quality) local universities compared to firms with below-average R&D intensity.
• In other words, geographical proximity matters more for firms with lower absorptive capacity.
• There is a “scaring away” effect from being located close• There is a scaring away effect from being located close to a lower-tier university.

The “geography turn” in g g p ymanagement research• Unanswered questions:
• Will “matching” explain U-IWill matching explain U I interaction? [high-quality—high-quality and low-quality—low quality]and low quality low quality].
• How is the interaction shaped by the movement of individuals between Umovement of individuals between U and I?H i th i t ti h d b th• How is the interaction shaped by the firms’ strategy in terms of
l ti / l it ti ? ( S lt &exploration/exploitation? (see Salter & Tartari, 2009)

The end of the route…
Keld LaursenDRUID, Department of Innovation and Organizational Economics, Copenhagen Business Schoolhttp://www.druid.dk/laursen/ E-mail: [email protected]