Embed Size (px)
Citation preview

[Type here] [Type here] [Type here]
Date: 2021-07-15
NIST Media Forensics Challenge Team
NIST
Open Media Forensics Challenge 2020-2021 Evaluation Plan
Date: 2021-07-15 ii
TABLE OF CONTENTS
Table of Contents .......................................................................................................... ii
List of Figures iv
List of Tables v
1 Introduction ............................................................................................................ 1
2 Tasks and Conditions ............................................................................................. 1 2.1 Tasks ......................................................................................................................................... 1
2.1.1 Image Manipulation Detection and Localization .................................................................................... 1 2.1.2 Video Manipulation Detection .................................................................................................................. 2 2.1.3 Image GAN Manipulation Detection and Localization ........................................................................ 2 2.1.4 Video GAN Manipulation Detection ....................................................................................................... 3
2.2 Conditions ................................................................................................................................ 3 2.2.1 Image Only .................................................................................................................................................... 3 2.2.2 Image and Metadata ..................................................................................................................................... 3 2.2.3 Video Only .................................................................................................................................................... 3 2.2.4 Video and Metadata ..................................................................................................................................... 4
2.3 Protocol ..................................................................................................................................... 4 2.4 Evaluation Task/Condition Summary ..................................................................................... 4
3 Data Resources ....................................................................................................... 4 3.1 Probe Directory ........................................................................................................................ 4 3.2 Documents Directory ............................................................................................................... 4 3.3 Indexes Directory ..................................................................................................................... 5 3.4 Reference Directory .................................................................................................................. 5
3.4.1 Reference Files ............................................................................................................................................. 5 3.4.2 Reference Mask ............................................................................................................................................ 6
3.5 Directory Structure ................................................................................................................... 7
4 System Input .......................................................................................................... 7 4.1 Index File .................................................................................................................................. 8
5 System Output ........................................................................................................ 8 5.1 System Output File ................................................................................................................... 8 5.2 Confidence Score ...................................................................................................................... 9 5.3 Probe Status .............................................................................................................................. 9 5.4 Validation .................................................................................................................................. 9 5.5 System Detection Mask Files ................................................................................................... 9
5.5.1 Mask Description ......................................................................................................................................... 9 5.5.2 Validation Rules for Mask Files ............................................................................................................... 10
6 Metrics Definition ................................................................................................. 10 6.1 Score Metrics .......................................................................................................................... 10
6.1.1 Receiver Operating Characteristic (ROC) .............................................................................................. 10 6.1.2 Area Under the ROC Curve (AUC) ........................................................................................................ 11 6.1.3 Correct Detection (CD) at False Alarm Rate (FAR) ............................................................................ 11
6.2 Mask Metrics .......................................................................................................................... 11 6.2.1 Definition of Regions ................................................................................................................................ 11
Date: 2021-07-15 iii
6.2.2 Matthews Correlation Coefficient (MCC) .............................................................................................. 13 6.2.3 Weighted L1 Loss (WL1) .......................................................................................................................... 13 6.2.4 Oracle Measurements for Mask Scoring ................................................................................................ 13
6.3 Mask Scoring Evaluation Condition ...................................................................................... 14
Appendix A Submission Instructions ...................................................................... 15 A-a System Descriptions ............................................................................................................... 15 A-b Packaging Submissions .......................................................................................................... 15 A-c Transmitting Submissions ..................................................................................................... 16
Appendix B CSV File Format Specifications ........................................................... 17
Appendix C Detection Scorer Usage ....................................................................... 18
References 19

Date: 2021-07-15 iv
LIST OF FIGURES
Figure 1: An example of a trial for the image manipulation detection task ................................................................. 2
Figure 2: ROC and AUC .................................................................................................................................................... 10
Figure 3: Mask Regions ...................................................................................................................................................... 12
Figure 4: Example of Graphical Output for Test Case ................................................................................................. 19

Date: 2021-07-15 v
LIST OF TABLES
Table 1: An Example of Outcome of Scoring System Output Masks ....................................................................... 14
Table 2: Example of Report Table Output for Test Case ............................................................................................ 18
Date: 2021-07-15 1
1 INTRODUCTION
This document describes the system evaluation tasks supported by the Open Media Forensics Challenge (OpenMFC) 2020-2021. The evaluation plan covers resources, task definitions, task conditions, file formats for system inputs and outputs, evaluation metrics, scoring procedures, and protocols for submitting results.
Media Forensics Challenge (MFC) is a media forensics evaluation to measure how well systems can automatically detect and locate manipulations in imagery (i.e., images and videos). In the DARPA MediFor Program 2017-2020, we systematically established the MediFor MFC evaluation to fulfill the DARPA program needs to focus on the container system evaluation for the internal participants. Thus, there were few external participants. The Open Media Forensics Challenge (OpenMFC) aims to engage the larger research community without container submission requirement, and to serve the participants worldwide.
Any questions or comments concerning the OpenMFC should be sent to [email protected].
2 TASKS AND CONDITIONS
In the OpenMFC evaluation, the top four popular tasks from MediFor MFC are chosen that have more than 5 participants for first year OpenMFC. there are four tasks for systems that detect manipulated images and videos: Image Manipulation Detection and Localization, Image GAN Manipulation Detection and Localization, Video Manipulation Detection, and Video GAN Manipulation Detection. The tasks will be evaluated under two different conditions: image/video content only and image/video content plus metadata. For each task, the system will be prompted with a probe, an image or video that is the subject of the task question posed to the system.
2.1 TASKS
2.1.1 IMAGE MANIPULATION DETECTION AND LOCALIZATION
For the Image Manipulation Detection and Localization (IMDL) task, the objective is to detect if a probe image has been manipulated and, if so, to spatially localize the edits. Localization is encouraged but not required for OpenMFC. Manipulations are deliberate, purposeful manipulations such as splicing and cloning etc.
For each trial, which consists of a single probe image, the IMDL system must render a confidence score1 with higher numbers indicating the probe image is more likely to have been manipulated. The primary metric for measuring detection performance will be Area Under the Receiver Operating Characteristic (ROC) Curve (AUC) (see Section 6.1.2); additional metrics may be used.
For localization, the system-rendered mask image for each trial must be relative to the probe image and must indicate the pixel(s) and confidence that the probe image was manipulated. The form of the system-provided masks is defined in Section 5.5.1. If the mask image for a trial is detected by a system to find no localizable content change, it can be omitted and is assumed to be empty. The reference mask for each true manipulation with localized content change is a layered reference mask2, a lossless JPEG 20003 image in which, on each layer,
1 The confidence score can be of any real number in the range [0, 1]. The confidence scores must be orderable across trials, but not systems. 2 Defined in Section 3.4.2. 3 https://jpeg.org/jpeg2000/index.html

Date: 2021-07-15 2
a white pixel indicates the region has not been manipulated and a black pixel indicates the region has been manipulated. The reference mask for each true manipulation without localized content change is a reference mask, a JPEG 2000 image in which each pixel is white; that is, if there is no localized content change in a true manipulation, the mask is completely white. Each bit plane indicates a separate manipulation. Not all manipulations require localization output. Global operations affecting the entire image are not required for localization output because then the entire image is marked as manipulated; for example, a clone operation does require localization output while global histogram normalization does not. The primary metric for measuring image manipulation localization performance will be the Optimum Matthews Correlation Coefficient (MCC) (see Section 6.2.2); additional metrics may be used.
(a) (b) (c)
Figure 1: An example of a trial for the image manipulation detection task4
Figure 1 shows an example of an image manipulation detection and localization trial. In this trial, image (b) is the original image. Image (a) is created by removing a jogger, cloning a window, and splicing a hawk into the image. Each manipulation in the trial is indicated by a different color in the reference mask as shown in image (c). The removal of the jogger is indicated by the green color, the cloning of the window is indicated by the blue color, and the splicing in of the hawk is indicated by the red color.
2.1.2 VIDEO MANIPULATION DETECTION
For the Video Manipulation Detection (VMD) task, the objective is to detect if a probe video has been manipulated. There is no localization of the manipulated regions for this task in OpenMFC.
For each trial, which consists of a single probe video, the VMD system must render a confidence score with higher numbers indicating the probe video is more likely to have been manipulated. The primary metric for measuring detection performance will be Area Under the Receiver Operating Characteristic (ROC) Curve (AUC) (see Section 6.1.2); additional metrics may be used.
2.1.3 IMAGE GAN MANIPULATION DETECTION AND LOCALIZATION
For the Image GAN Manipulation Detection and Localization (IGMDL) task, the objective is to detect if a probe image has been manipulated using generative adversarial network (GAN) based techniques and, if so, to spatially localize the edits. Localization is encouraged but not required for OpenMFC. Manipulations performed using techniques other than a GAN-based should not be detected as GAN manipulations.
For each trial, which consists of a single probe image, the IGMDL system must render a confidence score with higher numbers indicating the probe image is more likely to have been manipulated using GAN-based
4 In Figure 1, image (a) is a derivative of image (b) [4229350757_4f8bae3870_o.jpg (http://farm3.staticflickr.com/2694/4229350757_4f8bae3870_o.jpg) by michaelwm25] and of 5559691732_7d70e4b268_o.jpg (http://farm6.staticflickr.com/5306/5559691732_7d70e4b268_o.jpg) by BobMacInnes. All images are used under CC-BY 2.0 (https://creativecommons.org/licenses/by/2.0/).
Date: 2021-07-15 3
techniques. The primary metric for measuring detection performance will be Area Under the Receiver Operating Characteristic (ROC) Curve (AUC) (see Section 6.1.2); additional metrics may be used.
For localization, the system-rendered mask image for each trial must be relative to the probe image and must indicate the pixel(s) and confidence that the probe image was manipulated using GAN-based techniques. The form of the system-provided masks is defined in Section 5.5.1. If the mask image for a trial is detected by a system to find no localizable GAN-based content change, it can be omitted and is assumed to be empty. The reference mask for each true manipulation with localized content change is a layered reference mask, a lossless JPEG 2000 image in which, on each layer, a white pixel indicates the region has not been manipulated with GAN-based techniques and a black pixel indicates the region has been manipulated with GAN techniques. The reference mask for each true manipulation without localized GAN-based content change is a reference mask, a JPEG 2000 image in which each pixel is white; that is, if there is no localized GAN-based content change in a true manipulation, the mask is completely white. Each bit plane indicates a separate manipulation. Not all GAN-based manipulations require localization output. Global operations affecting the entire image are not required for localization output because then the entire image is marked as manipulated. In the future, global operations may be addressed as a separate task. The primary metric for measuring image manipulation localization performance will be the Optimum Matthews Correlation Coefficient (MCC) (see Section 6.2.2); additional metrics may be used.
2.1.4 VIDEO GAN MANIPULATION DETECTION
For the Video GAN Manipulation Detection (VGMD) task, the objective is to detect if a probe video has been manipulated using generative adversarial network (GAN) based techniques. There is no localization for this task in OpenMFC. Manipulations performed using techniques other than a GAN-based should not be detected as manipulations.
For each trial, which consists of a single probe video, the VGMD system must render a confidence score with higher numbers indicating the probe video is more likely to have been manipulated using GAN-based techniques. The primary metric for measuring detection performance will be Area Under the Receiver Operating Characteristic (ROC) Curve (AUC); additional metrics may be used.
2.2 CONDITIONS
2.2.1 IMAGE ONLY
For the image only condition, ConditionID: IO, the system is only allowed to use the pixel-based content for images as input. No image header or other information should be used.
2.2.2 IMAGE AND METADATA
For the image and metadata condition, ConditionID: IM, the system is allowed to use metadata, including image header or other information, in addition to the pixel-based content for the image, as input.
2.2.3 VIDEO ONLY
For the video only condition, ConditionID: VO, the system is only allowed to use the pixel-based content for videos and audio if it exists as input. No video header or other information should be used.

Date: 2021-07-15 4
2.2.4 VIDEO AND METADATA
For the video and metadata condition, ConditionID: VM, the system is allowed to use metadata, including video header or other information, in addition to the pixel-based content for the video and audio if it exists, as input.
2.3 PROTOCOL
All probes must be processed independently of each other within a given task and across all tasks, meaning content extracted from probe data must not affect another probe.
OpenMFC evaluations do not provide training sets for IMDL, IGMDL, VMD, or VGMD tasks. Previously released development data and evaluation data is not designed for training purposes for future evaluation cycles; developers use this data for training sets at their own risk.
All machine learning or statistical analysis algorithms must complete training, model selection, and tuning prior to running the OpenMFC test data.
2.4 EVALUATION TASK/CONDITION SUMMARY
The following table summarizes salient descriptions of the evaluation tasks and the supported test conditions under OpenMFC.
Task Task Synopsis Evaluation Conditions Image Only
Image + Metadata
Video Only
Video + Metadata
IMDL Detect all image manipulations and localize non-global manipulations
Yes Yes
IGMDL Detect GAN manipulations and localize non-global manipulations
Yes
VMD Detect all video manipulations Yes Yes VGMD Detect all GAN manipulations Yes
3 DATA RESOURCES
Each OpenMFC data set consists of up to five main directories: ‘probe’, ‘world’, ‘documents’, ‘indexes’, and ‘reference’. They are explained below.
3.1 PROBE DIRECTORY
The OpenMFC ‘probe’ directory contains images and videos that will be forensically analyzed. The images and videos may be either manipulated or non-manipulated. In OpenMFC, images and videos may be of any format. For the IMDL task, there are about 16 000 images; for the VMD task, there are about 1 530 videos; for the IGMDL task, there are about 1 340 images, and for the VGMD task, there are 118 videos.
3.2 DOCUMENTS DIRECTORY
The OpenMFC ‘documents’ directory contains additional documentation provided with the data set.
Date: 2021-07-15 5
3.3 INDEXES DIRECTORY
The OpenMFC ‘indexes’ directory contains a system index file for each task. An index file is a comma-separated value (CSV) file which lists the images or videos a system must process (see Section 4.1 and Appendix B for details).
3.4 REFERENCE DIRECTORY
The OpenMFC ‘reference’ directory contains a subdirectory for each evaluation task, i.e. image manipulation detection, image GAN manipulation detection, video manipulation detection, or video GAN manipulation detection. Within each detection directory are two types of data: (1) the reference files that contain the “ground-truth” and metadata about trial probes and (2) a subdirectory containing the reference masks. Within the provenance filtering directory is one file: the reference file that contains the ground-truth.
3.4.1 REFERENCE FILES
Three files constitute the reference files for the detection tasks. The main reference file, following the naming convention <DataSet_Name>-<TaskID>-ref.csv, contains seven columns that describe each trial. Additional columns, documented in the data release, will be used for analysis.
TaskID The type of system output, e.g. “manipulation” ProbeFileID The ID of the probe, e.g., OpenMFC2020_6209 ProbeFileName The partial path name to the probe file (relative to the top node
of the data distribution), e.g. probe/ OpenMFC2020_9369.jpg IsTarget Boolean indicating if the probe is a manipulated image, i.e. “Y” |
“N” ProbeMaskFileName The partial path name to the manipulation mask for the probe
(relative to the top node of the data distribution), e.g. reference/splice/mask/ OpenMFC2020_8774.png if IsTarget = “Y”, blank otherwise (i.e., no content).
BaseFileName The partial path name to the base image within the world data set (relative to the top node of the data distribution), e.g. world/ OpenMFC2020_8806.tif if IsTarget = “Y”, blank otherwise.
JournalName The name of the manipulation journal for which the probe was extracted, e.g. oof7oxgiqjprd4ou4lq75wtnvdlmwhkk if IsTarget = “Y”, blank otherwise.
For the video tasks, there are two additional columns:
FrameCount The total number of frames in the probe, e.g. 1200 FrameRate The number of frames displayed per second in the probe, e.g. 24
For each probe for a given detection TaskID, the file <DataSet_Name>-<TaskID>-ref-probejournaljoin.csv documents the journal from which the probe came as well as the operation(s), identified by the before-operation-node and after-operation-node, referenced in the <DataSet_Name>-<TaskID>-ref-journalmask.csv. Journals may include sub-graphs that do not apply to a given probe; only entries that pertain to a given probe are in the probejournaljoin file.
ProbeFileID Same as above JournalName Same as above StartNodeID The starting NodeID within the journal whose operation is
included in the probe, e.g. if77i8v5clk3g2btmpz038hhrnx499s3-TGT-01
Date: 2021-07-15 6
EndNodeID The starting NodeID within the journal whose operation is included in the probe, e.g. if77i8v5clk3g2btmpz038hhrnx499s3-TGT-02-FILL
BitPlane The bit position of the manipulation in the JPEG2000 mask, e.g. 𝐵𝑃 = 2; the (𝑖, 𝑗)-th pixel was modified by the operation if 1 =𝑝𝑖𝑥𝑒𝑙!,# ∧2$%&'
For the video tasks, there is one additional column:
VideoTaskDesignation Defines which video task can be supported by the probe, i.e. “spatial”, “spatial-temporal”, or “temporal”
The file <DataSet_Name>-<TaskID>-ref-journalmask.csv documents all masks for each operation in the journal, including manipulations not necessarily included in the probe. Each row is an operation; for localizable operations, a color is provided.
JournalName Same as above StartNodeID Same as above EndNodeID Same as above Operation The manipulation operation type from the journal JSON file, e.g.
“PasteSplice” Color The RGB color as a triplet of integers between 0 and 255, e.g.
255 10 0 Purpose The semantic purpose of the manipulation, e.g. an object
“remove” can be accomplished with several types of operations OperationArgument Arguments supplied with the given operation, e.g. “natural
object” AutoDesignName The design operation type applied to generate output of auto
manipulations, e.g. LaunderingFacebook_Option_1 PlugInName The name of the specific plug-in used for auto manipulations, e.g.
“GaussianLocalBlur” PlugInArguments The arguments used for the plug-in, e.g. “kernelsize 9” SubCategory Additional information in regards to the operation, e.g. GAN
For videos, there are 5 additional columns.
VideoTime The time segments, given as millisecond intervals, where video manipulation occurs (each video starts at 0 ms), e.g. 4[0, 600], [1000, 7000], [1100, 1200]7
VideoFrame The frame segments, given as integer intervals, where video manipulation occurs (each video starts at Frame 1), e.g. 4[1, 20], [40, 230], [37, 40]7
AudioTime The time segments, given as millisecond intervals, where audio manipulation occurs (start at 0 ms), e.g. 4[300, 1200]7
AudioSample The sample segments, given as integer intervals, where audio manipulation occurs, e.g. 4[10, 40]7
FrameTimeAdjustment The number of milliseconds to add to the video time segments to adjust time alignment with frames, e.g. 3
3.4.2 REFERENCE MASK
A reference mask is an image used to represent which regions of an image have been manipulated.
For the image localization tasks, the mask is a JPEG 2000 image. A white pixel indicates that the region is not manipulated while a black pixel indicates that the region is manipulated in some way. Each bit plane indicates a

Date: 2021-07-15 7
separate manipulation. The reference mask can be filtered according to the types of manipulation a system detects.
3.5 DIRECTORY STRUCTURE
The data directory provided to the performer is organized as follows (in this example, OpenMFC2020 is given as an example of <DataSet_Name>):
<BaseDir> README.txt /probe {ImageFileName1}.jpg {ImageFileName2}.tif … {VideoFileName1}.avi {VideoFileName2}.gif … /indexes OpenMFC20_Image-IMDL-index.csv OpenMFC20_Video-VMD-index.csv OpenMFC20_Image-IGMDL-index.csv OpenMFC20_Video-VGMD-index.csv /references /IMDL OpenMFC20_Image-IMDL-ref.csv OpenMFC20_Image-IMDL-ref-journalmask.csv OpenMFC20_Image-IMDL-ref-probejournaljoin.csv /mask {ImageFileName1}.jp2 {ImageFileName2}.jp2 … /VMD OpenMFC20_Video-VMD-ref.csv OpenMFC20_Video-VMD-ref-journalmask.csv OpenMFC20_Video-VMD-ref-probejournaljoin.csv /IGMDL OpenMFC20_Image-IGMDL-ref.csv OpenMFC20_Image-IGMDL-ref-journalmask.csv OpenMFC20_Image-IGMDL-ref-probejournaljoin.csv /mask {ImageFileName1}.jp2 {ImageFileName2}.jp2 … /VGMD OpenMFC20_Video-VGMD-ref.csv
4 SYSTEM INPUT
For a given task, a system’s input is the task index file, called <DataSet_Name>-<TaskID>-index.csv and found in the ‘indexes’ subdirectory. Given an index file, each row specifies a test trial. Taking the corresponding image(s) or video(s) from the ‘probe’ and ‘world’ directories as input(s), systems perform detection.

Date: 2021-07-15 8
4.1 INDEX FILE
The index files contain task ID, file ID of the probe, probe filename, probe width, probe height, device ID, and sensor ID of the specified manipulation detection trial. The probe width and probe height fields are the rendered width and height; for images, this takes into account the EXIF (exchangeable image file format) rotation field. The device ID is the high provenance capturing device (e.g. camera) of the probe; the sensor ID is a concatenation of device ID and whether the sensor used on the device was the primary or secondary capturing sensor. For example:
TaskID e.g. “Image Manipulation”, “Video Manipulation” ProbeFileID e.g. OpenMFC2020_9291, OpenMFC2020_3881 ProbeFileName e.g. probe/OpenMFC2020_9291.gif,
probe/OpenMFC2020_3881.mp4 ProbeWidth e.g. 883 ProbeHeight e.g. 431 ProbeFileSize e.g. 4049990 HPDeviceID e.g. PAR9082
5 SYSTEM OUTPUT
In this section, the types of system outputs are defined. The MediScore package5 contains a submission checker that validates the submission in both the syntactic and semantic levels. Participants should check their submission prior to sending them to NIST. NIST will reject submissions that do not pass validation. Consult the MediScore documentation for validation instructions.
5.1 SYSTEM OUTPUT FILE
The system output file must be a CSV file that includes the confidence score and the filename of the output mask (this can be omitted if no mask is required by the task, e.g. VMD). The filename for the output file must follow the naming convention: <SubID>/<SubID>.csv, where <SubID> is the submission identifier as described in Appendix A.
The system output CSV file for the image detection and localization task must follow the format below:
Col1: ProbeFileID e.g. MFC2019_5315 Col2: ConfidenceScore e.g. 0.8594 Col3: OutputProbeMaskFileName e.g. mask/MFC2019_5315-mask.png
or [blank if no localization performed] Col4: ProbeStatus i.e. Processed | NonProcessed | FailedValidation Col5: ProbeOptOutPixelValue blank for OpenMFC evaluation
The system output CSV file for the detection only tasks must follow the format below:
Col1: ProbeFileID e.g. MFC2019_1094 Col2: ConfidenceScore e.g. 0.4837 Col3: ProbeStatus i.e. Processed | NonProcessed | FailedValidation
5 Available at: https://github.com/usnistgov/MediScore/

Date: 2021-07-15 9
5.2 CONFIDENCE SCORE
The confidence score is any real number in the range [0, 1] that indicates the strength of the possibility that the probe has been manipulated. The scale of the confidence score, within the range [0, 1], is arbitrary but must be consistent across all testing trials, with larger values indicating greater chance that the image or video has been manipulated. Those scores are used to generate the performance curve displaying the range of possible operating characteristics.
5.3 PROBE STATUS
The probe status indicates if a trial was processed or not. A status of “Processed” indicates that the probe was processed and a confidence score and mask were rendered. A status of “NonProcessed” indicates that probe was not processed due to a system failure of some kind. A status of “FailedValidation” indicates that probe failed the MediScore Validator tool and will be given a score of 0—see details in the MediScore Validator ReadMe file.
The confidence scores for non-processed trials must be 0.
The process for determining which trials not to be processed must be documented in the system description (Appendix A-a).
5.4 VALIDATION
The ProbeFileID column in the system output <SubID>/<SubID>.csv must be consistent with the ProbeFileID column in the <BaseDir>/indexes/<DataSet_Name>-<TaskID>-index.csv file. The row order may change, but the two ProbeFileID columns must have a one-to-one correspondence.
The value of the ConfidenceScore column in the <BaseDir>/<SubID>.csv file is any real number in the range [0, 1].
5.5 SYSTEM DETECTION MASK FILES
The mask directory contains the system output of the mask files, defined below in Section 5.5.1, for the IMDL and IGMDL tasks. The directory path and mask filename use the following convention: <SubID>/mask/{MaskFileName}.png for masks, where it is optional to name the mask filenames as {ProbeFileID}-mask.png.
5.5.1 MASK DESCRIPTION
The system should output a mask image to represent the detected region(s) of the manipulation for the IMDL and IGMDL tasks. The size of the mask image must be exactly the same size as the probe image. The mask image must be a single channel (grey) image in PNG format. Color images and images with an alpha channel will not be evaluated. For each pixel location in the input image, the system must use a one-byte integer number between 0 and 255 to indicate whether or not that pixel has been manipulated: smaller numbers indicate a greater chance that the pixel in this location has been manipulated and vice versa. In OpenMFC2020-2021 both binary and grey-scale masks can be evaluated. For binary masks, the system output image’s pixels only have two values: 255 (not manipulated) and 0 (manipulated). For grey-scale masks, the mask scorer will report the optimum MCC over all thresholds.

Date: 2021-07-15 10
5.5.2 VALIDATION RULES FOR MASK FILES
Each MaskFileName in the system output file, <SubID>/<SubID>.csv, must exist in the ‘<SubID>/mask’ directory and be readable as a PNG file for image masks or an HDF5 file for video spatial masks. The mask file must be as described above in Section 5.5.1. Each MaskFileName in the system output file, <SubID>/<SubID>.csv, must have the same size as its corresponding original image defined in the system output file.
6 METRICS DEFINITION
Two types of metrics are used in the evaluation: score metrics and mask metrics.
6.1 SCORE METRICS
6.1.1 RECEIVER OPERATING CHARACTERISTIC (ROC)
The receiver operating characteristic (ROC) curve is used as one of the score metrics. Macmillan and Creelman [1] provide detailed information about ROC curves for detection system evaluation. Here is a brief description of the curve. In what follows, TP stands for True Positive (those correctly detected as manipulated), FN stands for False Negative (those incorrectly detected as non-manipulated), FP stands for False Positive (those incorrectly detected as manipulated), and TN stands for True Negative (those correctly detected as non-manipulated). The 𝑦-axis is the True Positive Rate (TPR) where 𝑇𝑃𝑅 ≡ 𝑇𝑃 𝑃⁄ = 𝑇𝑃 (𝑇𝑃 + 𝐹𝑁)⁄ ; this is also known as sensitivity. The 𝑥-axis is the False Positive Rate (FPR) where 𝐹𝑃𝑅 ≡ 𝐹𝑃 𝑁⁄ = 𝐹𝑃 (𝑇𝑁 + 𝐹𝑃)⁄ =𝐹𝐴𝑅; this is also known as 1–specificity. Figure 2 illustrates the ROC curve as the dark blue curve.
Figure 2: ROC and AUC

Date: 2021-07-15 11
6.1.2 AREA UNDER THE ROC CURVE (AUC)
The area under the ROC curve (AUC) is shown as the shaded beige region under the ROC curve in Figure 2. AUC quantifies the overall ability of the system to discriminate between two classes. A system no better at identifying true positives than random guessing has an AUC of 0.5. A perfect system (no false positives or false negatives) has an AUC of 1.0. The AUC-value of a system output has a value between 0 and 1.0.
6.1.3 CORRECT DETECTION (CD) AT FALSE ALARM RATE (FAR)
Another metric used is to report the Correct Detection (CD) rate on the ROC corresponding to a specified False Alarm Rate (FAR). Correct Detection rate is also known as True Positive Rate (TPR); False Alarm Rate is also known as False Positive Rate (FPR).
6.2 MASK METRICS
Two mask metrics are used: the Matthews Correlation Coefficient (MCC) and the Weighted L1 Loss Metric (WL1). Below, both are described in detail in Sections 6.2.2 and 6.2.3, respectively. Masks are only evaluated on trials in which the specified manipulation occurred. If the system output mask for a trial was not deemed worthwhile and was therefore omitted, a mask score of −1 will be given for that trial. See Table 1 under Section 6.3 for an example.
6.2.1 DEFINITION OF REGIONS
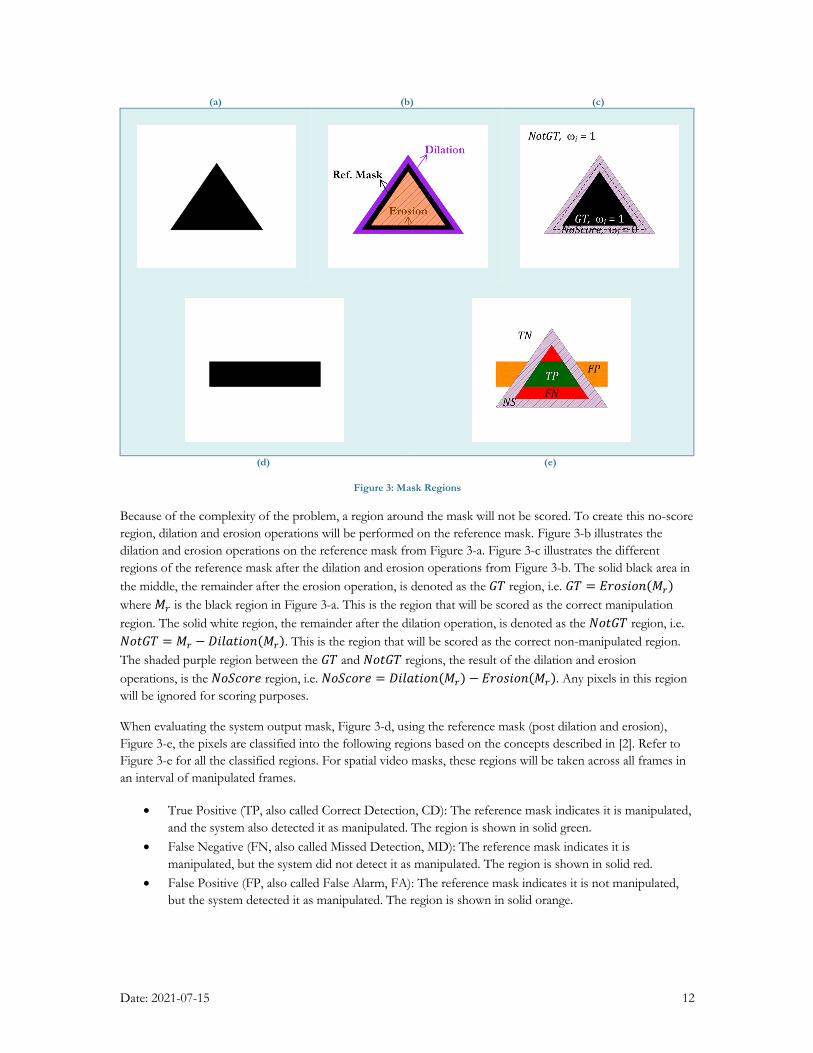
Figure 3 shows a visualization of the different mask regions used for mask image evaluations. Figure 3-a shows the reference mask while Figure 3-d shows the system output mask. Figure 3-e shows the mask regions, explained below, with the weights shown in Figure 3-c after applying the dilation and erosion operations, Figure 3-b.
Date: 2021-07-15 12
(a) (b) (c)
(d) (e)
Figure 3: Mask Regions
Because of the complexity of the problem, a region around the mask will not be scored. To create this no-score region, dilation and erosion operations will be performed on the reference mask. Figure 3-b illustrates the dilation and erosion operations on the reference mask from Figure 3-a. Figure 3-c illustrates the different regions of the reference mask after the dilation and erosion operations from Figure 3-b. The solid black area in the middle, the remainder after the erosion operation, is denoted as the 𝐺𝑇 region, i.e. 𝐺𝑇 = 𝐸𝑟𝑜𝑠𝑖𝑜𝑛(𝑀() where 𝑀( is the black region in Figure 3-a. This is the region that will be scored as the correct manipulation region. The solid white region, the remainder after the dilation operation, is denoted as the 𝑁𝑜𝑡𝐺𝑇 region, i.e. 𝑁𝑜𝑡𝐺𝑇 = 𝑀( −𝐷𝑖𝑙𝑎𝑡𝑖𝑜𝑛(𝑀(). This is the region that will be scored as the correct non-manipulated region. The shaded purple region between the 𝐺𝑇 and 𝑁𝑜𝑡𝐺𝑇 regions, the result of the dilation and erosion operations, is the 𝑁𝑜𝑆𝑐𝑜𝑟𝑒 region, i.e. 𝑁𝑜𝑆𝑐𝑜𝑟𝑒 = 𝐷𝑖𝑙𝑎𝑡𝑖𝑜𝑛(𝑀() − 𝐸𝑟𝑜𝑠𝑖𝑜𝑛(𝑀(). Any pixels in this region will be ignored for scoring purposes.
When evaluating the system output mask, Figure 3-d, using the reference mask (post dilation and erosion), Figure 3-e, the pixels are classified into the following regions based on the concepts described in [2]. Refer to Figure 3-e for all the classified regions. For spatial video masks, these regions will be taken across all frames in an interval of manipulated frames.
• True Positive (TP, also called Correct Detection, CD): The reference mask indicates it is manipulated, and the system also detected it as manipulated. The region is shown in solid green.
• False Negative (FN, also called Missed Detection, MD): The reference mask indicates it is manipulated, but the system did not detect it as manipulated. The region is shown in solid red.
• False Positive (FP, also called False Alarm, FA): The reference mask indicates it is not manipulated, but the system detected it as manipulated. The region is shown in solid orange.

Date: 2021-07-15 13
• True Negative (TN, also called Correct Rejection, CR): The reference mask indicates it is not manipulated, and the system also does not detect it as manipulated. The region is shown in solid white.
• No-Score (NS): The region of the reference mask not scored, the result of the dilation and erosion operations. The region is shown in cross-hatched purple.
6.2.2 MATTHEWS CORRELATION COEFFICIENT (MCC)
The Matthews Correlation Coefficient (MCC) is another mask metric used. Refer to Figure 3 and Section 6.2.1 for the definitions of 𝑇𝑁, 𝑇𝑃, 𝐹𝑁, and 𝐹𝑃.
MCC =𝑇𝑃 ∗ 𝑇𝑁 − 𝐹𝑃 ∗ 𝐹𝑁
S(𝑇𝑃 + 𝐹𝑃)(𝑇𝑃 + 𝐹𝑁)(𝑇𝑁 + 𝐹𝑃)(𝑇𝑁 + 𝐹𝑁)
If the denominator is zero, then we set MCC = 0.
If MCC = 1, there is perfect correlation between the reference and system output masks. If MCC = 0, there is no correlation between the reference and system output masks. If MCC = −1, there is perfect anti-correlation between the reference and system output masks.
6.2.3 WEIGHTED L1 LOSS (WL1)
The other mask metric used is Weighted L1 Loss (WL1). Given reference mask 𝑀(T and system output mask 𝑀)T , the metric is defined as:
WL1W𝑀(T,𝑀)TX =1
size(𝐺𝑇) + 𝑠𝑖𝑧𝑒(𝑁𝑜𝑡𝐺𝑇)^𝜔!`𝑀(T(𝑖) −𝑀)T(𝑖)`
255
*
!+'
Here, we have 𝑁 = sizeW𝑀(TX = sizeW𝑀)TX and
𝜔! = b0,if𝑖 ∈ 𝐷𝑖𝑙𝑎𝑡𝑒(𝑀()and𝑖 ∉ 𝐸𝑟𝑜𝑠𝑖𝑜𝑛(𝑀()1,otherwise
Both mask images, 𝑀(T and 𝑀)T , are normalized by 255.
6.2.4 ORACLE MEASUREMENTS FOR MASK SCORING
Implicit in several mask metrics is the identification of a threshold value for which the system determines a given pixel to be modified. Systems are expected to provide a single threshold to be used for all masks; however, other thresholds using the reference data as an oracle can be used. For the OpenMFC, the following names designate the rule used to determine the threshold, which separates manipulated and non-manipulated pixels. These names will be used as a prefix to the measurement name, for example “Actual MCC”.
• Actual – The metric is calculated using the system-provided global threshold • Maximum (Minimum) – The metric is calculated using a single ideal global threshold found by
computing metric scores over all thresholds over all masks • Optimum – The metric is calculated using an ideal mask-specific threshold found by computing
metric scores over all thresholds
Date: 2021-07-15 14
6.3 MASK SCORING EVALUATION CONDITION
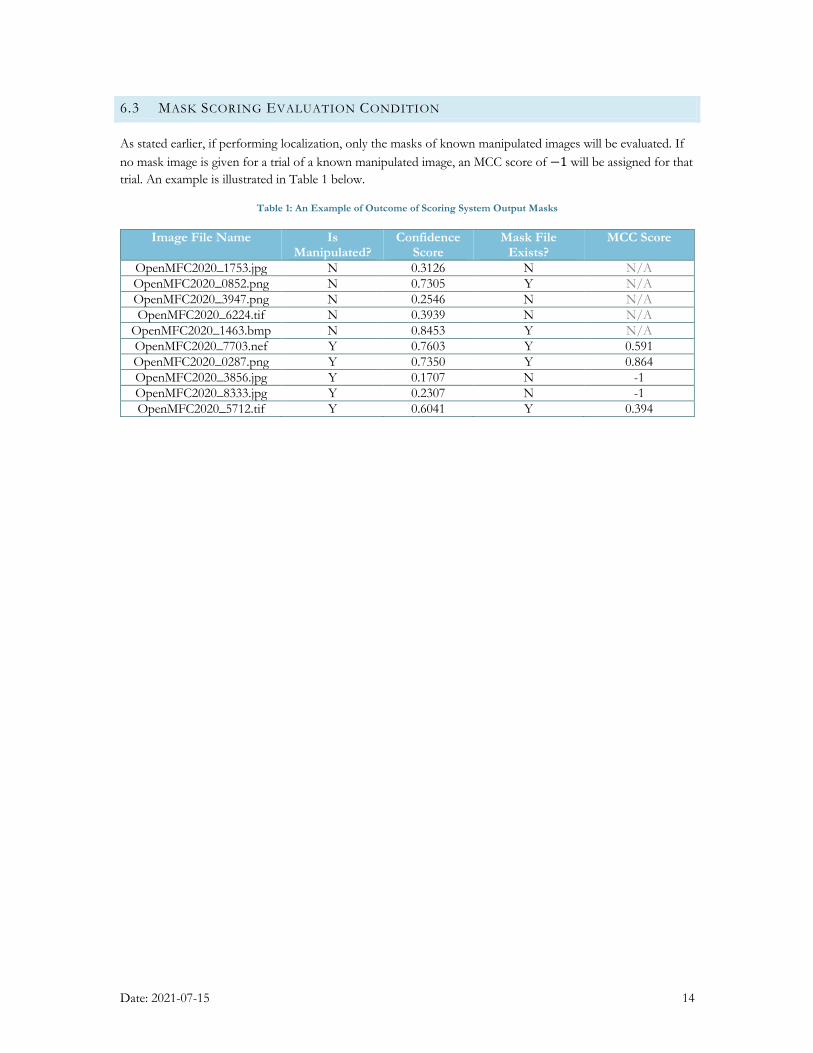
As stated earlier, if performing localization, only the masks of known manipulated images will be evaluated. If no mask image is given for a trial of a known manipulated image, an MCC score of −1 will be assigned for that trial. An example is illustrated in Table 1 below.
Table 1: An Example of Outcome of Scoring System Output Masks
Image File Name Is Manipulated?
Confidence Score
Mask File Exists?
MCC Score
OpenMFC2020_1753.jpg N 0.3126 N N/A OpenMFC2020_0852.png N 0.7305 Y N/A OpenMFC2020_3947.png N 0.2546 N N/A OpenMFC2020_6224.tif N 0.3939 N N/A
OpenMFC2020_1463.bmp N 0.8453 Y N/A OpenMFC2020_7703.nef Y 0.7603 Y 0.591 OpenMFC2020_0287.png Y 0.7350 Y 0.864 OpenMFC2020_3856.jpg Y 0.1707 N -1 OpenMFC2020_8333.jpg Y 0.2307 N -1 OpenMFC2020_5712.tif Y 0.6041 Y 0.394

Date: 2021-07-15 15
Appendix A SUBMISSION INSTRUCTIONS
System output and documentation submission to NIST for subsequent scoring must be made on the https://mfc.nist.gov/ web site. The submission protocol, (which is also documented on the https://mfc.nist.gov/#pills-submission-rules) consisting of three steps: (a) preparing a system description and self-validating system outputs, (b) packaging system outputs and system descriptions, and (c) identifying the “system” and transmitting the data to NIST.
The packaging and file naming conventions for OpenMFC rely on Submission Identifiers (SubID) to organize and identify the system output files and system description files for each evaluation task/condition. <SubID> is a user-defined string that identifies the submission and contains no spaces or special characters.
A-a SYSTEM DESCRIPTIONS
Documenting each system is vital to interpreting evaluation results. As such, each submitted system, determined by unique experiment identifiers, must be accompanied by a system description with the following information.
Section 1 Submission Identifier(s)
List all the submission IDs for which system outputs were submitted. Submission IDs are described in further detail above.
Section 2 System Description
A brief technical description of your system.
Section 3 System Hardware Description and Runtime Computation
Describe the computing hardware setup(s) and report the number of CPU and GPU cores. A hardware setup is the aggregate of all computational components used.
Report salient runtime statistics including: wall clock time to process the index file, wall clock time to index the world data set and the provenance tasks, index size for the world data set, resident memory size of the index, etc.
Section 4 Training Data and Knowledge Sources
List the resources used for system development and runtime knowledge sources beyond the provided OpenMFC corpora.
Section 5 References
List pertinent references, if any.
A-b PACKAGING SUBMISSIONS
Using the SubID, all system output submissions must be formatted according to the following directory structure:
<SubID>/

Date: 2021-07-15 16
<SubID>.txt The system description file, described in Appendix A-a
<SubID>.csv The system output file, described in Section 5.1.
/mask The system output mask directory {MaskFileName1}.png The system output mask file directory,
described in Section 5.5.1 {MaskFileName2}.png … As an example, if the earlier team is submitting, their directory would be: p-baseline_3_imdl/ p-baseline_3_imdl.txt p-baseline_3_imdl.csv /mask
A-c TRANSMITTING SUBMISSIONS
To prepare your submission, create the previously described directory structure and make a .tar file via the UNIX command ‘tar cvf <SubID>.tar <SubID>’. Make the file downloadable on a publicly available webserver. Per the submission instructions, you will submit the system output under a new or existing ‘System’ label. This system label is a longitudinal tracking mechanism that will allow you to track improvements to your specific technology over time. To create new systems, use the ‘Add new System’ button on the ‘Submission Management’ page. Once a system is present, click the respective ‘Upload’ button to make a submission. On the ‘New submission’ form page please specify submission conditions and provide the URL of your downloadable file. Press the ‘Submit’ button to finalize the submission. The evaluation scoring backend will then queue your submission for download and processing. You can check the status of your submission anytime by going to the ‘Submission Management’ page. See further instructions on https://mfc.nist.gov/#pills-submission-rules. For more information about submission management see https://mfc.nist.gov/help/submissions.
Please submit your files in time for us to deal with any transmission errors that might occur well before the due date if possible. Note that submissions received after the stated due dates for any reason will be marked late.
Date: 2021-07-15 17
Appendix B CSV FILE FORMAT SPECIFICATIONS
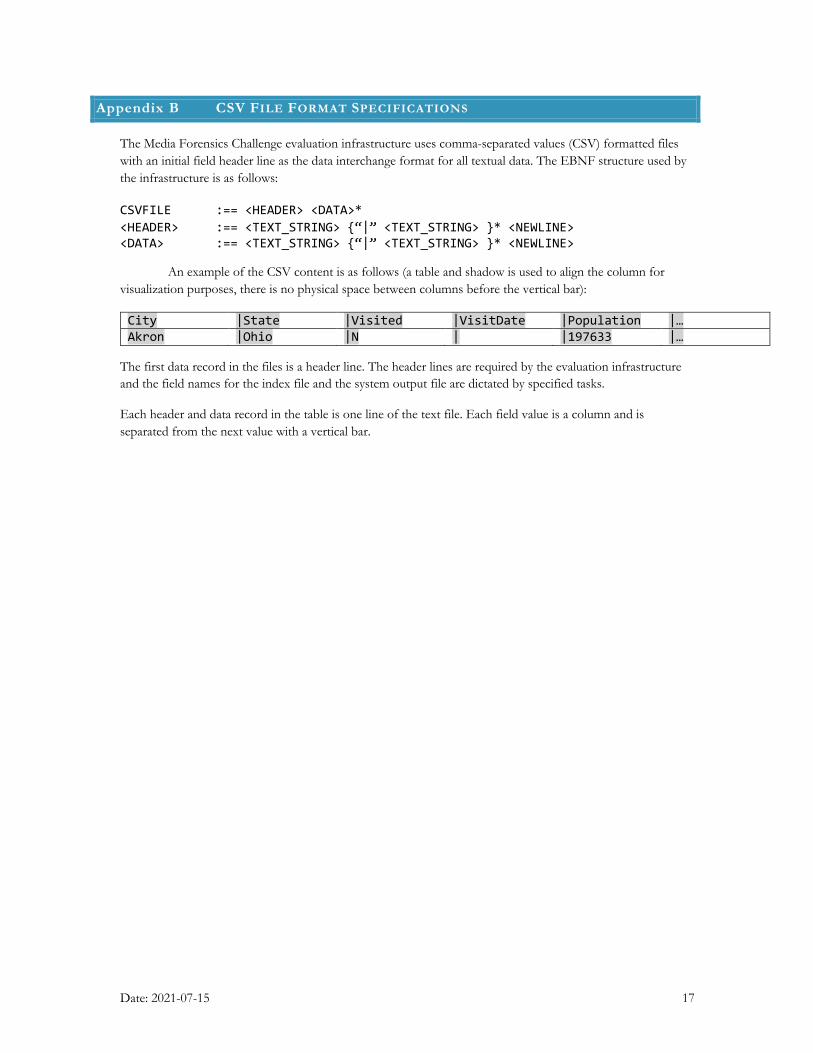
The Media Forensics Challenge evaluation infrastructure uses comma-separated values (CSV) formatted files with an initial field header line as the data interchange format for all textual data. The EBNF structure used by the infrastructure is as follows:
CSVFILE :== <HEADER> <DATA>* <HEADER> :== <TEXT_STRING> {“|” <TEXT_STRING> }* <NEWLINE> <DATA> :== <TEXT_STRING> {“|” <TEXT_STRING> }* <NEWLINE>
An example of the CSV content is as follows (a table and shadow is used to align the column for visualization purposes, there is no physical space between columns before the vertical bar):
City |State |Visited |VisitDate |Population |… Akron |Ohio |N | |197633 |…
The first data record in the files is a header line. The header lines are required by the evaluation infrastructure and the field names for the index file and the system output file are dictated by specified tasks.
Each header and data record in the table is one line of the text file. Each field value is a column and is separated from the next value with a vertical bar.

Date: 2021-07-15 18
Appendix C DETECTION SCORER USAGE
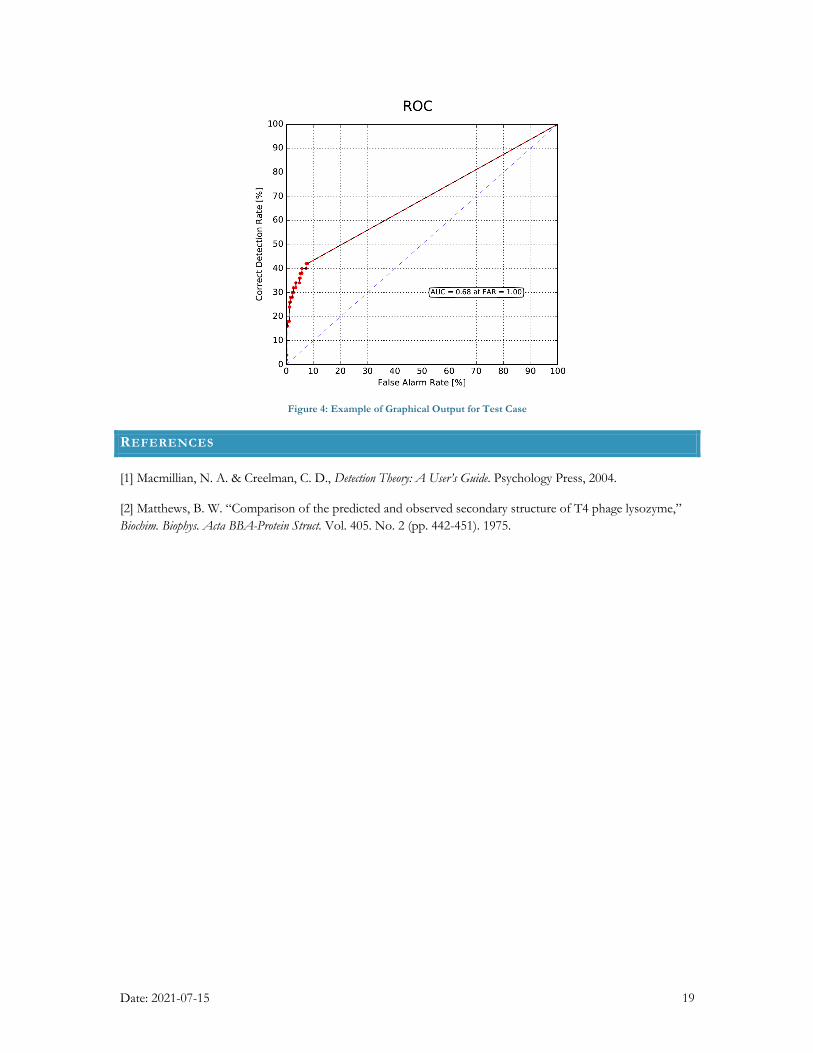
The DetectionScorer script calculates the performance measures of AUC (see Section 6.1.2) and equal error rate (EER) based on a system’s output (e.g., confidence scores) for the manipulation and splice detection tasks. Two files are produced. The first is a CSV file containing a report table. The report table contains the measures AUC, EER, and the confidence interval for the AUC (AUC_CI). The second output is an Adobe PDF file containing a graphical plot. The plot displays the ROC (see Section 6.1.1) from the results of the algorithm performance as well as the AUC. The AUC can be partial (up to a certain FAR value) or full (when FAR value is set to 1.00).
Here is a test case.
python DetectionScorer.py -t manipulation --refDir ../../data/test_suite/detectionScorerTests/ -r reference/OpenMFC2020-imdl-ref.csv -x reference/OpenMFC2020-imdl-index.csv --sysDir ../../data/test_suite/detectionScorerTests/baseline -s Base_OpenMFC2020_imdl_ImgOnly_p-copymove_01.csv --outRoot ./testcases/OpenMFC20_001 --ci --display
Table 2: Example of Report Table Output for Test Case
AUC FAR_STOP EER AUC_CI_LOWER AUC_CI_UPPER
0.679533 1 0.328889 0.620826 0.735491
Date: 2021-07-15 19
Figure 4: Example of Graphical Output for Test Case
REFERENCES
[1] Macmillian, N. A. & Creelman, C. D., Detection Theory: A User’s Guide. Psychology Press, 2004.
[2] Matthews, B. W. “Comparison of the predicted and observed secondary structure of T4 phage lysozyme,” Biochim. Biophys. Acta BBA-Protein Struct. Vol. 405. No. 2 (pp. 442-451). 1975.