Embed Size (px)
Citation preview
Melton City Council
Open Space Plan 2016-2026
February 2016
Background report
2Open Space Plan Background Report
This report has been prepared by:
ROSS Planning Pty Ltd ABN 32 508 029 959 Upper floor, 63 Bay Terrace Wynnum QLD 4178
PO Box 5660 Manly QLD 4179
Telephone: (07) 3901 0730 Fax: (07) 3893 0593
© 2015 ROSS Planning Pty LtdThis document may only be used for the purpose for which it was commissioned and in accordance with the terms of engagement for the commissions. Unauthorised use of this document in any form whatsoever is prohibited.
Version control:Version Date Document Author Reviewer Recipient
1 26.05.15 Draft CP & DC DC AC2 11.09.15 Reviewed
draftCP & DC DC AC
3 26.10.15 Final draft CP & DC DC AC & CL4 20.11.15 Final draft
(revised)CP & DC DC AC & CL
ContentsGlossary of terms 3List of tables 31. Introduction 41.1 Purpose 41.2 Scope 4
2. Background 62.1 What is open space? 62.2 Benefits of open space 72.3 Trends in open space 8
3. Analysis 143.1 Population and demographic considerations 143.2 Strategic document review 163.3 Council consultation 183.4 Open space planning approaches 183.5 Preferred open space planning approach 19
4. City of Melton’s open space network 204.1 Melton City geographic planning areas 204.2 Open space classification framework 224.3 Desired standards of service 234.4 Open space types 244.5 Open space assessment by planning area 34
5. Strategic directions 80Appendices 81Appendix 1 - State sporting organisation planning considerations 82Appendix 2 - Desired facility provision standards 84Appendix 3 - Desired facility provision standards 88Appendix 4 - Desired pavilion provision standards 98
3Open Space Plan Background Report
Glossary of termsActive open space Land designated for formal outdoor sports. May also include passive recreation opportunities
Active recreation Organised and (generally) competitive formal outdoor sporting activityEncumbered open space Land that is constrained for development purposes. Includes easements for power/transmission lines,
sewers, gas, waterways/drainage; retarding basins/wetlands; landfill; conservation and heritage areas. This land may be used for a range of recreation activities (e.g. walking trails, sports fields), however, it is not provided as credit against public open space requirements. Regard is taken to the availability of encumbered land when determining over-arching open space requirements
Environmental open space Land that contains biodiversity features of significance. As the primary use of the open space is for environmental protection, the area is likely to be encumbered and may preclude unrestricted public access
Linear open space Long and narrow interconnected open space that can contain natural creek lines and associated riparian vegetation. Linear open space can also play an important secondary role providing cycle and pedestrian pathways, and values consistent with other open space categories
Open space Land available for public recreation, pedestrian and cycle movement, sport or for nature conservation. It is generally managed by Council or other public authorities, such as water authorities or Parks Victoria
Passive open space Land designated for passive recreation, play and unstructured physical activity (e.g. walking, cycling, hiking, contemplation and enjoying nature). May include parks, gardens, public squares and community gardens
Passive recreation Non-organised, non-competitive open space activity undertaken for enjoyment (e.g. walking and cycling)Precinct Structure Plan A statutory document that describes how a precinct or series of sites within a growth area will be developed
over time. A precinct structure plan sets out the broad environmental, social and economic parameters for the use and development of land within the precinct
Unencumbered open space Land designated for open space without encumbrances such as easements, flooding, waterways/drainage, conservation etc. Only unencumbered open space is recognised as open space development contribution
List of tablesTable 1. Top ten non-organised physical activities 8Table 2. Top ten organised physical activities 8Table 3. Constraints and Motivators for participation in sports and physical recreation
(National level) 11Table 4. Age cohort breakdown by % (2014 and 2036) 14Table 5. Demographic considerations 15Table 6. Localities and PSPs within planning areas 21Table 7. Open space classification system 22Table 8. Examples of multi-function open space 22Table 9. DSS for core open space 23Table 10. Local passive open space - DSS 25Table 11. District passive open space - DSS 26Table 12. Regional passive open space - DSS 27Table 13. Linear passive open space - DSS 28Table 14. District active open space - DSS 30Table 15. Regional active open space - DSS 31Table 16. Northern Rural population projections 34Table 17. Northern Rural open space demand and supply assessment 37Table 18. Diggers Rest population projections 38Table 19. Diggers Rest open space demand and supply assessment 42Table 20. Melton Township population projections 44Table 21. Melton Township open space demand and supply assessment 49Table 22. North-West population projections 50Table 23. Proposed core open space in Warrensbrook and Melton East PSPs 51Table 24. North-West open space demand and supply assessment 53Table 25. North-East population projections 54Table 26. Proposed core open space in Plumpton and Kororoit PSPs 55Table 27. North-East open space demand and supply assessment 57Table 28. Eastern Corridor population projections 58Table 29. Eastern Corridor open space demand and supply assessment 61Table 30. Toolern population projections 62Table 31. Toolern open space demand and supply assessment 65
Table 32. South-West population projections 66Table 33. Proposed core open space in Rockbank, Rockbank South and Mt Atkinson
PSPs 68Table 34. South-West open space demand and supply assessment 69Table 35. Southern Rural population projections 72Table 36. Southern Rural open space demand and supply assessment 75Table 37. Eynesbury population projections 76Table 38. Eynesbury open space demand and supply assessment 79Table 39. State sporting organisation future planning considerations 82Table 40. Sport desired provision rates 84Table 41. Potential sports facility requirements 85Table 42. Athletics playing area considerations 89Table 43. Athletics associated infrastructure considerations 89Table 44. AFL and cricket playing surface considerations 90Table 45. AFL and cricket associated infrastructure considerations 90Table 46. Baseball and softball playing surface considerations 91Table 47. Baseball and softball associated infrastructure considerations 91Table 48. Bowls playing surface considerations 92Table 49. Bowls associated infrastructure considerations 92Table 50. Football (soccer) playing surface considerations 93Table 51. Football (soccer) associated infrastructure considerations 93Table 52. Hockey and lacrosse playing surface considerations 94Table 53. Hockey and lacrosse associated infrastructure considerations 94Table 54. Netball (outdoor) playing surface considerations 95Table 55. Netball (outdoor) associated infrastructure considerations 95Table 56. Rugby league, rugby union and gridiron playing surface considerations 96Table 57. Rugby league, rugby union and gridiron associated infrastructure
considerations 96Table 58. Tennis playing surface considerations 97Table 59. Tennis associated infrastructure considerations 97Table 60. Desired pavilion provision standards 98
4Open Space Plan Background Report
1. Introduction1.1 Purpose This important project has included identifying trends in open space development, analysing current and planned open space supply and providing clear direction for the provision of open space and recreation facilities to meet the needs of existing and future communities.
A successful open space network is the result of considerable planning and an understanding of local influences (climate; geography; social, culture and political capacity). Therefore, this Open Space Plan is based on foundations that consider and embrace these matters. It has been developed giving thought to what is known about the City’s open space, an understanding of local people’s preferences to different open space types and functions, Council’s (and the community’s) capacity to deliver the infrastructure and the State’s preferences and guidelines for planning for open space.
Melton City’s approach to open space planning is framed by the legislative and policy environment for Victoria, Metropolitan Planning Authority and Melton City Council.
Strategic issues such as population growth, compact living and sustainability goals have been considered. The community’s aspirations and expectations in regard to open space have also been paramount in the development of this Plan.
1.2 ScopeThe Plan focuses on public open space. Natural areas, including state-owned conservation lands, have been considered for their current role in providing for nature-based recreation, however, are not assessed for future (land) provision as its primary purpose is for conservation and preservation (not active or passive recreation). This Plan does not provide detailed analysis of each individual Council reserve or detailed operational actions1, however, it acts to provide strategic guidance on key identified issues from the open space network.
Information contained within this Plan is based on an audit and assessment of the City’s open space network, and is a snapshot in time only. This information is accurate as at May 2015. Any open space developments or data updates since this time have not been taken into account.
The Open Space Plan is presented as two documents - a Background Report and the Plan. The Background Report provides the reader with contextual understanding, while the Plan provides a summary of the open space classification framework, open space analysis and actions.
1 Addressed in Council’s Review of Parks and Reserves (2013)
5Open Space Plan Background Report
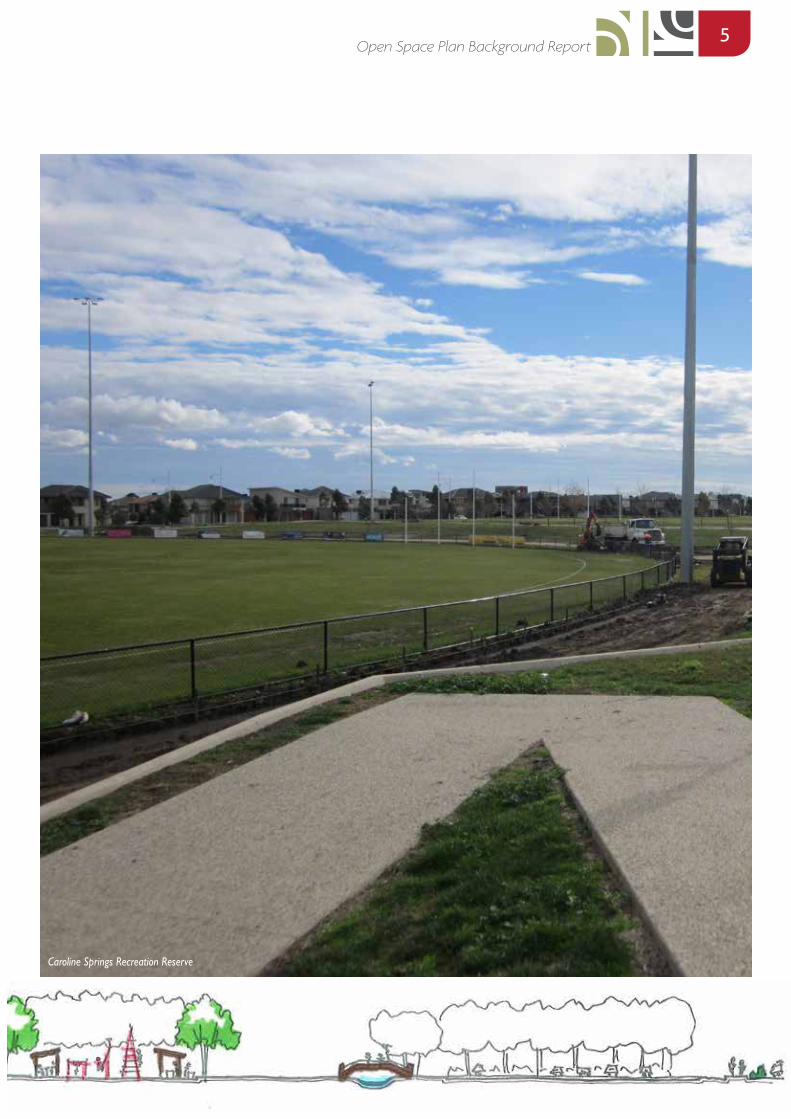
Caroline Springs Recreation Reserve
6Open Space Plan Background Report
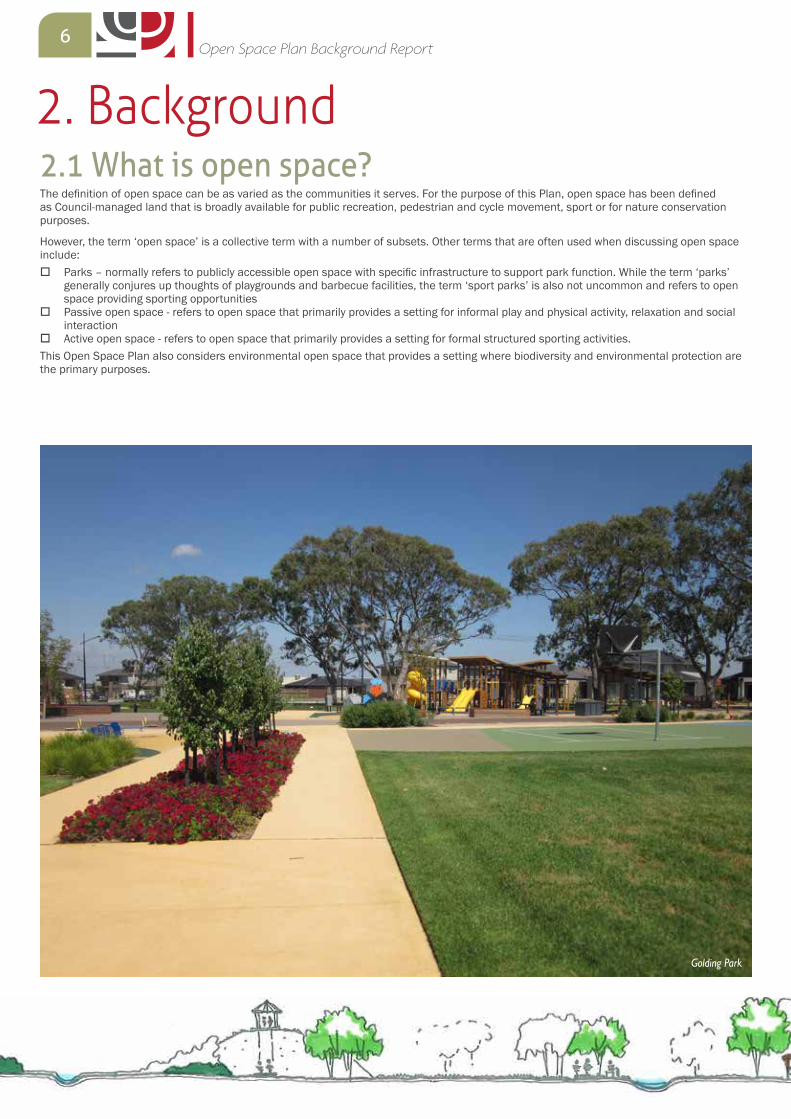
2. Background2.1 What is open space? The definition of open space can be as varied as the communities it serves. For the purpose of this Plan, open space has been defined as Council-managed land that is broadly available for public recreation, pedestrian and cycle movement, sport or for nature conservation purposes.
However, the term ‘open space’ is a collective term with a number of subsets. Other terms that are often used when discussing open space include:
� Parks – normally refers to publicly accessible open space with specific infrastructure to support park function. While the term ‘parks’ generally conjures up thoughts of playgrounds and barbecue facilities, the term ‘sport parks’ is also not uncommon and refers to open space providing sporting opportunities
� Passive open space - refers to open space that primarily provides a setting for informal play and physical activity, relaxation and social interaction
� Active open space - refers to open space that primarily provides a setting for formal structured sporting activities.This Open Space Plan also considers environmental open space that provides a setting where biodiversity and environmental protection are the primary purposes.
Golding Park
7Open Space Plan Background Report
Golding Park
Benefits to individuals � Improved health is available to individuals through participation
in open space activities. Research has shown1 that quality access to open space (specifically parks, sporting fields and their connectivity) increases physical activity frequency
� Opportunities exist to develop physical, social and decision-making skills through participation in open space activities
� Participation in open space activities and connection to nature can help individuals explore strategies for conflict resolution and enhance mental health and wellbeing by reducing stress and anxiety.
Benefits to communities � Open space provision is essential for strengthening and
maintaining a healthy community. Open space areas can provide a focal point for community gathering, promote interaction and combat social isolation2
� Participation in open space activities can improve social cohesion, build cultural tolerance and support for seniors and people with a disability
� Open space can provide areas of high visual amenity and attractiveness
� Open space areas can be used to record and retain history through place names, commemorative buildings and memorials and preserved areas of cultural significance
� Open space can provide connectivity. Recreation paths along open space corridors can link residential areas with key community facilities
� Open space can provide buffers between incompatible land uses
� Well-designed, maintained, effectively utilised and activated open space contributes to improved perceptions of safety and can lead to reduced opportunity for crime to occur3.
1 World Health Organisation, Global Action Plan for the prevention and control on non-communicable diseases 2013-20.
2 Montgomery, J. (2005). Community Place and Buildings: The Role of Community Facilities in Developing Community Spirit. Stronger Communities Conference, Melbourne, Australia.
3 City of Melton, Safer City Plan 2015-17.
Benefits to the environment � Open space can help to maintain a sustainable environment by
reducing water run-off and flooding-related problems, offsetting carbon emissions and filtering pollutants (trees)4
� Where open space provides for quality active transport opportunities (e.g. cycleways and walking paths/trails) and walking and cycling replace car trips, additional environmental benefits include reduced traffic congestion, reduced air pollution, reduced greenhouse emissions and reduced noise pollution5
� Daytime temperatures have been found to be up to 3oC cooler in large urban parks than the surrounding streets as a result of moisture released from trees6
� Open spaces provide habitats that support ecosystems. Even highly maintained urban open spaces can be host to a range of mammals, insects, birds and aquatic plant life7
� Open space, and in particular natural open space, can have high environmental values as this land may support species and ecosystems not reserved in national parks or other conservation reserves. They may support species and ecosystems that are of national or state significance; and may act as corridor linkages between larger areas of environmental value.
Benefits to the economy � Quality open space can increase the value of nearby properties8 � Creating supportive environments where participation in sport
and physical activity is accessible, available and affordable, can aid in reducing health care costs associated with increased rates of overweight and obesity, as well as their related non-communicable diseases (e.g. cardiovascular disease, diabetes and some cancers)1
� Quality open space can attract businesses, employees and tourists. Research has shown that recreation, parks and open space are some of the most important factors when new business locations are considered9
� Many events are hosted in open space areas - from small local community-based events, through to those of national and international importance.
4 Relf, D. (1996). Plants Actually Clean the Air.5 Western Australia Department of Sport and Recreation.(2009). factsandstats –
Benefits of Physical Activity - www.dsr.wa.gov.au6 Urban Green Space Task Force (2002). Green Spaces, Better Places.7 XI World Forestry Congress (1997). Significance of Green Areas to Biodiversity
and the Environment.8 Tibbatts, D. (2002). Your Parks – The benefits of parks and greenspace. Urban
Parks Forum.9 Trust for Public Land (United States of America). (1999). Open Space and
Attracting Investment – a forum presentation.
2.2 Benefits of open space Open space can improve an individual’s physical and psychological health; strengthen communities and the economy; and make neighbourhoods more attractive places to live, work and visit through implementation of Healthy by Design Principles and Environments for Health Framework.
8Open Space Plan Background Report
2.3 Trends in open spaceParticipation patterns in sport and leisure are changing at a community-level. Factors such as a move toward non-organised structured sport, increased use of technology and increased time pressures have all had a significant impact on the industry.
Understanding these trends (and their impacts) is important as Council looks to develop strategies, programs and facilities to encourage people to engage in recreation and environmental activities.
Participation considerationsA snapshot:
� For adults – a move away from traditional organised sport toward physical activity and non-organised (social) sport � For children – decreases in physical activity (although formal sport participation has not changed), increases in obesity and increases in
the amount of leisure time in indoor activities such as computer use. Key findings from the Participation in Exercise, Recreation and Sport Survey1 (ERASS –national and state trends) and the Melton City Council Active Participation Survey2 (local trends) are highlighted below:
1 Australian Sports Commission, 20102 ROSS Planning, 2013
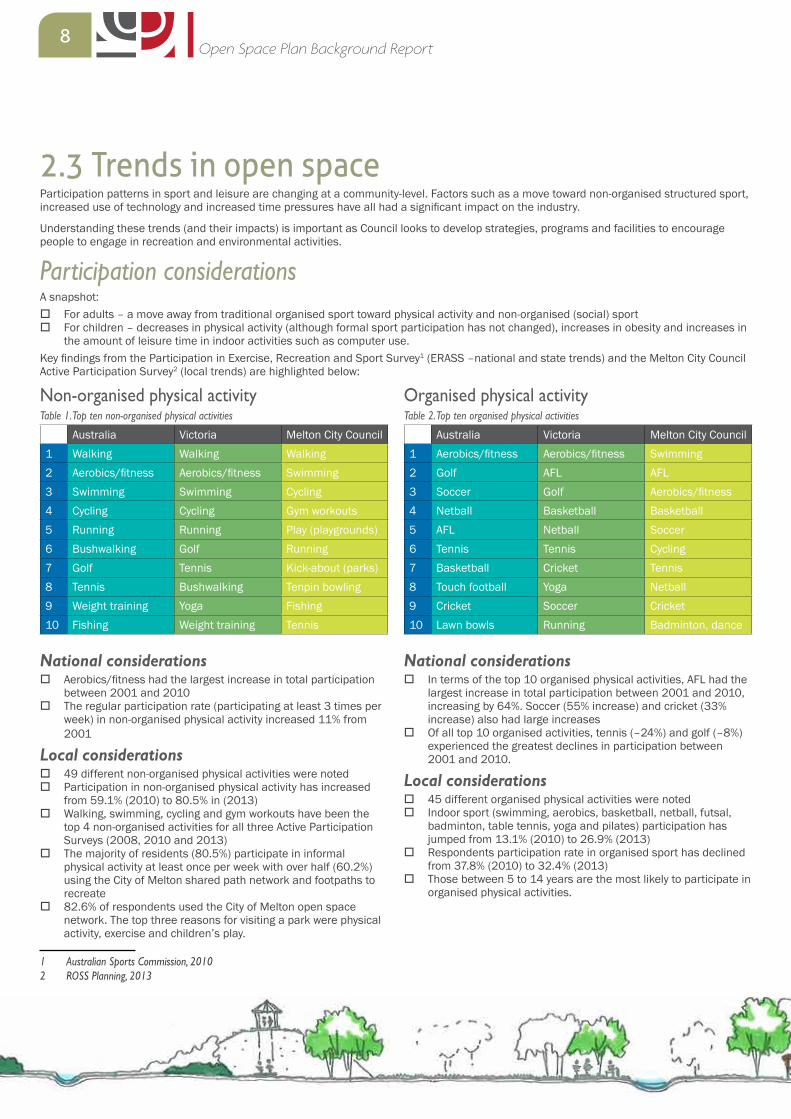
Non-organised physical activityTable 1. Top ten non-organised physical activities
Australia Victoria Melton City Council1 Walking Walking Walking2 Aerobics/fitness Aerobics/fitness Swimming3 Swimming Swimming Cycling4 Cycling Cycling Gym workouts5 Running Running Play (playgrounds)6 Bushwalking Golf Running7 Golf Tennis Kick-about (parks) 8 Tennis Bushwalking Tenpin bowling9 Weight training Yoga Fishing10 Fishing Weight training Tennis
National considerations � Aerobics/fitness had the largest increase in total participation
between 2001 and 2010 � The regular participation rate (participating at least 3 times per
week) in non-organised physical activity increased 11% from 2001
Local considerations � 49 different non-organised physical activities were noted � Participation in non-organised physical activity has increased
from 59.1% (2010) to 80.5% in (2013) � Walking, swimming, cycling and gym workouts have been the
top 4 non-organised activities for all three Active Participation Surveys (2008, 2010 and 2013)
� The majority of residents (80.5%) participate in informal physical activity at least once per week with over half (60.2%) using the City of Melton shared path network and footpaths to recreate
� 82.6% of respondents used the City of Melton open space network. The top three reasons for visiting a park were physical activity, exercise and children’s play.
Organised physical activityTable 2. Top ten organised physical activities
Australia Victoria Melton City Council1 Aerobics/fitness Aerobics/fitness Swimming2 Golf AFL AFL3 Soccer Golf Aerobics/fitness4 Netball Basketball Basketball5 AFL Netball Soccer6 Tennis Tennis Cycling7 Basketball Cricket Tennis8 Touch football Yoga Netball9 Cricket Soccer Cricket10 Lawn bowls Running Badminton, dance
National considerations � In terms of the top 10 organised physical activities, AFL had the
largest increase in total participation between 2001 and 2010, increasing by 64%. Soccer (55% increase) and cricket (33% increase) also had large increases
� Of all top 10 organised activities, tennis (–24%) and golf (–8%) experienced the greatest declines in participation between 2001 and 2010.
Local considerations � 45 different organised physical activities were noted � Indoor sport (swimming, aerobics, basketball, netball, futsal,
badminton, table tennis, yoga and pilates) participation has jumped from 13.1% (2010) to 26.9% (2013)
� Respondents participation rate in organised sport has declined from 37.8% (2010) to 32.4% (2013)
� Those between 5 to 14 years are the most likely to participate in organised physical activities.
9Open Space Plan Background Report
Impacts of technologyTraditional sport and leisure providers are not only competing against each other for participants but also against non-physical activities such as the internet and computer games.
The ABS nation-wide Children’s (5 to 14 years) Participation in Cultural and Leisure Activities Survey showed there had been no increase in the use of internet and other screen-based activities between 2003 and 2006. However, significant increases were found between 2006 and 2009 (the most recent occasion the survey was conducted).
While there are a number of movement-based computer gaming consoles (such as Wii) that can provide a level of physical activity, a much larger proportion provide predominantly sedentary activity.
The increases in the amount of time young people are spending playing computer games, using the internet and watching television is limiting available time for recreation.
However, councils are beginning to embrace technology as an opportunity to encourage people to use open space. Emerging technologies, such as QR (Quick Response) codes, and the provision of Wi-Fi in open spaces are popular.
The City of Melton has recently utilised QR code technology as a part of shared path network signage and fitness equipment. Scanning the QR code on the path signage with a phone or tablet provides access to online maps that identify where the person is, points of interest in the area and infrastructure (i.e. shared paths, BBQ, toilets). Additionally, the QR codes on the fitness equipment takes the user to the manufacturer’s website where appropriate use of each item of equipment is detailed.
An ageing societyThe population of Melton City Council is expected to age slightly in coming years, with the proportion of people aged 65 years and over rising from 8.2% (in 2015) to 10.6% (in 2026)1. This trend is expected to continue up to and after the anticipated ultimate growth. It is important to note that this ‘slight’ ageing is in contrast to much of Australia where marked ageing is expected.
An older society will have a greater demand for passive and informal recreation opportunities than a younger society. Access to playing fields and formal sport opportunities will continue to be important as the numbers of young people will continue to increase. Additionally, with the trend for grandparents to be carers for their grandchildren increasing2, the need for recreation and play opportunities (outside formal care centres) will continue to exist. However, greater emphasis will be needed on the requirements of older people likely to be seeking walking, cycling and other low impact physical activity. Parks and public open space will require wider pathways, improved wheelchair/disabled access, more lighting, dog parks and the presence of shaded seats for resting along pathways. The increased use of mobility scooters as a favourable method of transportation will also need to be recognised and reflected in the development of a quality cycleway/pedestrian network.
There is also anecdotal evidence of an increase in participation in masters sports (formal sporting fixtures and carnivals for participants, generally, thirty-five years and above). Sports such as football (soccer) have maintained masters-level fixtures for a number of years, while large State, National, Pan Pacific and World Masters multi-sports carnivals are regularly conducted across Australia. These events are placing increasing pressure on existing sports facility networks. However, it should be noted that these participation observations are yet to be reflected in research conducted by the Australian Bureau of Statistics (ABS).
1 forecast.id (accessed May 2015)2 Australian Bureau of Statistics (2011). Childhood Education and Care Survey
Becoming time poorWhile the popularity of technology appears to be reducing available time for young people to be involved in leisure pursuits, the adult population is also becoming time poor.
Extended trading hours, shift work, increasing numbers in part-time and casual employment and new communications media are changing the concept of the nine to five, five-day work week to a more flexible work/life style. The traditional notion of recreation participation on weekends is diminishing and people are seeking more flexibility in facility opening hours and programming, and scheduling of training and competition.
There is increasing demand for drop-in drop-out (or pay-as-you-go) sport and leisure options where participants are looking for opportunities without additional commitments (training, volunteering etc). Similarly, having limited uncommitted time for recreation pursuits is likely to push people more toward unstructured individual activities (e.g. walking, fitness) that can be conducted at flexible times rather than more traditional sport (particularly team sports) with fixed schedules. Many people are seeking to do activities at their own convenience.
For a significant proportion of Melton City Council residents, there is additional time pressure associated with the need to travel outside the LGA for work. In 20113, 65.8% of the workforce commuted to a workplace outside Melton. The additional time pressures involved in travel to work further reduce the uncommitted time available for physical activity and recreation pursuits.
Rising cost of sport The cost of participating in sport is increasing. Cost is now a barrier to participation for many people. A survey of parents of Australian children aged 5-14 years found that cost is a significant factor for parents when allowing their children to participate in organised sport4.
With the City of Melton having a moderately high proportion of people from a low socio-economic background (particularly in Melton Township), access to free and/or low cost physical activity options will grow in importance.
3 profile.id (accessed May 2015)4 Hardy et al.,2010
10Open Space Plan Background Report
Barriers and motivators in participationIt is important that councils and other organisations that provide recreation opportunities understand what motivates or prevents members of the public from participation. Understanding these motivations and constraints allows organisations to develop strategies and programs that embrace the motivations and overcome the constraints/barriers to participation.
Barriers Barriers to participation in sport and physical activity vary between individuals. However, research1,2 has identified consistent factors.
� Lack of time (due to work and/or family) is the most frequently reported barrier to participation for all adults under 55 years
� Poor health is the most frequently reported barrier for those aged 55 years and over.
GenderThe ABS findings confirm the demand for flexible operation times and physical activity programs with ‘lack of time due to work’ the most common constraint for males. For females, ‘not interested’, ‘age/too old’, ‘injury/illness’ and ‘lack of time due to work’ are all key constraints. This highlights the need for both flexible timing of program delivery and also the need for a range of interesting age- and ability-specific programs being available.
Youth (0-15 years old)While the ABS survey did not consider youth participation, previous research3 has identified key barriers for youth participation to include:
� Feeling uncomfortable, body image � Parents do not approve � Too much effort � Commitments (family, work, study) � Influence of peers.
Seniors (65 years and older)Taken together, the ABS and Australian Sports Commission reports suggest that common barriers for participation by seniors include:
� Feeling old (stereotyped images) � Injury, illness, poor health � Lack of confidence � Lack of appropriate opportunities and/or specialist trainers � Lack of transport and access.
1 Australian Bureau of Statistics (2007). Motivators and Constraints to Participation in Sports and Physical Recreation
2 Australian Sports Commission (2001). Older, smarter, fitter: a guide for providers of sport and physical activity programs for older Australians
3 Taggart, A. & Sharp, S. (2000). Adolescents and Sport: Determinants of current and future participation. Sport and Physical Activity Research Centre, Edith Cowan University
MotivatorsThe two most common reasons for people participating in physical activity and other recreation pursuits is to participate for ‘health/fitness benefits’ and for ‘enjoyment’. These results are consistent for both males and females.
GenderMales are somewhat more motivated by ‘enjoyment’ than females, while ‘weight control’ is a more important factor for females.
Youth (0-15 years old)Key motivators for youth participation include:
� Enjoying the activity � Health/fitness � Success – they are good at it � They participated in the activity at school first and enjoyed it � Their friends participate.
Seniors (65 years and over)Common factors that encourage seniors to participate include:
� Improving health/fitness � Enjoyment � Companionship � Increasing self-esteem and control over one’s life.
11Open Space Plan Background Report
CONSTRAINTS (%) MOTIVATORS (%)
Age/
too
old
Inju
ry/
ilnes
s
Not
in
tere
sted
Lack
of
time
- wor
k
Lack
of
time-
fam
ily
Hea
lth/
fitne
ss
Wel
l-bei
ng
Enjo
ymen
t
Soci
al/
fam
ily
Males 15.8 19.3 18.9 27.3 5.4 49.6 6.0 27.3 8.4Females 17.8 17.6 18.2 17.6 13.5 58.5 8.8 16.1 5.5Age Group (years)15 to 24 0.4 10.6 30.9 36.6 5.7 39.5 4.1 34.4 10.325 to 34 0.8 9.8 22.5 31.2 17.7 53.9 6.9 20.9 8.235 to 44 1.9 13.9 18.8 30.9 19.4 57.6 7.6 17.6 6.445 to 54 7.9 20.7 18.1 26.5 9.4 57.9 10.1 18.2 3.555 to 64 20.2 28.5 17.2 15.2 5.2 60.5 8.6 17.8 5.165+ 55.7 24.4 8.6 1.6 1.6 50.2 8.4 17.9 7.4
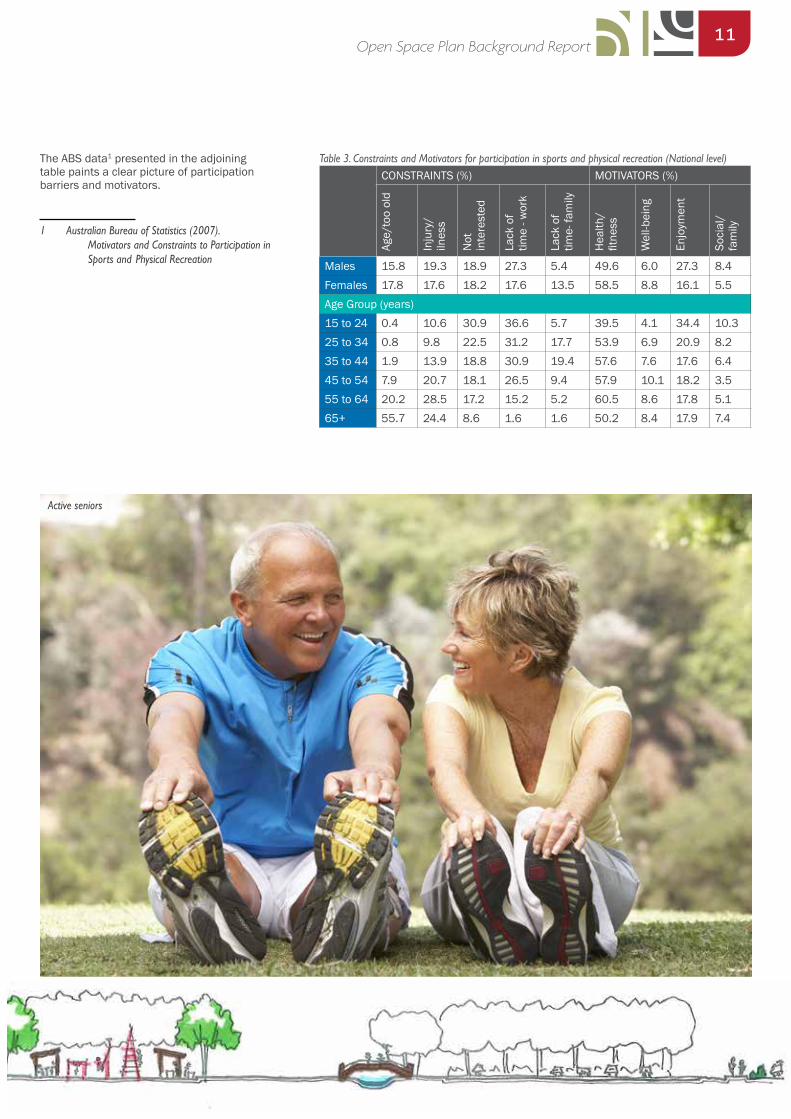
Table 3. Constraints and Motivators for participation in sports and physical recreation (National level)The ABS data1 presented in the adjoining table paints a clear picture of participation barriers and motivators.
1 Australian Bureau of Statistics (2007). Motivators and Constraints to Participation in Sports and Physical Recreation
Active seniors
12Open Space Plan Background Report
Provision considerationsExpectations of flexible hours With the amount of time available for recreation pursuits decreasing, participants are seeking flexible hours to undertake activities. Walking, running and cycling are likely to continue to be popular forms of activity as participants can be flexible in when, where and how long they undertake the activity. For additional activities to retain or gain in popularity it is likely that they will need to be able to offer longer and more flexible operating hours or a more flexible approach to training and competition participation (in the case of more traditional team sports such as football).
Move toward indoor sport?Anecdotally, within the sport and recreation industry there is some suggestion of a move toward indoor sport (as opposed to outdoor field sports). However, it should be noted that this notion has not been confirmed by any of the ERASS data up to and including 2010 (the most recent survey results).
The suggestion is, however, supported by Council’s 2010 and 2013 Active Participation Surveys that highlighted that participation in indoor sports more than doubled from 13.1% (in 2010) to 26.9% (in 2013). Comparatively participation in field sports only rose from 14.2% to 16.0% across the two surveys.
If this move is shown to be a trend, potentially it may be a result of a preference for activity in a more controlled climate (e.g. out of the summer sun and winter chill), the provision of flexible hours of play and/or for the greater proportion of mid-week competition opportunities generally provided by indoor sport compared with outdoor.
Multi-purpose community facilitiesA trend in open space design and delivery is the move away from single-purpose or dedicated facilities towards a cost and land use efficient model of multi-purpose facilities. An example of a new multi-purpose facility is the Arnolds Creek Recreation Reserve, which is co-located with a government primary school, and includes the following components:
� basketball/netball courts � children’s and community centre � grass fields that can be used for rectangular field sports or AFL
(winter) and cricket (summer) � pavilion utilised by community clubs, the community and is the
administrative home of the Riddell District Football League � playground � shared car parking � shared paths throughout the reserve � tennis courts.
Lengthening seasonsFurther impacting on recreation time choices, is a move toward year-round sport. Nation-wide, a number of sports are lengthening their seasons well past the traditional summer/winter season to the point where it becomes difficult for participants to be involved in more than one activity each year. Alternatively, sports are running two seasons or a modified season (e.g. 20/20 winter cricket) as an adjunct to the primary season.
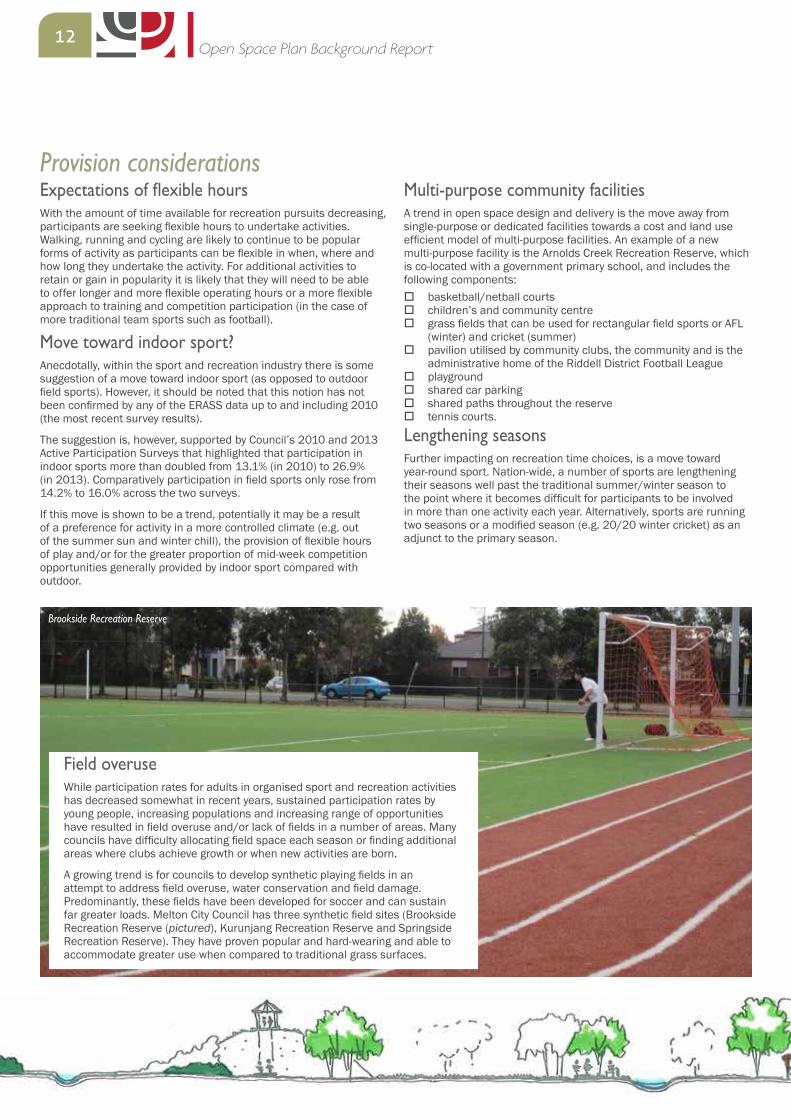
Field overuse While participation rates for adults in organised sport and recreation activities has decreased somewhat in recent years, sustained participation rates by young people, increasing populations and increasing range of opportunities have resulted in field overuse and/or lack of fields in a number of areas. Many councils have difficulty allocating field space each season or finding additional areas where clubs achieve growth or when new activities are born.
A growing trend is for councils to develop synthetic playing fields in an attempt to address field overuse, water conservation and field damage. Predominantly, these fields have been developed for soccer and can sustain far greater loads. Melton City Council has three synthetic field sites (Brookside Recreation Reserve (pictured), Kurunjang Recreation Reserve and Springside Recreation Reserve). They have proven popular and hard-wearing and able to accommodate greater use when compared to traditional grass surfaces.
Brookside Recreation Reserve
13Open Space Plan Background Report
Importance of playEvidence indicates that the community is placing a higher value on open space as the density of residential developments increases (reflecting the Metropolitan Planning Authority directives). As a result, block sizes become smaller and, thus, the quantity of private open space diminishes. The 2013 Active Participation Survey showed that 82.6% of residents visited a Melton City Council park in 2013, up from 67.2% in 2008, with the top three park activities being physical activity, exercise and play.
Play is a key driver of the health and wellbeing of children as well as a tool for their education and development - with active and social play adding to cognitive and social development. Therefore, the need to provide well designed open space that is engaging is becoming more important. Children need access to a range of play opportunities around their neighbourhood as they grow up.
A play experience (or playspace) should be vibrant and exciting - whereas a playground is just the infrastructure that is provided. The difference is somewhat like that between a mountain bike ride and a stationary bicycle. More importantly, a play experience does not innately require the installation of structured play equipment. Typically, uninteresting play equipment does not engage children for long periods. Interesting and interactive places to play and explore may be created by designing evocative landscapes such as the playspace at Burnside Heights Recreation Reserve. This may include sculpting the earth or utilising the natural contours, planting (e.g. vegetated tunnels or mazes, forests) and/or utilising textures and materials such as creative paving patterns (stepping stones, steps, edgings for balancing). A play space may incorporate interesting views or vistas, showcase art or innovation (mobiles and alternate energy sources), sculptural park furniture, landscape structures or buildings. Play experiences may incorporate elements such as:
� storytelling/sculpture trees � labyrinth/mazes � tunnels of plants � mist water play and water jets � meandering paths � meeting places � musical play.
The common characteristic in all of these elements is that the infrastructure suggests (but never dictates) how it is to be used. Moreover, each element can be used in many ways – commonsense says that a toddler will use a mist water play area quite differently to a 12-year old child.
Unstructured play needs to complement and be integrated with other recreation facilities to encourage active recreation for children, youth and adults. Examples include:
� basketball courts/hoops � cycling/pedestrian networks and skill development circuits � attractive open space areas for ball games etc. � water play parks � surfaces and markings for games (e.g. hopscotch and handball) � swings for all ages and abilities � flying foxes/climbing walls � fitness stations/training equipment.
Future open space development must provide interest and challenges to ensure open space is highly valued by the community.
Risk managementIn the late 90’s and early 2000’s spiralling costs of liability insurance premiums placed added stresses on community organisations and councils. Many of these groups responded by developing policies and risk management strategies to control and avoid risk in an effort to reduce (or contain) premiums.
Community organisations and councils have moved toward formal training of operators in risk management planning and reducing exposure to risk, both for the operators and for participants. In a number of cases, these risk management processes are proving resource intensive (both in time and funding). For example, whereas cricket umpires previously commenced a match by simply tossing a coin, walking to the wicket and calling ‘play’, all State cricket bodies now legislate that umpires are expected to inspect the entire field before determining the facility fit-for-play. This is now common across many sports. Staying with the sport of cricket – many clubs and councils invested in attractive picket fences as field boundaries only to see the risk management movement result in these fences being banned as boundaries and replaced with ropes, line marking or markers.
Additionally, risk management has seen a reduction in play opportunities through play sanitisation1. Many play elements have been removed from public areas through perceived risk and hazard identification. Elements such as large open slides, climbing frames and monkey bars have been removed throughout many councils.
Water availabilityWater is critically important for the management of the landscape and to service the facilities that are located within open space. Water serves a number of functions within open space including the provision of a higher amenity value, creating a focus for both active and passive/informal recreation as well as for use for irrigation of the landscape. The irrigation of open space can create a positive environment that attracts users to open space and results in more hard wearing surfaces.
The availability of recycled water is improving and its use (along with stormwater) should be investigated to service both irrigation and toilet facilities. Water sensitive urban design should be incorporated in all landscape development including the use of drought-resistant plants and warm season grass wherever practical.
Council has put in place a number of actions to reduce water consumption associated with recreation reserves including the implementation of a warm season grass program at a number of sports grounds and the use of drought resistant plants when landscaping.
1 Kidsafe NSW, 2013
14Open Space Plan Background Report
3. Analysis
0
5
10
15
20
25
30
35
0-14 15-24 25-44 45-64 65+
3.1 Population and demographic considerationsUnderstanding population size, growth and demographic characteristics is fundamental to responding to community needs and providing adequate and appropriate open space. Estimated population projections also assist in quantifying likely future demand and in prioritising land/facility developments.
Population projectionsThe City of Melton is one of the fastest growing municipalities in Victoria. The population estimate (provided by forecast.id) for 2016 is 134,967. By 2026, population forecasts of more than 207,000 are indicated while, at full development, Melton City’s population is expected to reach approximately 441,000 (more than 307,000 additional residents). The majority of the population growth will occur in existing and planned Precinct Structure Plan (PSP) areas with minimal growth expected to occur in established areas.
Interestingly, since the last Open Space Plan in 2004, the population has grown by more than 63,000.
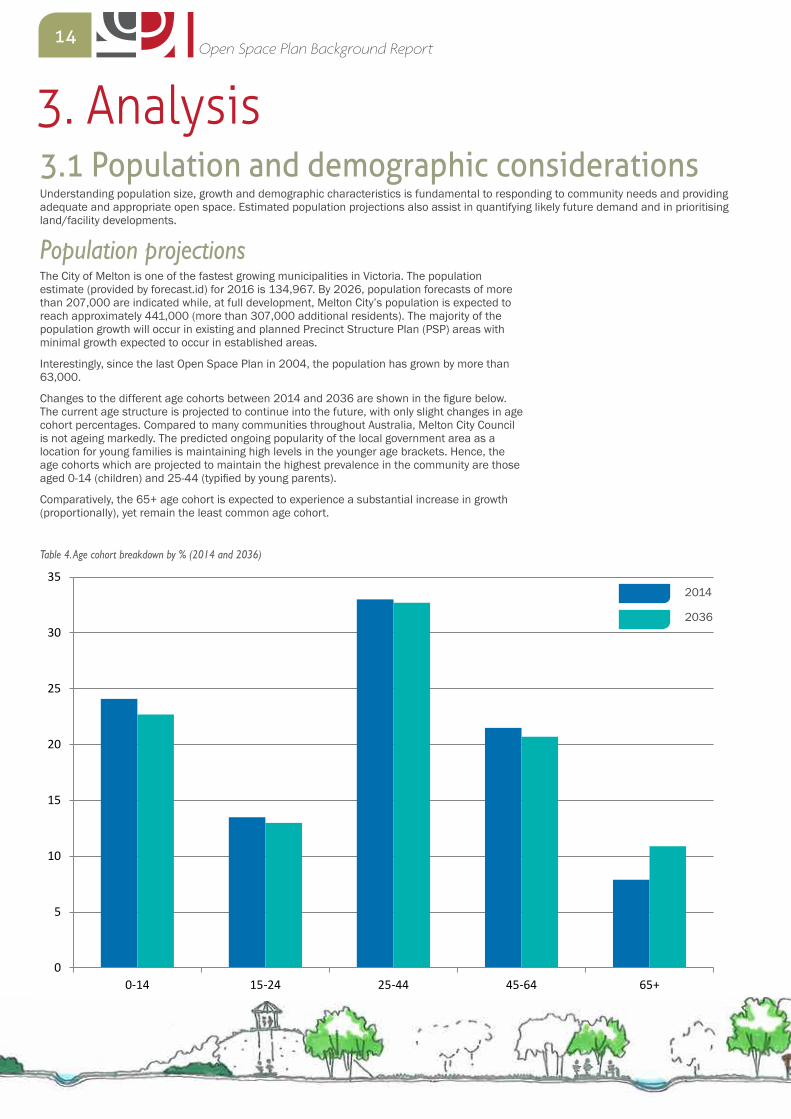
Changes to the different age cohorts between 2014 and 2036 are shown in the figure below. The current age structure is projected to continue into the future, with only slight changes in age cohort percentages. Compared to many communities throughout Australia, Melton City Council is not ageing markedly. The predicted ongoing popularity of the local government area as a location for young families is maintaining high levels in the younger age brackets. Hence, the age cohorts which are projected to maintain the highest prevalence in the community are those aged 0-14 (children) and 25-44 (typified by young parents).
Comparatively, the 65+ age cohort is expected to experience a substantial increase in growth (proportionally), yet remain the least common age cohort.
Table 4. Age cohort breakdown by % (2014 and 2036)
2014
2036
15Open Space Plan Background Report
2014
2036
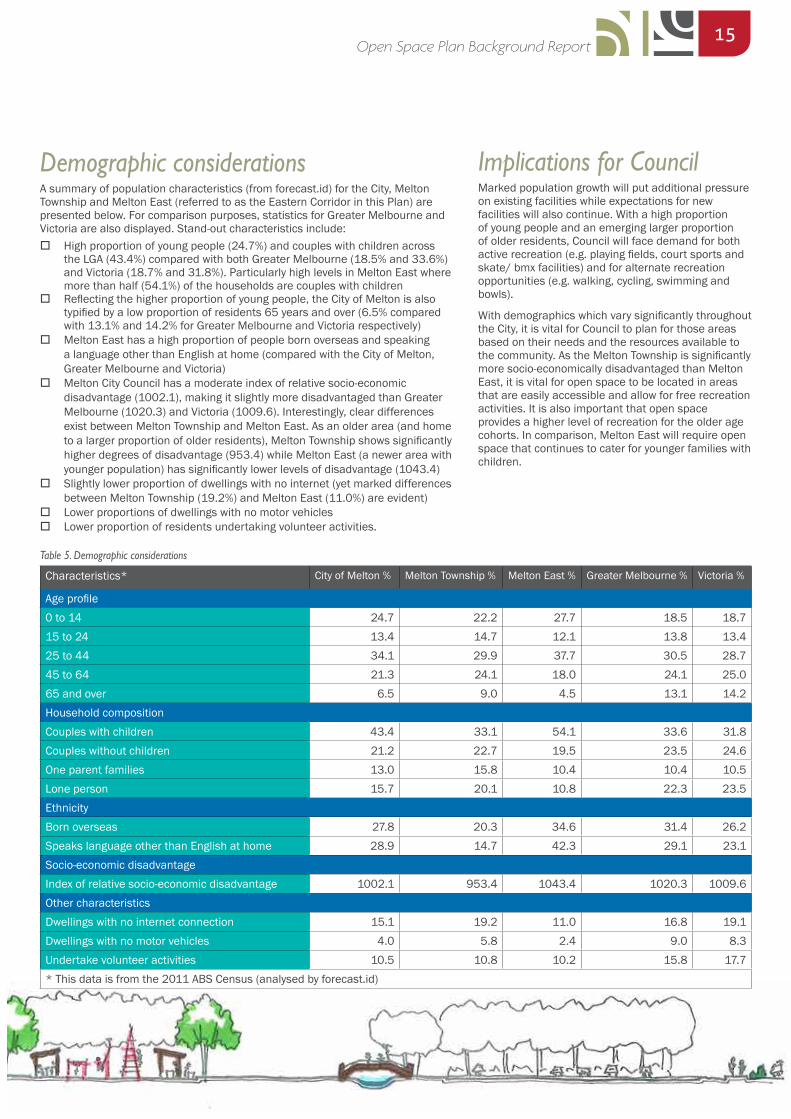
Table 5. Demographic considerations
Characteristics* City of Melton % Melton Township % Melton East % Greater Melbourne % Victoria %
Age profile0 to 14 24.7 22.2 27.7 18.5 18.715 to 24 13.4 14.7 12.1 13.8 13.425 to 44 34.1 29.9 37.7 30.5 28.745 to 64 21.3 24.1 18.0 24.1 25.065 and over 6.5 9.0 4.5 13.1 14.2Household compositionCouples with children 43.4 33.1 54.1 33.6 31.8Couples without children 21.2 22.7 19.5 23.5 24.6One parent families 13.0 15.8 10.4 10.4 10.5Lone person 15.7 20.1 10.8 22.3 23.5EthnicityBorn overseas 27.8 20.3 34.6 31.4 26.2Speaks language other than English at home 28.9 14.7 42.3 29.1 23.1Socio-economic disadvantageIndex of relative socio-economic disadvantage 1002.1 953.4 1043.4 1020.3 1009.6Other characteristicsDwellings with no internet connection 15.1 19.2 11.0 16.8 19.1Dwellings with no motor vehicles 4.0 5.8 2.4 9.0 8.3Undertake volunteer activities 10.5 10.8 10.2 15.8 17.7* This data is from the 2011 ABS Census (analysed by forecast.id)
Implications for CouncilMarked population growth will put additional pressure on existing facilities while expectations for new facilities will also continue. With a high proportion of young people and an emerging larger proportion of older residents, Council will face demand for both active recreation (e.g. playing fields, court sports and skate/ bmx facilities) and for alternate recreation opportunities (e.g. walking, cycling, swimming and bowls).
With demographics which vary significantly throughout the City, it is vital for Council to plan for those areas based on their needs and the resources available to the community. As the Melton Township is significantly more socio-economically disadvantaged than Melton East, it is vital for open space to be located in areas that are easily accessible and allow for free recreation activities. It is also important that open space provides a higher level of recreation for the older age cohorts. In comparison, Melton East will require open space that continues to cater for younger families with children.
Demographic considerationsA summary of population characteristics (from forecast.id) for the City, Melton Township and Melton East (referred to as the Eastern Corridor in this Plan) are presented below. For comparison purposes, statistics for Greater Melbourne and Victoria are also displayed. Stand-out characteristics include:
� High proportion of young people (24.7%) and couples with children across the LGA (43.4%) compared with both Greater Melbourne (18.5% and 33.6%) and Victoria (18.7% and 31.8%). Particularly high levels in Melton East where more than half (54.1%) of the households are couples with children
� Reflecting the higher proportion of young people, the City of Melton is also typified by a low proportion of residents 65 years and over (6.5% compared with 13.1% and 14.2% for Greater Melbourne and Victoria respectively)
� Melton East has a high proportion of people born overseas and speaking a language other than English at home (compared with the City of Melton, Greater Melbourne and Victoria)
� Melton City Council has a moderate index of relative socio-economic disadvantage (1002.1), making it slightly more disadvantaged than Greater Melbourne (1020.3) and Victoria (1009.6). Interestingly, clear differences exist between Melton Township and Melton East. As an older area (and home to a larger proportion of older residents), Melton Township shows significantly higher degrees of disadvantage (953.4) while Melton East (a newer area with younger population) has significantly lower levels of disadvantage (1043.4)
� Slightly lower proportion of dwellings with no internet (yet marked differences between Melton Township (19.2%) and Melton East (11.0%) are evident)
� Lower proportions of dwellings with no motor vehicles � Lower proportion of residents undertaking volunteer activities.
16Open Space Plan Background Report
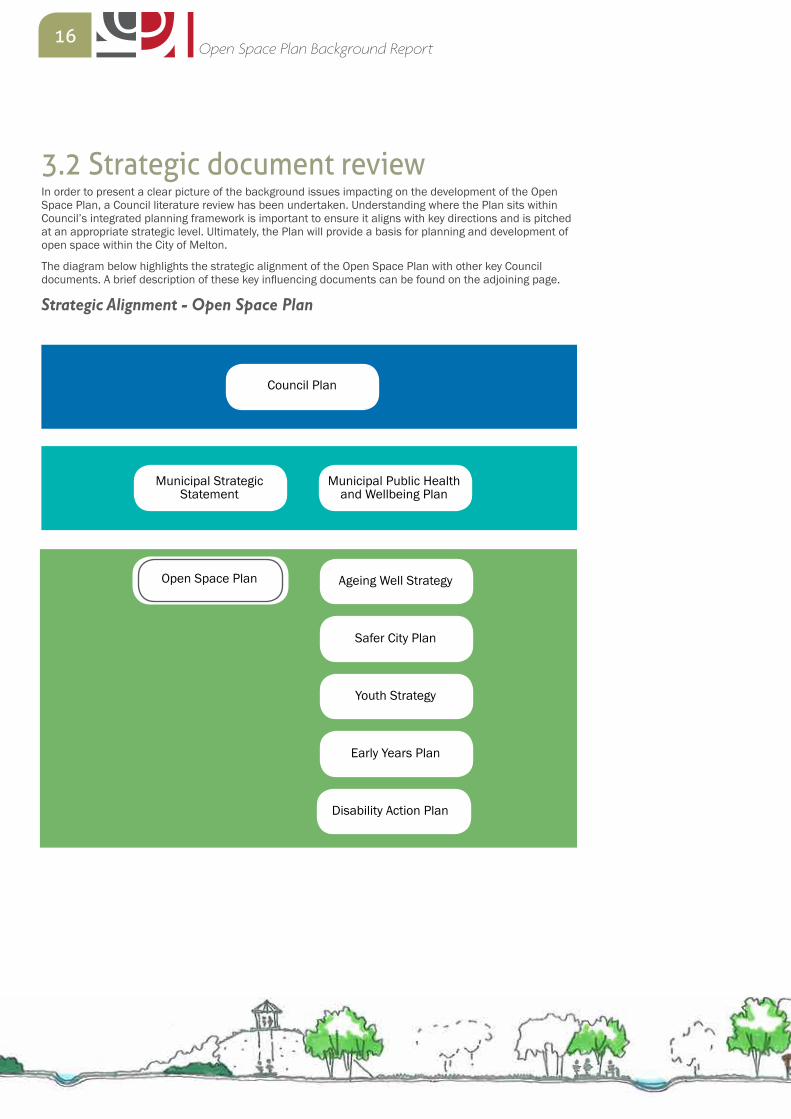
3.2 Strategic document reviewIn order to present a clear picture of the background issues impacting on the development of the Open Space Plan, a Council literature review has been undertaken. Understanding where the Plan sits within Council’s integrated planning framework is important to ensure it aligns with key directions and is pitched at an appropriate strategic level. Ultimately, the Plan will provide a basis for planning and development of open space within the City of Melton.
The diagram below highlights the strategic alignment of the Open Space Plan with other key Council documents. A brief description of these key influencing documents can be found on the adjoining page.
Strategic Alignment - Open Space Plan
Council Plan
Municipal Strategic Statement
Municipal Public Health and Wellbeing Plan
Ageing Well Strategy
Safer City Plan
Youth Strategy
Early Years Plan
Open Space Plan
Disability Action Plan
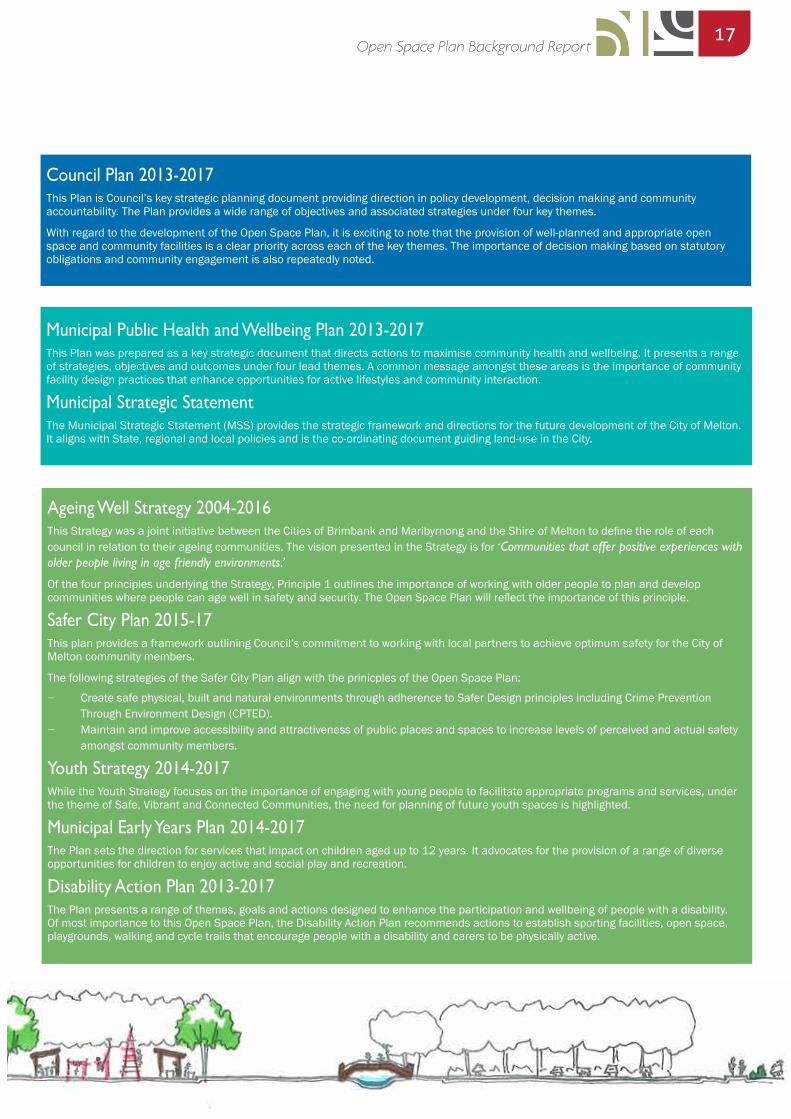
17Open Space Plan Background Report
Council Plan 2013-2017 This Plan is Council’s key strategic planning document providing direction in policy development, decision making and community accountability. The Plan provides a wide range of objectives and associated strategies under four key themes.
With regard to the development of the Open Space Plan, it is exciting to note that the provision of well-planned and appropriate open space and community facilities is a clear priority across each of the key themes. The importance of decision making based on statutory obligations and community engagement is also repeatedly noted.
Municipal Public Health and Wellbeing Plan 2013-2017This Plan was prepared as a key strategic document that directs actions to maximise community health and wellbeing. It presents a range of strategies, objectives and outcomes under four lead themes. A common message amongst these areas is the importance of community facility design practices that enhance opportunities for active lifestyles and community interaction.
Municipal Strategic StatementThe Municipal Strategic Statement (MSS) provides the strategic framework and directions for the future development of the City of Melton. It aligns with State, regional and local policies and is the co-ordinating document guiding land-use in the City.
Ageing Well Strategy 2004-2016 This Strategy was a joint initiative between the Cities of Brimbank and Maribyrnong and the Shire of Melton to define the role of each council in relation to their ageing communities. The vision presented in the Strategy is for ‘Communities that offer positive experiences with older people living in age friendly environments.’
Of the four principles underlying the Strategy, Principle 1 outlines the importance of working with older people to plan and develop communities where people can age well in safety and security. The Open Space Plan will reflect the importance of this principle.
Safer City Plan 2015-17This plan provides a framework outlining Council’s commitment to working with local partners to achieve optimum safety for the City of Melton community members.
The following strategies of the Safer City Plan align with the prinicples of the Open Space Plan:
− Create safe physical, built and natural environments through adherence to Safer Design principles including Crime Prevention Through Environment Design (CPTED).
− Maintain and improve accessibility and attractiveness of public places and spaces to increase levels of perceived and actual safety amongst community members.
Youth Strategy 2014-2017While the Youth Strategy focuses on the importance of engaging with young people to facilitate appropriate programs and services, under the theme of Safe, Vibrant and Connected Communities, the need for planning of future youth spaces is highlighted.
Municipal Early Years Plan 2014-2017The Plan sets the direction for services that impact on children aged up to 12 years. It advocates for the provision of a range of diverse opportunities for children to enjoy active and social play and recreation.
Disability Action Plan 2013-2017The Plan presents a range of themes, goals and actions designed to enhance the participation and wellbeing of people with a disability. Of most importance to this Open Space Plan, the Disability Action Plan recommends actions to establish sporting facilities, open space, playgrounds, walking and cycle trails that encourage people with a disability and carers to be physically active.
18Open Space Plan Background Report
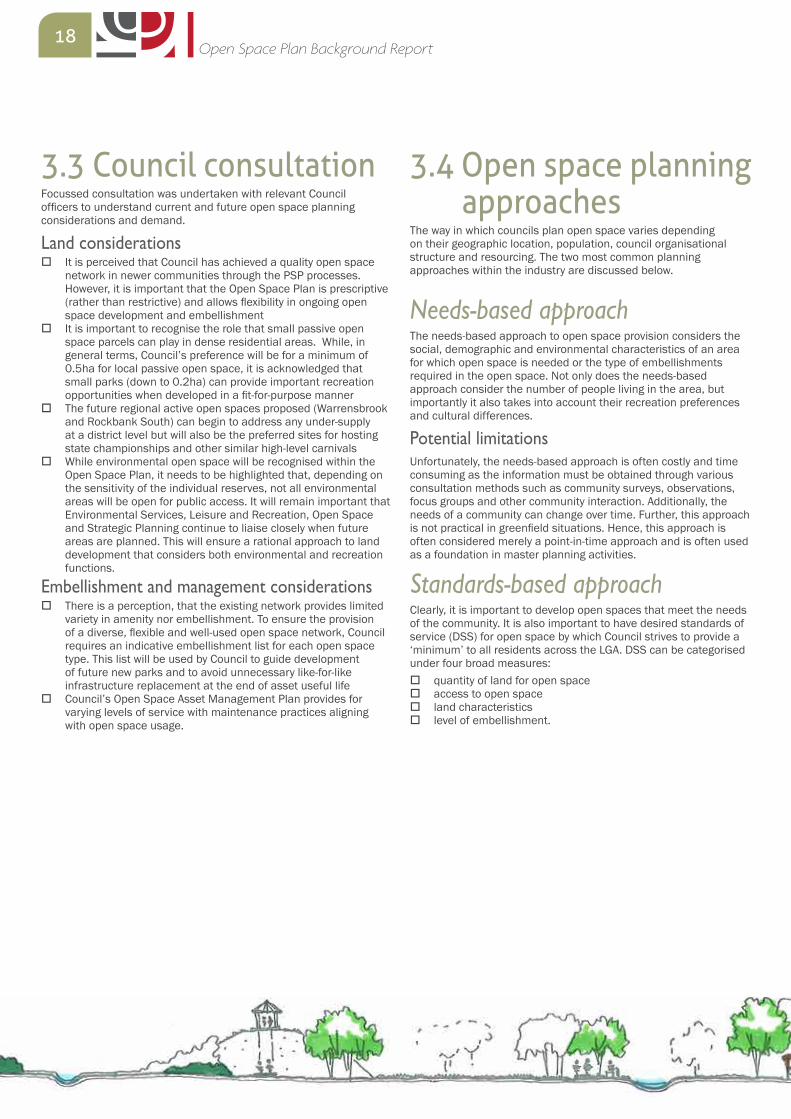
3.4 Open space planning approaches
The way in which councils plan open space varies depending on their geographic location, population, council organisational structure and resourcing. The two most common planning approaches within the industry are discussed below.
Needs-based approachThe needs-based approach to open space provision considers the social, demographic and environmental characteristics of an area for which open space is needed or the type of embellishments required in the open space. Not only does the needs-based approach consider the number of people living in the area, but importantly it also takes into account their recreation preferences and cultural differences.
Potential limitationsUnfortunately, the needs-based approach is often costly and time consuming as the information must be obtained through various consultation methods such as community surveys, observations, focus groups and other community interaction. Additionally, the needs of a community can change over time. Further, this approach is not practical in greenfield situations. Hence, this approach is often considered merely a point-in-time approach and is often used as a foundation in master planning activities.
Standards-based approachClearly, it is important to develop open spaces that meet the needs of the community. It is also important to have desired standards of service (DSS) for open space by which Council strives to provide a ‘minimum’ to all residents across the LGA. DSS can be categorised under four broad measures:
� quantity of land for open space � access to open space � land characteristics � level of embellishment.
3.3 Council consultation Focussed consultation was undertaken with relevant Council officers to understand current and future open space planning considerations and demand.
Land considerations � It is perceived that Council has achieved a quality open space
network in newer communities through the PSP processes. However, it is important that the Open Space Plan is prescriptive (rather than restrictive) and allows flexibility in ongoing open space development and embellishment
� It is important to recognise the role that small passive open space parcels can play in dense residential areas. While, in general terms, Council’s preference will be for a minimum of 0.5ha for local passive open space, it is acknowledged that small parks (down to 0.2ha) can provide important recreation opportunities when developed in a fit-for-purpose manner
� The future regional active open spaces proposed (Warrensbrook and Rockbank South) can begin to address any under-supply at a district level but will also be the preferred sites for hosting state championships and other similar high-level carnivals
� While environmental open space will be recognised within the Open Space Plan, it needs to be highlighted that, depending on the sensitivity of the individual reserves, not all environmental areas will be open for public access. It will remain important that Environmental Services, Leisure and Recreation, Open Space and Strategic Planning continue to liaise closely when future areas are planned. This will ensure a rational approach to land development that considers both environmental and recreation functions.
Embellishment and management considerations � There is a perception, that the existing network provides limited
variety in amenity nor embellishment. To ensure the provision of a diverse, flexible and well-used open space network, Council requires an indicative embellishment list for each open space type. This list will be used by Council to guide development of future new parks and to avoid unnecessary like-for-like infrastructure replacement at the end of asset useful life
� Council’s Open Space Asset Management Plan provides for varying levels of service with maintenance practices aligning with open space usage.
19Open Space Plan Background Report
Quantity standardThe quantity standard identifies the recommended minimum standards for the provision of land for open space. Standards are generally presented as hectares/1,000 (population). Council does not currently have a comprehensive quantity standard expressed in ha/1,000 across its network. (However, these have been established in this project). Alternatively, the Metropolitan Planning Authority (MPA) proposes a set proportion of the net developable area to be provided as open space.
For formal sport planning, Melton City Council considers a provision rate approach. Desired rates are provided for fourteen sports (see Section 4.5).
Accessibility standardThe accessibility standard is used to guide appropriate spatial distribution of open space in terms of the accessibility and distances of the open space to its visitors. The recommended spacing and distribution will vary depending on the hierarchy, and the population to be serviced.
It is hoped that all residents within urban areas are within easy walking distance to an embellished open space area. Best practice guidelines suggest no more than a five minute walk is preferred. Natural and man-made constraints (such as rivers, major highways and rail lines) must also be considered.
Land characteristicsThese standards are used as a base in determining quality land characteristics. A range of land types are required to provide diversity within the open space network. These recommended minimum levels of provision will ensure a realistic and achievable quality urban open space network that is generous in accordance with the proposed vision. Land character standards include consideration of:
� size of the open space � preferred shape of the open space � flood immunity, topography and gradient � road frontage � other site features (creeks, outcrops etc).
Embellishment standardEmbellishment standards are very important in defining open spaces and are also important in making them attractive for a variety of people to use. Embellishments include consideration of:
� activity options - play/recreation opportunities irrespective of age and ability
� furniture (e.g. tables, seats and bins), picnicking infrastructure, public amenities (toilets and showers), sports infrastructure
� buildings, signage, landscaping, car parking, fencing and lighting.
Potential limitationsStandards-based approaches to park provision have received some criticism from both the industry and academia. Potential limitations of the standards approach may include:
� does not consider changing demographics over time � changes in sport and recreation participation trends are not
considered � does not reflect geographic and climatic influences � assesses park typology in isolation, without reference to how
other park typologies may fill local need/demand (for example higher order park also serve the function of lower order parks in the same typology)
� the standards-based approach focuses on land for open space rather than the activities and opportunities the parks provide.
3.5 Preferred open space planning approach For future planned communities, Council currently calculates open space requirements using the Metropolitan Planning Authority’s net developable area (NDA) model. Using this model, 6% of NDA is required for active open space and 4% of NDA is required for passive open space). This model can be converted to a population-based approach by including 16.5 dwellings per hectare and 2.8 people per dwelling targets.
In light of significant future population growth, Council is in need of a comprehensive and defendable open space planning approach. Given that the majority of this growth will occur in greenfield areas, it is proposed that a standards approach will provide the Melton community with the best outcomes for open space land provision, including clear direction for its future PSPs.
A needs-based approach (to lead the on-ground provision and embellishment) is an important tool to be implemented by Council once the required land has been secured.
The desired land quantity standards presented in the Open Space Strategy have been expressed as hectares: 1,000 residents. Additional standards are also presented for each open space type for accessibility, land characteristics and embellishments.
20Open Space Plan Background Report
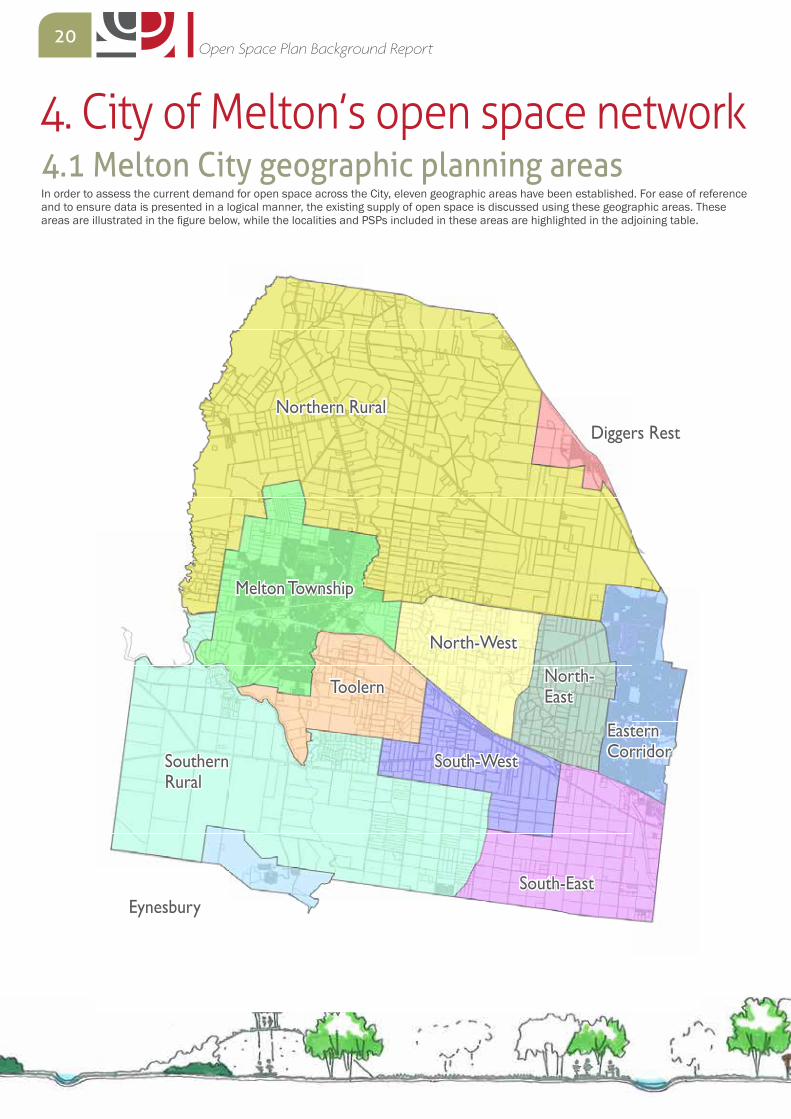
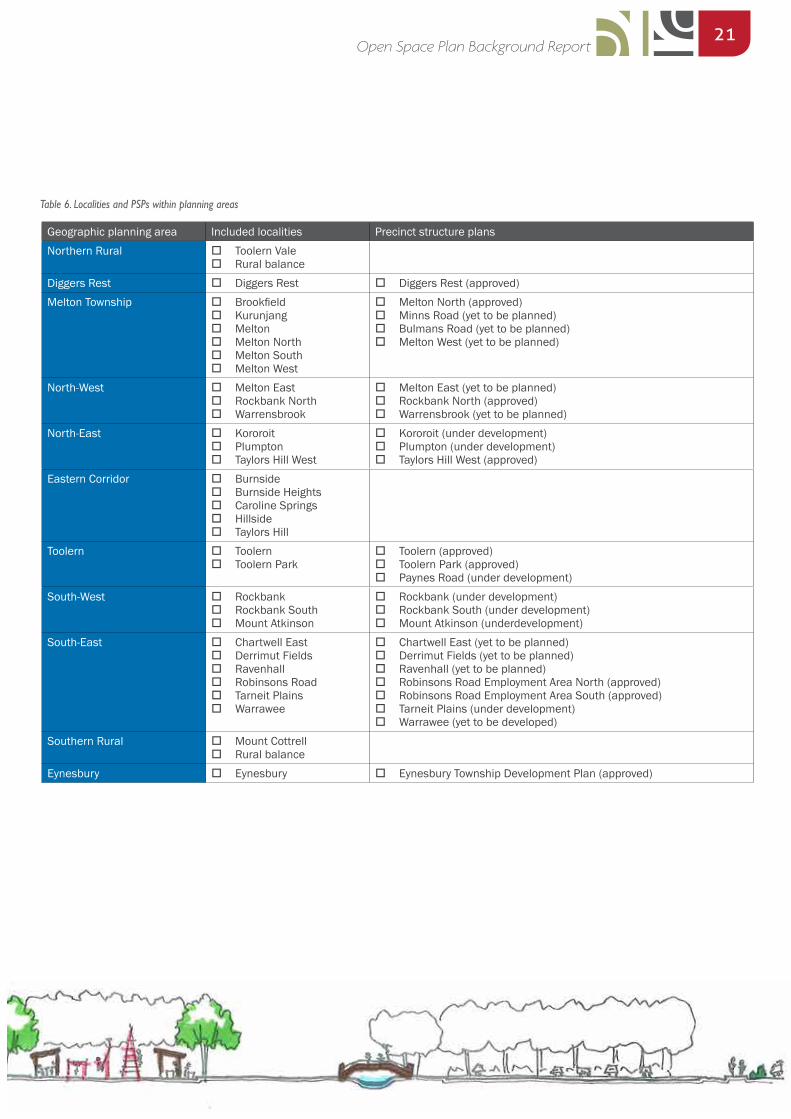
4. City of Melton’s open space network4.1 Melton City geographic planning areasIn order to assess the current demand for open space across the City, eleven geographic areas have been established. For ease of reference and to ensure data is presented in a logical manner, the existing supply of open space is discussed using these geographic areas. These areas are illustrated in the figure below, while the localities and PSPs included in these areas are highlighted in the adjoining table.
Melton Township
Diggers RestNorthern Rural
Eynesbury
Eastern Corridor
North-West
South-West
Toolern
South-East
Southern Rural
North- East
21Open Space Plan Background Report
Diggers Rest
Eastern Corridor
Geographic planning area Included localities Precinct structure plansNorthern Rural � Toolern Vale
� Rural balanceDiggers Rest � Diggers Rest � Diggers Rest (approved)Melton Township � Brookfield
� Kurunjang � Melton � Melton North � Melton South � Melton West
� Melton North (approved) � Minns Road (yet to be planned) � Bulmans Road (yet to be planned) � Melton West (yet to be planned)
North-West � Melton East � Rockbank North � Warrensbrook
� Melton East (yet to be planned) � Rockbank North (approved) � Warrensbrook (yet to be planned)
North-East � Kororoit � Plumpton � Taylors Hill West
� Kororoit (under development) � Plumpton (under development) � Taylors Hill West (approved)
Eastern Corridor � Burnside � Burnside Heights � Caroline Springs � Hillside � Taylors Hill
Toolern � Toolern � Toolern Park
� Toolern (approved) � Toolern Park (approved) � Paynes Road (under development)
South-West � Rockbank � Rockbank South � Mount Atkinson
� Rockbank (under development) � Rockbank South (under development) � Mount Atkinson (underdevelopment)
South-East � Chartwell East � Derrimut Fields � Ravenhall � Robinsons Road � Tarneit Plains � Warrawee
� Chartwell East (yet to be planned) � Derrimut Fields (yet to be planned) � Ravenhall (yet to be planned) � Robinsons Road Employment Area North (approved) � Robinsons Road Employment Area South (approved) � Tarneit Plains (under development) � Warrawee (yet to be developed)
Southern Rural � Mount Cottrell � Rural balance
Eynesbury � Eynesbury � Eynesbury Township Development Plan (approved)
Table 6. Localities and PSPs within planning areas
22Open Space Plan Background Report
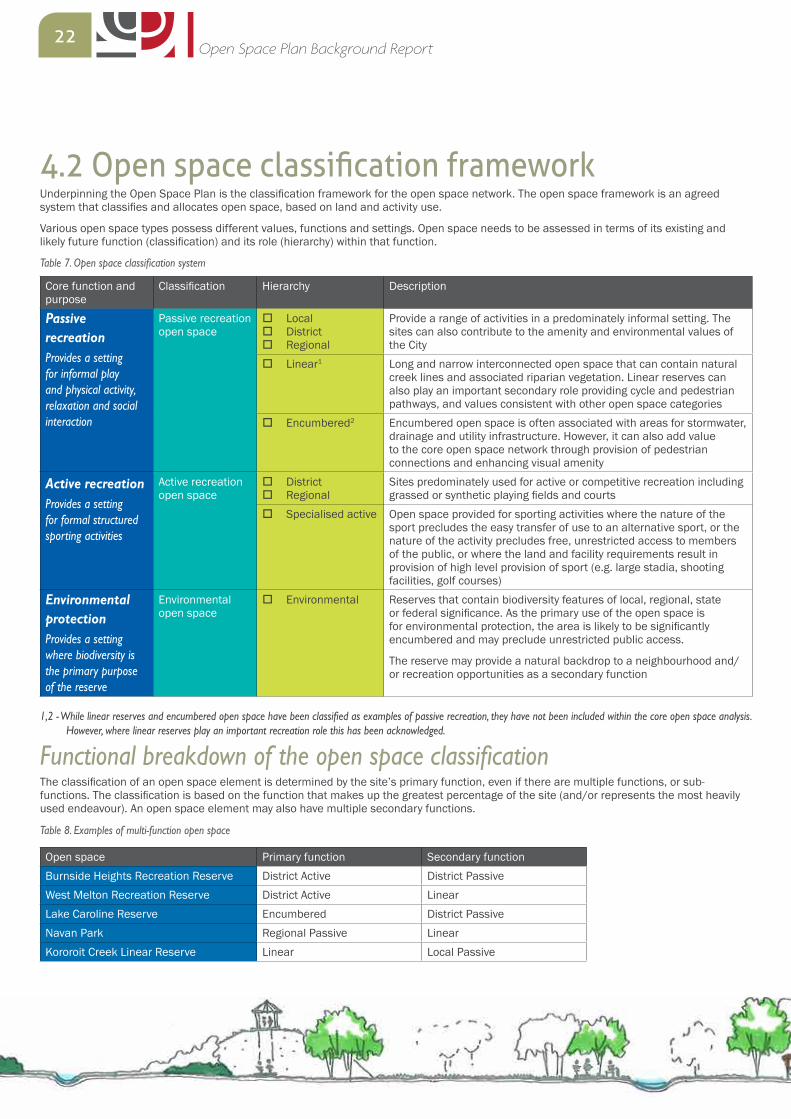
4.2 Open space classification frameworkUnderpinning the Open Space Plan is the classification framework for the open space network. The open space framework is an agreed system that classifies and allocates open space, based on land and activity use.
Various open space types possess different values, functions and settings. Open space needs to be assessed in terms of its existing and likely future function (classification) and its role (hierarchy) within that function.
Core function and purpose
Classification Hierarchy Description
Passive recreationProvides a setting for informal play and physical activity, relaxation and social interaction
Passive recreation open space
� Local � District � Regional
Provide a range of activities in a predominately informal setting. The sites can also contribute to the amenity and environmental values of the City
� Linear1 Long and narrow interconnected open space that can contain natural creek lines and associated riparian vegetation. Linear reserves can also play an important secondary role providing cycle and pedestrian pathways, and values consistent with other open space categories
� Encumbered2 Encumbered open space is often associated with areas for stormwater, drainage and utility infrastructure. However, it can also add value to the core open space network through provision of pedestrian connections and enhancing visual amenity
Active recreationProvides a setting for formal structured sporting activities
Active recreation open space
� District � Regional
Sites predominately used for active or competitive recreation including grassed or synthetic playing fields and courts
� Specialised active Open space provided for sporting activities where the nature of the sport precludes the easy transfer of use to an alternative sport, or the nature of the activity precludes free, unrestricted access to members of the public, or where the land and facility requirements result in provision of high level provision of sport (e.g. large stadia, shooting facilities, golf courses)
Environmental protectionProvides a setting where biodiversity is the primary purpose of the reserve
Environmental open space
� Environmental Reserves that contain biodiversity features of local, regional, state or federal significance. As the primary use of the open space is for environmental protection, the area is likely to be significantly encumbered and may preclude unrestricted public access.
The reserve may provide a natural backdrop to a neighbourhood and/or recreation opportunities as a secondary function
1,2 - While linear reserves and encumbered open space have been classified as examples of passive recreation, they have not been included within the core open space analysis. However, where linear reserves play an important recreation role this has been acknowledged.
Functional breakdown of the open space classificationThe classification of an open space element is determined by the site’s primary function, even if there are multiple functions, or sub-functions. The classification is based on the function that makes up the greatest percentage of the site (and/or represents the most heavily used endeavour). An open space element may also have multiple secondary functions.
Open space Primary function Secondary functionBurnside Heights Recreation Reserve District Active District PassiveWest Melton Recreation Reserve District Active LinearLake Caroline Reserve Encumbered District PassiveNavan Park Regional Passive LinearKororoit Creek Linear Reserve Linear Local Passive
Table 7. Open space classification system
Table 8. Examples of multi-function open space
23Open Space Plan Background Report
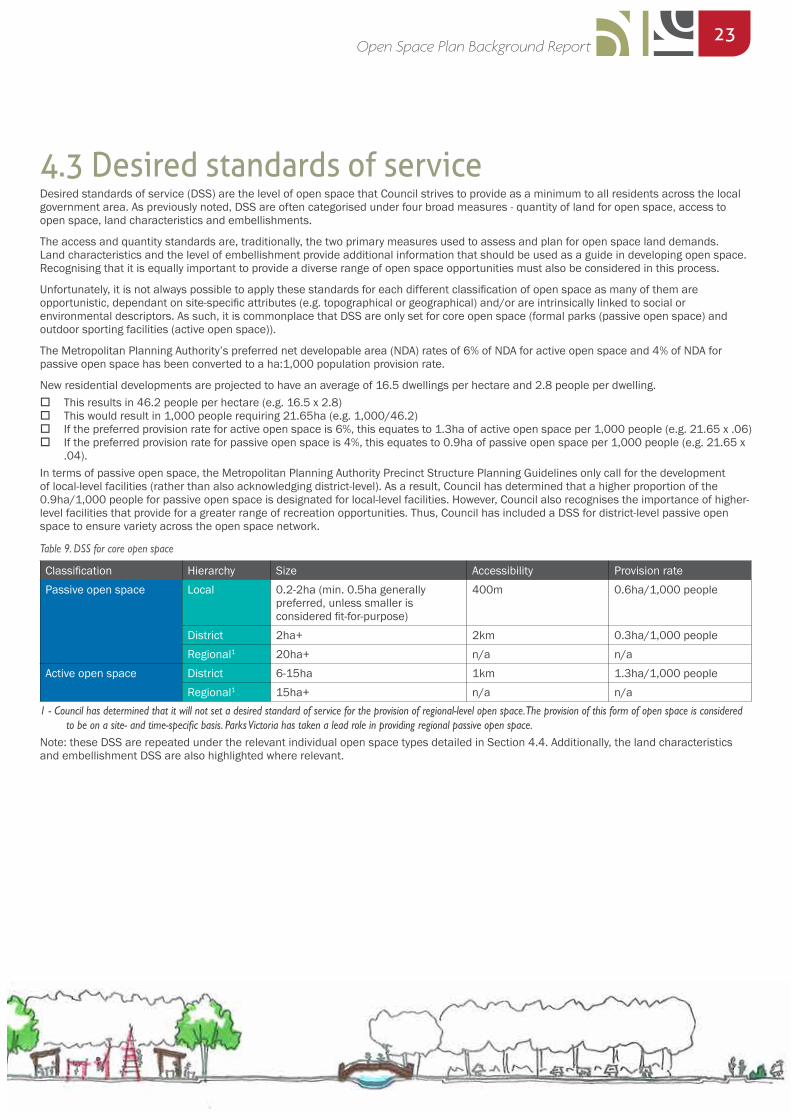
4.3 Desired standards of serviceDesired standards of service (DSS) are the level of open space that Council strives to provide as a minimum to all residents across the local government area. As previously noted, DSS are often categorised under four broad measures - quantity of land for open space, access to open space, land characteristics and embellishments.
The access and quantity standards are, traditionally, the two primary measures used to assess and plan for open space land demands. Land characteristics and the level of embellishment provide additional information that should be used as a guide in developing open space. Recognising that it is equally important to provide a diverse range of open space opportunities must also be considered in this process.
Unfortunately, it is not always possible to apply these standards for each different classification of open space as many of them are opportunistic, dependant on site-specific attributes (e.g. topographical or geographical) and/or are intrinsically linked to social or environmental descriptors. As such, it is commonplace that DSS are only set for core open space (formal parks (passive open space) and outdoor sporting facilities (active open space)).
The Metropolitan Planning Authority’s preferred net developable area (NDA) rates of 6% of NDA for active open space and 4% of NDA for passive open space has been converted to a ha:1,000 population provision rate.
New residential developments are projected to have an average of 16.5 dwellings per hectare and 2.8 people per dwelling. � This results in 46.2 people per hectare (e.g. 16.5 x 2.8) � This would result in 1,000 people requiring 21.65ha (e.g. 1,000/46.2) � If the preferred provision rate for active open space is 6%, this equates to 1.3ha of active open space per 1,000 people (e.g. 21.65 x .06) � If the preferred provision rate for passive open space is 4%, this equates to 0.9ha of passive open space per 1,000 people (e.g. 21.65 x
.04).In terms of passive open space, the Metropolitan Planning Authority Precinct Structure Planning Guidelines only call for the development of local-level facilities (rather than also acknowledging district-level). As a result, Council has determined that a higher proportion of the 0.9ha/1,000 people for passive open space is designated for local-level facilities. However, Council also recognises the importance of higher-level facilities that provide for a greater range of recreation opportunities. Thus, Council has included a DSS for district-level passive open space to ensure variety across the open space network.
Classification Hierarchy Size Accessibility Provision ratePassive open space Local 0.2-2ha (min. 0.5ha generally
preferred, unless smaller is considered fit-for-purpose)
400m 0.6ha/1,000 people
District 2ha+ 2km 0.3ha/1,000 peopleRegional1 20ha+ n/a n/a
Active open space District 6-15ha 1km 1.3ha/1,000 peopleRegional1 15ha+ n/a n/a
1 - Council has determined that it will not set a desired standard of service for the provision of regional-level open space. The provision of this form of open space is considered to be on a site- and time-specific basis. Parks Victoria has taken a lead role in providing regional passive open space.
Note: these DSS are repeated under the relevant individual open space types detailed in Section 4.4. Additionally, the land characteristics and embellishment DSS are also highlighted where relevant.
Table 9. DSS for core open space
24Open Space Plan Background Report
4.4 Open space typesThis section provides detailed information relating to the different open space types within the City of Melton.
This section helps to inform the future embellishment and upgrade of existing open space and the planning and delivery of future open space. Further influencing embellishment considerations, is the need to provide a range of different recreation opportunities in smaller individual catchments (e.g. suburbs and precincts). Importantly, Council’s Landscape Design Guidelines should be consulted for further detail regarding open space design and embellishment.

25Open Space Plan Background Report
Local passive
DSS Description StandardQuantity Based on a hectare/1,000 people
measurement0.6ha/1,000 population for all planning catchments except Northern Rural, Southern Rural and South-East where minimal ultimate population bases are predicted
Accessibility Distance between urban residents and open space (metres)
400m for 95% of dwellings
Land characteristics
Size 0.2-2.0ha of usable space for stand-alone local passive open space. While a minimum of 0.5ha of usable space is preferred, it is acknowledged that smaller parcels can be fit-for-purpose in some instances
Shape Broadly square to rectangular (or round) with the sides no greater than 2:1Road frontage Minimum 50% of the park perimeter to have direct road frontageGradient Maximum grade of 1:10 for 80% of the area of the park (i.e. a maximum of
20% of the land may have a greater grade than 1:10)Flood immunity 100 year ARI for play node infrastructure
20 year ARI for remainder
Description and intentLocal passive recreation open space (parks) provide a range of recreation opportunities for local residents. These parks contain limited infrastructure, yet offer local community benefits.
Local passive recreation parks are intended to offer residents a complementary open space to their backyards. They are likely to attract users from a small catchment area (about 400m radius) and generally cater for short visits by small groups.
Local passive recreation parks will be centrally located to the catchment or as hubs along recreation corridors where such corridors exist. There are many cost and land efficiencies (such as from dual use of land and consolidation of embellishments) that can be gained by developing hubs along pathways that connect key community areas such as: residents to schools, retails hubs etc.
Where a number of parks are to be provided, or are to receive embellishment upgrades within an area or community, planning studies could be developed. These plans will ensure that the park embellishment suitably and collectively meets the needs and demands of the community. Furthermore, each park should complement nearby open space and be relevant to the local area, its character and demographic.
Table 10. Local passive open space - DSS
26Open Space Plan Background Report
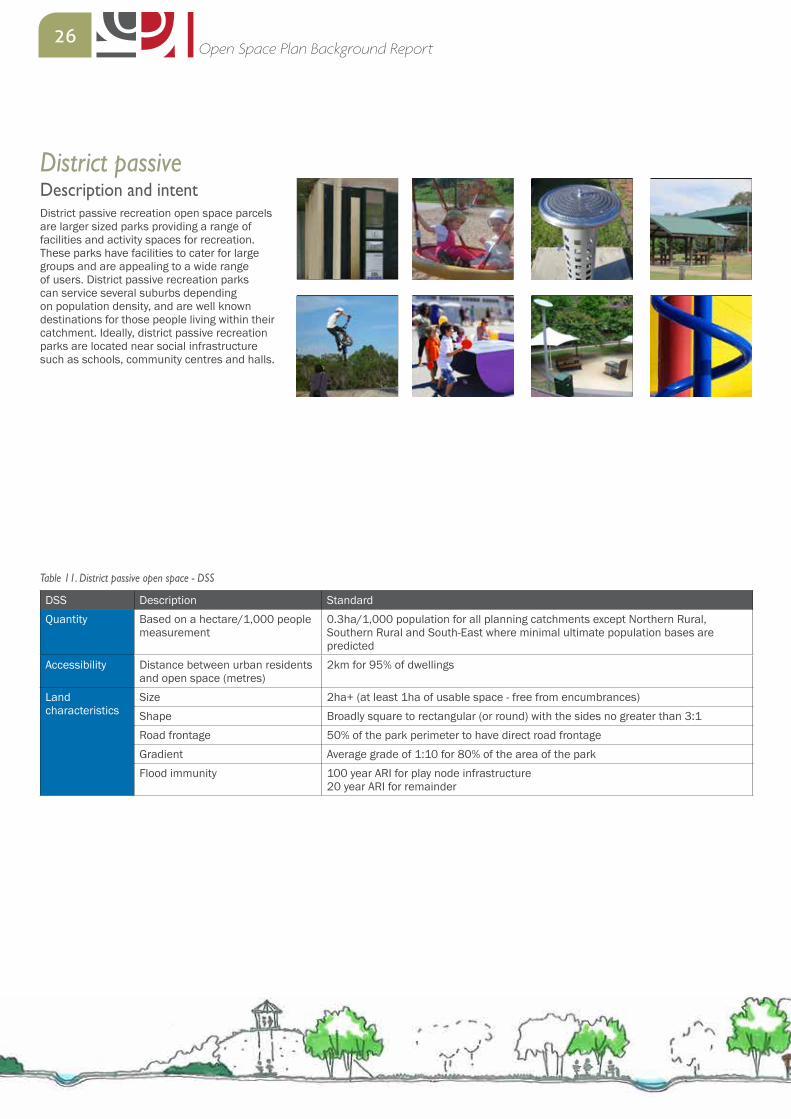
DSS Description StandardQuantity Based on a hectare/1,000 people
measurement0.3ha/1,000 population for all planning catchments except Northern Rural, Southern Rural and South-East where minimal ultimate population bases are predicted
Accessibility Distance between urban residents and open space (metres)
2km for 95% of dwellings
Land characteristics
Size 2ha+ (at least 1ha of usable space - free from encumbrances)Shape Broadly square to rectangular (or round) with the sides no greater than 3:1Road frontage 50% of the park perimeter to have direct road frontageGradient Average grade of 1:10 for 80% of the area of the parkFlood immunity 100 year ARI for play node infrastructure
20 year ARI for remainder
Description and intentDistrict passive recreation open space parcels are larger sized parks providing a range of facilities and activity spaces for recreation. These parks have facilities to cater for large groups and are appealing to a wide range of users. District passive recreation parks can service several suburbs depending on population density, and are well known destinations for those people living within their catchment. Ideally, district passive recreation parks are located near social infrastructure such as schools, community centres and halls.
District passive
Table 11. District passive open space - DSS

27Open Space Plan Background Report
Regional passiveDescription and intentThese open spaces are major recreation parks that offer a wide variety of opportunities to a broad cross-section of the City’s population and visitors. They are large, embellished for recreation, are well known amongst residents and are major destinations.
People are usually content spending several hours in these parks. Regional passive parks offer unique experiences. They are often used to host large community events such as carols in the park, Australia Day celebrations and other festivals. Regional passive parks offer exciting and no cost activities for residents and visitors.
DSS Description StandardQuantity Given specific nuances of regional passive open space (e.g. site - and time-specific, potentially developed by others) no
quantity standard is providedAccessibility As regional passive open space is site-specific no accessibility standard is provided
Land characteristics
Size 20ha+ (at least 10ha of usable space - free from encumbrances)Shape Broadly square to rectangular (or round) with the sides no greater than 3:1Road frontage 30-50% of the park perimeter to have direct road frontageGradient Average grade of 1:20 for main use areas, 1:50 for kick-about area, variable
topography for remainderFlood immunity 100 year ARI for play node infrastructure and main use areas
20 year ARI for kick-about 5 year ARI for remainder
Table 12. Regional passive open space - DSS
28Open Space Plan Background Report
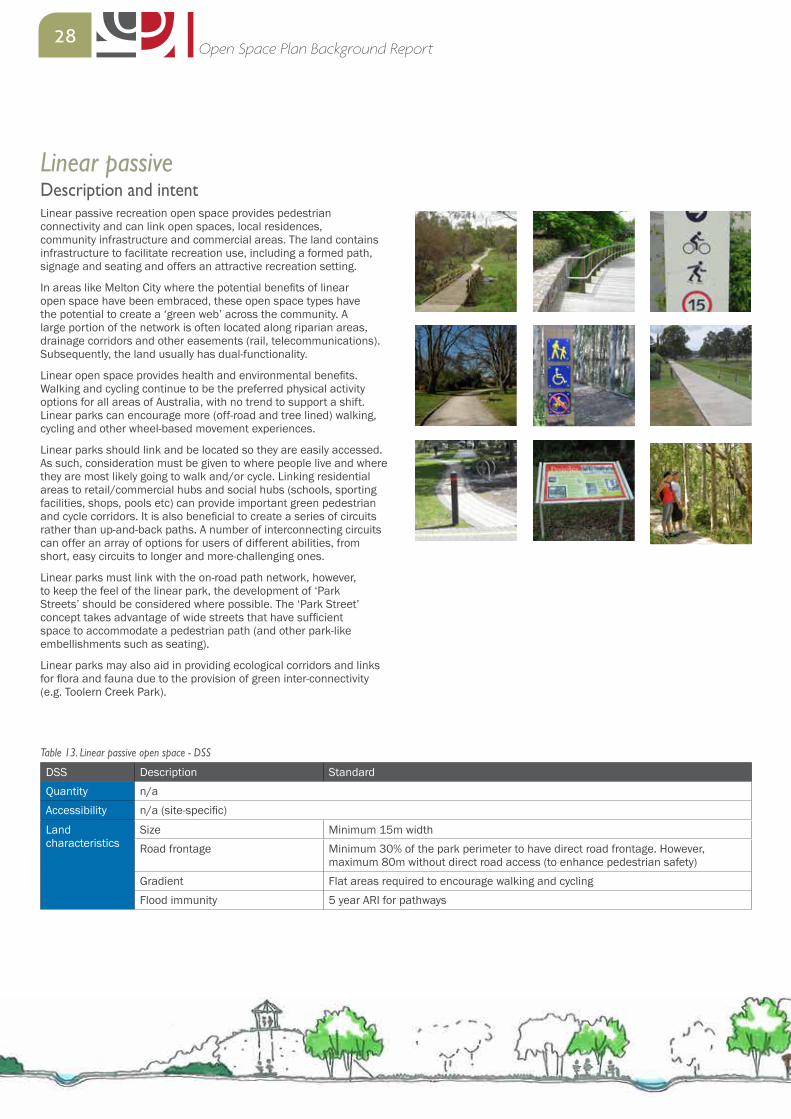
Linear passiveDescription and intentLinear passive recreation open space provides pedestrian connectivity and can link open spaces, local residences, community infrastructure and commercial areas. The land contains infrastructure to facilitate recreation use, including a formed path, signage and seating and offers an attractive recreation setting.
In areas like Melton City where the potential benefits of linear open space have been embraced, these open space types have the potential to create a ‘green web’ across the community. A large portion of the network is often located along riparian areas, drainage corridors and other easements (rail, telecommunications). Subsequently, the land usually has dual-functionality.
Linear open space provides health and environmental benefits. Walking and cycling continue to be the preferred physical activity options for all areas of Australia, with no trend to support a shift. Linear parks can encourage more (off-road and tree lined) walking, cycling and other wheel-based movement experiences.
Linear parks should link and be located so they are easily accessed. As such, consideration must be given to where people live and where they are most likely going to walk and/or cycle. Linking residential areas to retail/commercial hubs and social hubs (schools, sporting facilities, shops, pools etc) can provide important green pedestrian and cycle corridors. It is also beneficial to create a series of circuits rather than up-and-back paths. A number of interconnecting circuits can offer an array of options for users of different abilities, from short, easy circuits to longer and more-challenging ones.
Linear parks must link with the on-road path network, however, to keep the feel of the linear park, the development of ‘Park Streets’ should be considered where possible. The ‘Park Street’ concept takes advantage of wide streets that have sufficient space to accommodate a pedestrian path (and other park-like embellishments such as seating).
Linear parks may also aid in providing ecological corridors and links for flora and fauna due to the provision of green inter-connectivity (e.g. Toolern Creek Park).
DSS Description StandardQuantity n/aAccessibility n/a (site-specific)
Land characteristics
Size Minimum 15m widthRoad frontage Minimum 30% of the park perimeter to have direct road frontage. However,
maximum 80m without direct road access (to enhance pedestrian safety)Gradient Flat areas required to encourage walking and cyclingFlood immunity 5 year ARI for pathways
Table 13. Linear passive open space - DSS
29Open Space Plan Background Report
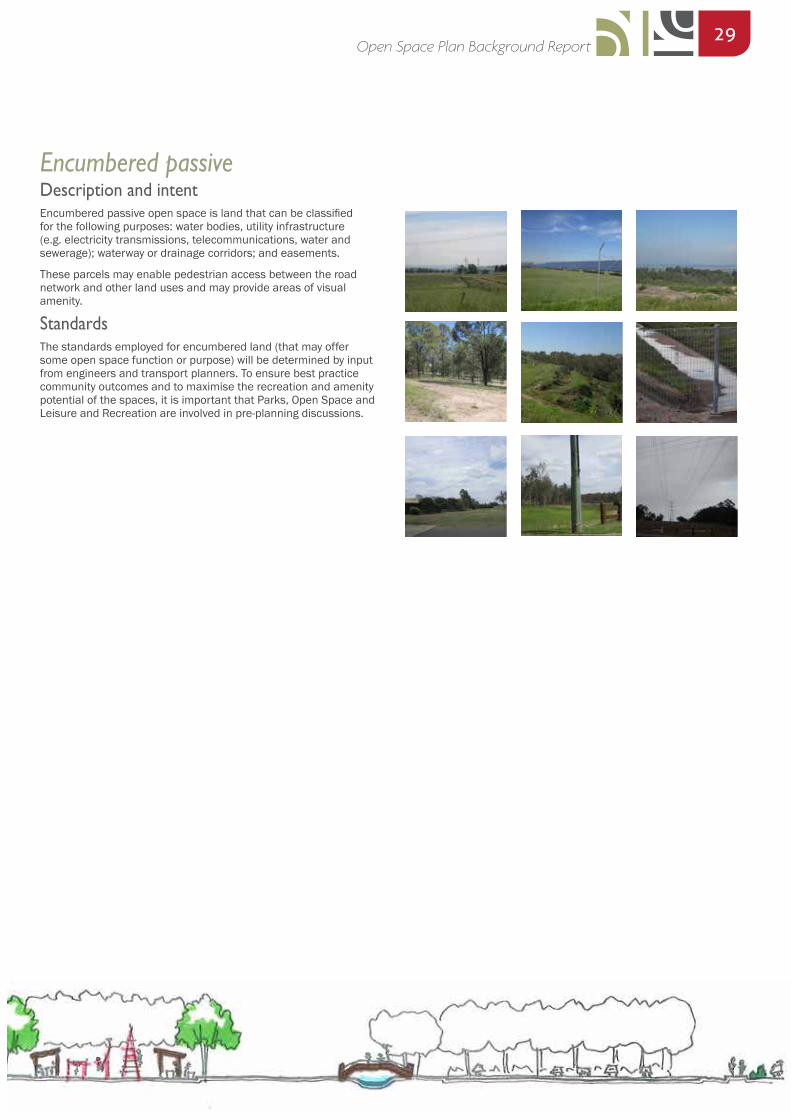
Encumbered passiveDescription and intentEncumbered passive open space is land that can be classified for the following purposes: water bodies, utility infrastructure (e.g. electricity transmissions, telecommunications, water and sewerage); waterway or drainage corridors; and easements.
These parcels may enable pedestrian access between the road network and other land uses and may provide areas of visual amenity.
StandardsThe standards employed for encumbered land (that may offer some open space function or purpose) will be determined by input from engineers and transport planners. To ensure best practice community outcomes and to maximise the recreation and amenity potential of the spaces, it is important that Parks, Open Space and Leisure and Recreation are involved in pre-planning discussions.
30Open Space Plan Background Report
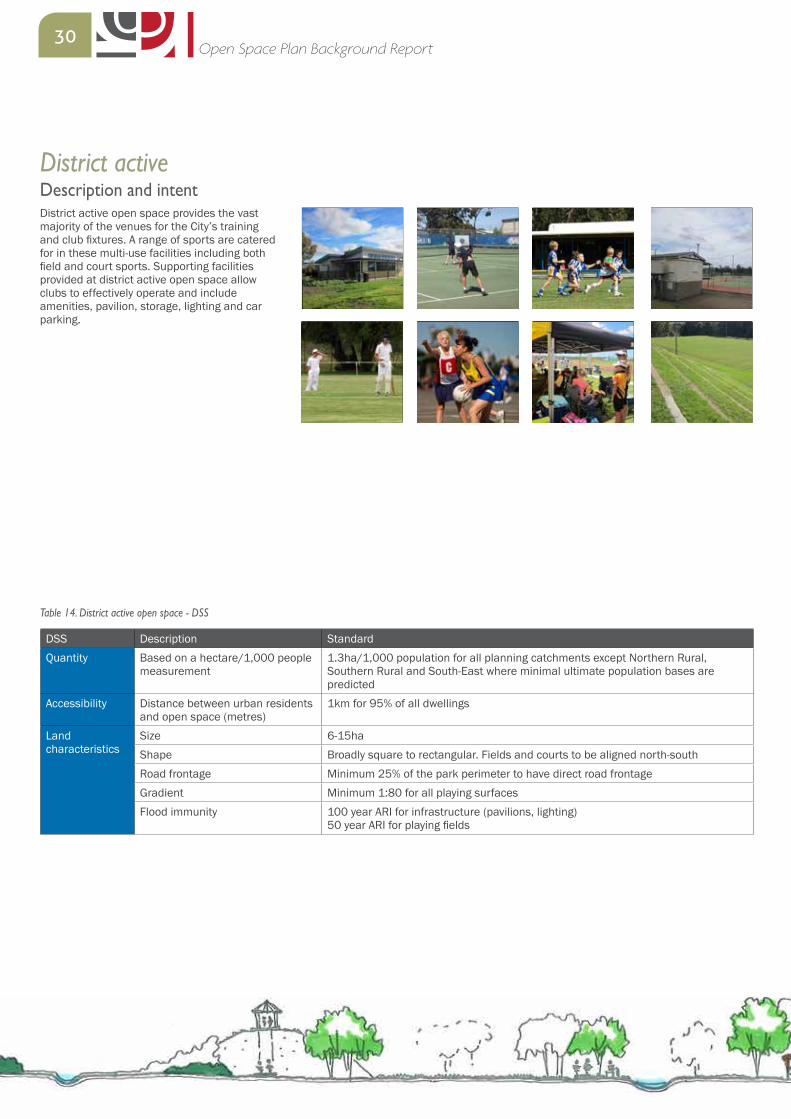
DSS Description StandardQuantity Based on a hectare/1,000 people
measurement1.3ha/1,000 population for all planning catchments except Northern Rural, Southern Rural and South-East where minimal ultimate population bases are predicted
Accessibility Distance between urban residents and open space (metres)
1km for 95% of all dwellings
Land characteristics
Size 6-15haShape Broadly square to rectangular. Fields and courts to be aligned north-south Road frontage Minimum 25% of the park perimeter to have direct road frontageGradient Minimum 1:80 for all playing surfacesFlood immunity 100 year ARI for infrastructure (pavilions, lighting)
50 year ARI for playing fields
District activeDescription and intentDistrict active open space provides the vast majority of the venues for the City’s training and club fixtures. A range of sports are catered for in these multi-use facilities including both field and court sports. Supporting facilities provided at district active open space allow clubs to effectively operate and include amenities, pavilion, storage, lighting and car parking.
Table 14. District active open space - DSS
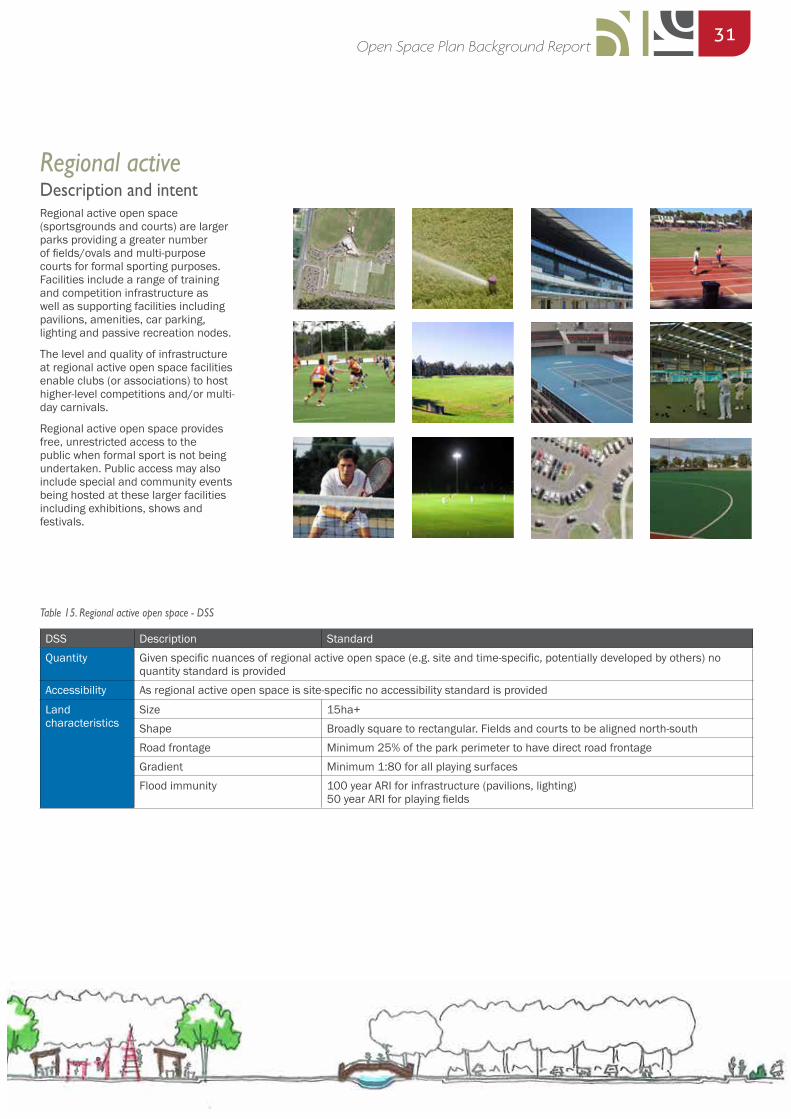
31Open Space Plan Background Report
Regional activeDescription and intentRegional active open space (sportsgrounds and courts) are larger parks providing a greater number of fields/ovals and multi-purpose courts for formal sporting purposes. Facilities include a range of training and competition infrastructure as well as supporting facilities including pavilions, amenities, car parking, lighting and passive recreation nodes.
The level and quality of infrastructure at regional active open space facilities enable clubs (or associations) to host higher-level competitions and/or multi-day carnivals.
Regional active open space provides free, unrestricted access to the public when formal sport is not being undertaken. Public access may also include special and community events being hosted at these larger facilities including exhibitions, shows and festivals.
DSS Description StandardQuantity Given specific nuances of regional active open space (e.g. site and time-specific, potentially developed by others) no
quantity standard is providedAccessibility As regional active open space is site-specific no accessibility standard is provided
Land characteristics
Size 15ha+Shape Broadly square to rectangular. Fields and courts to be aligned north-south Road frontage Minimum 25% of the park perimeter to have direct road frontageGradient Minimum 1:80 for all playing surfacesFlood immunity 100 year ARI for infrastructure (pavilions, lighting)
50 year ARI for playing fields
Table 15. Regional active open space - DSS
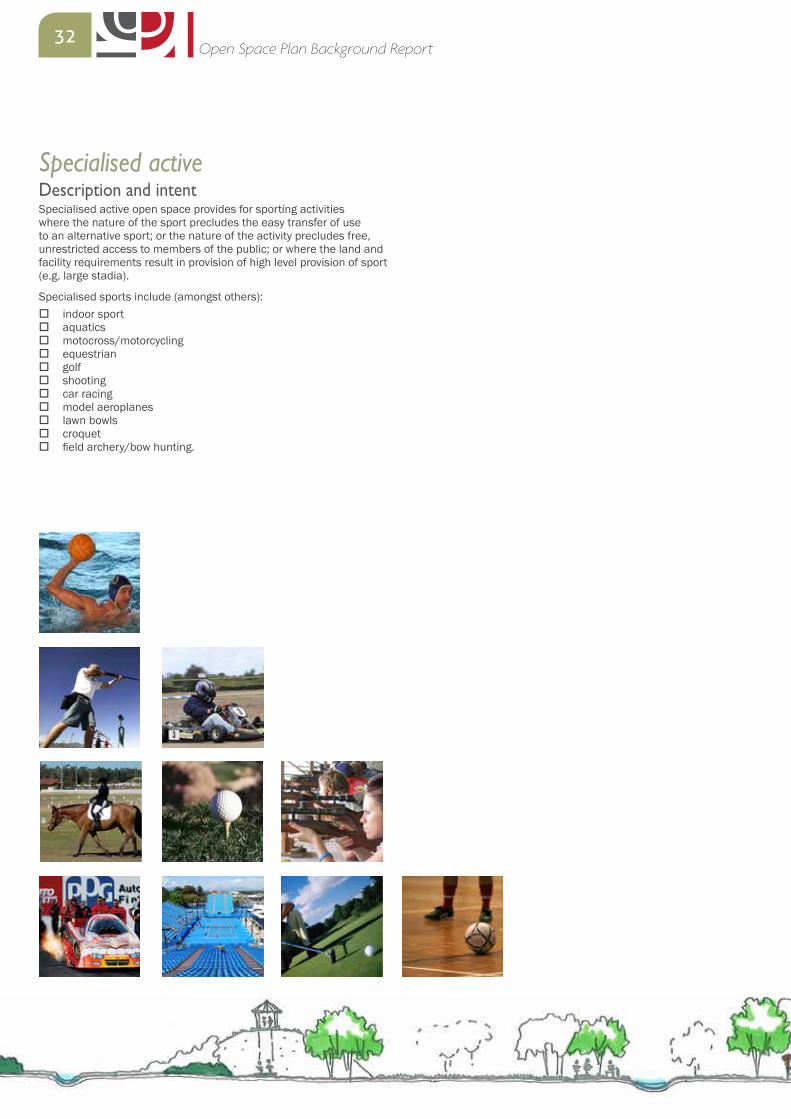
32Open Space Plan Background Report
Specialised activeDescription and intent Specialised active open space provides for sporting activities where the nature of the sport precludes the easy transfer of use to an alternative sport; or the nature of the activity precludes free, unrestricted access to members of the public; or where the land and facility requirements result in provision of high level provision of sport (e.g. large stadia).
Specialised sports include (amongst others): � indoor sport � aquatics � motocross/motorcycling � equestrian � golf � shooting � car racing � model aeroplanes � lawn bowls � croquet � field archery/bow hunting.
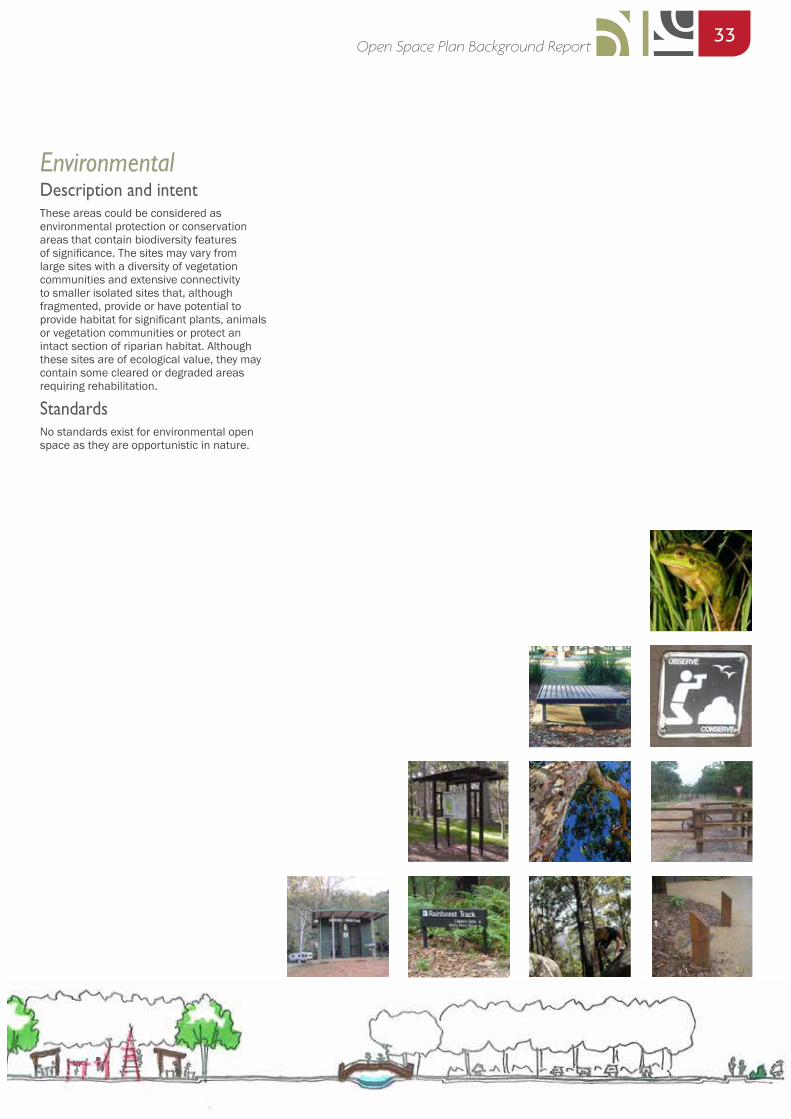
33Open Space Plan Background Report
EnvironmentalDescription and intentThese areas could be considered as environmental protection or conservation areas that contain biodiversity features of significance. The sites may vary from large sites with a diversity of vegetation communities and extensive connectivity to smaller isolated sites that, although fragmented, provide or have potential to provide habitat for significant plants, animals or vegetation communities or protect an intact section of riparian habitat. Although these sites are of ecological value, they may contain some cleared or degraded areas requiring rehabilitation.
StandardsNo standards exist for environmental open space as they are opportunistic in nature.
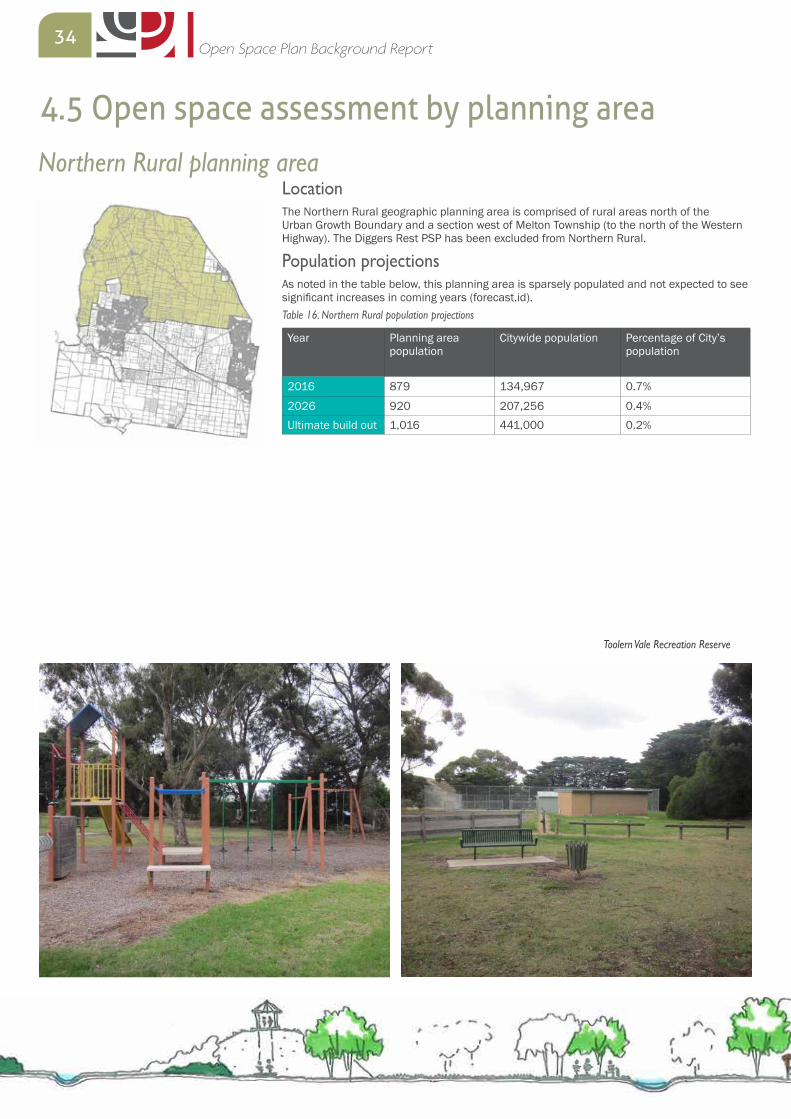
34Open Space Plan Background Report
4.5 Open space assessment by planning area
LocationThe Northern Rural geographic planning area is comprised of rural areas north of the Urban Growth Boundary and a section west of Melton Township (to the north of the Western Highway). The Diggers Rest PSP has been excluded from Northern Rural.
Population projectionsAs noted in the table below, this planning area is sparsely populated and not expected to see significant increases in coming years (forecast.id).Table 16. Northern Rural population projections Year Planning area
populationCitywide population Percentage of City’s
population
2016 879 134,967 0.7%
2026 920 207,256 0.4%Ultimate build out 1,016 441,000 0.2%
Northern Rural planning area
Toolern Vale Recreation Reserve

35Open Space Plan Background Report
Given the limited population, it is not surprising that there is only one core open space parcel in the area - Toolern Vale Recreation Reserve. There are additional areas (6.4ha) of environmental reserve in the southern end of the planning area.
Current supply1,2
1 Open space available at education facilities and private providers has not been included in quantifying supply in any of the planning areas 2 It is important to note that regional-level open space can also function as district-level. Similarly, district-level open space can also function as local-level
LegendLocal passiveDistrict passiveRegional passiveEncumberedLinear reserveEnvironment reserveDistrict activeRegional activeSpecialised active
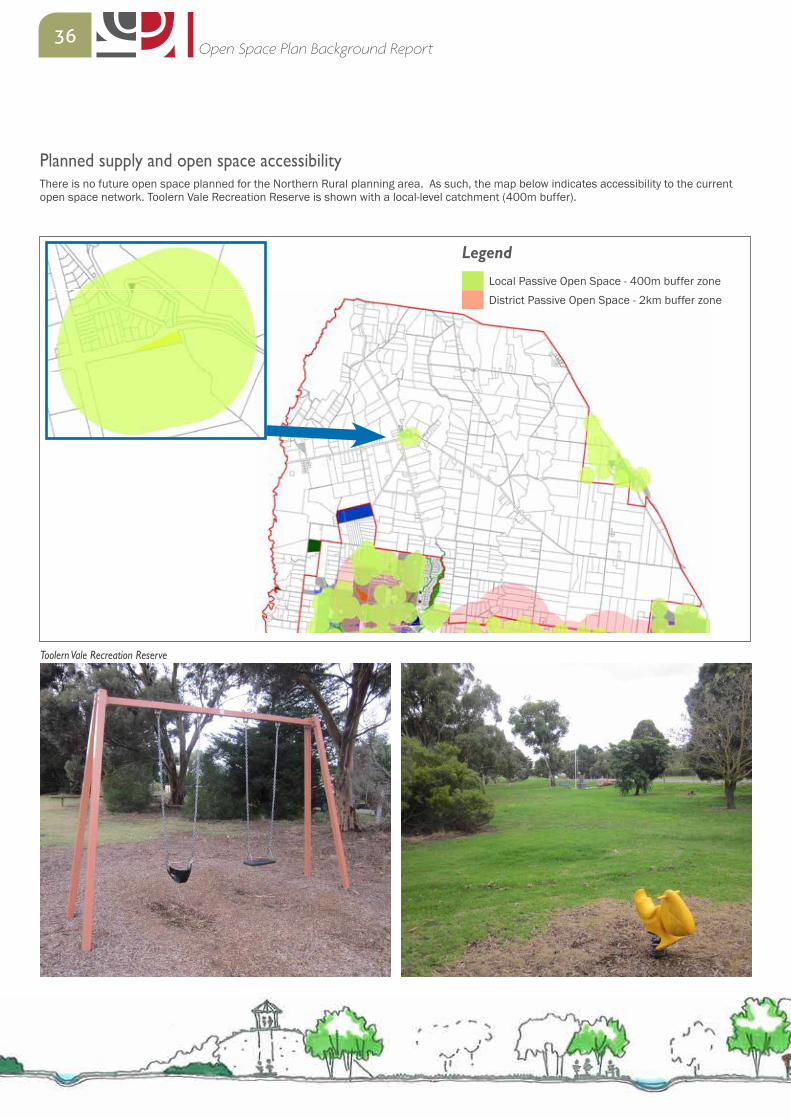
36Open Space Plan Background Report
Planned supply and open space accessibilityThere is no future open space planned for the Northern Rural planning area. As such, the map below indicates accessibility to the current open space network. Toolern Vale Recreation Reserve is shown with a local-level catchment (400m buffer).
LegendLocal Passive Open Space - 400m buffer zoneDistrict Passive Open Space - 2km buffer zone
Toolern Vale Recreation Reserve
37Open Space Plan Background Report
Demand and gap assessmentUsing the desired standard of service for land supply of 2.2ha/1,000 (being 0.6ha for local passive, 0.3ha for district passive and 1.3ha for district active), the likely demand for open space and any gaps in the planned provision are detailed in the table below. This demand assessment is based on the land standard and population projections only.
Classification Applicable hierarchy Current supply (ha)
Total supply (ha)1
Desired supply (ha)2
Ultimate gap (ha)3
Passive open space Local Passive 0.96 0.96 0.61 0.35
District Passive 0 0 0.30 -0.3Active open space District Active 0 0 1.32 -1.32
1 - Total supply = current supply 2 - Desired supply = ultimate build out population projection x desired standards of service3 - Ultimate gap = total supply - desired supply (Note - positive numbers reflect an over-supply, negative numbers reflect an under-supply)
Table 17. Northern Rural open space demand and supply assessment
AnalysisThe demand and gap assessment suggests that the Northern Rural area requires a small amount of both district passive open space and active open space. Additionally, the accessibility map highlights that there are large sections of the area without ready access to core open space. However, given the limited population base and the rural nature of this area (where residents are likely to have access to ‘open space’ on their large properties), this area is considered appropriately catered for now and into the future.
In addition, those residents at the western and southern ends of the Northern Rural area have access to sport and recreation opportunities in the Melton Township planning area, while those in the east will have access to quality opportunities at Diggers Rest as it continues to develop.
38Open Space Plan Background Report
Diggers Rest planning areaLocationThe Diggers Rest geographic planning area is comprised largely of the township of Diggers Rest. While the area appears somewhat geographically isolated when considered in the terms of the remainder of the City of Melton, the town of Sunbury is located directly to the north of the Diggers Rest area.
Population projectionsSignificant urban growth is predicted for Diggers Rest. In fact, the population is expected to increase more than seven-fold between 2016 and ultimate build out. This growth is predicted to be from many young families moving to the area - resulting in marked increases in the proportion of young people and those aged 30-39 years residing in the area (forecast.id).
Table 18. Diggers Rest population projections
Year Planning area population
Citywide population Percentage of City’s population
2016 1,952 134,967 1.5%
2026 6,442 207,256 3.1%Ultimate build out 13,922 441,000 3.2%
Diggers Rest Recreation Reserve
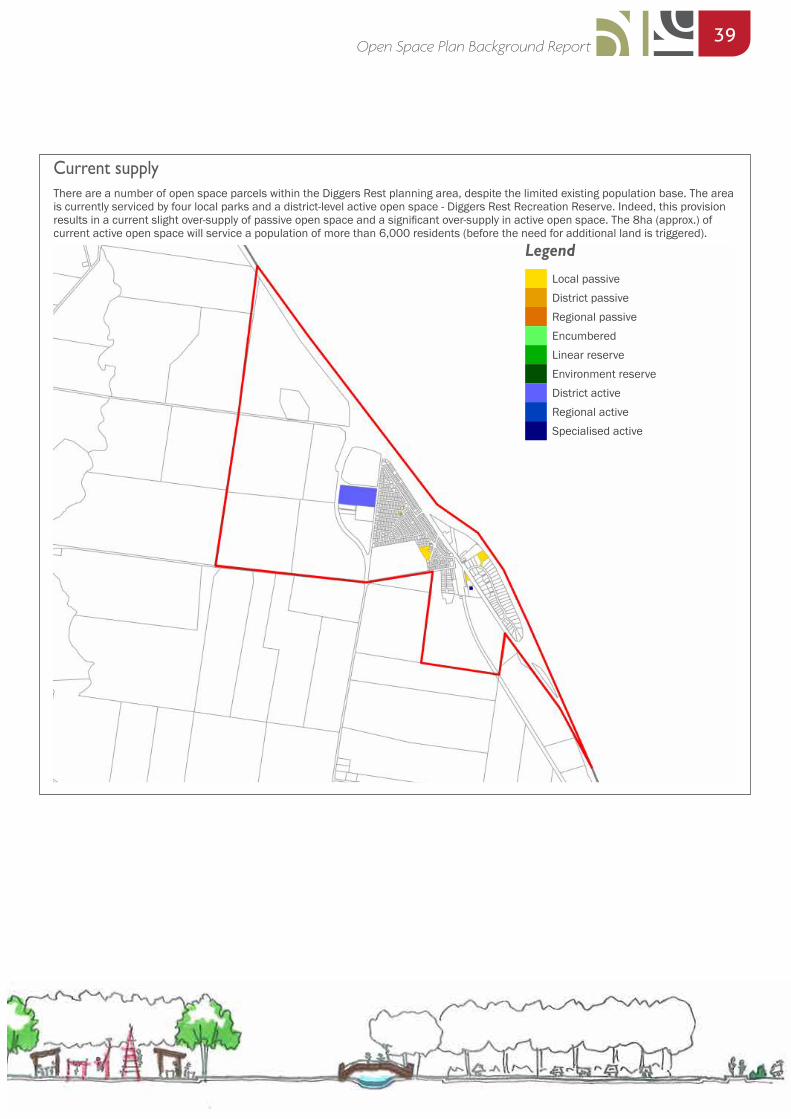
39Open Space Plan Background Report
There are a number of open space parcels within the Diggers Rest planning area, despite the limited existing population base. The area is currently serviced by four local parks and a district-level active open space - Diggers Rest Recreation Reserve. Indeed, this provision results in a current slight over-supply of passive open space and a significant over-supply in active open space. The 8ha (approx.) of current active open space will service a population of more than 6,000 residents (before the need for additional land is triggered).
Current supply
LegendLocal passiveDistrict passiveRegional passiveEncumberedLinear reserveEnvironment reserveDistrict activeRegional activeSpecialised active
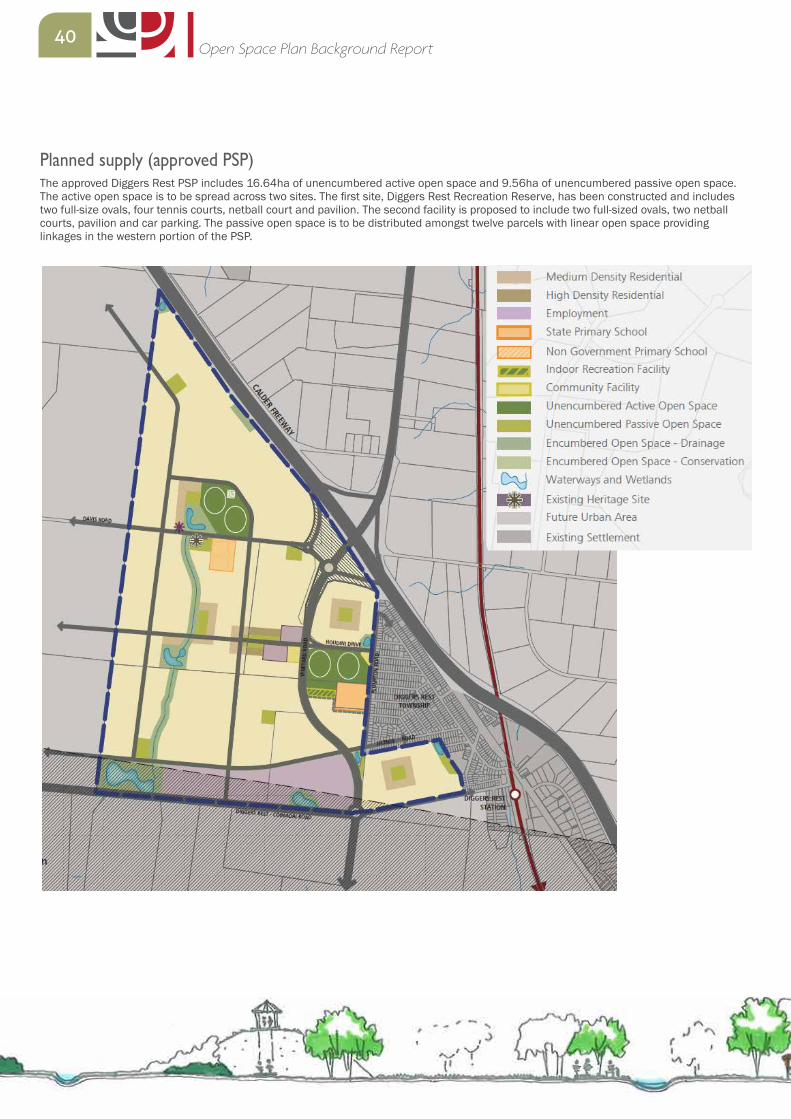
40Open Space Plan Background Report
Planned supply (approved PSP)The approved Diggers Rest PSP includes 16.64ha of unencumbered active open space and 9.56ha of unencumbered passive open space. The active open space is to be spread across two sites. The first site, Diggers Rest Recreation Reserve, has been constructed and includes two full-size ovals, four tennis courts, netball court and pavilion. The second facility is proposed to include two full-sized ovals, two netball courts, pavilion and car parking. The passive open space is to be distributed amongst twelve parcels with linear open space providing linkages in the western portion of the PSP.
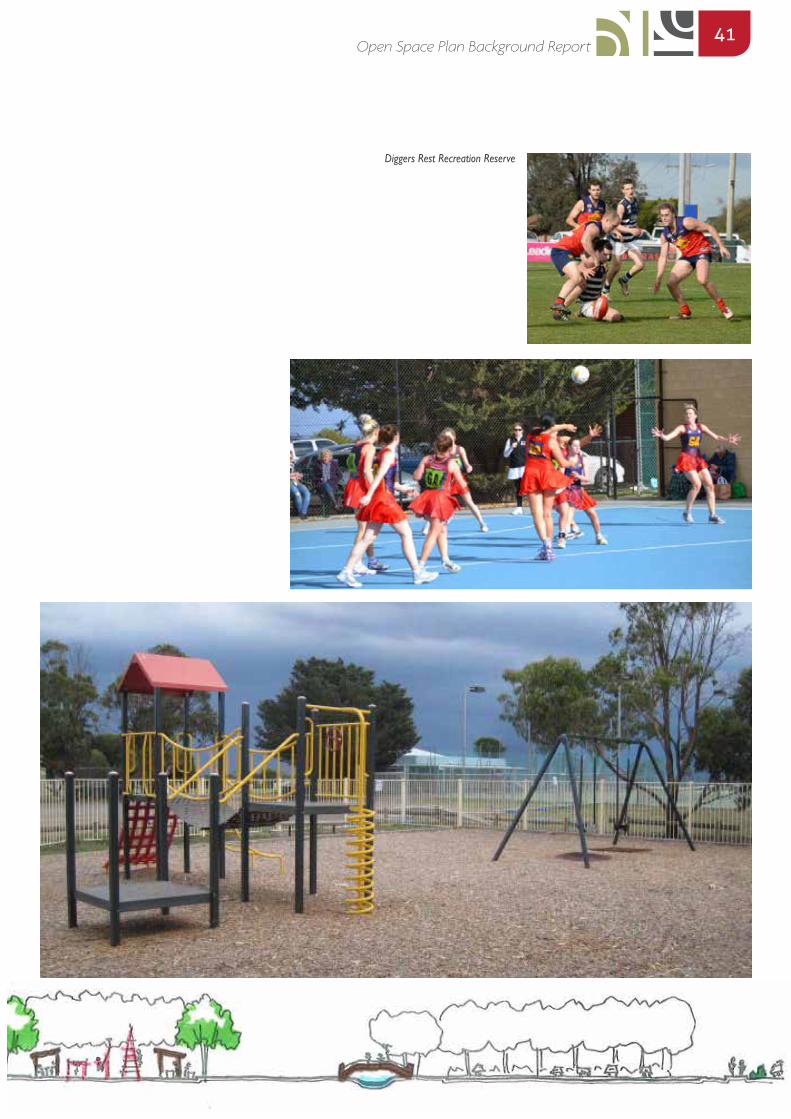
41Open Space Plan Background Report
Diggers Rest Recreation Reserve
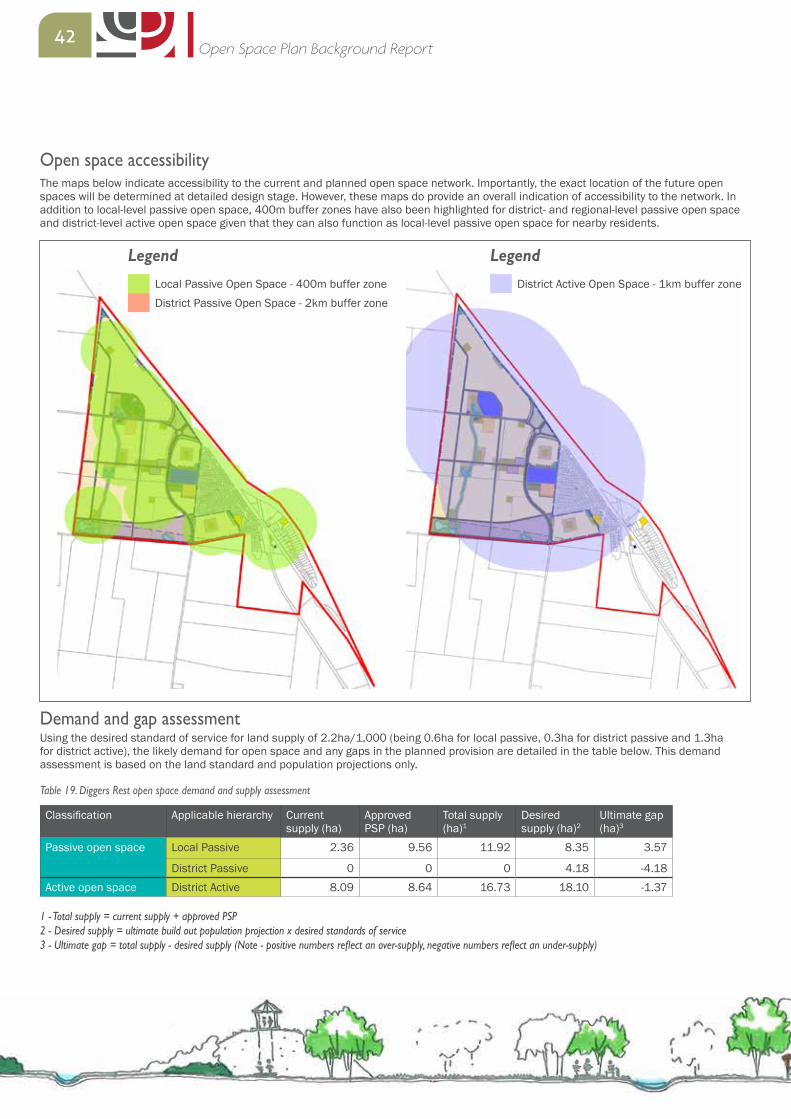
42Open Space Plan Background Report
Open space accessibilityThe maps below indicate accessibility to the current and planned open space network. Importantly, the exact location of the future open spaces will be determined at detailed design stage. However, these maps do provide an overall indication of accessibility to the network. In addition to local-level passive open space, 400m buffer zones have also been highlighted for district- and regional-level passive open space and district-level active open space given that they can also function as local-level passive open space for nearby residents.
LegendLocal Passive Open Space - 400m buffer zoneDistrict Passive Open Space - 2km buffer zone
LegendDistrict Active Open Space - 1km buffer zone
Demand and gap assessmentUsing the desired standard of service for land supply of 2.2ha/1,000 (being 0.6ha for local passive, 0.3ha for district passive and 1.3ha for district active), the likely demand for open space and any gaps in the planned provision are detailed in the table below. This demand assessment is based on the land standard and population projections only.
Classification Applicable hierarchy Current supply (ha)
Approved PSP (ha)
Total supply (ha)1
Desired supply (ha)2
Ultimate gap (ha)3
Passive open space Local Passive 2.36 9.56 11.92 8.35 3.57
District Passive 0 0 0 4.18 -4.18Active open space District Active 8.09 8.64 16.73 18.10 -1.37
1 - Total supply = current supply + approved PSP 2 - Desired supply = ultimate build out population projection x desired standards of service3 - Ultimate gap = total supply - desired supply (Note - positive numbers reflect an over-supply, negative numbers reflect an under-supply)
Table 19. Diggers Rest open space demand and supply assessment
43Open Space Plan Background Report
AnalysisAs a young and growing community, the approved Diggers Rest PSP will provide much of the open space for the planning area.
Passive open spaceThe 9.56ha of passive open space identified in the Diggers Rest PSP is all local-level given that, to date, none of the approved PSPs include district-level provision. As a result, the demand and gap assessment highlights a slight over-supply in local-level passive open space and a reflective under-supply of district-level open space.
Potentially, Council may look to develop one of the proposed local parks as a higher-level district park (or to establish a significant passive recreation node within the northern playing fields development commensurate with a district passive park). This will be important to ensure diversity in recreation opportunities across the open space network for Diggers Rest.
Active open space With approximately 8ha of district-level active open space identified in the PSP already developed and an additional 8.5ha (approximately) to be developed as growth is achieved, the planning area will be relatively well serviced for this form of open space. The slight under-supply (of less than 1.5ha) is insignificant and does not require additional land acquisition.
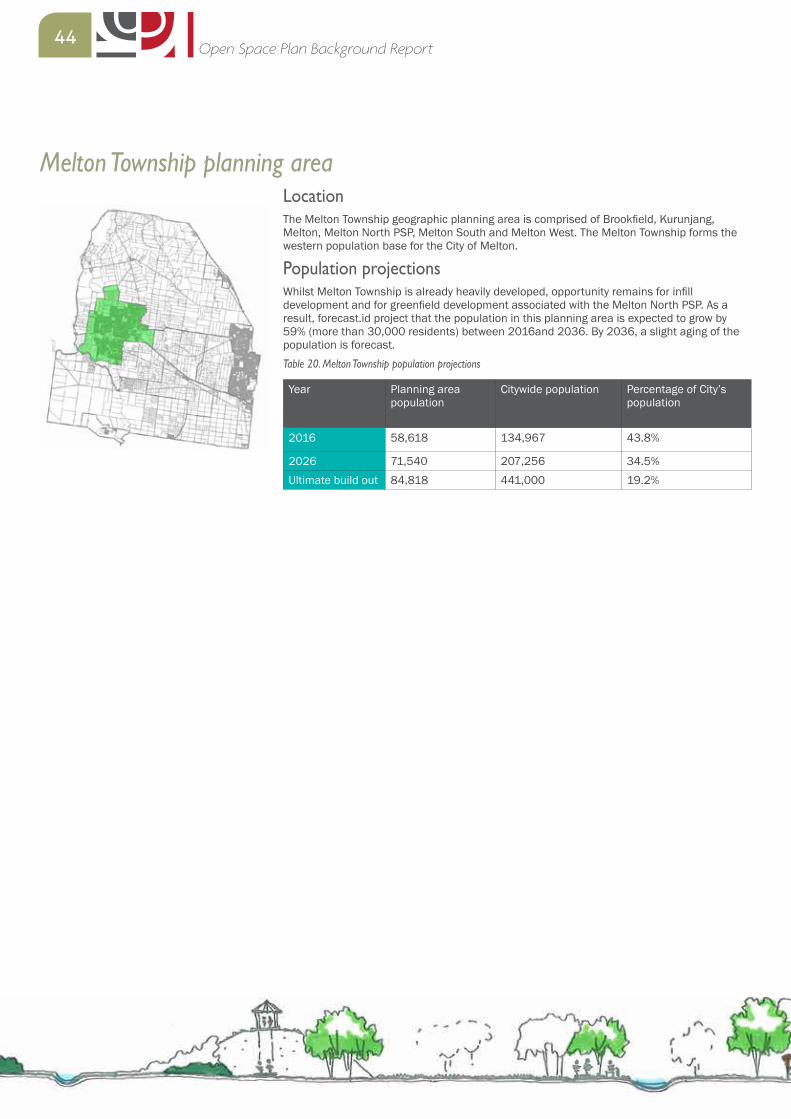
44Open Space Plan Background Report
Melton Township planning areaLocationThe Melton Township geographic planning area is comprised of Brookfield, Kurunjang, Melton, Melton North PSP, Melton South and Melton West. The Melton Township forms the western population base for the City of Melton.
Population projectionsWhilst Melton Township is already heavily developed, opportunity remains for infill development and for greenfield development associated with the Melton North PSP. As a result, forecast.id project that the population in this planning area is expected to grow by 59% (more than 30,000 residents) between 2016and 2036. By 2036, a slight aging of the population is forecast.
Year Planning area population
Citywide population Percentage of City’s population
2016 58,618 134,967 43.8%
2026 71,540 207,256 34.5%Ultimate build out 84,818 441,000 19.2%
Table 20. Melton Township population projections
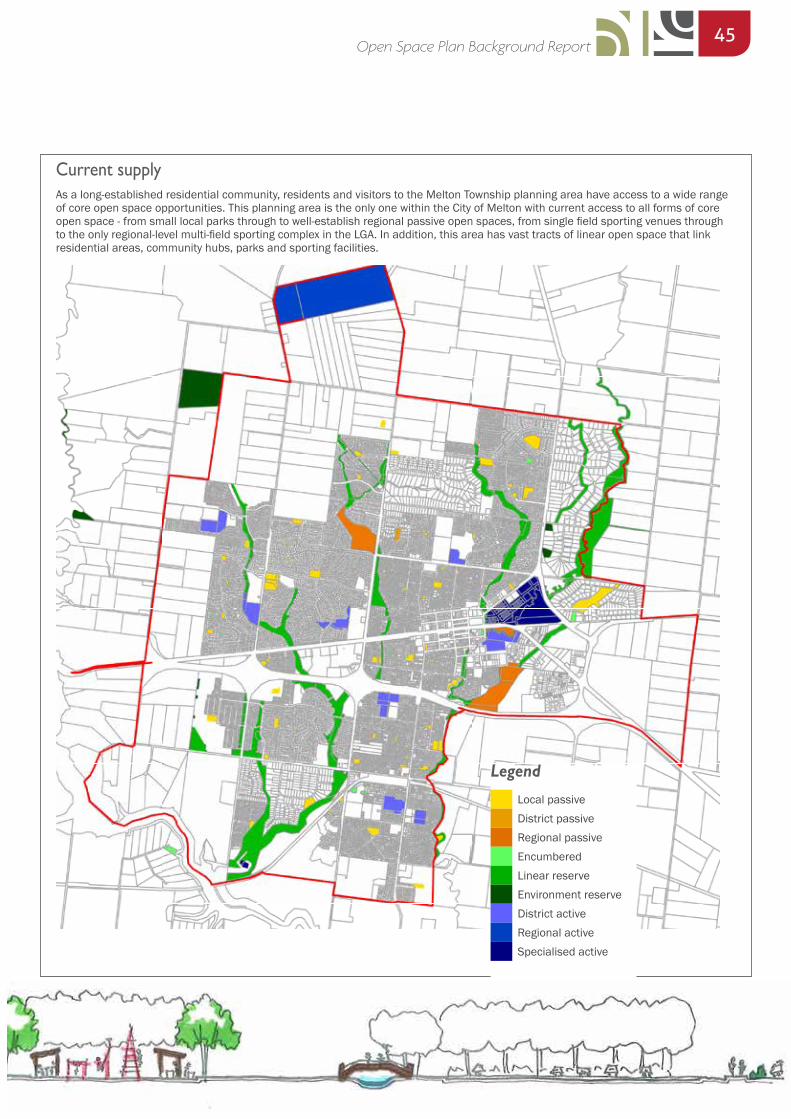
45Open Space Plan Background Report
As a long-established residential community, residents and visitors to the Melton Township planning area have access to a wide range of core open space opportunities. This planning area is the only one within the City of Melton with current access to all forms of core open space - from small local parks through to well-establish regional passive open spaces, from single field sporting venues through to the only regional-level multi-field sporting complex in the LGA. In addition, this area has vast tracts of linear open space that link residential areas, community hubs, parks and sporting facilities.
Current supply
LegendLocal passiveDistrict passiveRegional passiveEncumberedLinear reserveEnvironment reserveDistrict activeRegional activeSpecialised active
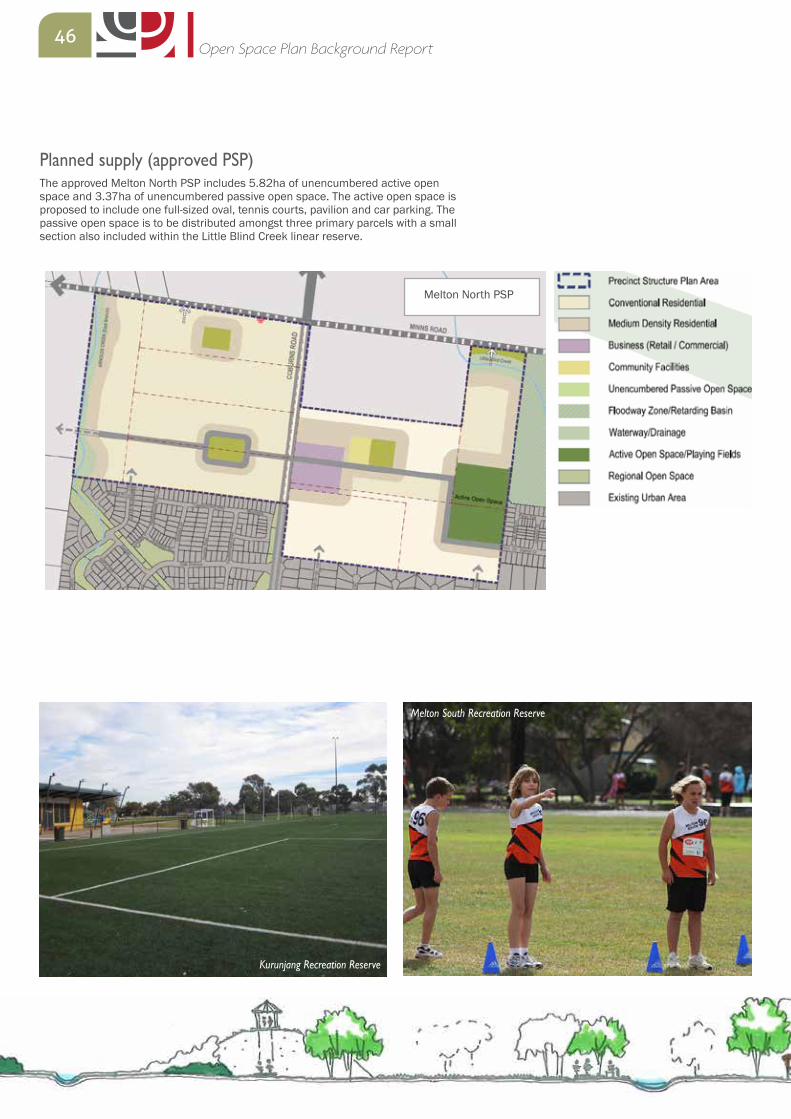
46Open Space Plan Background Report
Planned supply (approved PSP)The approved Melton North PSP includes 5.82ha of unencumbered active open space and 3.37ha of unencumbered passive open space. The active open space is proposed to include one full-sized oval, tennis courts, pavilion and car parking. The passive open space is to be distributed amongst three primary parcels with a small section also included within the Little Blind Creek linear reserve.
Melton North PSP
Kurunjang Recreation Reserve
Melton South Recreation Reserve
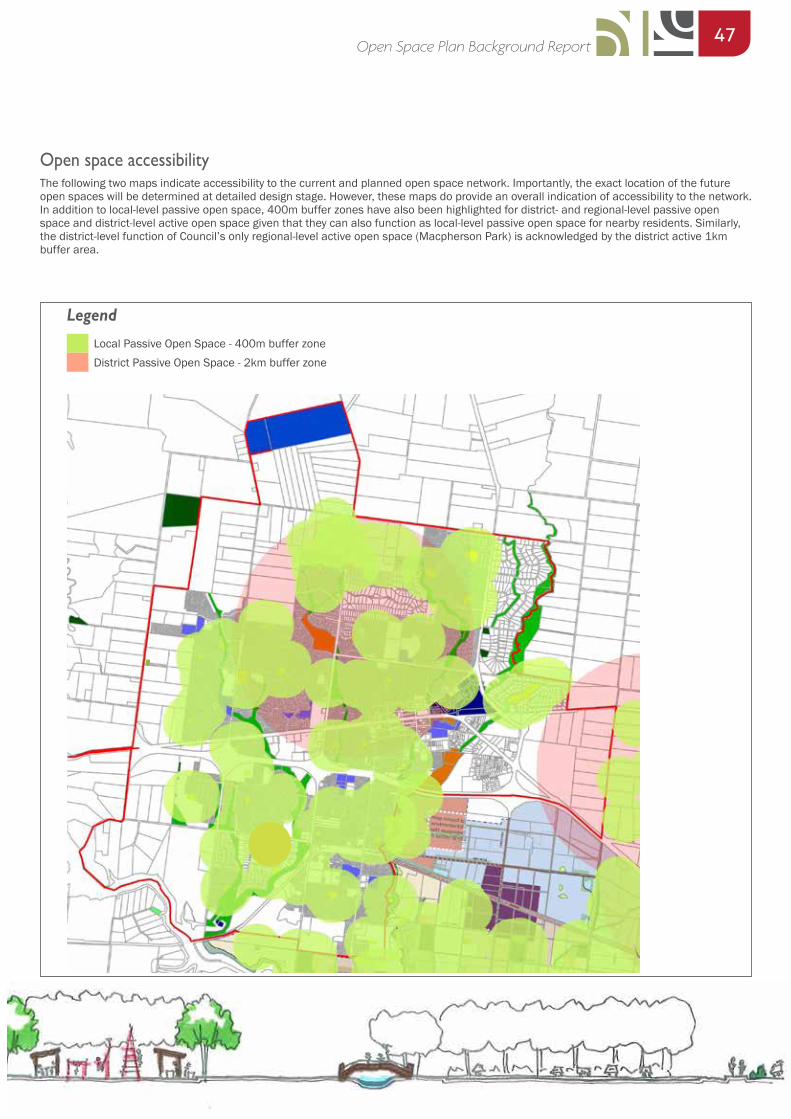
47Open Space Plan Background Report
Open space accessibilityThe following two maps indicate accessibility to the current and planned open space network. Importantly, the exact location of the future open spaces will be determined at detailed design stage. However, these maps do provide an overall indication of accessibility to the network. In addition to local-level passive open space, 400m buffer zones have also been highlighted for district- and regional-level passive open space and district-level active open space given that they can also function as local-level passive open space for nearby residents. Similarly, the district-level function of Council’s only regional-level active open space (Macpherson Park) is acknowledged by the district active 1km buffer area.
LegendLocal Passive Open Space - 400m buffer zoneDistrict Passive Open Space - 2km buffer zone
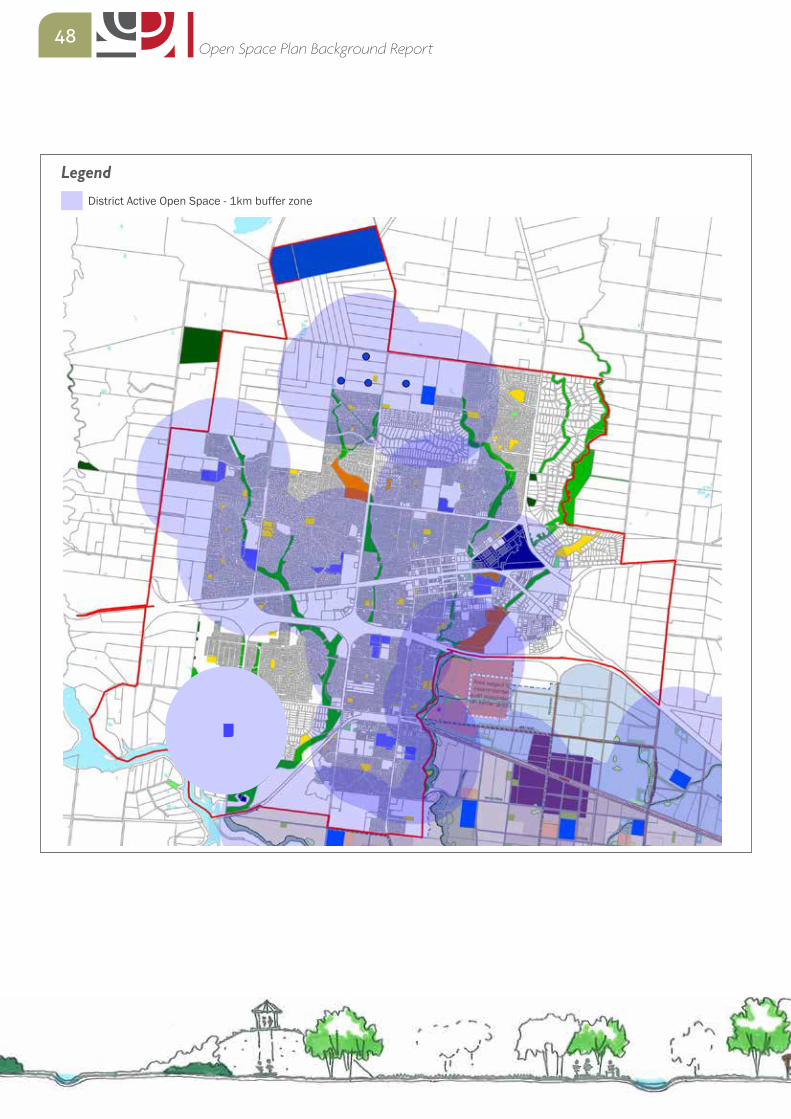
48Open Space Plan Background Report
LegendDistrict Active Open Space - 1km buffer zone
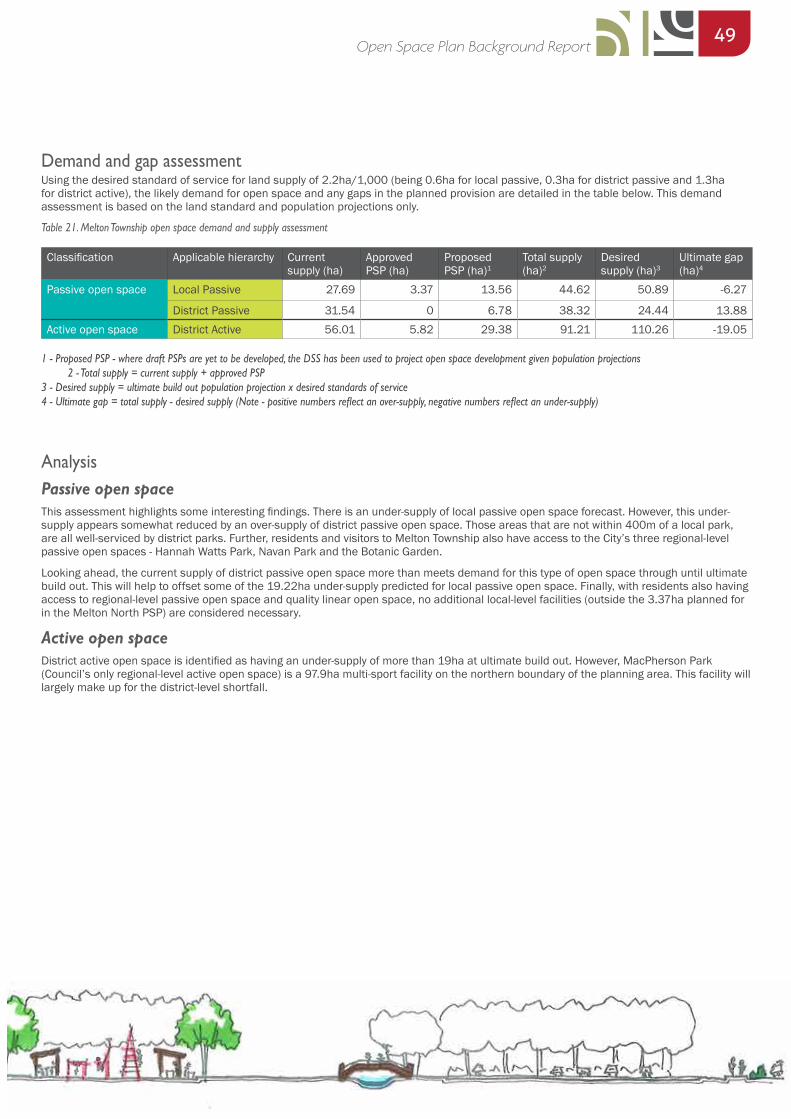
49Open Space Plan Background Report
AnalysisPassive open spaceThis assessment highlights some interesting findings. There is an under-supply of local passive open space forecast. However, this under-supply appears somewhat reduced by an over-supply of district passive open space. Those areas that are not within 400m of a local park, are all well-serviced by district parks. Further, residents and visitors to Melton Township also have access to the City’s three regional-level passive open spaces - Hannah Watts Park, Navan Park and the Botanic Garden.
Looking ahead, the current supply of district passive open space more than meets demand for this type of open space through until ultimate build out. This will help to offset some of the 19.22ha under-supply predicted for local passive open space. Finally, with residents also having access to regional-level passive open space and quality linear open space, no additional local-level facilities (outside the 3.37ha planned for in the Melton North PSP) are considered necessary.
Active open spaceDistrict active open space is identified as having an under-supply of more than 19ha at ultimate build out. However, MacPherson Park (Council’s only regional-level active open space) is a 97.9ha multi-sport facility on the northern boundary of the planning area. This facility will largely make up for the district-level shortfall.
Demand and gap assessmentUsing the desired standard of service for land supply of 2.2ha/1,000 (being 0.6ha for local passive, 0.3ha for district passive and 1.3ha for district active), the likely demand for open space and any gaps in the planned provision are detailed in the table below. This demand assessment is based on the land standard and population projections only.
Classification Applicable hierarchy Current supply (ha)
Approved PSP (ha)
Proposed PSP (ha)1
Total supply (ha)2
Desired supply (ha)3
Ultimate gap (ha)4
Passive open space Local Passive 27.69 3.37 13.56 44.62 50.89 -6.27
District Passive 31.54 0 6.78 38.32 24.44 13.88Active open space District Active 56.01 5.82 29.38 91.21 110.26 -19.05
1 - Proposed PSP - where draft PSPs are yet to be developed, the DSS has been used to project open space development given population projections 2 - Total supply = current supply + approved PSP
3 - Desired supply = ultimate build out population projection x desired standards of service4 - Ultimate gap = total supply - desired supply (Note - positive numbers reflect an over-supply, negative numbers reflect an under-supply)
Table 21. Melton Township open space demand and supply assessment
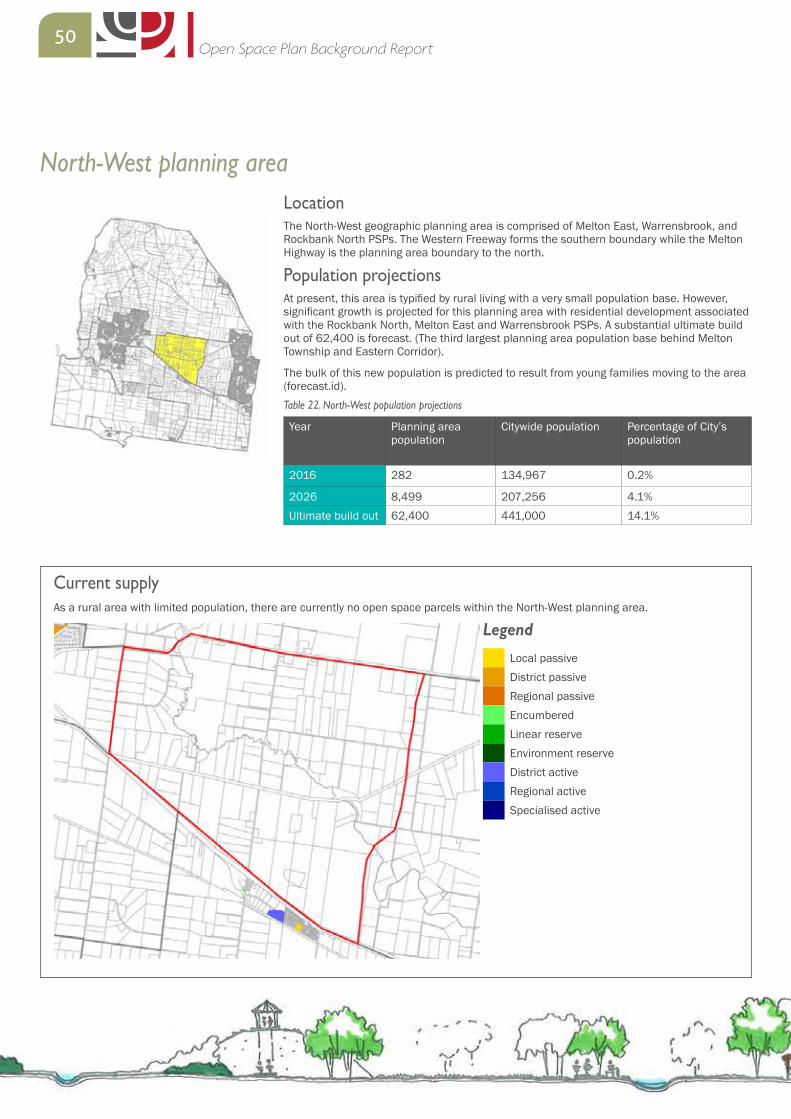
50Open Space Plan Background Report
North-West planning areaLocationThe North-West geographic planning area is comprised of Melton East, Warrensbrook, and Rockbank North PSPs. The Western Freeway forms the southern boundary while the Melton Highway is the planning area boundary to the north.
Population projectionsAt present, this area is typified by rural living with a very small population base. However, significant growth is projected for this planning area with residential development associated with the Rockbank North, Melton East and Warrensbrook PSPs. A substantial ultimate build out of 62,400 is forecast. (The third largest planning area population base behind Melton Township and Eastern Corridor).
The bulk of this new population is predicted to result from young families moving to the area (forecast.id).Table 22. North-West population projections Year Planning area
populationCitywide population Percentage of City’s
population
2016 282 134,967 0.2%
2026 8,499 207,256 4.1%Ultimate build out 62,400 441,000 14.1%
As a rural area with limited population, there are currently no open space parcels within the North-West planning area.
Current supply
LegendLocal passiveDistrict passiveRegional passiveEncumberedLinear reserveEnvironment reserveDistrict activeRegional activeSpecialised active
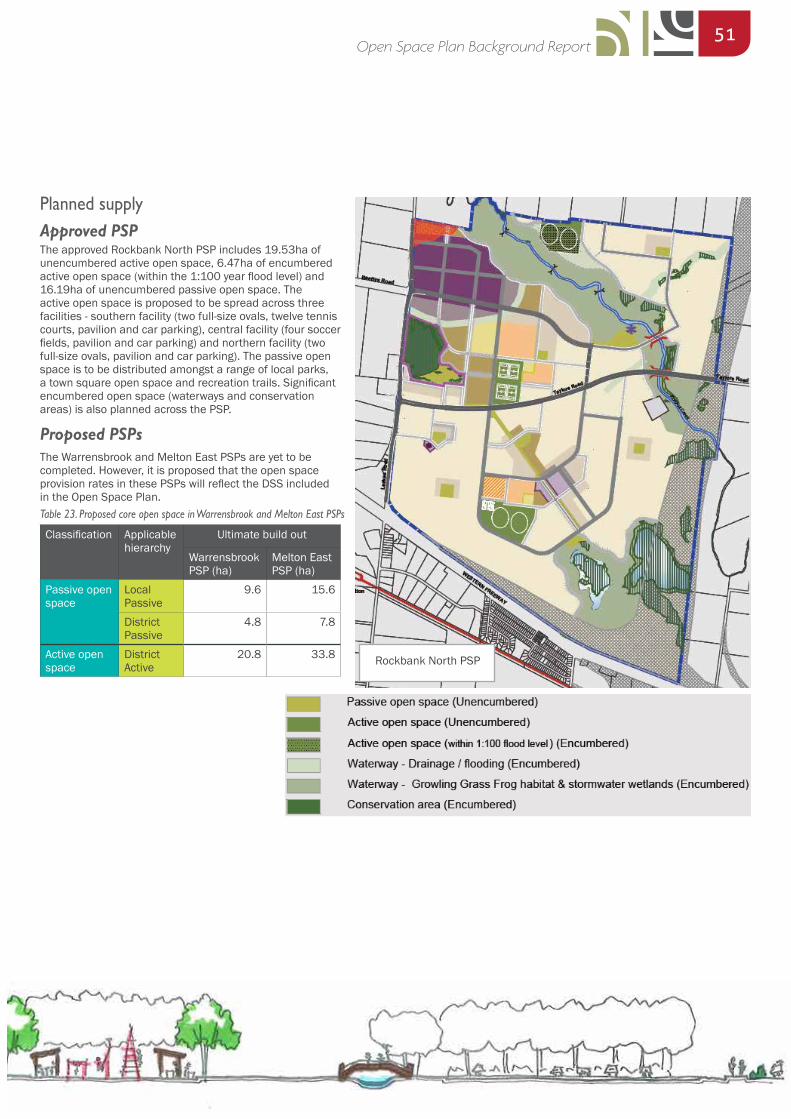
51Open Space Plan Background Report
Rockbank North PSP
Planned supply Approved PSPThe approved Rockbank North PSP includes 19.53ha of unencumbered active open space, 6.47ha of encumbered active open space (within the 1:100 year flood level) and 16.19ha of unencumbered passive open space. The active open space is proposed to be spread across three facilities - southern facility (two full-size ovals, twelve tennis courts, pavilion and car parking), central facility (four soccer fields, pavilion and car parking) and northern facility (two full-size ovals, pavilion and car parking). The passive open space is to be distributed amongst a range of local parks, a town square open space and recreation trails. Significant encumbered open space (waterways and conservation areas) is also planned across the PSP.
Proposed PSPsThe Warrensbrook and Melton East PSPs are yet to be completed. However, it is proposed that the open space provision rates in these PSPs will reflect the DSS included in the Open Space Plan.
Classification Applicable hierarchy
Ultimate build out
Warrensbrook PSP (ha)
Melton East PSP (ha)
Passive open space
Local Passive
9.6 15.6
District Passive
4.8 7.8
Active open space
District Active
20.8 33.8
Table 23. Proposed core open space in Warrensbrook and Melton East PSPs
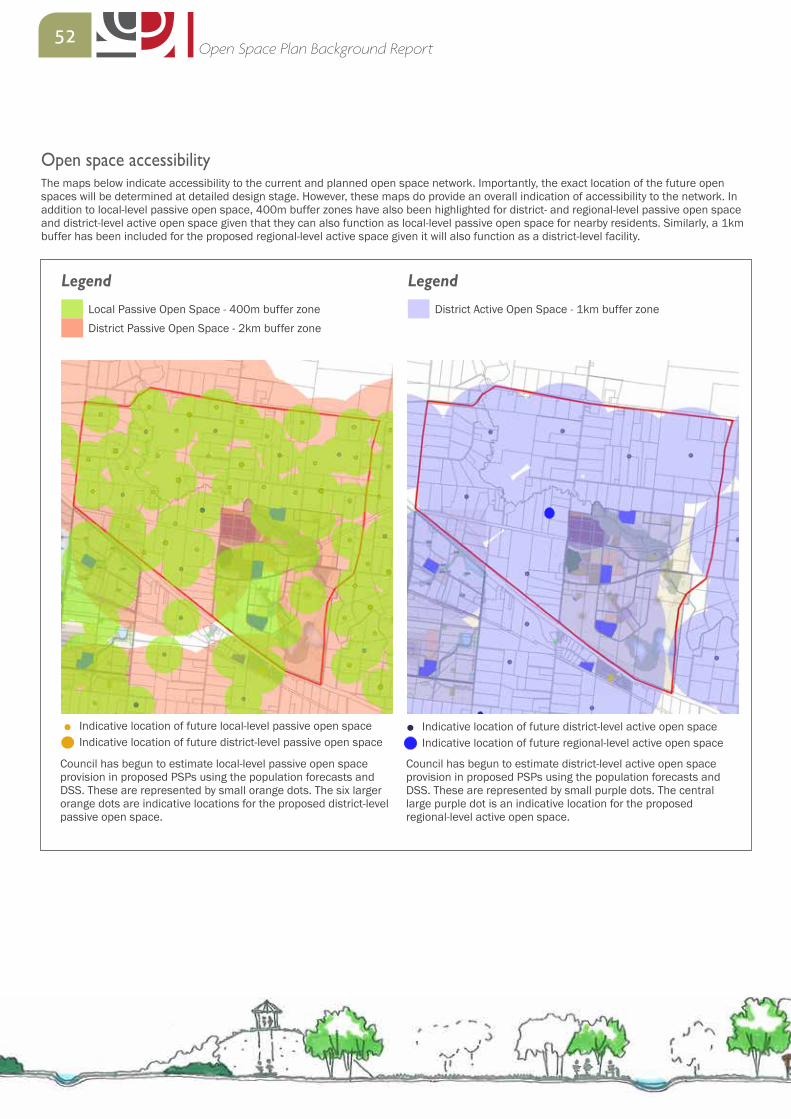
52Open Space Plan Background Report
Open space accessibilityThe maps below indicate accessibility to the current and planned open space network. Importantly, the exact location of the future open spaces will be determined at detailed design stage. However, these maps do provide an overall indication of accessibility to the network. In addition to local-level passive open space, 400m buffer zones have also been highlighted for district- and regional-level passive open space and district-level active open space given that they can also function as local-level passive open space for nearby residents. Similarly, a 1km buffer has been included for the proposed regional-level active space given it will also function as a district-level facility.
LegendLocal Passive Open Space - 400m buffer zoneDistrict Passive Open Space - 2km buffer zone
LegendDistrict Active Open Space - 1km buffer zone
Council has begun to estimate district-level active open space provision in proposed PSPs using the population forecasts and DSS. These are represented by small purple dots. The central large purple dot is an indicative location for the proposed regional-level active open space.
Council has begun to estimate local-level passive open space provision in proposed PSPs using the population forecasts and DSS. These are represented by small orange dots. The six larger orange dots are indicative locations for the proposed district-level passive open space.
Indicative location of future local-level passive open space Indicative location of future district-level active open spaceIndicative location of future district-level passive open space Indicative location of future regional-level active open space
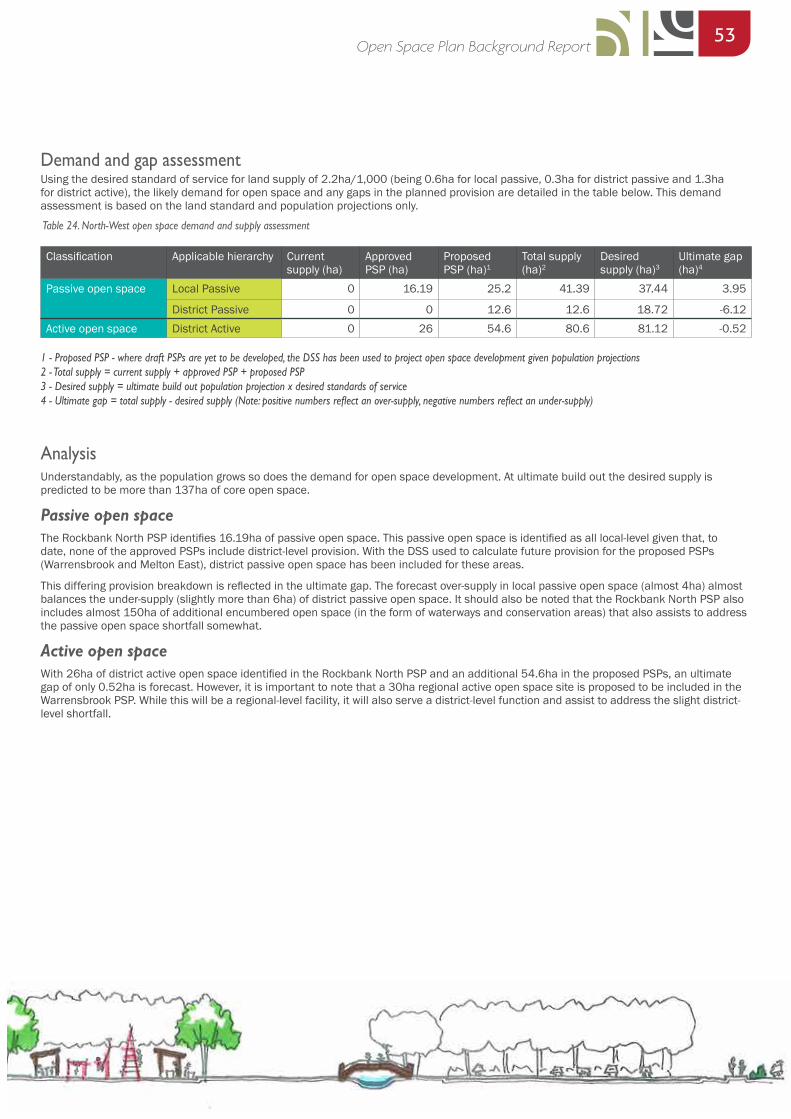
53Open Space Plan Background Report
Demand and gap assessmentUsing the desired standard of service for land supply of 2.2ha/1,000 (being 0.6ha for local passive, 0.3ha for district passive and 1.3ha for district active), the likely demand for open space and any gaps in the planned provision are detailed in the table below. This demand assessment is based on the land standard and population projections only.
Classification Applicable hierarchy Current supply (ha)
Approved PSP (ha)
Proposed PSP (ha)1
Total supply (ha)2
Desired supply (ha)3
Ultimate gap (ha)4
Passive open space Local Passive 0 16.19 25.2 41.39 37.44 3.95
District Passive 0 0 12.6 12.6 18.72 -6.12Active open space District Active 0 26 54.6 80.6 81.12 -0.52
1 - Proposed PSP - where draft PSPs are yet to be developed, the DSS has been used to project open space development given population projections2 - Total supply = current supply + approved PSP + proposed PSP 3 - Desired supply = ultimate build out population projection x desired standards of service4 - Ultimate gap = total supply - desired supply (Note: positive numbers reflect an over-supply, negative numbers reflect an under-supply)
Table 24. North-West open space demand and supply assessment
AnalysisUnderstandably, as the population grows so does the demand for open space development. At ultimate build out the desired supply is predicted to be more than 137ha of core open space.
Passive open spaceThe Rockbank North PSP identifies 16.19ha of passive open space. This passive open space is identified as all local-level given that, to date, none of the approved PSPs include district-level provision. With the DSS used to calculate future provision for the proposed PSPs (Warrensbrook and Melton East), district passive open space has been included for these areas.
This differing provision breakdown is reflected in the ultimate gap. The forecast over-supply in local passive open space (almost 4ha) almost balances the under-supply (slightly more than 6ha) of district passive open space. It should also be noted that the Rockbank North PSP also includes almost 150ha of additional encumbered open space (in the form of waterways and conservation areas) that also assists to address the passive open space shortfall somewhat.
Active open space With 26ha of district active open space identified in the Rockbank North PSP and an additional 54.6ha in the proposed PSPs, an ultimate gap of only 0.52ha is forecast. However, it is important to note that a 30ha regional active open space site is proposed to be included in the Warrensbrook PSP. While this will be a regional-level facility, it will also serve a district-level function and assist to address the slight district-level shortfall.
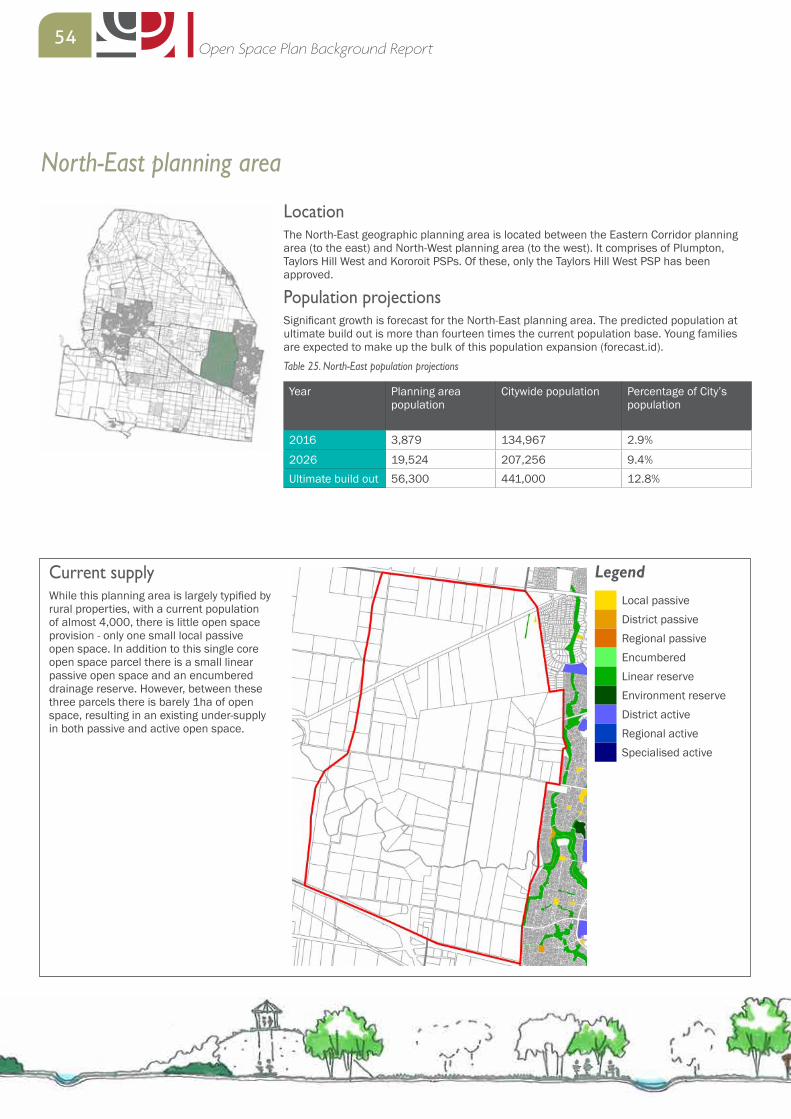
54Open Space Plan Background Report
North-East planning area
LocationThe North-East geographic planning area is located between the Eastern Corridor planning area (to the east) and North-West planning area (to the west). It comprises of Plumpton, Taylors Hill West and Kororoit PSPs. Of these, only the Taylors Hill West PSP has been approved.
Population projectionsSignificant growth is forecast for the North-East planning area. The predicted population at ultimate build out is more than fourteen times the current population base. Young families are expected to make up the bulk of this population expansion (forecast.id).
Year Planning area population
Citywide population Percentage of City’s population
2016 3,879 134,967 2.9%
2026 19,524 207,256 9.4%Ultimate build out 56,300 441,000 12.8%
Table 25. North-East population projections
Current supplyWhile this planning area is largely typified by rural properties, with a current population of almost 4,000, there is little open space provision - only one small local passive open space. In addition to this single core open space parcel there is a small linear passive open space and an encumbered drainage reserve. However, between these three parcels there is barely 1ha of open space, resulting in an existing under-supply in both passive and active open space.
LegendLocal passiveDistrict passiveRegional passiveEncumberedLinear reserveEnvironment reserveDistrict activeRegional activeSpecialised active
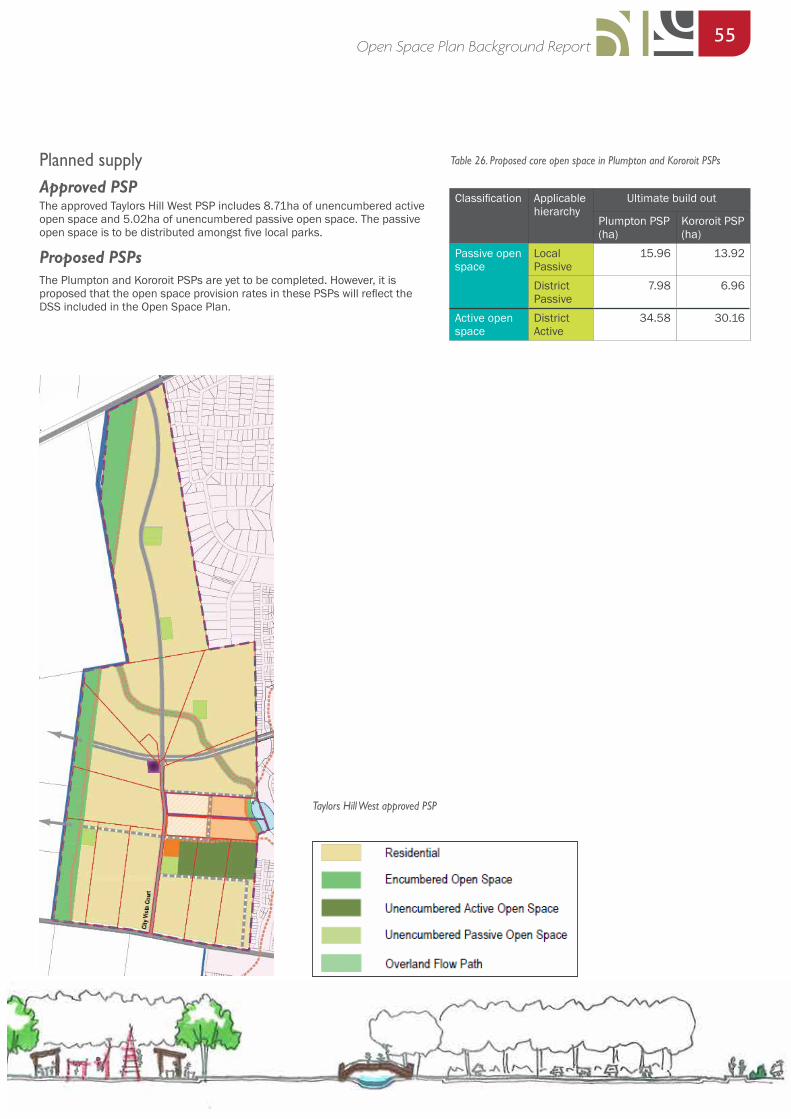
55Open Space Plan Background Report
LegendLocal passiveDistrict passiveRegional passiveEncumberedLinear reserveEnvironment reserveDistrict activeRegional activeSpecialised active
Planned supply Approved PSPThe approved Taylors Hill West PSP includes 8.71ha of unencumbered active open space and 5.02ha of unencumbered passive open space. The passive open space is to be distributed amongst five local parks.
Proposed PSPsThe Plumpton and Kororoit PSPs are yet to be completed. However, it is proposed that the open space provision rates in these PSPs will reflect the DSS included in the Open Space Plan.
Table 26. Proposed core open space in Plumpton and Kororoit PSPs
Taylors Hill West approved PSP
Classification Applicable hierarchy
Ultimate build out
Plumpton PSP (ha)
Kororoit PSP (ha)
Passive open space
Local Passive
15.96 13.92
District Passive
7.98 6.96
Active open space
District Active
34.58 30.16
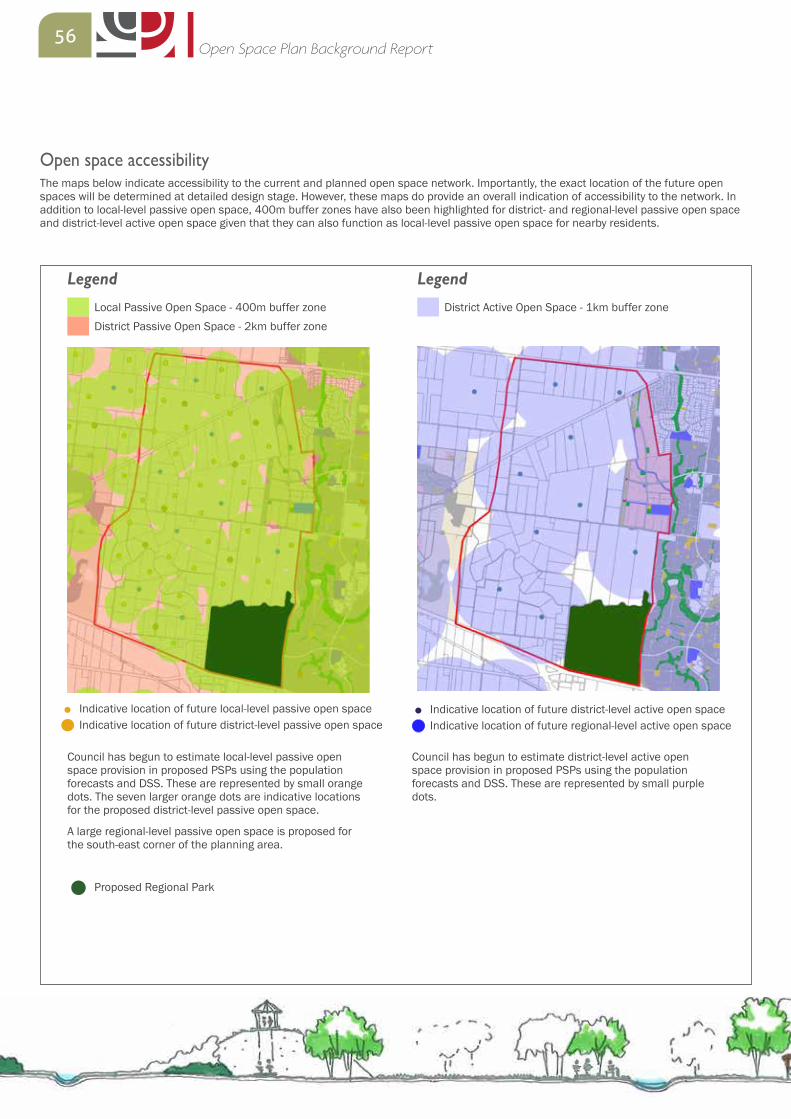
56Open Space Plan Background Report
Open space accessibilityThe maps below indicate accessibility to the current and planned open space network. Importantly, the exact location of the future open spaces will be determined at detailed design stage. However, these maps do provide an overall indication of accessibility to the network. In addition to local-level passive open space, 400m buffer zones have also been highlighted for district- and regional-level passive open space and district-level active open space given that they can also function as local-level passive open space for nearby residents.
LegendDistrict Active Open Space - 1km buffer zone
LegendLocal Passive Open Space - 400m buffer zoneDistrict Passive Open Space - 2km buffer zone
Council has begun to estimate district-level active open space provision in proposed PSPs using the population forecasts and DSS. These are represented by small purple dots.
Council has begun to estimate local-level passive open space provision in proposed PSPs using the population forecasts and DSS. These are represented by small orange dots. The seven larger orange dots are indicative locations for the proposed district-level passive open space.
A large regional-level passive open space is proposed for the south-east corner of the planning area.
Proposed Regional Park
Indicative location of future local-level passive open space Indicative location of future district-level active open spaceIndicative location of future district-level passive open space Indicative location of future regional-level active open space
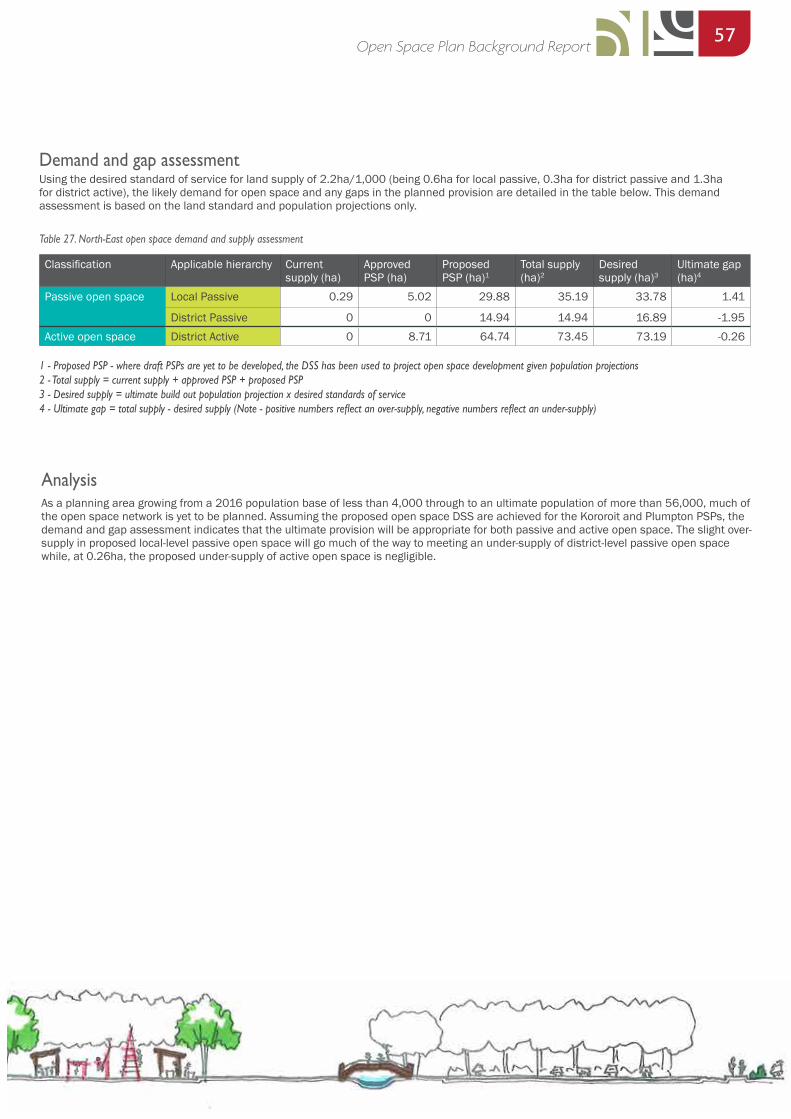
57Open Space Plan Background Report
AnalysisAs a planning area growing from a 2016 population base of less than 4,000 through to an ultimate population of more than 56,000, much of the open space network is yet to be planned. Assuming the proposed open space DSS are achieved for the Kororoit and Plumpton PSPs, the demand and gap assessment indicates that the ultimate provision will be appropriate for both passive and active open space. The slight over-supply in proposed local-level passive open space will go much of the way to meeting an under-supply of district-level passive open space while, at 0.26ha, the proposed under-supply of active open space is negligible.
Demand and gap assessmentUsing the desired standard of service for land supply of 2.2ha/1,000 (being 0.6ha for local passive, 0.3ha for district passive and 1.3ha for district active), the likely demand for open space and any gaps in the planned provision are detailed in the table below. This demand assessment is based on the land standard and population projections only.
Classification Applicable hierarchy Current supply (ha)
Approved PSP (ha)
Proposed PSP (ha)1
Total supply (ha)2
Desired supply (ha)3
Ultimate gap (ha)4
Passive open space Local Passive 0.29 5.02 29.88 35.19 33.78 1.41
District Passive 0 0 14.94 14.94 16.89 -1.95Active open space District Active 0 8.71 64.74 73.45 73.19 -0.26
1 - Proposed PSP - where draft PSPs are yet to be developed, the DSS has been used to project open space development given population projections2 - Total supply = current supply + approved PSP + proposed PSP 3 - Desired supply = ultimate build out population projection x desired standards of service4 - Ultimate gap = total supply - desired supply (Note - positive numbers reflect an over-supply, negative numbers reflect an under-supply)
Table 27. North-East open space demand and supply assessment
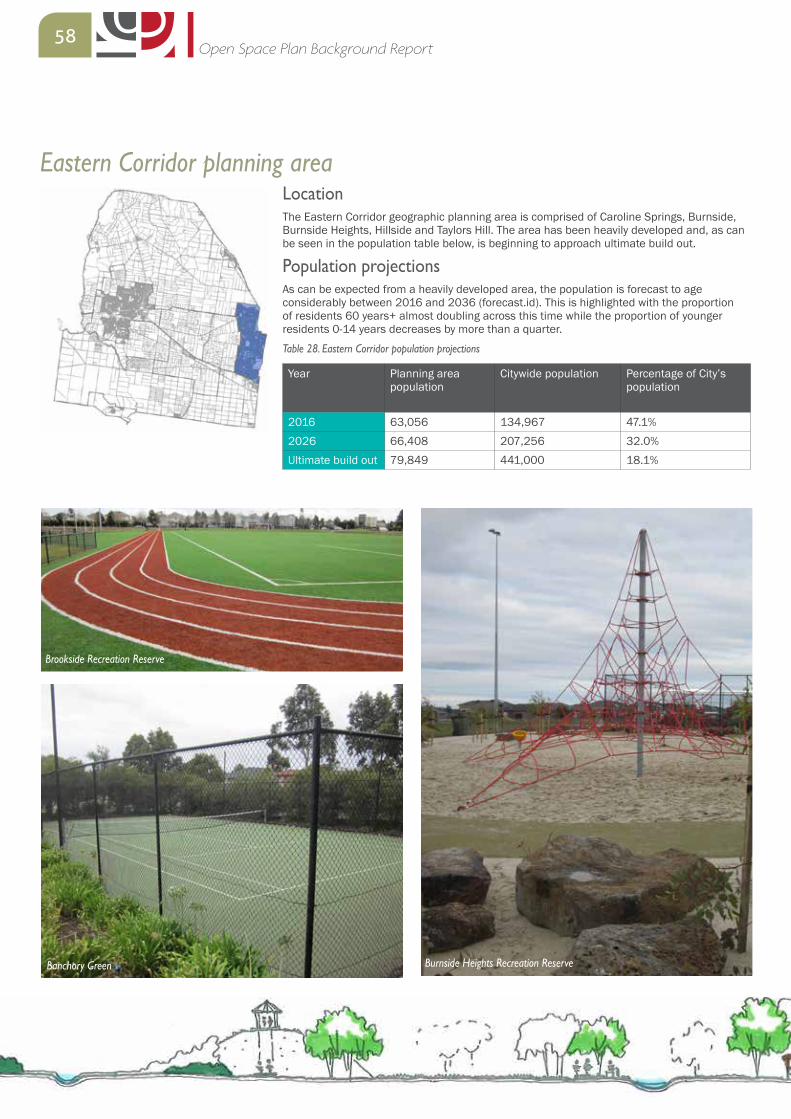
58Open Space Plan Background Report
Eastern Corridor planning areaLocationThe Eastern Corridor geographic planning area is comprised of Caroline Springs, Burnside, Burnside Heights, Hillside and Taylors Hill. The area has been heavily developed and, as can be seen in the population table below, is beginning to approach ultimate build out.
Population projectionsAs can be expected from a heavily developed area, the population is forecast to age considerably between 2016 and 2036 (forecast.id). This is highlighted with the proportion of residents 60 years+ almost doubling across this time while the proportion of younger residents 0-14 years decreases by more than a quarter.
Table 28. Eastern Corridor population projections
Year Planning area population
Citywide population Percentage of City’s population
2016 63,056 134,967 47.1%2026 66,408 207,256 32.0%Ultimate build out 79,849 441,000 18.1%
Brookside Recreation Reserve
Banchory Green Burnside Heights Recreation Reserve
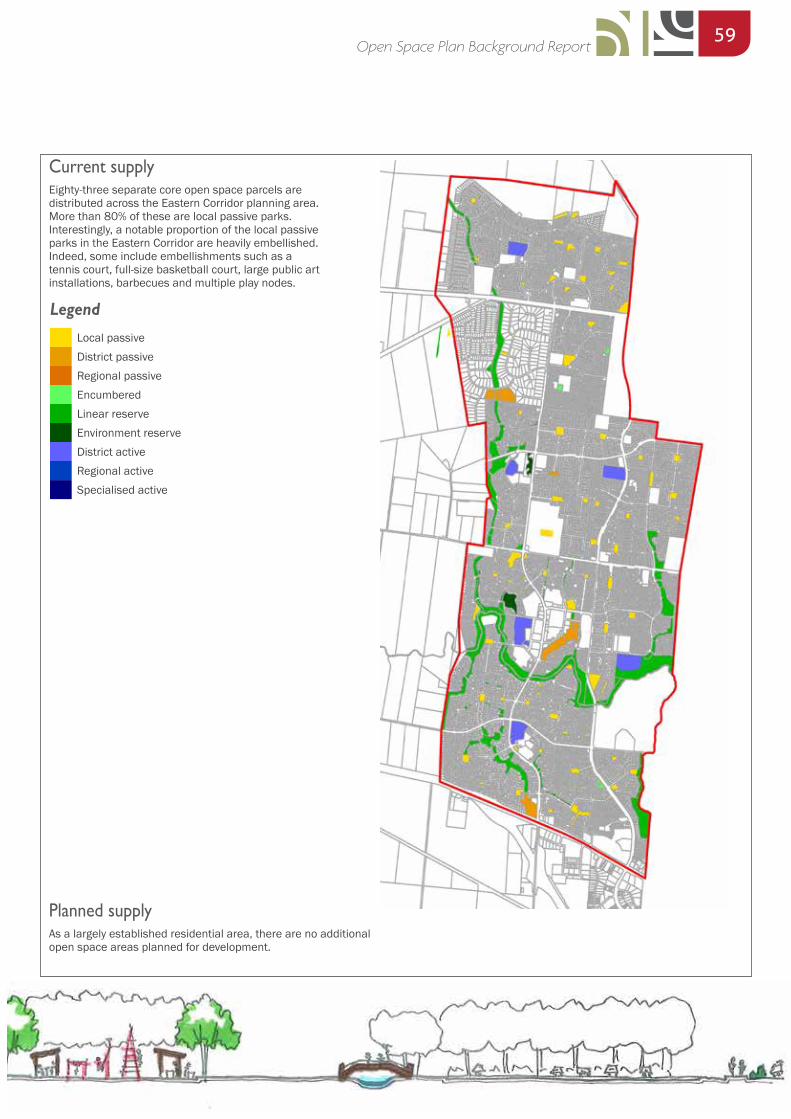
59Open Space Plan Background Report
Current supplyEighty-three separate core open space parcels are distributed across the Eastern Corridor planning area. More than 80% of these are local passive parks. Interestingly, a notable proportion of the local passive parks in the Eastern Corridor are heavily embellished. Indeed, some include embellishments such as a tennis court, full-size basketball court, large public art installations, barbecues and multiple play nodes.
LegendLocal passiveDistrict passiveRegional passiveEncumberedLinear reserveEnvironment reserveDistrict activeRegional activeSpecialised active
Planned supply As a largely established residential area, there are no additional open space areas planned for development.
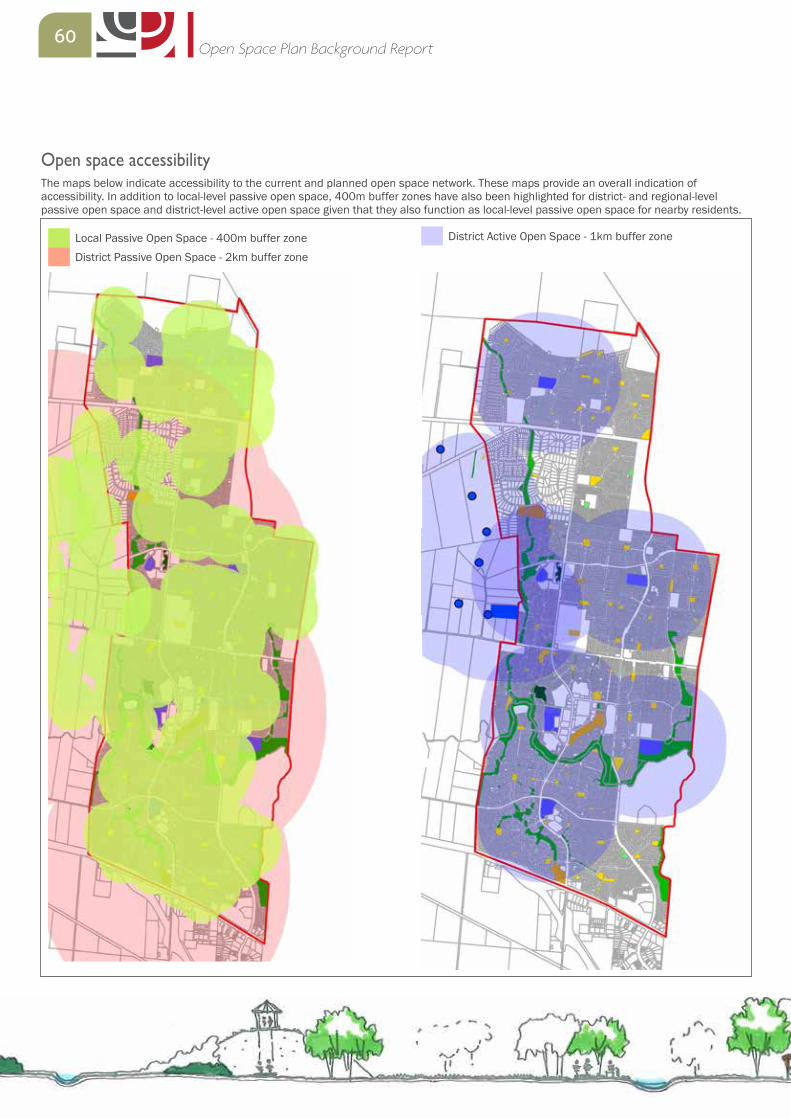
60Open Space Plan Background Report
Open space accessibilityThe maps below indicate accessibility to the current and planned open space network. These maps provide an overall indication of accessibility. In addition to local-level passive open space, 400m buffer zones have also been highlighted for district- and regional-level passive open space and district-level active open space given that they also function as local-level passive open space for nearby residents.
District Active Open Space - 1km buffer zoneLocal Passive Open Space - 400m buffer zoneDistrict Passive Open Space - 2km buffer zone
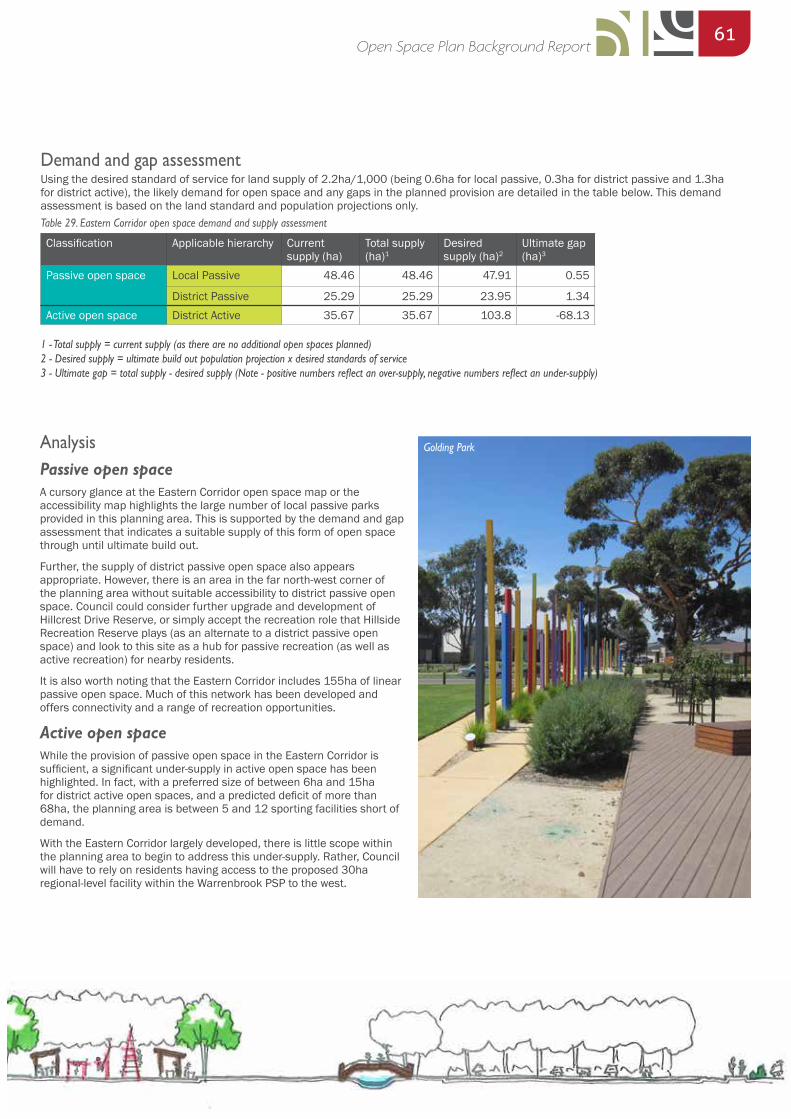
61Open Space Plan Background Report
AnalysisPassive open spaceA cursory glance at the Eastern Corridor open space map or the accessibility map highlights the large number of local passive parks provided in this planning area. This is supported by the demand and gap assessment that indicates a suitable supply of this form of open space through until ultimate build out.
Further, the supply of district passive open space also appears appropriate. However, there is an area in the far north-west corner of the planning area without suitable accessibility to district passive open space. Council could consider further upgrade and development of Hillcrest Drive Reserve, or simply accept the recreation role that Hillside Recreation Reserve plays (as an alternate to a district passive open space) and look to this site as a hub for passive recreation (as well as active recreation) for nearby residents.
It is also worth noting that the Eastern Corridor includes 155ha of linear passive open space. Much of this network has been developed and offers connectivity and a range of recreation opportunities.
Active open spaceWhile the provision of passive open space in the Eastern Corridor is sufficient, a significant under-supply in active open space has been highlighted. In fact, with a preferred size of between 6ha and 15ha for district active open spaces, and a predicted deficit of more than 68ha, the planning area is between 5 and 12 sporting facilities short of demand.
With the Eastern Corridor largely developed, there is little scope within the planning area to begin to address this under-supply. Rather, Council will have to rely on residents having access to the proposed 30ha regional-level facility within the Warrenbrook PSP to the west.
Demand and gap assessmentUsing the desired standard of service for land supply of 2.2ha/1,000 (being 0.6ha for local passive, 0.3ha for district passive and 1.3ha for district active), the likely demand for open space and any gaps in the planned provision are detailed in the table below. This demand assessment is based on the land standard and population projections only.
Classification Applicable hierarchy Current supply (ha)
Total supply (ha)1
Desired supply (ha)2
Ultimate gap (ha)3
Passive open space Local Passive 48.46 48.46 47.91 0.55
District Passive 25.29 25.29 23.95 1.34Active open space District Active 35.67 35.67 103.8 -68.13
1 - Total supply = current supply (as there are no additional open spaces planned) 2 - Desired supply = ultimate build out population projection x desired standards of service3 - Ultimate gap = total supply - desired supply (Note - positive numbers reflect an over-supply, negative numbers reflect an under-supply)
Table 29. Eastern Corridor open space demand and supply assessment
Golding Park
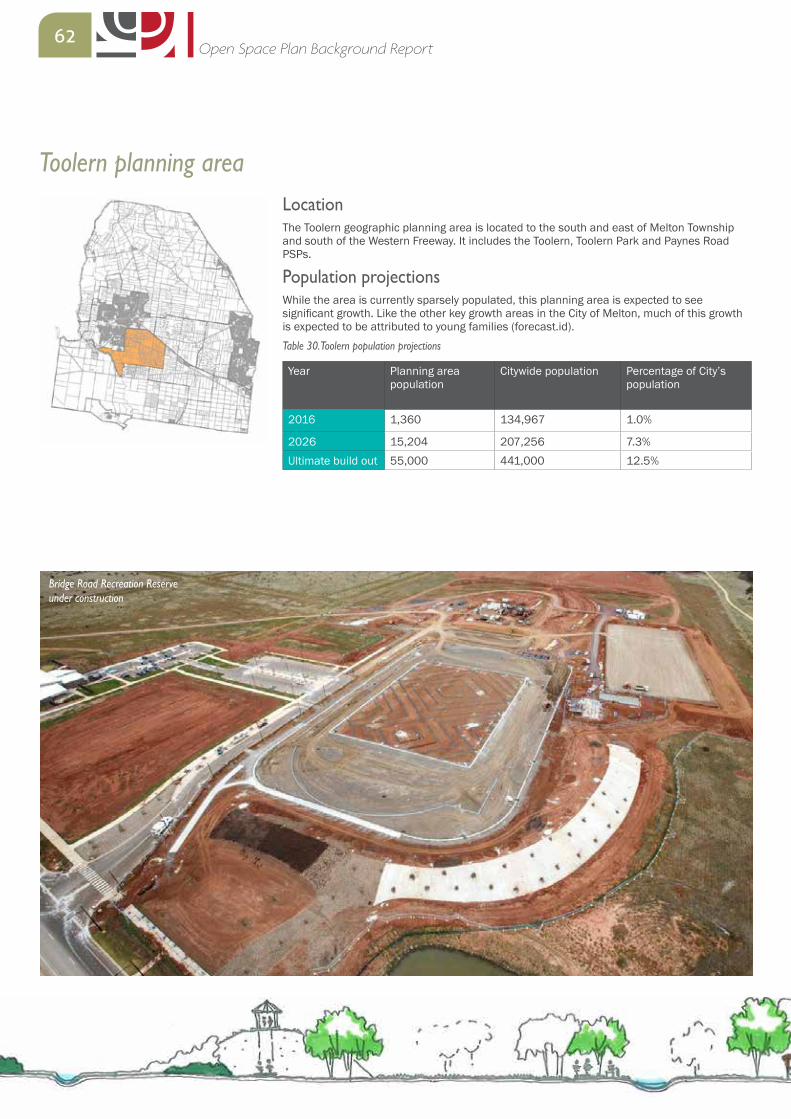
62Open Space Plan Background Report
Toolern planning areaLocationThe Toolern geographic planning area is located to the south and east of Melton Township and south of the Western Freeway. It includes the Toolern, Toolern Park and Paynes Road PSPs.
Population projectionsWhile the area is currently sparsely populated, this planning area is expected to see significant growth. Like the other key growth areas in the City of Melton, much of this growth is expected to be attributed to young families (forecast.id).
Year Planning area population
Citywide population Percentage of City’s population
2016 1,360 134,967 1.0%
2026 15,204 207,256 7.3%Ultimate build out 55,000 441,000 12.5%
Table 30. Toolern population projections
Bridge Road Recreation Reserve under construction
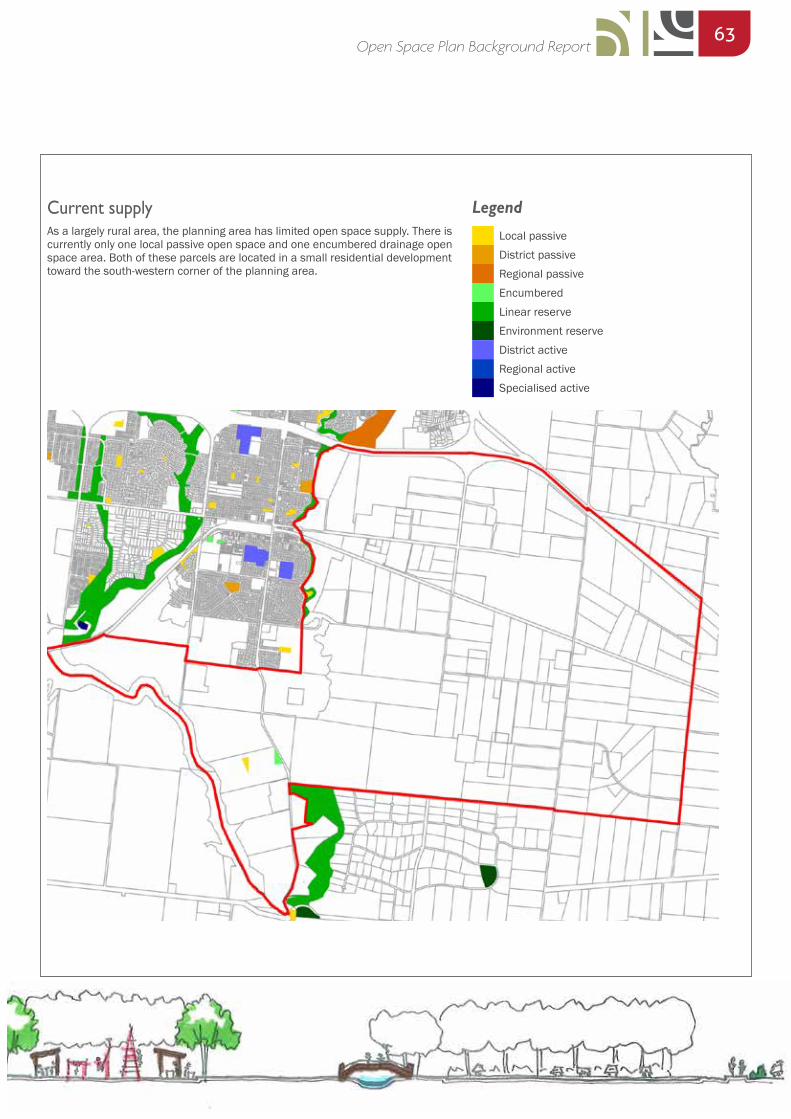
63Open Space Plan Background Report
Current supplyAs a largely rural area, the planning area has limited open space supply. There is currently only one local passive open space and one encumbered drainage open space area. Both of these parcels are located in a small residential development toward the south-western corner of the planning area.
LegendLocal passiveDistrict passiveRegional passiveEncumberedLinear reserveEnvironment reserveDistrict activeRegional activeSpecialised active
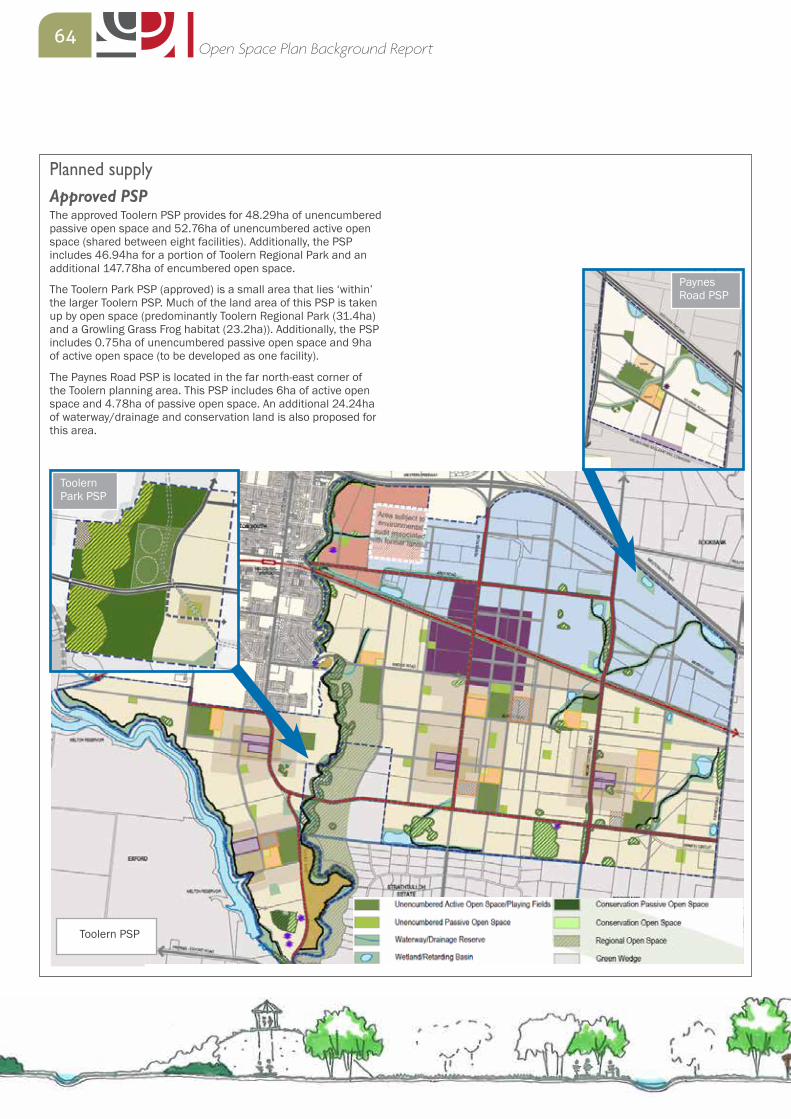
64Open Space Plan Background Report
Planned supply Approved PSPThe approved Toolern PSP provides for 48.29ha of unencumbered passive open space and 52.76ha of unencumbered active open space (shared between eight facilities). Additionally, the PSP includes 46.94ha for a portion of Toolern Regional Park and an additional 147.78ha of encumbered open space.
The Toolern Park PSP (approved) is a small area that lies ‘within’ the larger Toolern PSP. Much of the land area of this PSP is taken up by open space (predominantly Toolern Regional Park (31.4ha) and a Growling Grass Frog habitat (23.2ha)). Additionally, the PSP includes 0.75ha of unencumbered passive open space and 9ha of active open space (to be developed as one facility).
The Paynes Road PSP is located in the far north-east corner of the Toolern planning area. This PSP includes 6ha of active open space and 4.78ha of passive open space. An additional 24.24ha of waterway/drainage and conservation land is also proposed for this area.
Toolern PSP
Toolern Park PSP
Paynes Road PSP
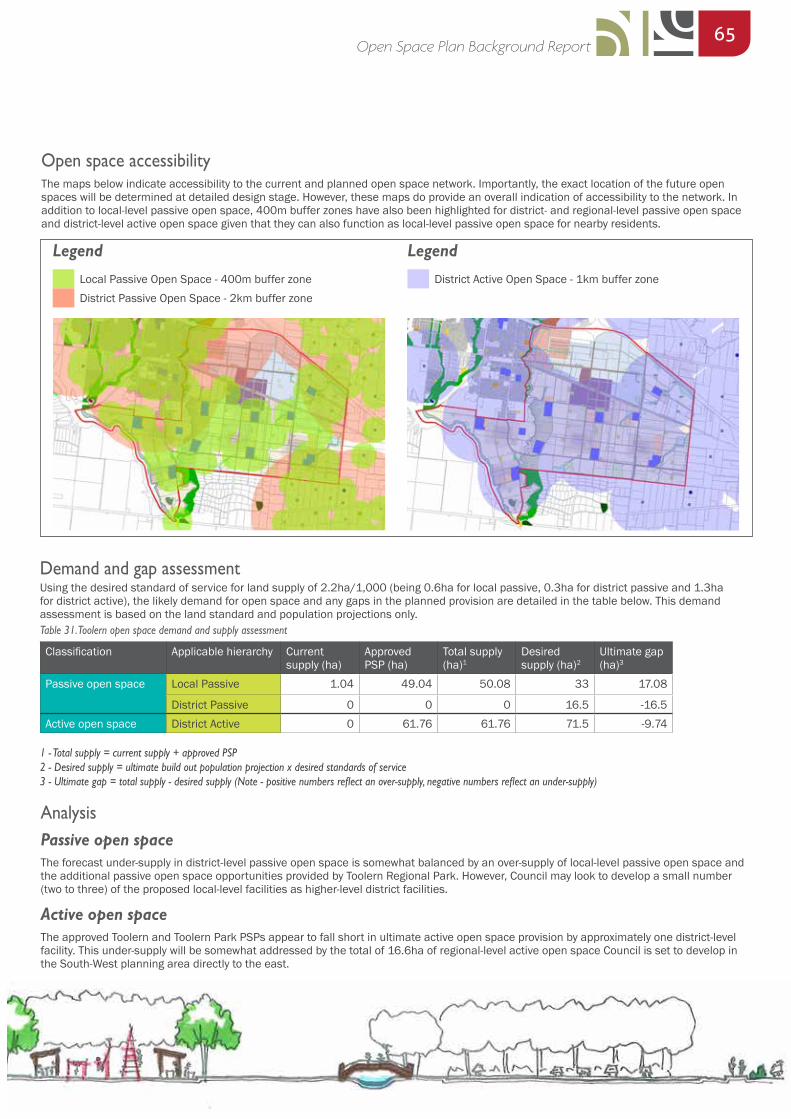
65Open Space Plan Background Report
AnalysisPassive open spaceThe forecast under-supply in district-level passive open space is somewhat balanced by an over-supply of local-level passive open space and the additional passive open space opportunities provided by Toolern Regional Park. However, Council may look to develop a small number (two to three) of the proposed local-level facilities as higher-level district facilities.
Active open spaceThe approved Toolern and Toolern Park PSPs appear to fall short in ultimate active open space provision by approximately one district-level facility. This under-supply will be somewhat addressed by the total of 16.6ha of regional-level active open space Council is set to develop in the South-West planning area directly to the east.
Demand and gap assessmentUsing the desired standard of service for land supply of 2.2ha/1,000 (being 0.6ha for local passive, 0.3ha for district passive and 1.3ha for district active), the likely demand for open space and any gaps in the planned provision are detailed in the table below. This demand assessment is based on the land standard and population projections only.
Classification Applicable hierarchy Current supply (ha)
Approved PSP (ha)
Total supply (ha)1
Desired supply (ha)2
Ultimate gap (ha)3
Passive open space Local Passive 1.04 49.04 50.08 33 17.08
District Passive 0 0 0 16.5 -16.5Active open space District Active 0 61.76 61.76 71.5 -9.74
1 - Total supply = current supply + approved PSP 2 - Desired supply = ultimate build out population projection x desired standards of service3 - Ultimate gap = total supply - desired supply (Note - positive numbers reflect an over-supply, negative numbers reflect an under-supply)
Table 31. Toolern open space demand and supply assessment
Open space accessibilityThe maps below indicate accessibility to the current and planned open space network. Importantly, the exact location of the future open spaces will be determined at detailed design stage. However, these maps do provide an overall indication of accessibility to the network. In addition to local-level passive open space, 400m buffer zones have also been highlighted for district- and regional-level passive open space and district-level active open space given that they can also function as local-level passive open space for nearby residents.
LegendDistrict Active Open Space - 1km buffer zone
LegendLocal Passive Open Space - 400m buffer zoneDistrict Passive Open Space - 2km buffer zone
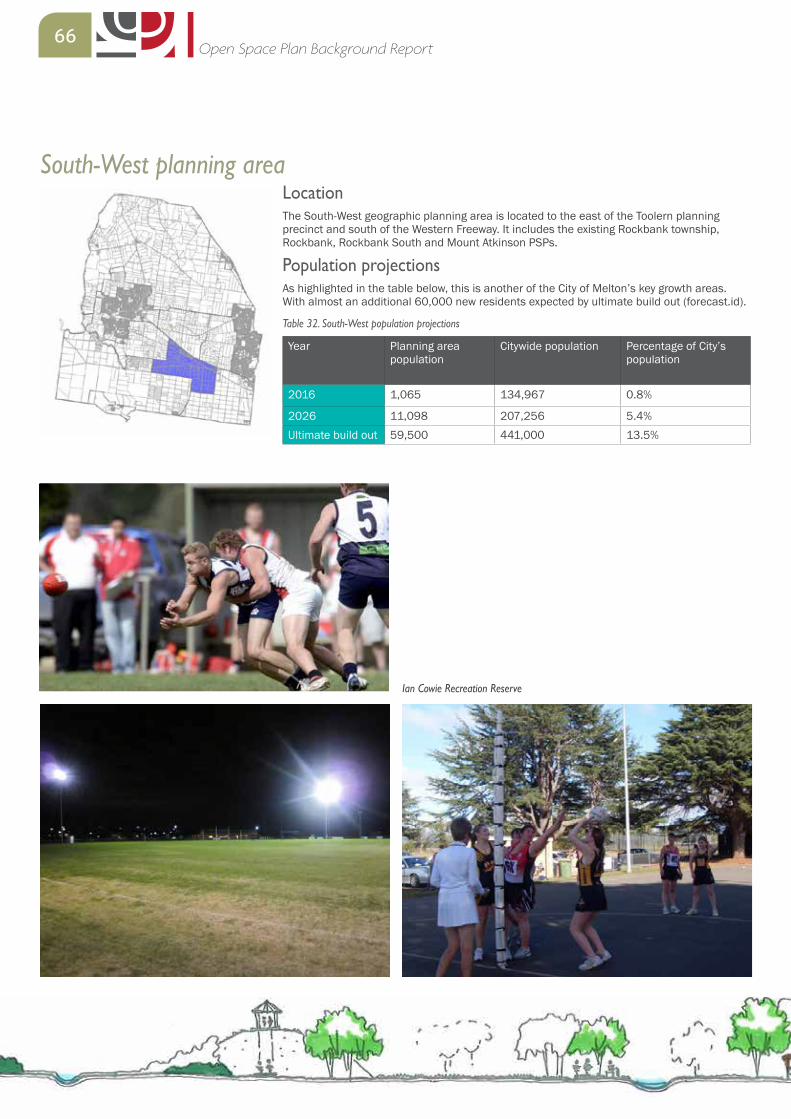
66Open Space Plan Background Report
South-West planning areaLocationThe South-West geographic planning area is located to the east of the Toolern planning precinct and south of the Western Freeway. It includes the existing Rockbank township, Rockbank, Rockbank South and Mount Atkinson PSPs.
Population projectionsAs highlighted in the table below, this is another of the City of Melton’s key growth areas. With almost an additional 60,000 new residents expected by ultimate build out (forecast.id).
Year Planning area population
Citywide population Percentage of City’s population
2016 1,065 134,967 0.8%
2026 11,098 207,256 5.4%Ultimate build out 59,500 441,000 13.5%
Table 32. South-West population projections
Ian Cowie Recreation Reserve
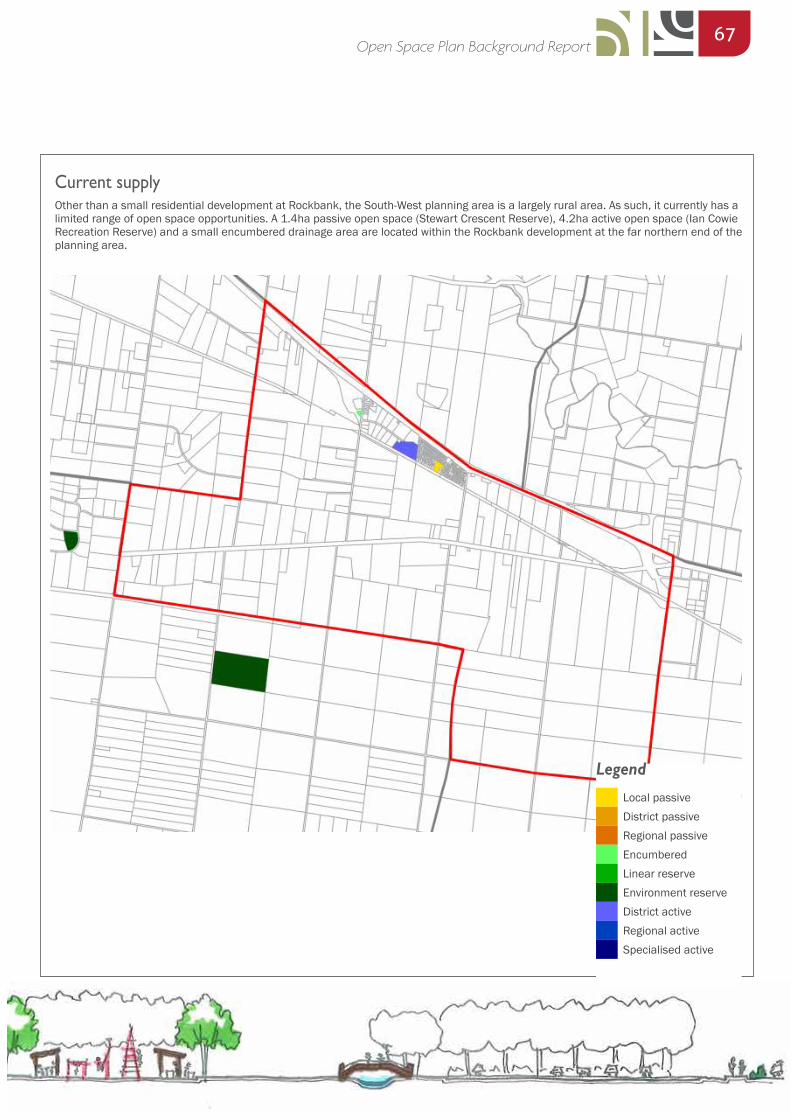
67Open Space Plan Background Report
Current supplyOther than a small residential development at Rockbank, the South-West planning area is a largely rural area. As such, it currently has a limited range of open space opportunities. A 1.4ha passive open space (Stewart Crescent Reserve), 4.2ha active open space (Ian Cowie Recreation Reserve) and a small encumbered drainage area are located within the Rockbank development at the far northern end of the planning area.
LegendLocal passiveDistrict passiveRegional passiveEncumberedLinear reserveEnvironment reserveDistrict activeRegional activeSpecialised active
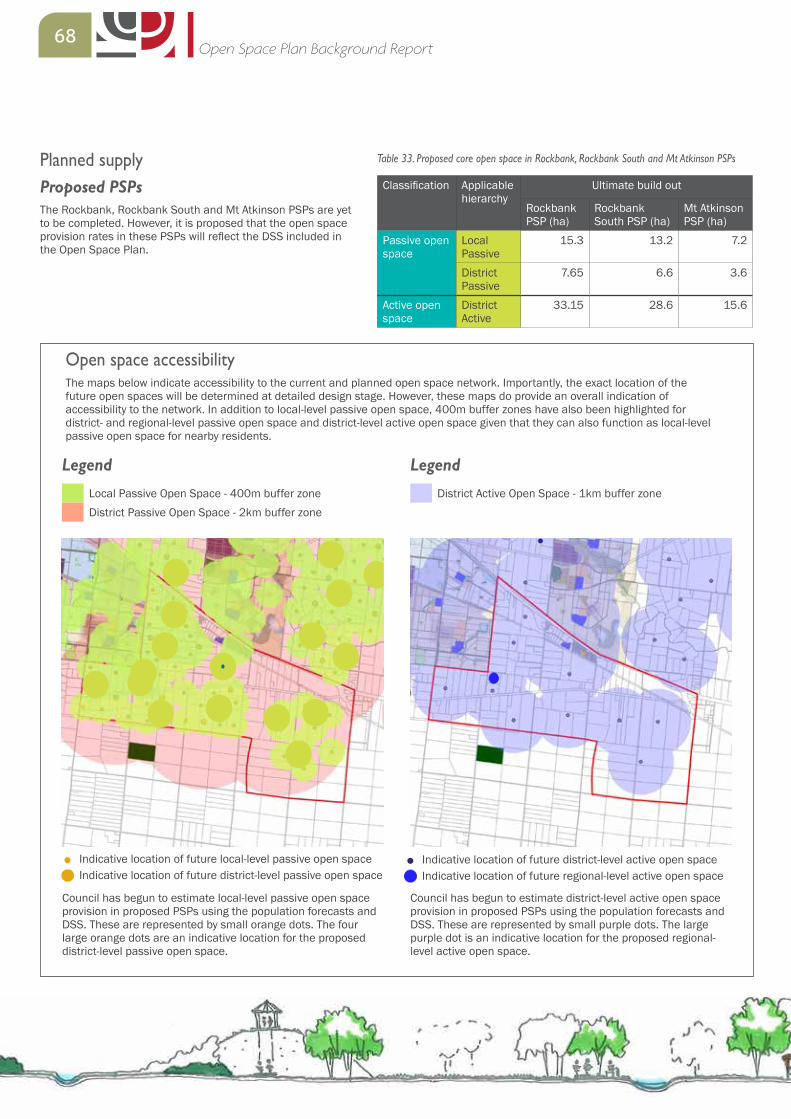
68Open Space Plan Background Report
Planned supply Proposed PSPsThe Rockbank, Rockbank South and Mt Atkinson PSPs are yet to be completed. However, it is proposed that the open space provision rates in these PSPs will reflect the DSS included in the Open Space Plan.
Classification Applicable hierarchy
Ultimate build out
Rockbank PSP (ha)
Rockbank South PSP (ha)
Mt Atkinson PSP (ha)
Passive open space
Local Passive
15.3 13.2 7.2
District Passive
7.65 6.6 3.6
Active open space
District Active
33.15 28.6 15.6
Table 33. Proposed core open space in Rockbank, Rockbank South and Mt Atkinson PSPs
Open space accessibilityThe maps below indicate accessibility to the current and planned open space network. Importantly, the exact location of the future open spaces will be determined at detailed design stage. However, these maps do provide an overall indication of accessibility to the network. In addition to local-level passive open space, 400m buffer zones have also been highlighted for district- and regional-level passive open space and district-level active open space given that they can also function as local-level passive open space for nearby residents.
LegendDistrict Active Open Space - 1km buffer zone
LegendLocal Passive Open Space - 400m buffer zoneDistrict Passive Open Space - 2km buffer zone
Council has begun to estimate district-level active open space provision in proposed PSPs using the population forecasts and DSS. These are represented by small purple dots. The large purple dot is an indicative location for the proposed regional-level active open space.
Council has begun to estimate local-level passive open space provision in proposed PSPs using the population forecasts and DSS. These are represented by small orange dots. The four large orange dots are an indicative location for the proposed district-level passive open space.
Indicative location of future local-level passive open space Indicative location of future district-level active open spaceIndicative location of future district-level passive open space Indicative location of future regional-level active open space
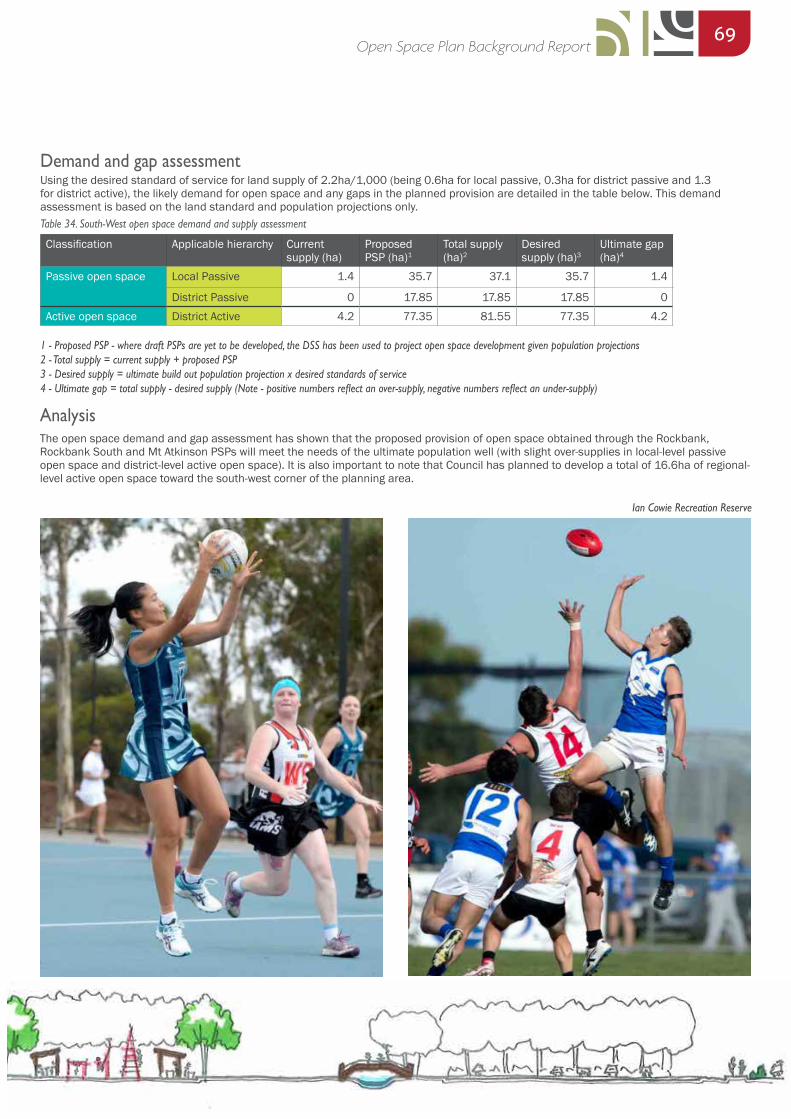
69Open Space Plan Background Report
AnalysisThe open space demand and gap assessment has shown that the proposed provision of open space obtained through the Rockbank, Rockbank South and Mt Atkinson PSPs will meet the needs of the ultimate population well (with slight over-supplies in local-level passive open space and district-level active open space). It is also important to note that Council has planned to develop a total of 16.6ha of regional-level active open space toward the south-west corner of the planning area.
Demand and gap assessmentUsing the desired standard of service for land supply of 2.2ha/1,000 (being 0.6ha for local passive, 0.3ha for district passive and 1.3 for district active), the likely demand for open space and any gaps in the planned provision are detailed in the table below. This demand assessment is based on the land standard and population projections only.
Classification Applicable hierarchy Current supply (ha)
Proposed PSP (ha)1
Total supply (ha)2
Desired supply (ha)3
Ultimate gap (ha)4
Passive open space Local Passive 1.4 35.7 37.1 35.7 1.4
District Passive 0 17.85 17.85 17.85 0Active open space District Active 4.2 77.35 81.55 77.35 4.2
1 - Proposed PSP - where draft PSPs are yet to be developed, the DSS has been used to project open space development given population projections2 - Total supply = current supply + proposed PSP 3 - Desired supply = ultimate build out population projection x desired standards of service4 - Ultimate gap = total supply - desired supply (Note - positive numbers reflect an over-supply, negative numbers reflect an under-supply)
Table 34. South-West open space demand and supply assessment
Ian Cowie Recreation Reserve

70Open Space Plan Background Report
South-East planning areaLocation and population projectionThe South-East geographic planning area is comprised of Tarneit Plains, Chartwell East, Derrimut Fields, Robinsons Road, Ravenhall and Warrawee PSPs (none of which are yet to be approved). This planning area is expected to be a key industrial precinct and a strong employment base. As a result, it has a negligible population now and into the planned future.
Current supply, planned supply, demand and gap assessmentAs an undeveloped rural and industrial area with very limited population, there is no current core open space provision in the South-East planning area (as identified in the adjoining map).
It should be recognised, however, that the planning area is predicted to have an employment base of approximately 35,000 at ultimate build out. In accord with Metropolitan Planning Authority guidelines, 2% of the net developable area will be provided as local-level passive open space. Location and quantity of these parcels will be determined once the net developable area of the employment PSPs has been calculated.
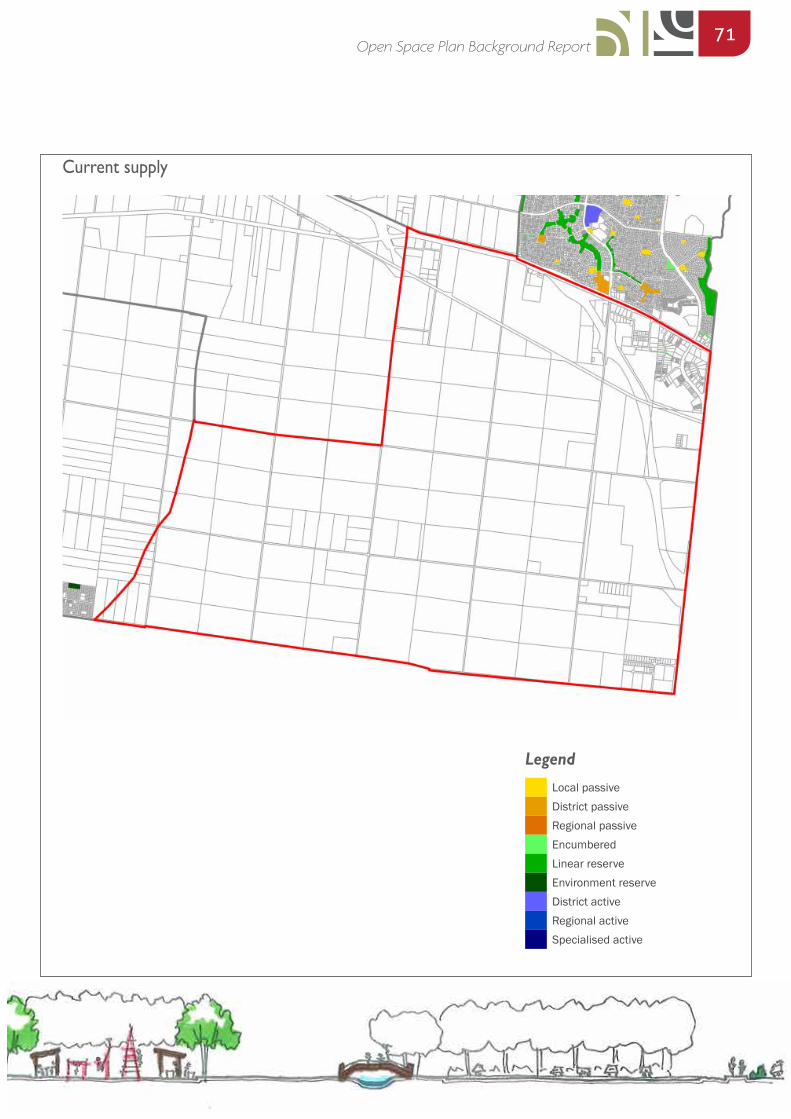
71Open Space Plan Background Report
Current supply
LegendLocal passiveDistrict passiveRegional passiveEncumberedLinear reserveEnvironment reserveDistrict activeRegional activeSpecialised active
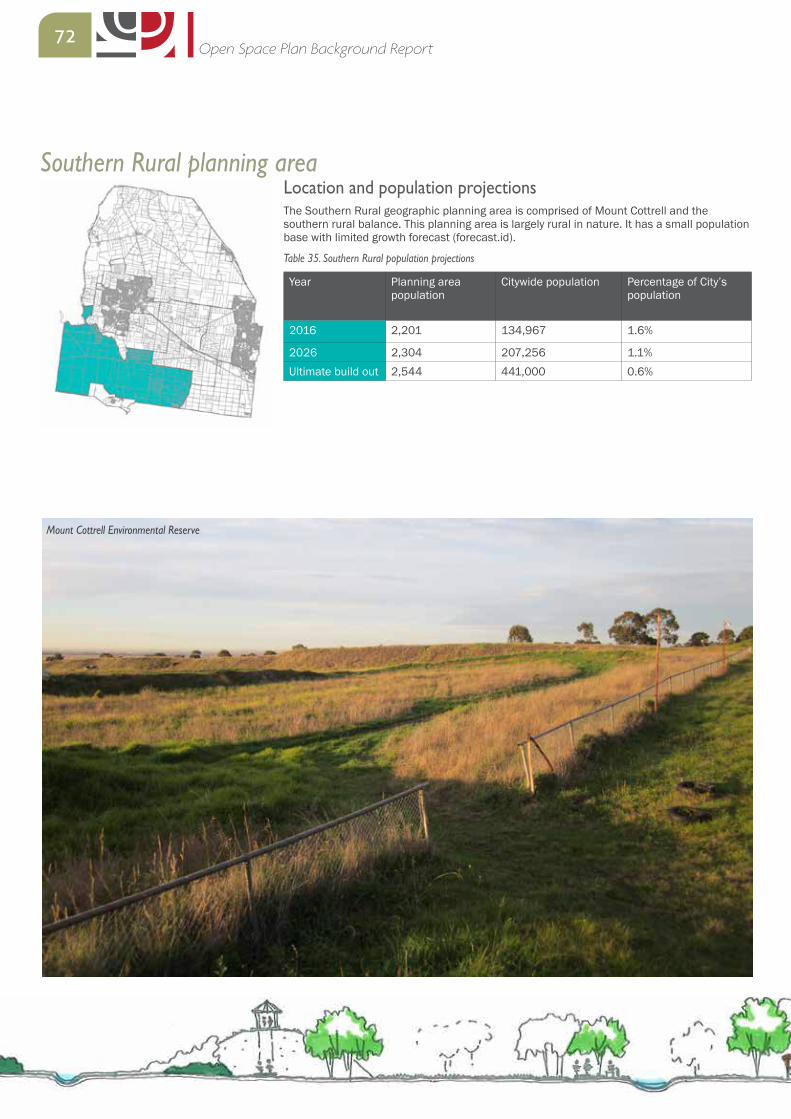
72Open Space Plan Background Report
Southern Rural planning areaLocation and population projectionsThe Southern Rural geographic planning area is comprised of Mount Cottrell and the southern rural balance. This planning area is largely rural in nature. It has a small population base with limited growth forecast (forecast.id).
Table 35. Southern Rural population projections
Year Planning area population
Citywide population Percentage of City’s population
2016 2,201 134,967 1.6%
2026 2,304 207,256 1.1%Ultimate build out 2,544 441,000 0.6%
Mount Cottrell Environmental Reserve
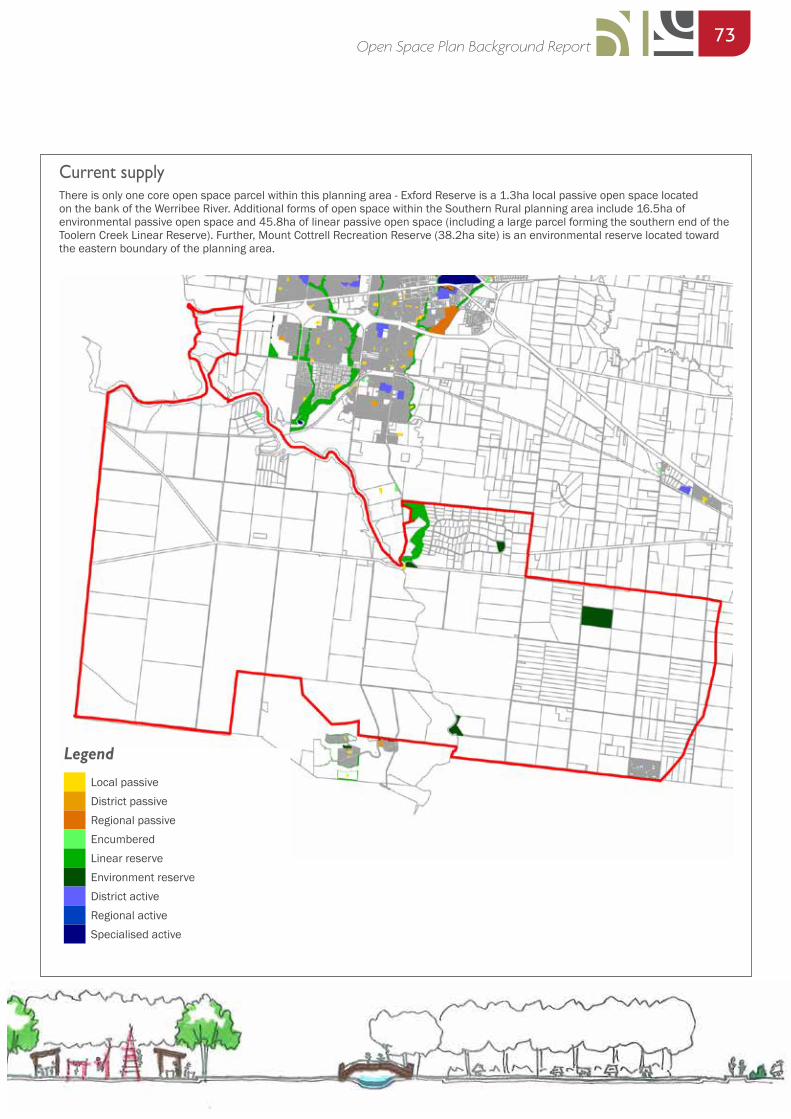
73Open Space Plan Background Report
Current supplyThere is only one core open space parcel within this planning area - Exford Reserve is a 1.3ha local passive open space located on the bank of the Werribee River. Additional forms of open space within the Southern Rural planning area include 16.5ha of environmental passive open space and 45.8ha of linear passive open space (including a large parcel forming the southern end of the Toolern Creek Linear Reserve). Further, Mount Cottrell Recreation Reserve (38.2ha site) is an environmental reserve located toward the eastern boundary of the planning area.
LegendLocal passiveDistrict passiveRegional passiveEncumberedLinear reserveEnvironment reserveDistrict activeRegional activeSpecialised active
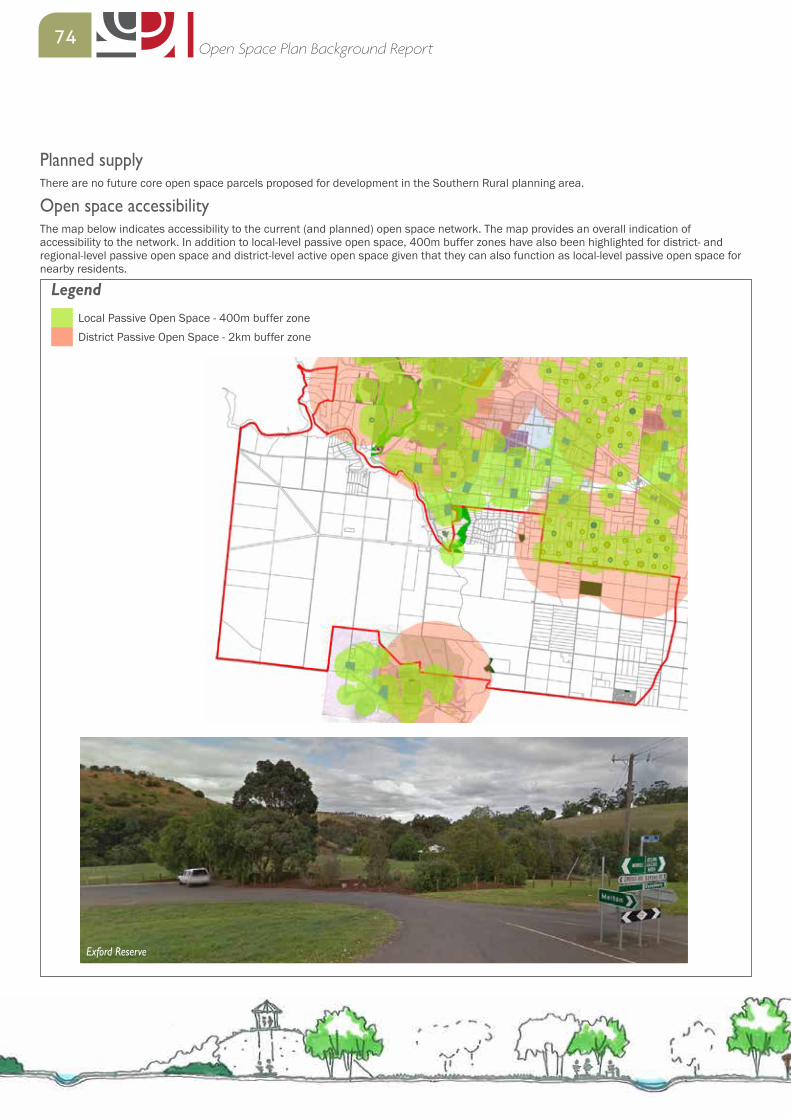
74Open Space Plan Background Report
Planned supplyThere are no future core open space parcels proposed for development in the Southern Rural planning area.
Open space accessibilityThe map below indicates accessibility to the current (and planned) open space network. The map provides an overall indication of accessibility to the network. In addition to local-level passive open space, 400m buffer zones have also been highlighted for district- and regional-level passive open space and district-level active open space given that they can also function as local-level passive open space for nearby residents.
LegendLocal Passive Open Space - 400m buffer zoneDistrict Passive Open Space - 2km buffer zone
Exford Reserve
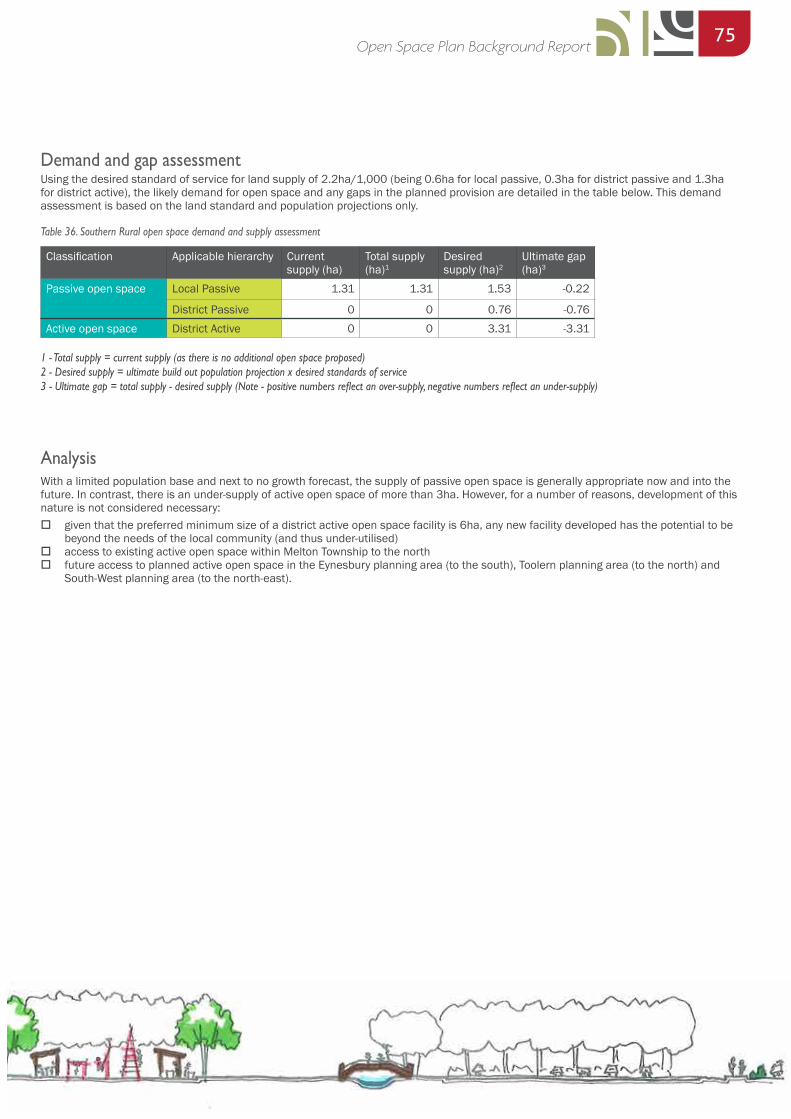
75Open Space Plan Background Report
AnalysisWith a limited population base and next to no growth forecast, the supply of passive open space is generally appropriate now and into the future. In contrast, there is an under-supply of active open space of more than 3ha. However, for a number of reasons, development of this nature is not considered necessary:
� given that the preferred minimum size of a district active open space facility is 6ha, any new facility developed has the potential to be beyond the needs of the local community (and thus under-utilised)
� access to existing active open space within Melton Township to the north � future access to planned active open space in the Eynesbury planning area (to the south), Toolern planning area (to the north) and
South-West planning area (to the north-east).
Demand and gap assessmentUsing the desired standard of service for land supply of 2.2ha/1,000 (being 0.6ha for local passive, 0.3ha for district passive and 1.3ha for district active), the likely demand for open space and any gaps in the planned provision are detailed in the table below. This demand assessment is based on the land standard and population projections only.
Classification Applicable hierarchy Current supply (ha)
Total supply (ha)1
Desired supply (ha)2
Ultimate gap (ha)3
Passive open space Local Passive 1.31 1.31 1.53 -0.22
District Passive 0 0 0.76 -0.76Active open space District Active 0 0 3.31 -3.31
1 - Total supply = current supply (as there is no additional open space proposed) 2 - Desired supply = ultimate build out population projection x desired standards of service3 - Ultimate gap = total supply - desired supply (Note - positive numbers reflect an over-supply, negative numbers reflect an under-supply)
Table 36. Southern Rural open space demand and supply assessment
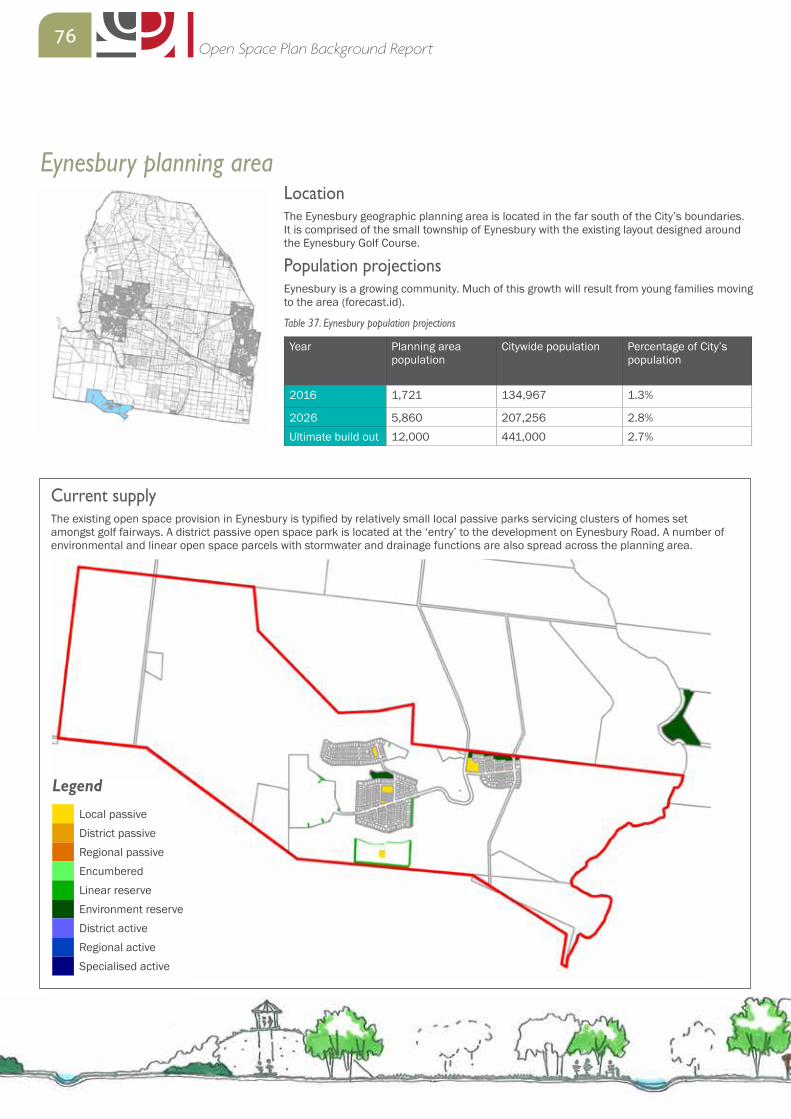
76Open Space Plan Background Report
Eynesbury planning areaLocationThe Eynesbury geographic planning area is located in the far south of the City’s boundaries. It is comprised of the small township of Eynesbury with the existing layout designed around the Eynesbury Golf Course.
Population projectionsEynesbury is a growing community. Much of this growth will result from young families moving to the area (forecast.id).
Year Planning area population
Citywide population Percentage of City’s population
2016 1,721 134,967 1.3%
2026 5,860 207,256 2.8%Ultimate build out 12,000 441,000 2.7%
Current supplyThe existing open space provision in Eynesbury is typified by relatively small local passive parks servicing clusters of homes set amongst golf fairways. A district passive open space park is located at the ‘entry’ to the development on Eynesbury Road. A number of environmental and linear open space parcels with stormwater and drainage functions are also spread across the planning area.
LegendLocal passiveDistrict passiveRegional passiveEncumberedLinear reserveEnvironment reserveDistrict activeRegional activeSpecialised active
Table 37. Eynesbury population projections
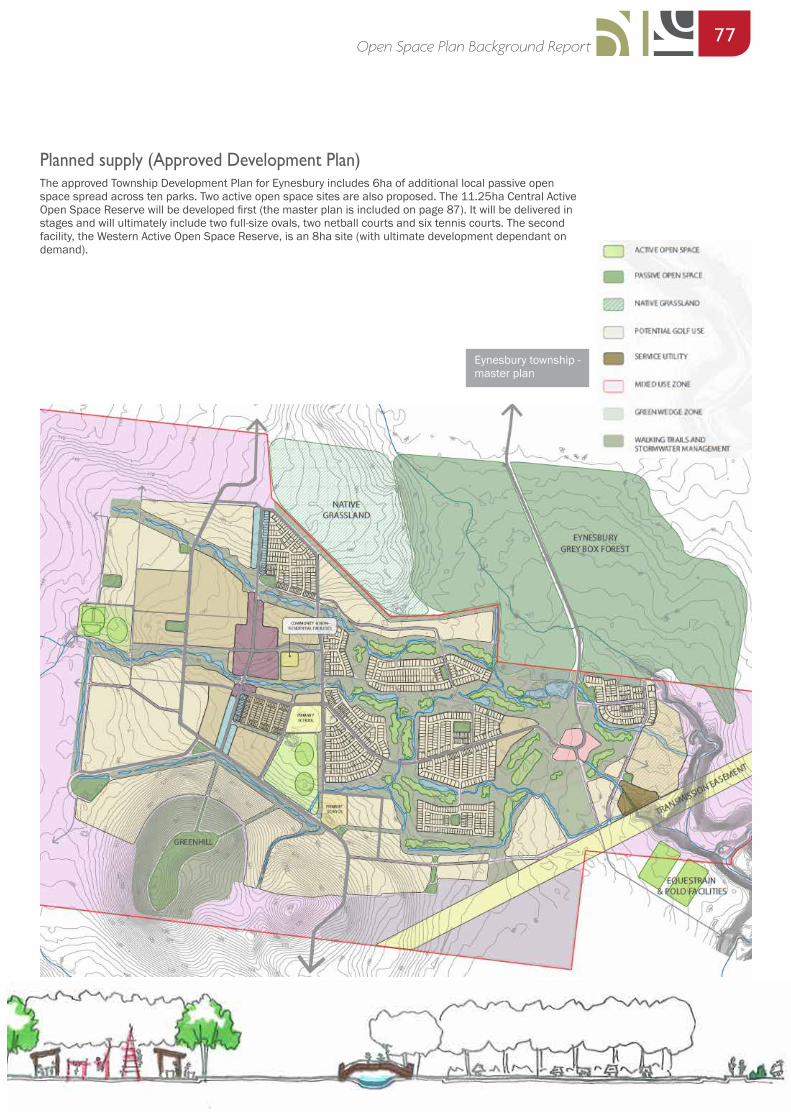
77Open Space Plan Background Report
Planned supply (Approved Development Plan)The approved Township Development Plan for Eynesbury includes 6ha of additional local passive open space spread across ten parks. Two active open space sites are also proposed. The 11.25ha Central Active Open Space Reserve will be developed first (the master plan is included on page 87). It will be delivered in stages and will ultimately include two full-size ovals, two netball courts and six tennis courts. The second facility, the Western Active Open Space Reserve, is an 8ha site (with ultimate development dependant on demand).
Eynesbury township - master plan
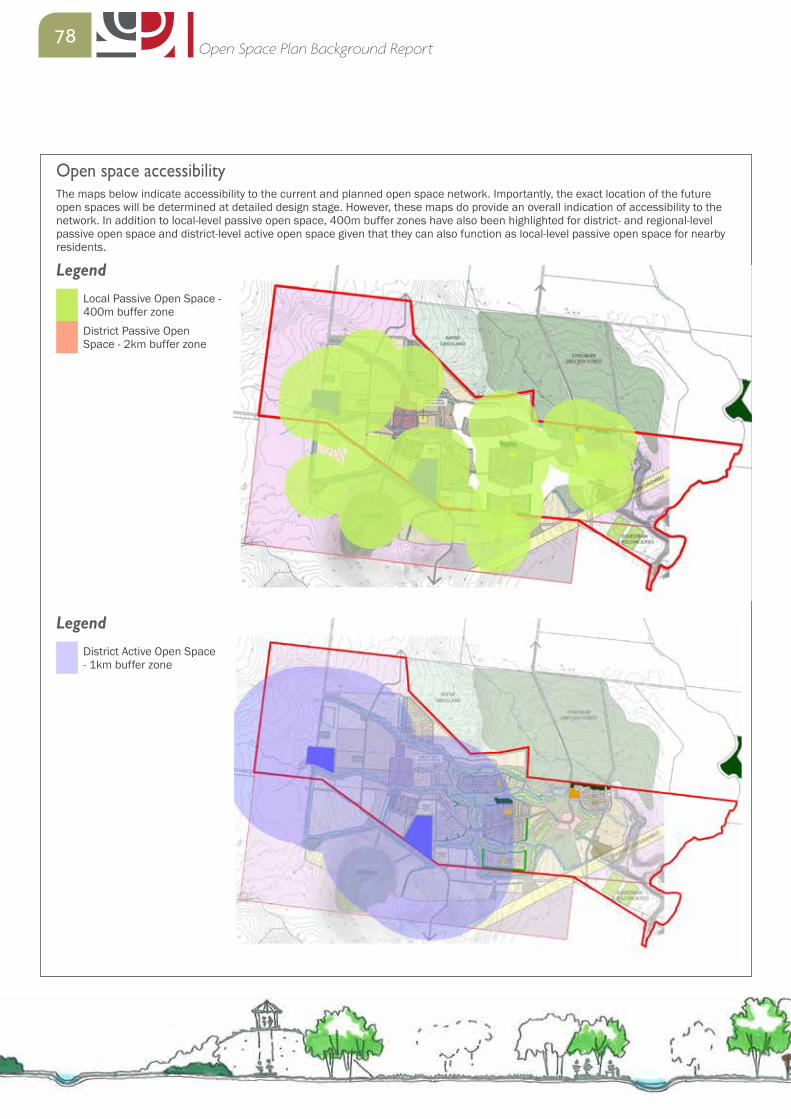
78Open Space Plan Background Report
Open space accessibilityThe maps below indicate accessibility to the current and planned open space network. Importantly, the exact location of the future open spaces will be determined at detailed design stage. However, these maps do provide an overall indication of accessibility to the network. In addition to local-level passive open space, 400m buffer zones have also been highlighted for district- and regional-level passive open space and district-level active open space given that they can also function as local-level passive open space for nearby residents.
LegendDistrict Active Open Space - 1km buffer zone
LegendLocal Passive Open Space - 400m buffer zoneDistrict Passive Open Space - 2km buffer zone
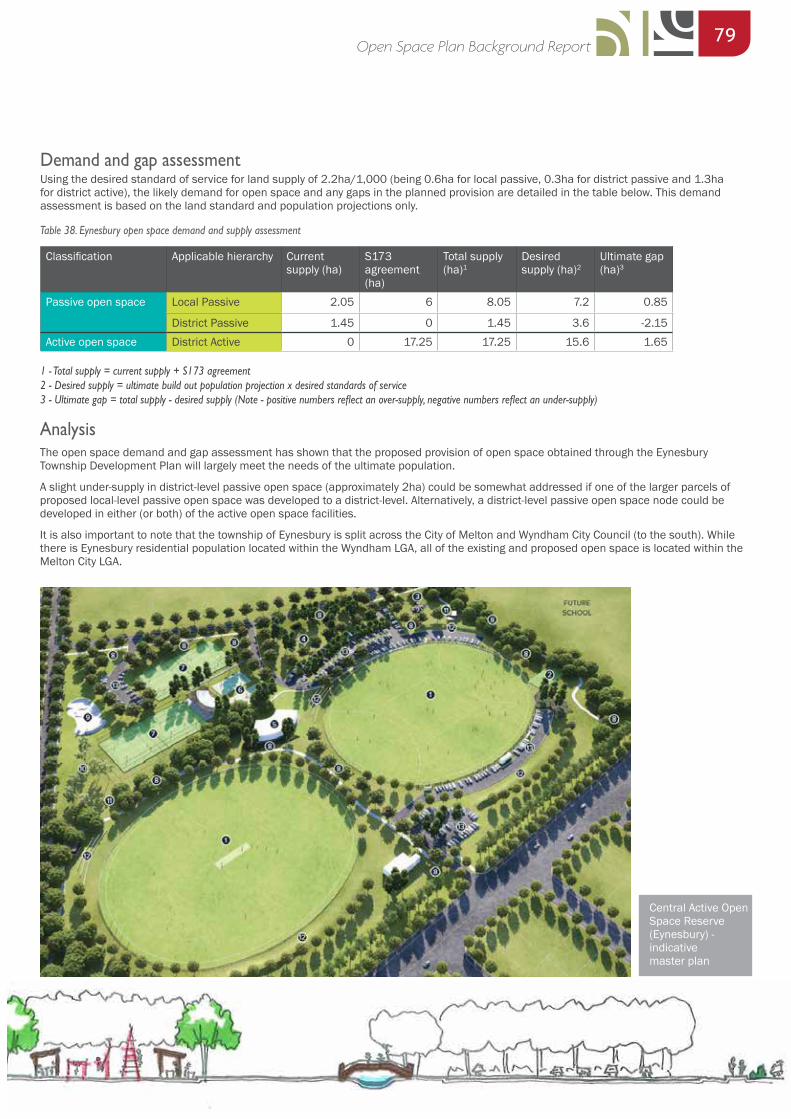
79Open Space Plan Background Report
Central Active Open Space Reserve (Eynesbury) - indicative master plan
AnalysisThe open space demand and gap assessment has shown that the proposed provision of open space obtained through the Eynesbury Township Development Plan will largely meet the needs of the ultimate population.
A slight under-supply in district-level passive open space (approximately 2ha) could be somewhat addressed if one of the larger parcels of proposed local-level passive open space was developed to a district-level. Alternatively, a district-level passive open space node could be developed in either (or both) of the active open space facilities.
It is also important to note that the township of Eynesbury is split across the City of Melton and Wyndham City Council (to the south). While there is Eynesbury residential population located within the Wyndham LGA, all of the existing and proposed open space is located within the Melton City LGA.
Demand and gap assessmentUsing the desired standard of service for land supply of 2.2ha/1,000 (being 0.6ha for local passive, 0.3ha for district passive and 1.3ha for district active), the likely demand for open space and any gaps in the planned provision are detailed in the table below. This demand assessment is based on the land standard and population projections only.
Classification Applicable hierarchy Current supply (ha)
S173 agreement (ha)
Total supply (ha)1
Desired supply (ha)2
Ultimate gap (ha)3
Passive open space Local Passive 2.05 6 8.05 7.2 0.85
District Passive 1.45 0 1.45 3.6 -2.15Active open space District Active 0 17.25 17.25 15.6 1.65
1 - Total supply = current supply + S173 agreement 2 - Desired supply = ultimate build out population projection x desired standards of service3 - Ultimate gap = total supply - desired supply (Note - positive numbers reflect an over-supply, negative numbers reflect an under-supply)
Table 38. Eynesbury open space demand and supply assessment
80Open Space Plan Background Report
5. Strategic directionsBroadening the scope of passive recreation opportunitiesThe Metropolitan Planning Authority does not include the development of district-level passive open space within its Precinct Structure Planning Guidelines. Comment is only provided on expected local-level facilities. In areas where significant residential growth will be framed by PSPs (like the City of Melton) this has the potential to limit the range of passive recreation pursuits that can be catered for across the passive open space network.
It is interesting to compare passive open space provision between an established community (such as Melton Township) with an area developing under PSP arrangements. The Melton Township planning area includes 11 district-level passive open spaces (total of 31.5ha) and the LGA’s only 3 regional-level passive open spaces (total of 42.5ha). In contrast, the approved Rockbank North PSP provides for a forecast population of more than 20,000 yet contains no district- nor regional-level passive open space. This provision has the potential to see a vast number of ‘duplication-style’ local parks and limited ‘destination’ parks developed across the network.
Council has shown clear foresight in proposing the development of both local- and district-level passive open space in future PSPs. This will ensure a wide range of passive recreation opportunities are available (including larger parks suitable for groups (e.g. family gatherings), parks with a variety of activity nodes and activities that are appealing to all age groups). Further, this approach will limit the inappropriate over-embellishment of local-level passive open space that appears to have occurred in a number of parks throughout the Eastern Corridor planning area (presumably in an attempt by developers to provide higher-level ‘feature’ parks).
As more detailed design is undertaken for the open space network within a planning precinct, Council should undertake a needs-based approach to facility provision to ensure open space function, open space characteristics and range of activities across the precinct are considered.
Ensuring flexibility in active open space provisionCouncil faces an exciting time in outdoor sports planning and provision. Almost 325ha of district-level active open space is planned between approved and proposed PSPs. An additional 51ha of regional-level active open space is also forecast for development. As a result, Council has the opportunity to plan for an innovative, sustainable network of outdoor sports facilities.
Council and the MPA currently have a preference of developing district-level active open spaces with either two ovals or three rectangular playing fields (6ha or 10ha options). This has resulted in a significant number of facilities being developed and ensured nearby access to sporting facilities for residents. However, it has also seen a somewhat cookie-cutter approach to sports provision with a number of facilities having the same inclusions and ‘feel’. As a result, Council’s recent active open space developments reflect a move toward a more flexible approach to facility planning with more multi-use facilities being constructed. For example, the fields developed at the Taylors Hill Recreation Reserve have been designed so that they allow opportunities for AFL and cricket (oval sports) and rectangular sports as overlays.
Excitingly, the development of three regional-level facilities will provide more flexibility in design and the range of sports provided for. Additionally, these facilities will place Council and local sporting associations in a much better position to bid for larger state-level sporting events (that often require multiple fields in one location).
Development triggers and timingWhile it would be ideal if the entire open space network within a planned community (PSP) could be developed in one stage, the reality is that development occurs in line with lot uptake triggers. While this approach may be appropriate for the development of passive open spaces, a more proactive approach should be undertaken for the development of active open space. It is important to understand the significant time required to develop quality sporting facilities. Timing issues associated with sporting organisation consultation, seeking grant funding, facility design and master planning, construction and establishment (for instance the time taken for new turf wicket blocks to become stabilised and available for play can be up to one year) can be beyond three years. If significant residential development is achieved in this time, residents will either be without suitable facilities and/or have created overuse and capacity issues for existing facilities.
Council will need to take a proactive approach to the development of district-level active open space. With a DSS of 1.3ha/1,000 for district-level active open space and a preferred facility design of between 6ha and 10ha, an appropriate trigger for the development of new facilities would be between 4,600 and 7,600 new residents. However, as noted above, given the time required to develop quality sports facilities, Council will be required to monitor residential growth and project growth forward (up to three years) to ascertain likely timing of commencement of sports facility planning and development.
81Open Space Plan Background Report
AppendicesAppendix 1 - State sporting organisation planning considerations Appendix 2 - Desired sport provision standards Appendix 3 - Desired facility provision standards Appendix 4 - Desired pavilion provision standards
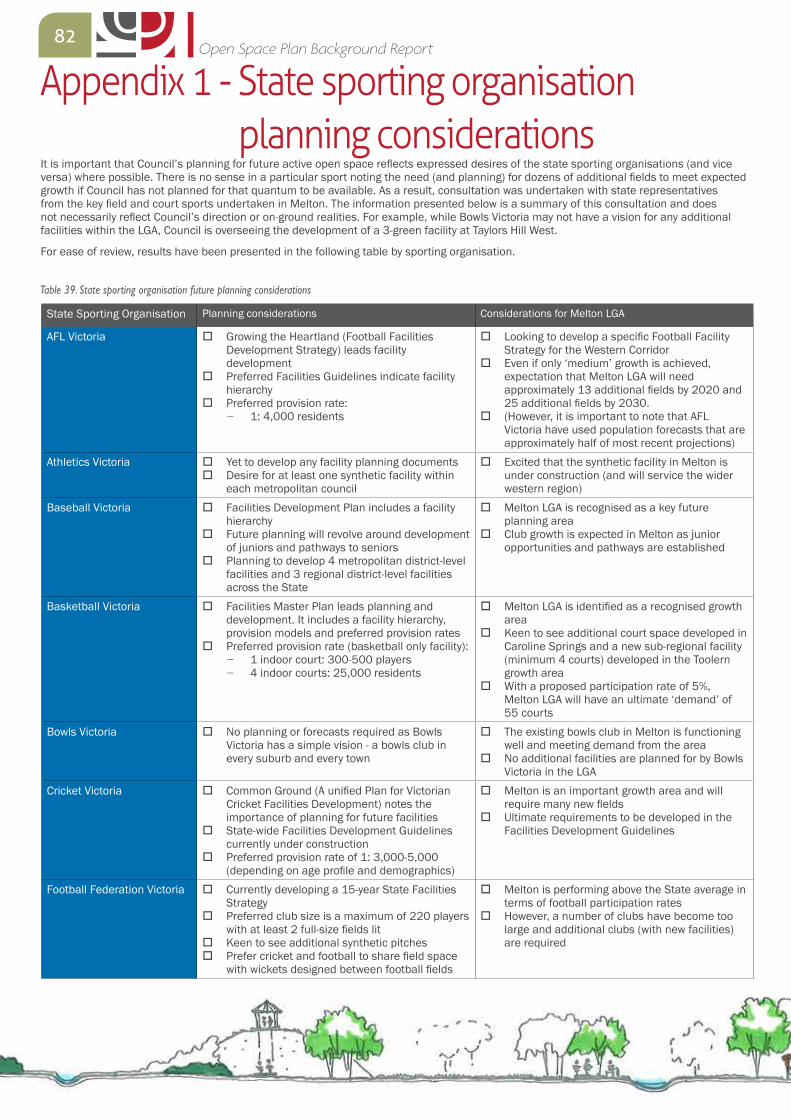
82Open Space Plan Background Report
It is important that Council’s planning for future active open space reflects expressed desires of the state sporting organisations (and vice versa) where possible. There is no sense in a particular sport noting the need (and planning) for dozens of additional fields to meet expected growth if Council has not planned for that quantum to be available. As a result, consultation was undertaken with state representatives from the key field and court sports undertaken in Melton. The information presented below is a summary of this consultation and does not necessarily reflect Council’s direction or on-ground realities. For example, while Bowls Victoria may not have a vision for any additional facilities within the LGA, Council is overseeing the development of a 3-green facility at Taylors Hill West.
For ease of review, results have been presented in the following table by sporting organisation.
State Sporting Organisation Planning considerations Considerations for Melton LGA
AFL Victoria � Growing the Heartland (Football Facilities Development Strategy) leads facility development
� Preferred Facilities Guidelines indicate facility hierarchy
� Preferred provision rate: − 1: 4,000 residents
� Looking to develop a specific Football Facility Strategy for the Western Corridor
� Even if only ‘medium’ growth is achieved, expectation that Melton LGA will need approximately 13 additional fields by 2020 and 25 additional fields by 2030.
� (However, it is important to note that AFL Victoria have used population forecasts that are approximately half of most recent projections)
Athletics Victoria � Yet to develop any facility planning documents � Desire for at least one synthetic facility within
each metropolitan council
� Excited that the synthetic facility in Melton is under construction (and will service the wider western region)
Baseball Victoria � Facilities Development Plan includes a facility hierarchy
� Future planning will revolve around development of juniors and pathways to seniors
� Planning to develop 4 metropolitan district-level facilities and 3 regional district-level facilities across the State
� Melton LGA is recognised as a key future planning area
� Club growth is expected in Melton as junior opportunities and pathways are established
Basketball Victoria � Facilities Master Plan leads planning and development. It includes a facility hierarchy, provision models and preferred provision rates
� Preferred provision rate (basketball only facility): − 1 indoor court: 300-500 players − 4 indoor courts: 25,000 residents
� Melton LGA is identified as a recognised growth area
� Keen to see additional court space developed in Caroline Springs and a new sub-regional facility (minimum 4 courts) developed in the Toolern growth area
� With a proposed participation rate of 5%, Melton LGA will have an ultimate ‘demand’ of 55 courts
Bowls Victoria � No planning or forecasts required as Bowls Victoria has a simple vision - a bowls club in every suburb and every town
� The existing bowls club in Melton is functioning well and meeting demand from the area
� No additional facilities are planned for by Bowls Victoria in the LGA
Cricket Victoria � Common Ground (A unified Plan for Victorian Cricket Facilities Development) notes the importance of planning for future facilities
� State-wide Facilities Development Guidelines currently under construction
� Preferred provision rate of 1: 3,000-5,000 (depending on age profile and demographics)
� Melton is an important growth area and will require many new fields
� Ultimate requirements to be developed in the Facilities Development Guidelines
Football Federation Victoria � Currently developing a 15-year State Facilities Strategy
� Preferred club size is a maximum of 220 players with at least 2 full-size fields lit
� Keen to see additional synthetic pitches � Prefer cricket and football to share field space
with wickets designed between football fields
� Melton is performing above the State average in terms of football participation rates
� However, a number of clubs have become too large and additional clubs (with new facilities) are required
Table 39. State sporting organisation future planning considerations
Appendix 1 - State sporting organisation planning considerations
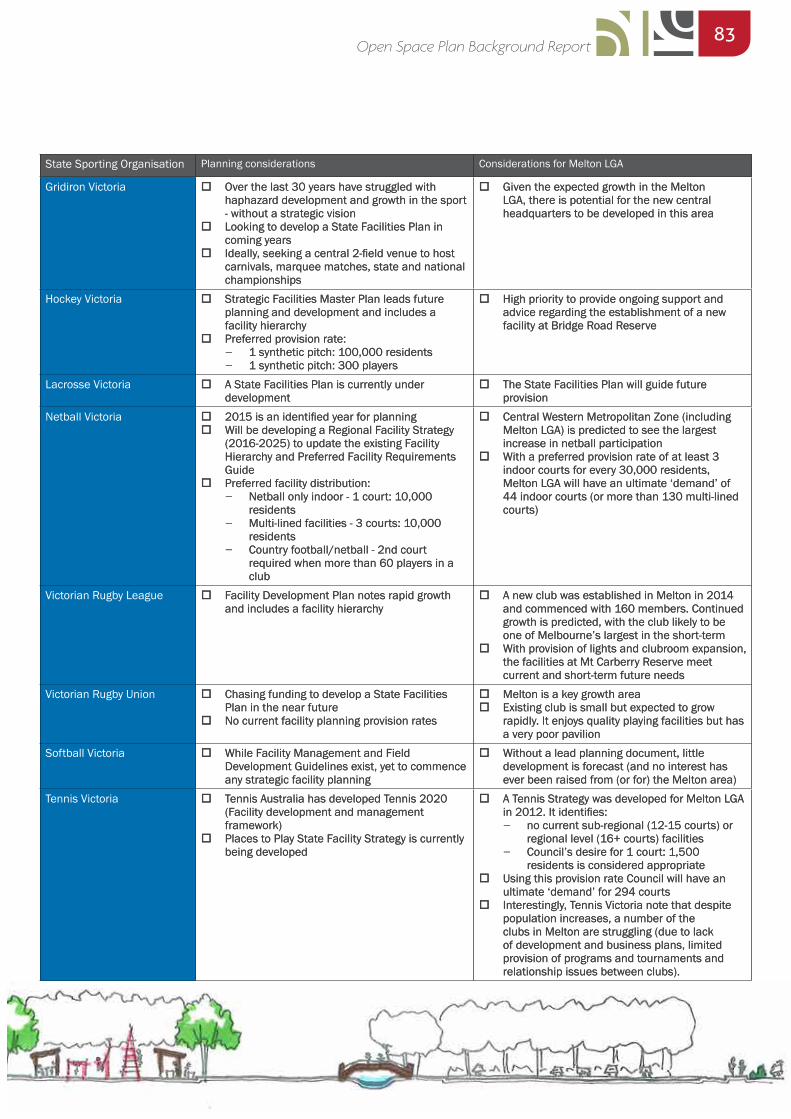
83Open Space Plan Background Report
State Sporting Organisation Planning considerations Considerations for Melton LGA
Gridiron Victoria � Over the last 30 years have struggled with haphazard development and growth in the sport - without a strategic vision
� Looking to develop a State Facilities Plan in coming years
� Ideally, seeking a central 2-field venue to host carnivals, marquee matches, state and national championships
� Given the expected growth in the Melton LGA, there is potential for the new central headquarters to be developed in this area
Hockey Victoria � Strategic Facilities Master Plan leads future planning and development and includes a facility hierarchy
� Preferred provision rate: − 1 synthetic pitch: 100,000 residents − 1 synthetic pitch: 300 players
� High priority to provide ongoing support and advice regarding the establishment of a new facility at Bridge Road Reserve
Lacrosse Victoria � A State Facilities Plan is currently under development
� The State Facilities Plan will guide future provision
Netball Victoria � 2015 is an identified year for planning � Will be developing a Regional Facility Strategy
(2016-2025) to update the existing Facility Hierarchy and Preferred Facility Requirements Guide
� Preferred facility distribution: − Netball only indoor - 1 court: 10,000
residents − Multi-lined facilities - 3 courts: 10,000
residents − Country football/netball - 2nd court
required when more than 60 players in a club
� Central Western Metropolitan Zone (including Melton LGA) is predicted to see the largest increase in netball participation
� With a preferred provision rate of at least 3 indoor courts for every 30,000 residents, Melton LGA will have an ultimate ‘demand’ of 44 indoor courts (or more than 130 multi-lined courts)
Victorian Rugby League � Facility Development Plan notes rapid growth and includes a facility hierarchy
� A new club was established in Melton in 2014 and commenced with 160 members. Continued growth is predicted, with the club likely to be one of Melbourne’s largest in the short-term
� With provision of lights and clubroom expansion, the facilities at Mt Carberry Reserve meet current and short-term future needs
Victorian Rugby Union � Chasing funding to develop a State Facilities Plan in the near future
� No current facility planning provision rates
� Melton is a key growth area � Existing club is small but expected to grow
rapidly. It enjoys quality playing facilities but has a very poor pavilion
Softball Victoria � While Facility Management and Field Development Guidelines exist, yet to commence any strategic facility planning
� Without a lead planning document, little development is forecast (and no interest has ever been raised from (or for) the Melton area)
Tennis Victoria � Tennis Australia has developed Tennis 2020 (Facility development and management framework)
� Places to Play State Facility Strategy is currently being developed
� A Tennis Strategy was developed for Melton LGA in 2012. It identifies:
− no current sub-regional (12-15 courts) or regional level (16+ courts) facilities
− Council’s desire for 1 court: 1,500 residents is considered appropriate
� Using this provision rate Council will have an ultimate ‘demand’ for 294 courts
� Interestingly, Tennis Victoria note that despite population increases, a number of the clubs in Melton are struggling (due to lack of development and business plans, limited provision of programs and tournaments and relationship issues between clubs).
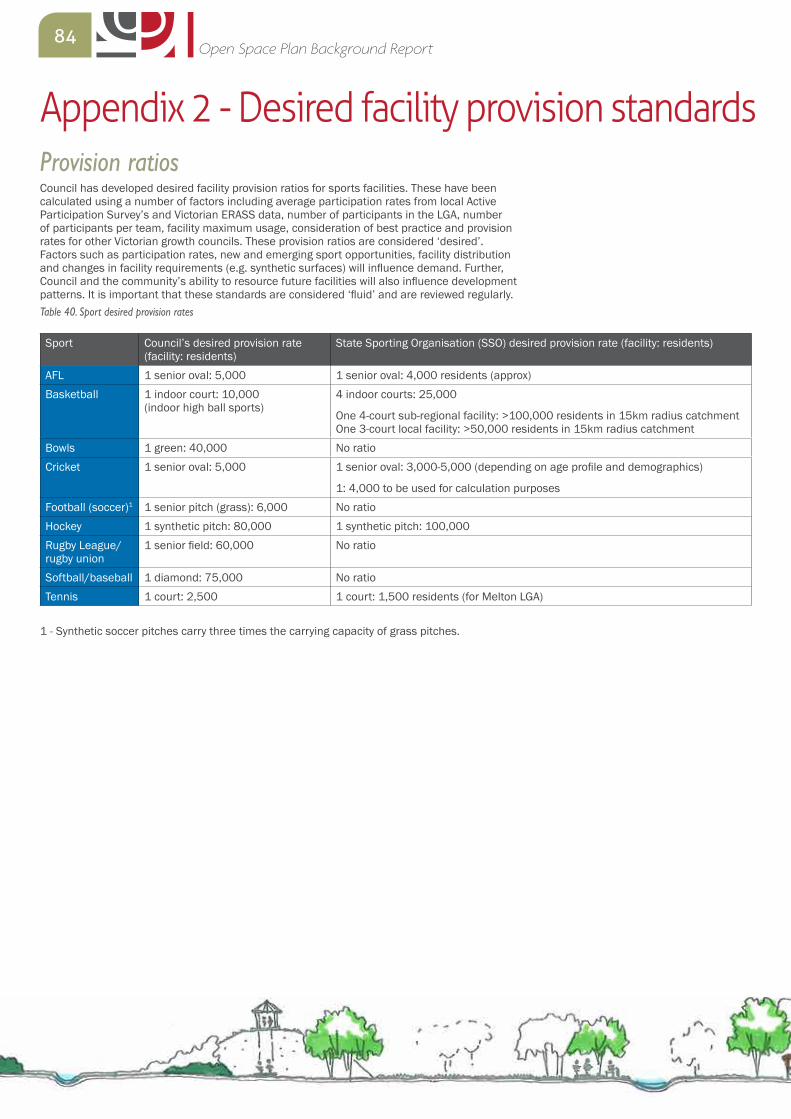
84Open Space Plan Background Report
Appendix 2 - Desired facility provision standardsProvision ratiosCouncil has developed desired facility provision ratios for sports facilities. These have been calculated using a number of factors including average participation rates from local Active Participation Survey’s and Victorian ERASS data, number of participants in the LGA, number of participants per team, facility maximum usage, consideration of best practice and provision rates for other Victorian growth councils. These provision ratios are considered ‘desired’. Factors such as participation rates, new and emerging sport opportunities, facility distribution and changes in facility requirements (e.g. synthetic surfaces) will influence demand. Further, Council and the community’s ability to resource future facilities will also influence development patterns. It is important that these standards are considered ‘fluid’ and are reviewed regularly.
Sport Council’s desired provision rate (facility: residents)
State Sporting Organisation (SSO) desired provision rate (facility: residents)
AFL 1 senior oval: 5,000 1 senior oval: 4,000 residents (approx)Basketball 1 indoor court: 10,000
(indoor high ball sports)4 indoor courts: 25,000
One 4-court sub-regional facility: >100,000 residents in 15km radius catchment One 3-court local facility: >50,000 residents in 15km radius catchment
Bowls 1 green: 40,000 No ratioCricket 1 senior oval: 5,000 1 senior oval: 3,000-5,000 (depending on age profile and demographics)
1: 4,000 to be used for calculation purposesFootball (soccer)1 1 senior pitch (grass): 6,000 No ratioHockey 1 synthetic pitch: 80,000 1 synthetic pitch: 100,000Rugby League/rugby union
1 senior field: 60,000 No ratio
Softball/baseball 1 diamond: 75,000 No ratioTennis 1 court: 2,500 1 court: 1,500 residents (for Melton LGA)
Table 40. Sport desired provision rates
1 - Synthetic soccer pitches carry three times the carrying capacity of grass pitches.
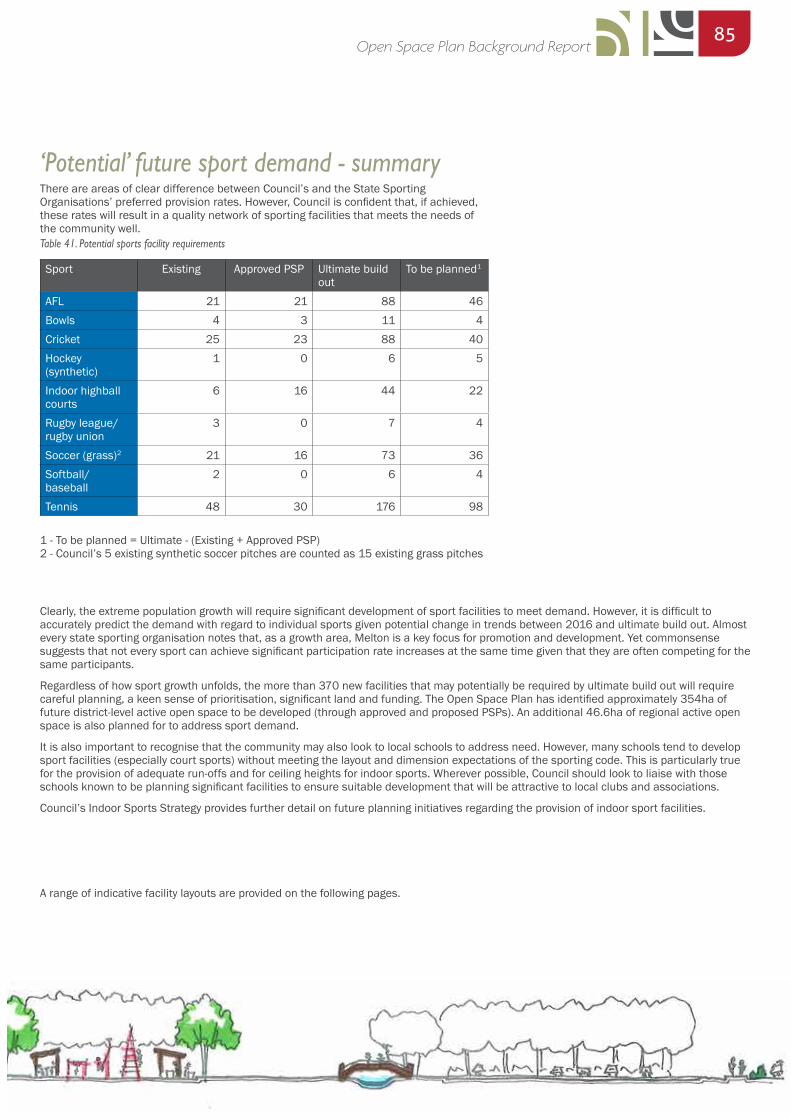
85Open Space Plan Background Report
‘Potential’ future sport demand - summaryThere are areas of clear difference between Council’s and the State Sporting Organisations’ preferred provision rates. However, Council is confident that, if achieved, these rates will result in a quality network of sporting facilities that meets the needs of the community well.
Sport Existing Approved PSP Ultimate build
outTo be planned1
AFL 21 21 88 46Bowls 4 3 11 4Cricket 25 23 88 40Hockey (synthetic)
1 0 6 5
Indoor highball courts
6 16 44 22
Rugby league/ rugby union
3 0 7 4
Soccer (grass)2 21 16 73 36Softball/baseball
2 0 6 4
Tennis 48 30 176 98
Table 41. Potential sports facility requirements
1 - To be planned = Ultimate - (Existing + Approved PSP) 2 - Council’s 5 existing synthetic soccer pitches are counted as 15 existing grass pitches
Clearly, the extreme population growth will require significant development of sport facilities to meet demand. However, it is difficult to accurately predict the demand with regard to individual sports given potential change in trends between 2016 and ultimate build out. Almost every state sporting organisation notes that, as a growth area, Melton is a key focus for promotion and development. Yet commonsense suggests that not every sport can achieve significant participation rate increases at the same time given that they are often competing for the same participants.
Regardless of how sport growth unfolds, the more than 370 new facilities that may potentially be required by ultimate build out will require careful planning, a keen sense of prioritisation, significant land and funding. The Open Space Plan has identified approximately 354ha of future district-level active open space to be developed (through approved and proposed PSPs). An additional 46.6ha of regional active open space is also planned for to address sport demand.
It is also important to recognise that the community may also look to local schools to address need. However, many schools tend to develop sport facilities (especially court sports) without meeting the layout and dimension expectations of the sporting code. This is particularly true for the provision of adequate run-offs and for ceiling heights for indoor sports. Wherever possible, Council should look to liaise with those schools known to be planning significant facilities to ensure suitable development that will be attractive to local clubs and associations.
Council’s Indoor Sports Strategy provides further detail on future planning initiatives regarding the provision of indoor sport facilities.
A range of indicative facility layouts are provided on the following pages.
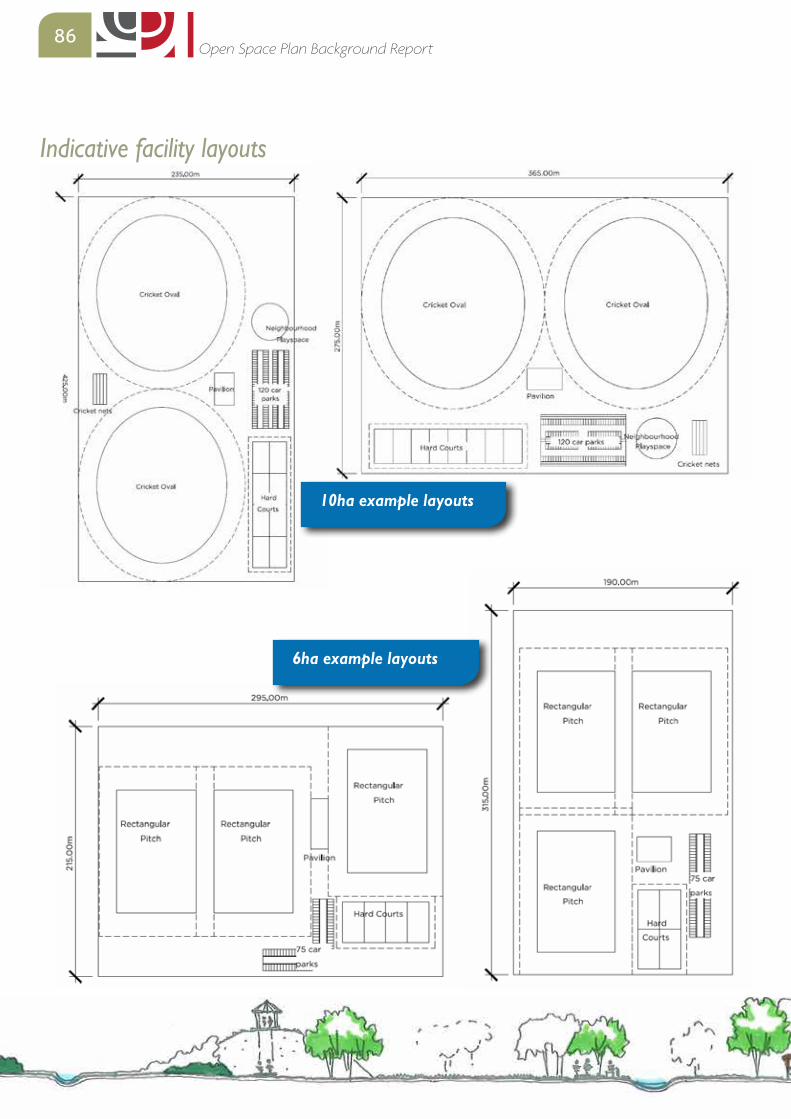
86Open Space Plan Background Report
10ha example layouts
6ha example layouts
Indicative facility layouts
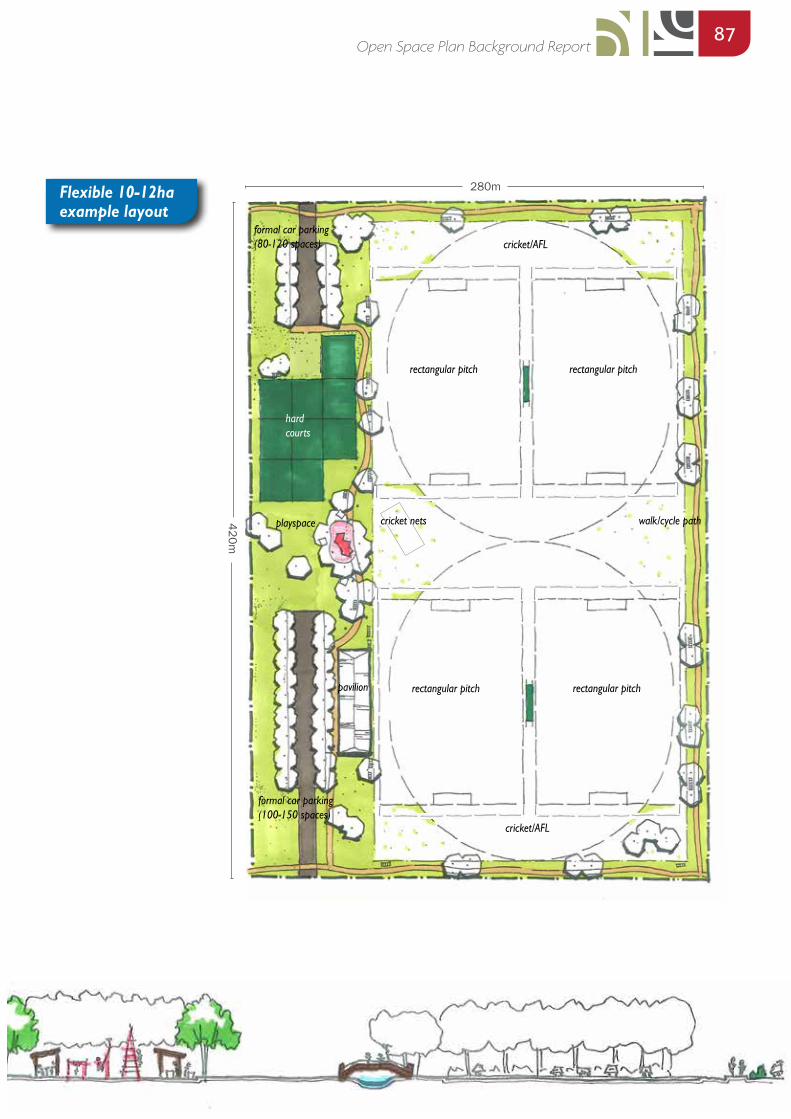
87Open Space Plan Background Report
hard courts
formal car parking (80-120 spaces)
formal car parking (100-150 spaces)
pavilion
playspace
cricket/AFL
cricket/AFL
rectangular pitch rectangular pitch
rectangular pitch
walk/cycle path
rectangular pitch
cricket nets
Flexible 10-12ha example layout
280m
420m
88Open Space Plan Background Report
Appendix 3 - Desired facility provision standardsBackgroundDistrict-level sporting facilities are currently developed by Council using Council funds, developer contributions and grant funding from State and Federal Government. In contrast, developer contributions cannot be collected or used for the development of regional-level facilities. As such, regional-level facilities are likely to require significant contributions from state (and national) sporting organisations, sporting user groups, state and federal government and Council.
The following pages present desired facility provision standards for the key sports at two levels - district and regional. Council will continue to be a key driver in the development of district-level facilities (largely through developer contributions and grants) and will strive to develop facilities according to the district-level provision standards. However, the development of regional-level facilities will require a collaborative approach where facilities may need to be staged in order to ultimately meet the regional-level provision standards. User groups and state (and national) sporting organisations will be expected to contribute to the development of these high-level facilities.
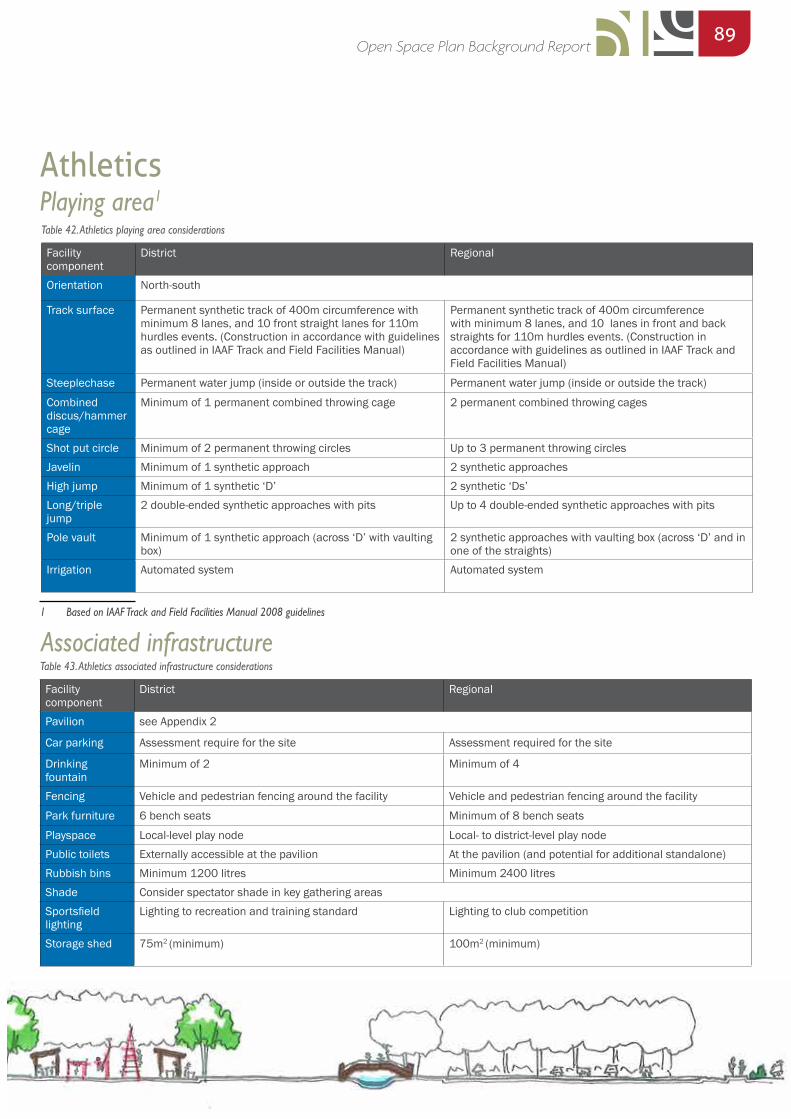
89Open Space Plan Background Report
Facility component
District Regional
Orientation North-south
Track surface Permanent synthetic track of 400m circumference with minimum 8 lanes, and 10 front straight lanes for 110m hurdles events. (Construction in accordance with guidelines as outlined in IAAF Track and Field Facilities Manual)
Permanent synthetic track of 400m circumference with minimum 8 lanes, and 10 lanes in front and back straights for 110m hurdles events. (Construction in accordance with guidelines as outlined in IAAF Track and Field Facilities Manual)
Steeplechase Permanent water jump (inside or outside the track) Permanent water jump (inside or outside the track)
Combined discus/hammer cage
Minimum of 1 permanent combined throwing cage 2 permanent combined throwing cages
Shot put circle Minimum of 2 permanent throwing circles Up to 3 permanent throwing circlesJavelin Minimum of 1 synthetic approach 2 synthetic approachesHigh jump Minimum of 1 synthetic ‘D’ 2 synthetic ‘Ds’Long/triple jump
2 double-ended synthetic approaches with pits Up to 4 double-ended synthetic approaches with pits
Pole vault Minimum of 1 synthetic approach (across ‘D’ with vaulting box)
2 synthetic approaches with vaulting box (across ‘D’ and in one of the straights)
Irrigation Automated system Automated system
Facility component
District Regional
Pavilion see Appendix 2
Car parking Assessment require for the site Assessment required for the site
Drinking fountain
Minimum of 2 Minimum of 4
Fencing Vehicle and pedestrian fencing around the facility Vehicle and pedestrian fencing around the facility
Park furniture 6 bench seats Minimum of 8 bench seats
Playspace Local-level play node Local- to district-level play nodePublic toilets Externally accessible at the pavilion At the pavilion (and potential for additional standalone)Rubbish bins Minimum 1200 litres Minimum 2400 litresShade Consider spectator shade in key gathering areasSportsfield lighting
Lighting to recreation and training standard Lighting to club competition
Storage shed 75m2 (minimum) 100m2 (minimum)
Athletics Playing area1
1 Based on IAAF Track and Field Facilities Manual 2008 guidelines
Associated infrastructure
Table 42. Athletics playing area considerations
Table 43. Athletics associated infrastructure considerations
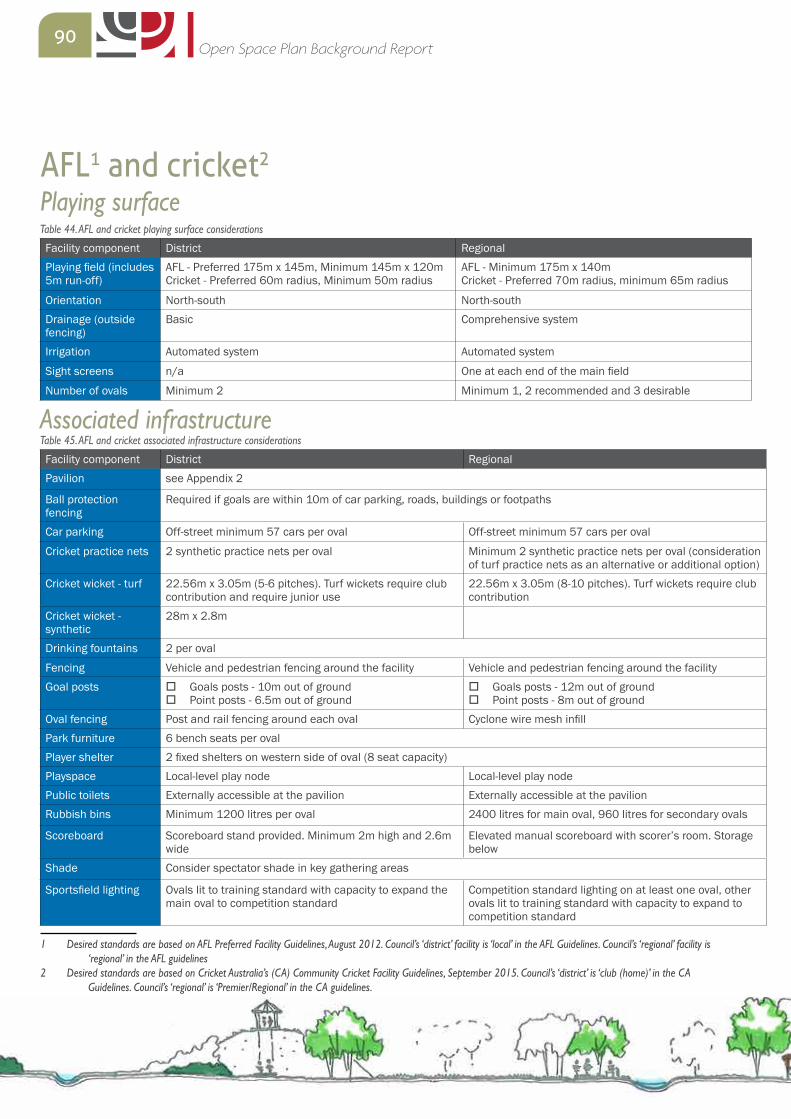
90Open Space Plan Background Report
Facility component District RegionalPlaying field (includes 5m run-off)
AFL - Preferred 175m x 145m, Minimum 145m x 120m Cricket - Preferred 60m radius, Minimum 50m radius
AFL - Minimum 175m x 140m Cricket - Preferred 70m radius, minimum 65m radius
Orientation North-south North-southDrainage (outside fencing)
Basic Comprehensive system
Irrigation Automated system Automated system
Sight screens n/a One at each end of the main field
Number of ovals Minimum 2 Minimum 1, 2 recommended and 3 desirable
Associated infrastructure
Table 44. AFL and cricket playing surface considerations
Table 45. AFL and cricket associated infrastructure considerations
Facility component District RegionalPavilion see Appendix 2
Ball protection fencing
Required if goals are within 10m of car parking, roads, buildings or footpaths
Car parking Off-street minimum 57 cars per oval Off-street minimum 57 cars per oval
Cricket practice nets 2 synthetic practice nets per oval Minimum 2 synthetic practice nets per oval (consideration of turf practice nets as an alternative or additional option)
Cricket wicket - turf 22.56m x 3.05m (5-6 pitches). Turf wickets require club contribution and require junior use
22.56m x 3.05m (8-10 pitches). Turf wickets require club contribution
Cricket wicket - synthetic
28m x 2.8m
Drinking fountains 2 per oval
Fencing Vehicle and pedestrian fencing around the facility Vehicle and pedestrian fencing around the facilityGoal posts � Goals posts - 10m out of ground
� Point posts - 6.5m out of ground � Goals posts - 12m out of ground � Point posts - 8m out of ground
Oval fencing Post and rail fencing around each oval Cyclone wire mesh infillPark furniture 6 bench seats per ovalPlayer shelter 2 fixed shelters on western side of oval (8 seat capacity)Playspace Local-level play node Local-level play nodePublic toilets Externally accessible at the pavilion Externally accessible at the pavilionRubbish bins Minimum 1200 litres per oval 2400 litres for main oval, 960 litres for secondary ovals
Scoreboard Scoreboard stand provided. Minimum 2m high and 2.6m wide
Elevated manual scoreboard with scorer’s room. Storage below
Shade Consider spectator shade in key gathering areas
Sportsfield lighting Ovals lit to training standard with capacity to expand the main oval to competition standard
Competition standard lighting on at least one oval, other ovals lit to training standard with capacity to expand to competition standard
AFL1 and cricket2 Playing surface
1 Desired standards are based on AFL Preferred Facility Guidelines, August 2012. Council’s ‘district’ facility is ‘local’ in the AFL Guidelines. Council’s ‘regional’ facility is ‘regional’ in the AFL guidelines
2 Desired standards are based on Cricket Australia’s (CA) Community Cricket Facility Guidelines, September 2015. Council’s ‘district’ is ‘club (home)’ in the CA Guidelines. Council’s ‘regional’ is ‘Premier/Regional’ in the CA guidelines.
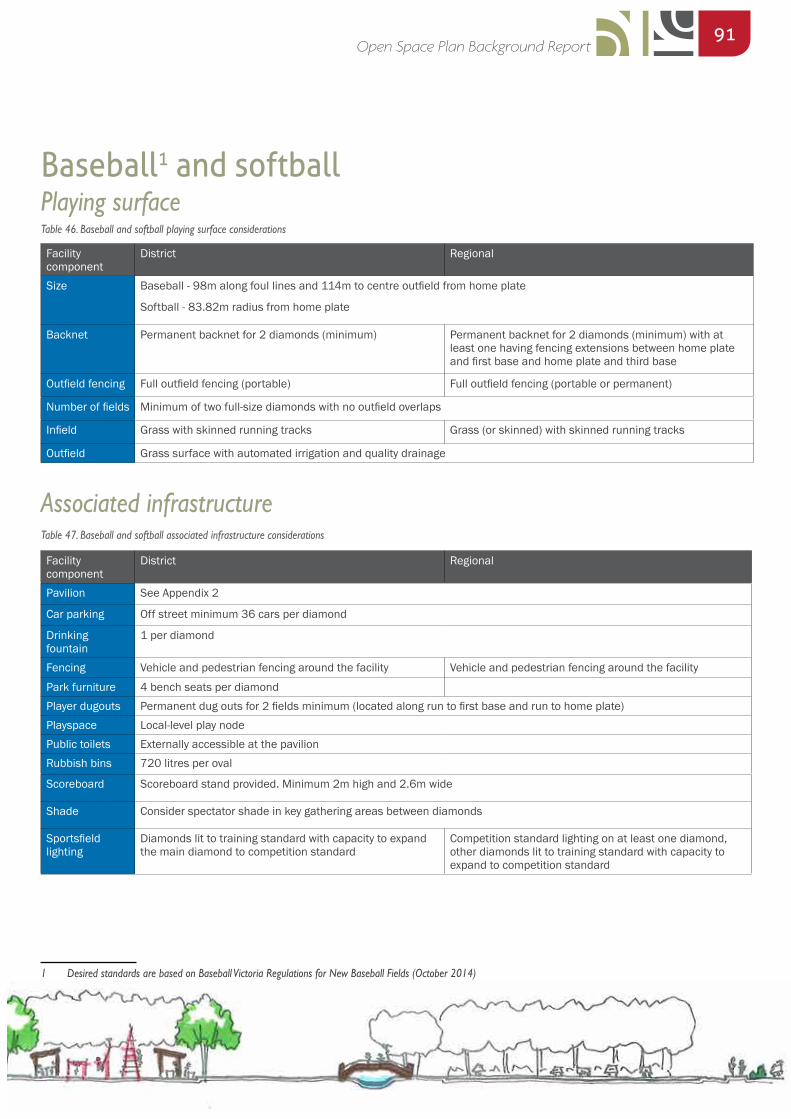
91Open Space Plan Background Report
Facility component
District Regional
Size Baseball - 98m along foul lines and 114m to centre outfield from home plate
Softball - 83.82m radius from home plate
Backnet Permanent backnet for 2 diamonds (minimum) Permanent backnet for 2 diamonds (minimum) with at least one having fencing extensions between home plate and first base and home plate and third base
Outfield fencing Full outfield fencing (portable) Full outfield fencing (portable or permanent)
Number of fields Minimum of two full-size diamonds with no outfield overlaps
Infield Grass with skinned running tracks Grass (or skinned) with skinned running tracks
Outfield Grass surface with automated irrigation and quality drainage
Facility component
District Regional
Pavilion See Appendix 2
Car parking Off street minimum 36 cars per diamond
Drinking fountain
1 per diamond
Fencing Vehicle and pedestrian fencing around the facility Vehicle and pedestrian fencing around the facility
Park furniture 4 bench seats per diamondPlayer dugouts Permanent dug outs for 2 fields minimum (located along run to first base and run to home plate)Playspace Local-level play nodePublic toilets Externally accessible at the pavilionRubbish bins 720 litres per oval
Scoreboard Scoreboard stand provided. Minimum 2m high and 2.6m wide
Shade Consider spectator shade in key gathering areas between diamonds
Sportsfield lighting
Diamonds lit to training standard with capacity to expand the main diamond to competition standard
Competition standard lighting on at least one diamond, other diamonds lit to training standard with capacity to expand to competition standard
Baseball1 and softball Playing surface
1 Desired standards are based on Baseball Victoria Regulations for New Baseball Fields (October 2014)
Associated infrastructure
Table 46. Baseball and softball playing surface considerations
Table 47. Baseball and softball associated infrastructure considerations
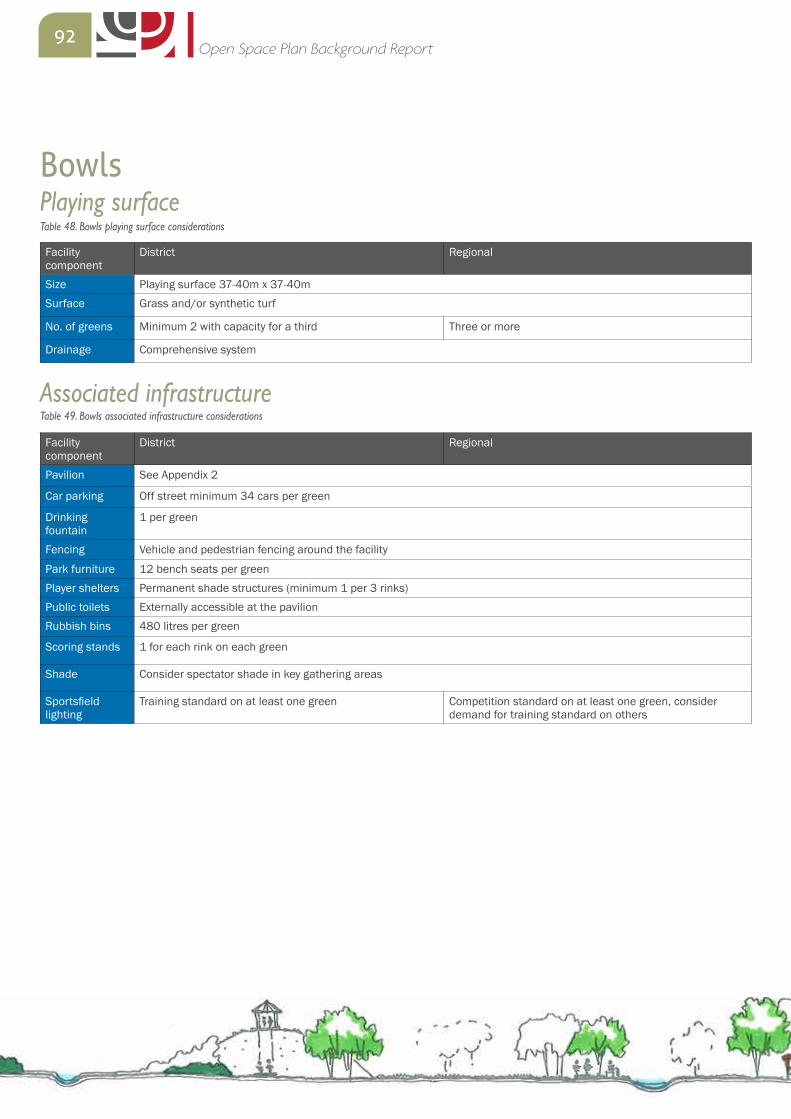
92Open Space Plan Background Report
Facility component
District Regional
Size Playing surface 37-40m x 37-40mSurface Grass and/or synthetic turf
No. of greens Minimum 2 with capacity for a third Three or more
Drainage Comprehensive system
Facility component
District Regional
Pavilion See Appendix 2
Car parking Off street minimum 34 cars per green
Drinking fountain
1 per green
Fencing Vehicle and pedestrian fencing around the facility
Park furniture 12 bench seats per greenPlayer shelters Permanent shade structures (minimum 1 per 3 rinks)Public toilets Externally accessible at the pavilionRubbish bins 480 litres per green
Scoring stands 1 for each rink on each green
Shade Consider spectator shade in key gathering areas
Sportsfield lighting
Training standard on at least one green Competition standard on at least one green, consider demand for training standard on others
BowlsPlaying surface
Associated infrastructure
Table 48. Bowls playing surface considerations
Table 49. Bowls associated infrastructure considerations
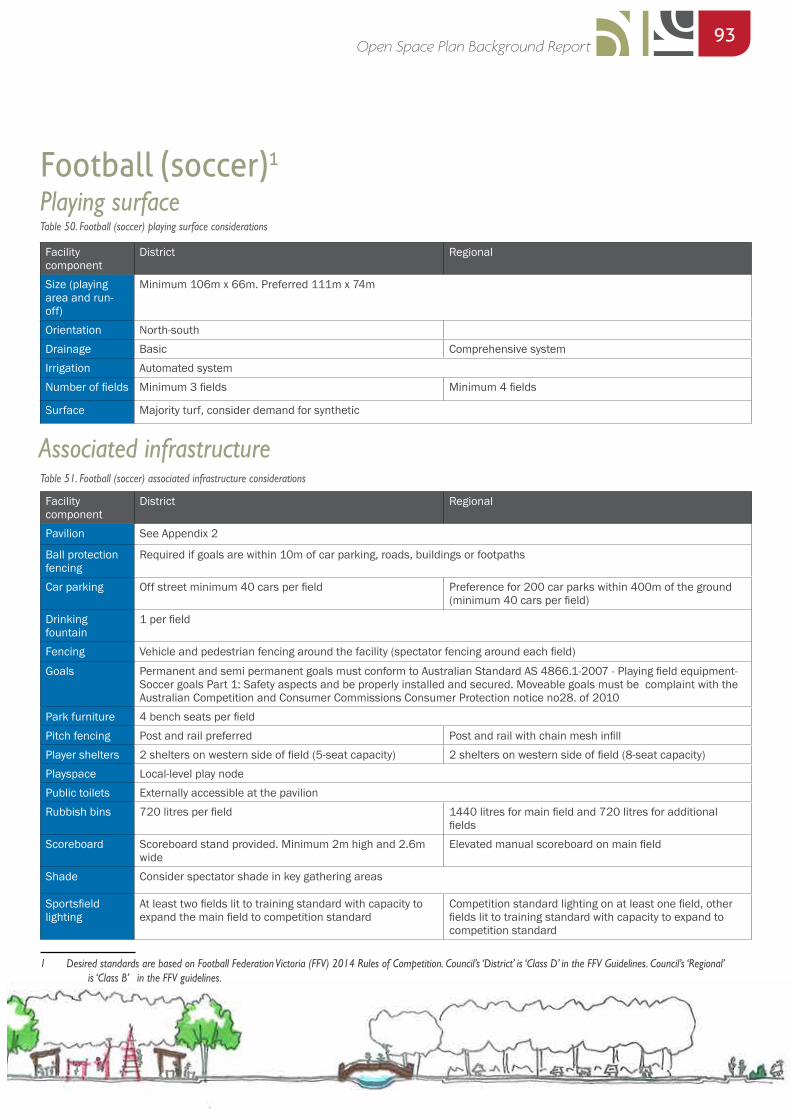
93Open Space Plan Background Report
Facility component
District Regional
Size (playing area and run-off)
Minimum 106m x 66m. Preferred 111m x 74m
Orientation North-southDrainage Basic Comprehensive systemIrrigation Automated systemNumber of fields Minimum 3 fields Minimum 4 fields
Surface Majority turf, consider demand for synthetic
Facility component
District Regional
Pavilion See Appendix 2
Ball protection fencing
Required if goals are within 10m of car parking, roads, buildings or footpaths
Car parking Off street minimum 40 cars per field Preference for 200 car parks within 400m of the ground (minimum 40 cars per field)
Drinking fountain
1 per field
Fencing Vehicle and pedestrian fencing around the facility (spectator fencing around each field)
Goals Permanent and semi permanent goals must conform to Australian Standard AS 4866.1-2007 - Playing field equipment- Soccer goals Part 1: Safety aspects and be properly installed and secured. Moveable goals must be complaint with the Australian Competition and Consumer Commissions Consumer Protection notice no28. of 2010
Park furniture 4 bench seats per fieldPitch fencing Post and rail preferred Post and rail with chain mesh infillPlayer shelters 2 shelters on western side of field (5-seat capacity) 2 shelters on western side of field (8-seat capacity)Playspace Local-level play nodePublic toilets Externally accessible at the pavilionRubbish bins 720 litres per field 1440 litres for main field and 720 litres for additional
fieldsScoreboard Scoreboard stand provided. Minimum 2m high and 2.6m
wideElevated manual scoreboard on main field
Shade Consider spectator shade in key gathering areas
Sportsfield lighting
At least two fields lit to training standard with capacity to expand the main field to competition standard
Competition standard lighting on at least one field, other fields lit to training standard with capacity to expand to competition standard
Football (soccer)1
Playing surface
1 Desired standards are based on Football Federation Victoria (FFV) 2014 Rules of Competition. Council’s ‘District’ is ‘Class D’ in the FFV Guidelines. Council’s ‘Regional’ is ‘Class B’ in the FFV guidelines.
Associated infrastructure
Table 50. Football (soccer) playing surface considerations
Table 51. Football (soccer) associated infrastructure considerations
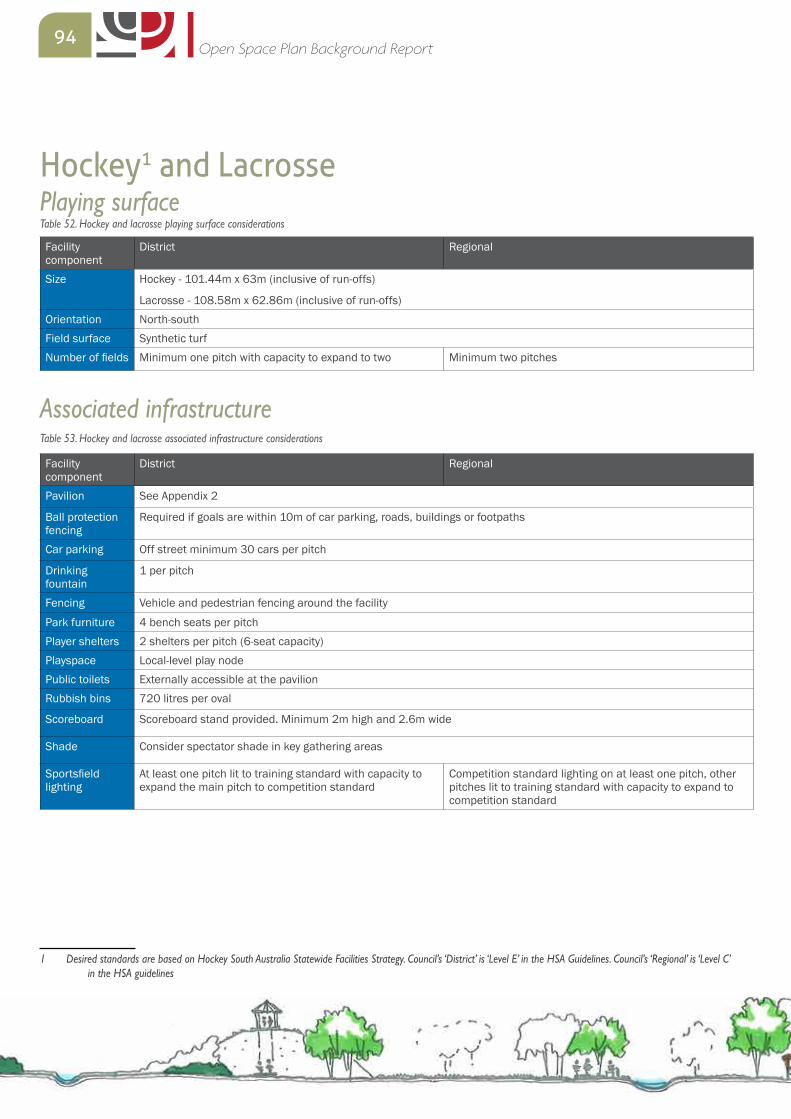
94Open Space Plan Background Report
Facility component
District Regional
Size Hockey - 101.44m x 63m (inclusive of run-offs)
Lacrosse - 108.58m x 62.86m (inclusive of run-offs)Orientation North-southField surface Synthetic turfNumber of fields Minimum one pitch with capacity to expand to two Minimum two pitches
Facility component
District Regional
Pavilion See Appendix 2
Ball protection fencing
Required if goals are within 10m of car parking, roads, buildings or footpaths
Car parking Off street minimum 30 cars per pitch
Drinking fountain
1 per pitch
Fencing Vehicle and pedestrian fencing around the facility
Park furniture 4 bench seats per pitchPlayer shelters 2 shelters per pitch (6-seat capacity)Playspace Local-level play nodePublic toilets Externally accessible at the pavilionRubbish bins 720 litres per oval
Scoreboard Scoreboard stand provided. Minimum 2m high and 2.6m wide
Shade Consider spectator shade in key gathering areas
Sportsfield lighting
At least one pitch lit to training standard with capacity to expand the main pitch to competition standard
Competition standard lighting on at least one pitch, other pitches lit to training standard with capacity to expand to competition standard
Hockey1 and Lacrosse Playing surface
1 Desired standards are based on Hockey South Australia Statewide Facilities Strategy. Council’s ‘District’ is ‘Level E’ in the HSA Guidelines. Council’s ‘Regional’ is ‘Level C’ in the HSA guidelines
Associated infrastructureTable 53. Hockey and lacrosse associated infrastructure considerations
Table 52. Hockey and lacrosse playing surface considerations
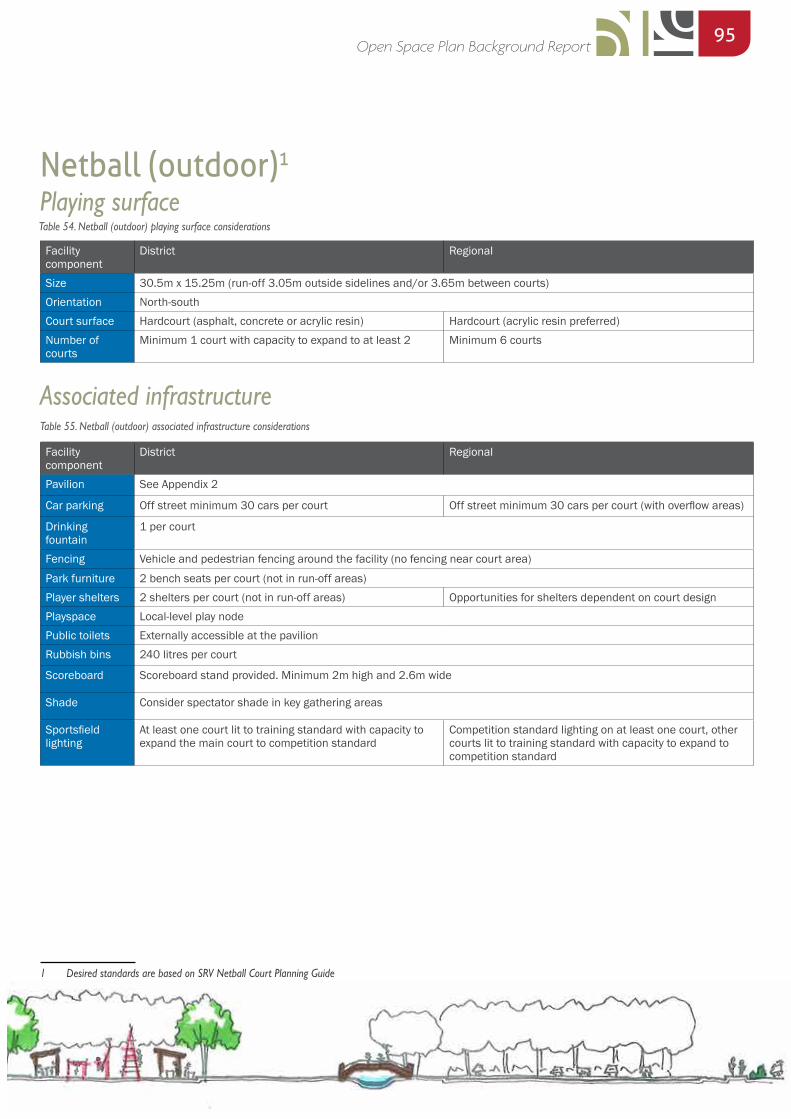
95Open Space Plan Background Report
Facility component
District Regional
Size 30.5m x 15.25m (run-off 3.05m outside sidelines and/or 3.65m between courts)Orientation North-southCourt surface Hardcourt (asphalt, concrete or acrylic resin) Hardcourt (acrylic resin preferred)Number of courts
Minimum 1 court with capacity to expand to at least 2 Minimum 6 courts
Facility component
District Regional
Pavilion See Appendix 2
Car parking Off street minimum 30 cars per court Off street minimum 30 cars per court (with overflow areas)
Drinking fountain
1 per court
Fencing Vehicle and pedestrian fencing around the facility (no fencing near court area)
Park furniture 2 bench seats per court (not in run-off areas)Player shelters 2 shelters per court (not in run-off areas) Opportunities for shelters dependent on court designPlayspace Local-level play nodePublic toilets Externally accessible at the pavilionRubbish bins 240 litres per court
Scoreboard Scoreboard stand provided. Minimum 2m high and 2.6m wide
Shade Consider spectator shade in key gathering areas
Sportsfield lighting
At least one court lit to training standard with capacity to expand the main court to competition standard
Competition standard lighting on at least one court, other courts lit to training standard with capacity to expand to competition standard
Netball (outdoor)1 Playing surface
1 Desired standards are based on SRV Netball Court Planning Guide
Associated infrastructure
Table 54. Netball (outdoor) playing surface considerations
Table 55. Netball (outdoor) associated infrastructure considerations
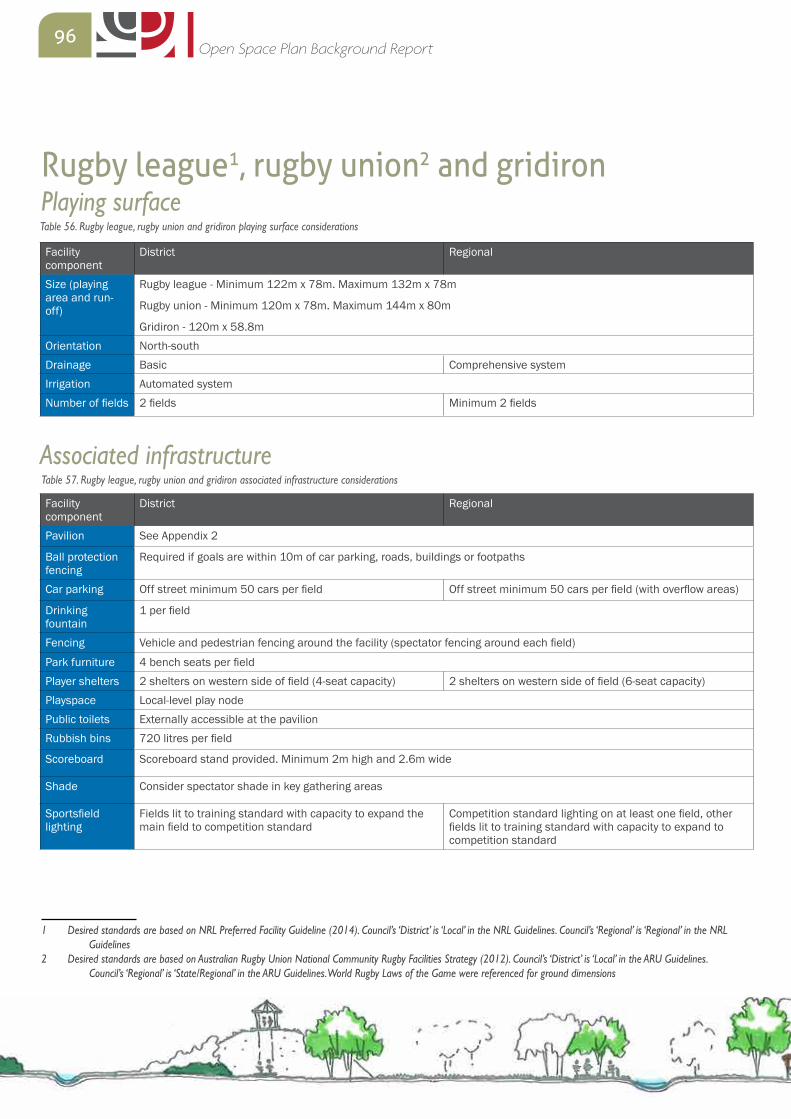
96Open Space Plan Background Report
Facility component
District Regional
Size (playing area and run-off)
Rugby league - Minimum 122m x 78m. Maximum 132m x 78m
Rugby union - Minimum 120m x 78m. Maximum 144m x 80m
Gridiron - 120m x 58.8mOrientation North-southDrainage Basic Comprehensive systemIrrigation Automated systemNumber of fields 2 fields Minimum 2 fields
Facility component
District Regional
Pavilion See Appendix 2
Ball protection fencing
Required if goals are within 10m of car parking, roads, buildings or footpaths
Car parking Off street minimum 50 cars per field Off street minimum 50 cars per field (with overflow areas)
Drinking fountain
1 per field
Fencing Vehicle and pedestrian fencing around the facility (spectator fencing around each field)
Park furniture 4 bench seats per fieldPlayer shelters 2 shelters on western side of field (4-seat capacity) 2 shelters on western side of field (6-seat capacity)Playspace Local-level play nodePublic toilets Externally accessible at the pavilionRubbish bins 720 litres per field
Scoreboard Scoreboard stand provided. Minimum 2m high and 2.6m wide
Shade Consider spectator shade in key gathering areas
Sportsfield lighting
Fields lit to training standard with capacity to expand the main field to competition standard
Competition standard lighting on at least one field, other fields lit to training standard with capacity to expand to competition standard
Rugby league1, rugby union2 and gridironPlaying surface
1 Desired standards are based on NRL Preferred Facility Guideline (2014). Council’s ‘District’ is ‘Local’ in the NRL Guidelines. Council’s ‘Regional’ is ‘Regional’ in the NRL Guidelines
2 Desired standards are based on Australian Rugby Union National Community Rugby Facilities Strategy (2012). Council’s ‘District’ is ‘Local’ in the ARU Guidelines. Council’s ‘Regional’ is ‘State/Regional’ in the ARU Guidelines. World Rugby Laws of the Game were referenced for ground dimensions
Associated infrastructure
Table 56. Rugby league, rugby union and gridiron playing surface considerations
Table 57. Rugby league, rugby union and gridiron associated infrastructure considerations
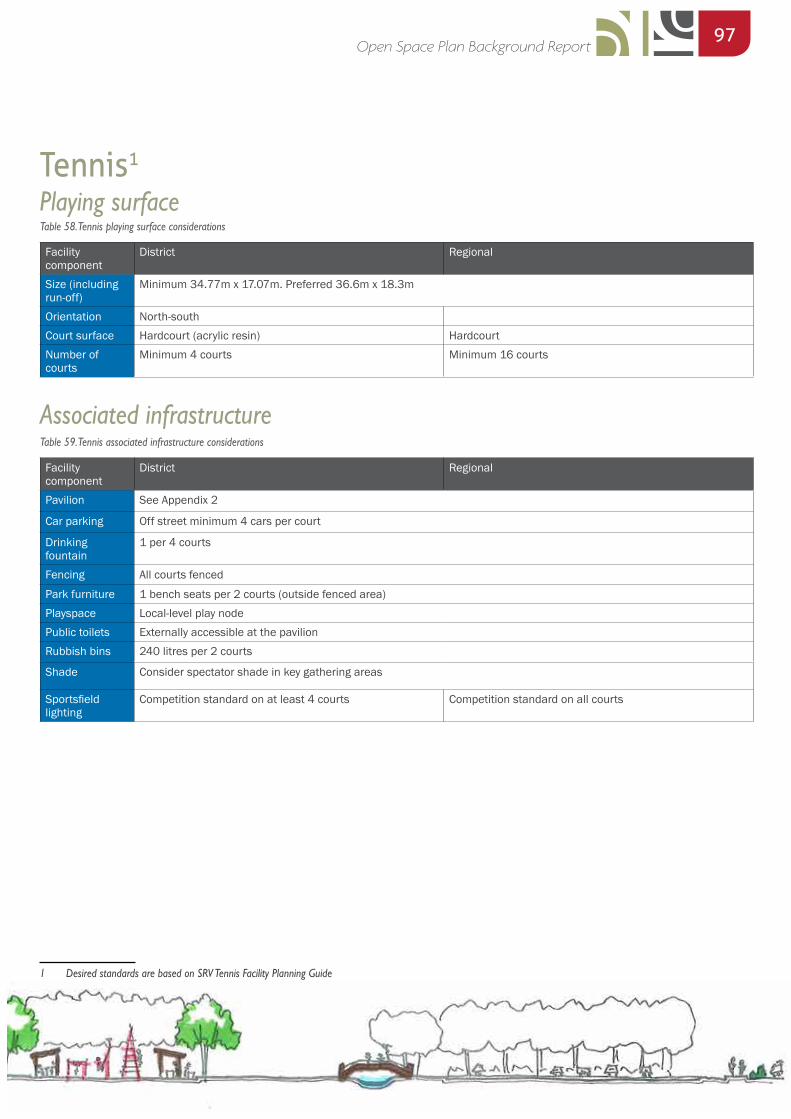
97Open Space Plan Background Report
Facility component
District Regional
Size (including run-off)
Minimum 34.77m x 17.07m. Preferred 36.6m x 18.3m
Orientation North-southCourt surface Hardcourt (acrylic resin) Hardcourt Number of courts
Minimum 4 courts Minimum 16 courts
Facility component
District Regional
Pavilion See Appendix 2
Car parking Off street minimum 4 cars per court
Drinking fountain
1 per 4 courts
Fencing All courts fenced
Park furniture 1 bench seats per 2 courts (outside fenced area)Playspace Local-level play nodePublic toilets Externally accessible at the pavilionRubbish bins 240 litres per 2 courts
Shade Consider spectator shade in key gathering areas
Sportsfield lighting
Competition standard on at least 4 courts Competition standard on all courts
Tennis1 Playing surface
1 Desired standards are based on SRV Tennis Facility Planning Guide
Associated infrastructure
Table 58. Tennis playing surface considerations
Table 59. Tennis associated infrastructure considerations
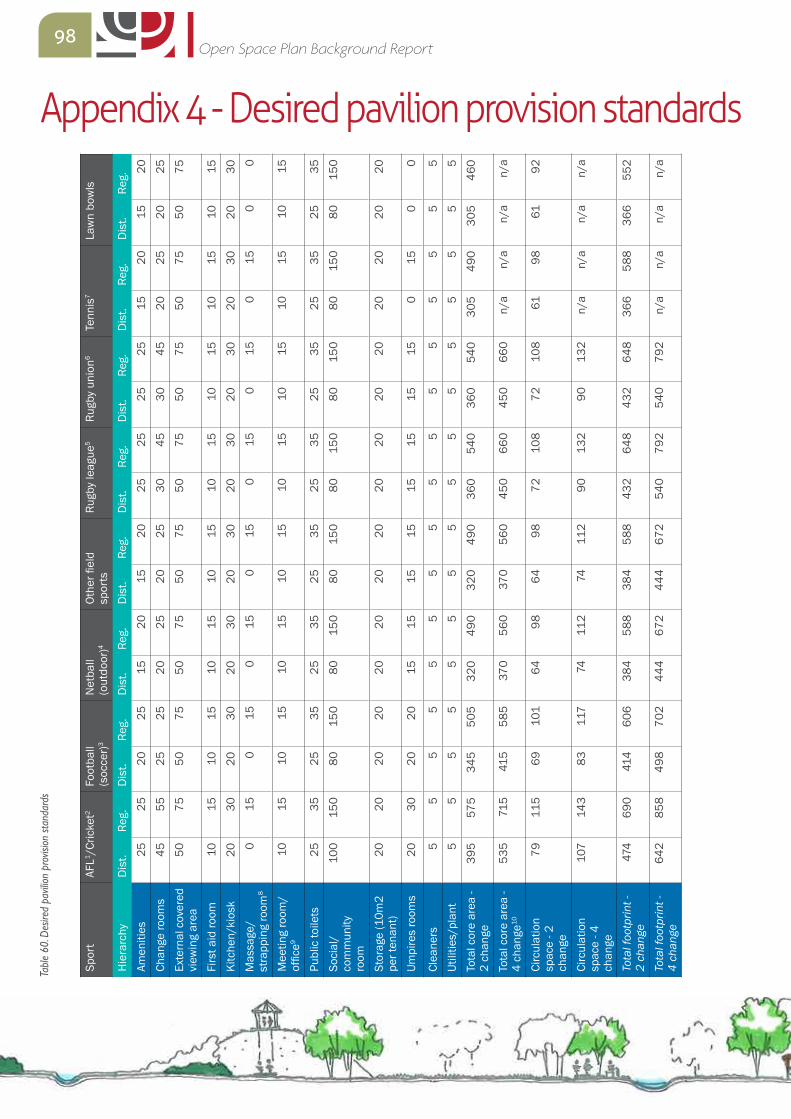
98Open Space Plan Background Report
Appendix 4 - Desired pavilion provision standardsSp
ort
AFL1 /
Cric
ket2
Foot
ball
(soc
cer)3
Net
ball
(out
door
)4Ot
her fi
eld
spor
tsRu
gby
leag
ue5
Rugb
y un
ion6
Tenn
is7
Law
n bo
wls
Hie
rarc
hyD
ist.
Reg.
Dis
t. Re
g.D
ist.
Reg.
Dis
t. Re
g.D
ist.
Reg.
Dis
t. Re
g.D
ist.
Reg.
Dis
t. Re
g.Am
eniti
es25
2520
2515
2015
2025
2525
2515
2015
20Ch
ange
room
s45
5525
2520
2520
2530
4530
4520
2520
25Ex
tern
al c
over
ed
view
ing
area
5075
5075
5075
5075
5075
5075
5075
5075
Firs
t aid
room
1015
1015
1015
1015
1015
1015
1015
1015
Kitc
hen/
kios
k20
3020
3020
3020
3020
3020
3020
3020
30M
assa
ge/
stra
ppin
g ro
om8
015
015
015
015
015
015
015
00
Mee
ting
room
/ of
fice9
1015
1015
1015
1015
1015
1015
1015
1015
Publ
ic to
ilets
2535
2535
2535
2535
2535
2535
2535
2535
Soci
al/
com
mun
ity
room
100
150
8015
080
150
8015
080
150
8015
080
150
8015
0
Stor
age
(10m
2 pe
r ten
ant)
2020
2020
2020
2020
2020
2020
2020
2020
Umpi
res
room
s20
3020
2015
1515
1515
1515
150
150
0
Clea
ners
55
55
55
55
55
55
55
55
Utili
ties/
plan
t5
55
55
55
55
55
55
55
5To
tal c
ore
area
- 2
chan
ge39
557
534
550
532
049
032
049
036
054
036
054
030
549
030
546
0
Tota
l cor
e ar
ea -
4 ch
ange
1053
571
541
558
537
056
037
056
045
066
045
066
0n/
an/
an/
an/
a
Circ
ulat
ion
spac
e - 2
ch
ange
7911
569
101
6498
6498
7210
872
108
6198
6192
Circ
ulat
ion
spac
e - 4
ch
ange
107
143
8311
774
112
7411
290
132
9013
2n/
an/
an/
an/
a
Tota
l foo
tprin
t -
2 ch
ange
474
690
414
606
384
588
384
588
432
648
432
648
366
588
366
552
Tota
l foo
tprin
t -
4 ch
ange
642
858
498
702
444
672
444
672
540
792
540
792
n/a
n/a
n/a
n/a
Table
60.
Desir
ed p
avilio
n pr
ovisi
on st
anda
rds
99Open Space Plan Background Report
Desired pavilion provision standards - notes1. Desired standards are based on AFL Preferred Facility Guidelines, August 2012. Council’s ‘District’ facility is ‘Local’ in the AFL Guidelines. Council’s ‘Regional’ facility is ‘Regional’ in the AFL Guidelines
2. Desired standards are based on Cricket Australia’s (CA) Community Cricket Facility Guidelines, September 2015. Council’s ‘District’ is ‘Club (Home)’ in the CA Guidelines. Council’s ‘Regional’ is ‘Premier/Regional’ in the CA Guidelines
3. Desired standards are based on Football Federation Victoria (FFV) 2014 Rules of Competition. Council’s ‘District’ is ‘Class D’ in the FFV Guidelines. Council’s ‘Regional’ is ‘Class B’ in the FFV Guidelines
4. Desired standards are based on Sport and Recreation Victoria Netball Court Planning Guide
5. Desired standards are based on NRL Preferred Facility Guideline (2014). Council’s ‘District’ is ‘Local’ in the NRL Guidelines. Council’s ‘Regional’ is ‘Regional’ in the NRL Guidelines
6. Desired standards are based on Australian Rugby Union National Community Rugby Facilities Strategy (2012). Council’s ‘District’ is ‘Local’ in the ARU Guidelines. Council’s ‘Regional’ is ‘State/Regional’ in the ARU Guidelines. World Rugby Laws of the Game were referenced for ground dimensions
7. Desired standards are based on Sport and Recreation Victoria Tennis Facility Planning Guide
8. Massage/strapping room in not required for district-level pavilions
9. Meeting room/office is optional for district-level facilities
10. Male and female change rooms/amenities are provided rather than ‘home and away’
Additional notes: � Where there are concurrent activities (i.e. AFL and netball), change rooms and amenities will aim to provide for both activities � Where there are simultaneous licence agreements in the one pavilion, a larger kitchen may be required. This will be considered on a
case-by-case basis � As state sporting organisation preferred provision standards are altered, Council will consider potential changes to these desired
standards

recreationopen spaceand sportspecialists