Embed Size (px)
Citation preview

Open Studio Charrette: May 15 - 17

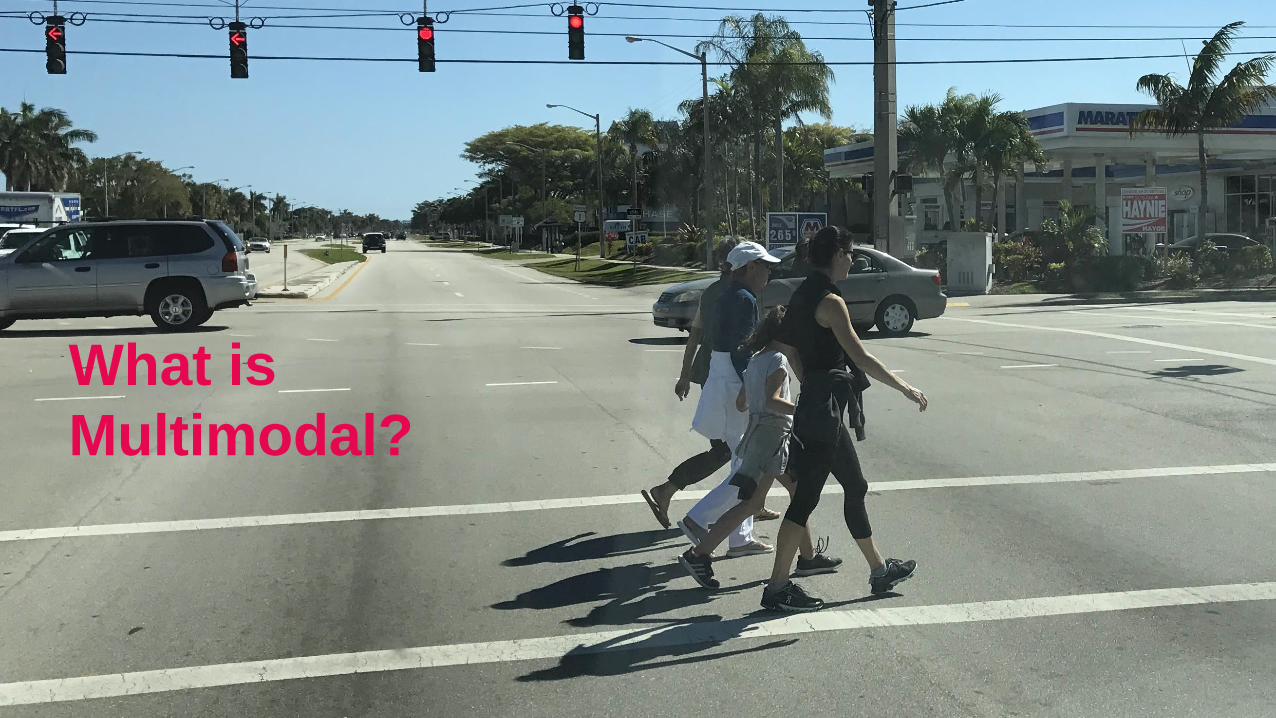
What is Multimodal?
What is
Multimodal?

What is
Multimodal?

Purpose
▪ Develop a comprehensive plan to implement
continuous multimodal facilities that connect the
communities along the corridor.
▪ Upgrade the existing limited stop service to Corridor-
Based Bus Rapid Transit (BRT).
▪ Expand transit service north of Palm Beach Gardens
to Indiantown Road in Jupiter.
▪ Improve public health through transportation design.

History
▪ Eastern Division of
“The Dixie Highway”
▪ “The Atlantic
Highway”

History
▪ U.S. 1
designated
November 11,
1926

History
▪ Key West, FL to
Fort Kent, ME
▪ A total of ~2,390
miles, nearly 530
miles in Florida
▪ Early tourist route

History
▪ U.S. 1 (Federal Highway)
expanded and relocated
following World War II to
its current alignment
▪ Construction of I-95 in the
1970s removed most
long-distance trips
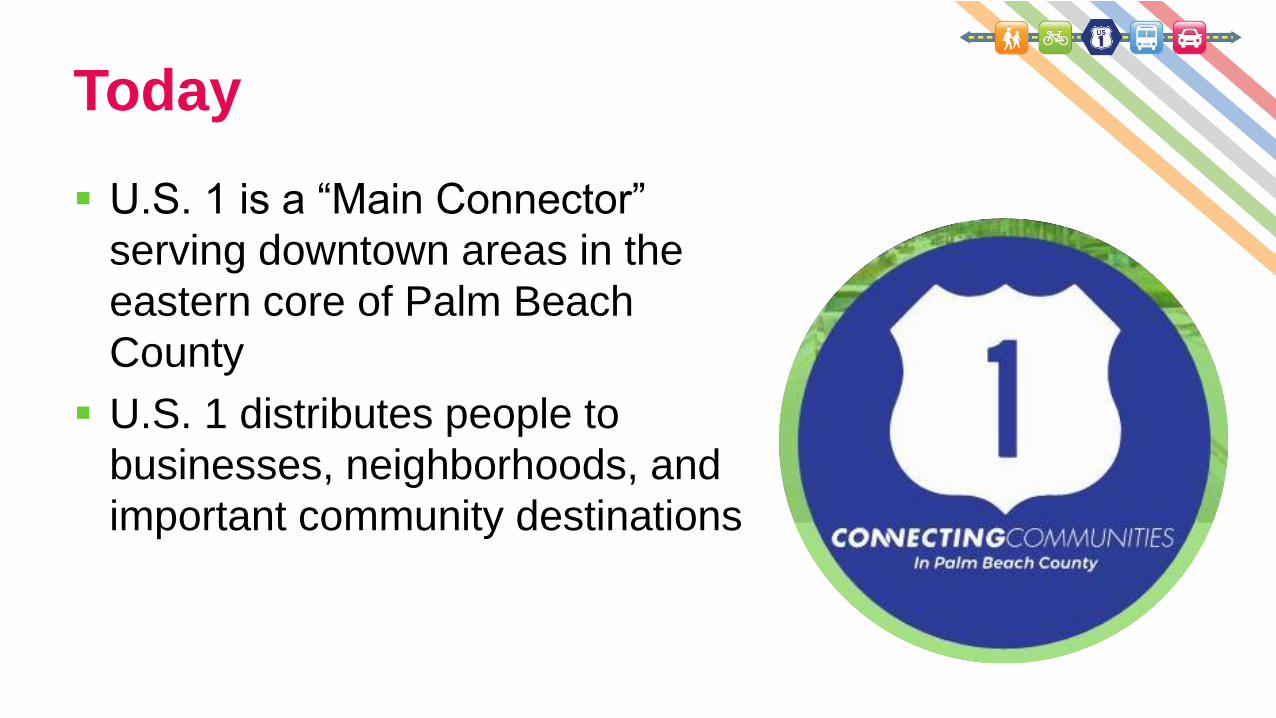
Today
▪ U.S. 1 is a “Main Connector”
serving downtown areas in the
eastern core of Palm Beach
County
▪ U.S. 1 distributes people to
businesses, neighborhoods, and
important community destinations

Complete Streets

Complete Streets
▪ Complete Streets are designed, built, and maintained
to safely and comfortably serve all modes and people
of all ages
and abilities
▪ Palm Beach MPO
Complete Streets
Policy adopted in
March 2016

Project Corridor
▪ US-1 Corridor in Palm Beach County
▪ Camino Real in Boca Raton to
Indiantown Road in Jupiter
▪ FDOT-owned road
▪ 42 miles north-south
▪ 14 local municipalities
▪ Highest ridership Palm Tran bus route 1
▪ Limited stop service “The Bolt”

Project Corridor
Organized into six sections
▪ Section 1: Boca Raton
▪ Section 2: Delray Beach, Boynton Beach &
Gulf Stream
▪ Section 3: Hypoluxo, Lantana & Lake Worth
▪ Section 4: West Palm Beach
▪ Section 5: Riviera Beach, Lake Park & North
Palm Beach
▪ Section 6: Juno Beach, Jupiter & Palm
Beach Gardens


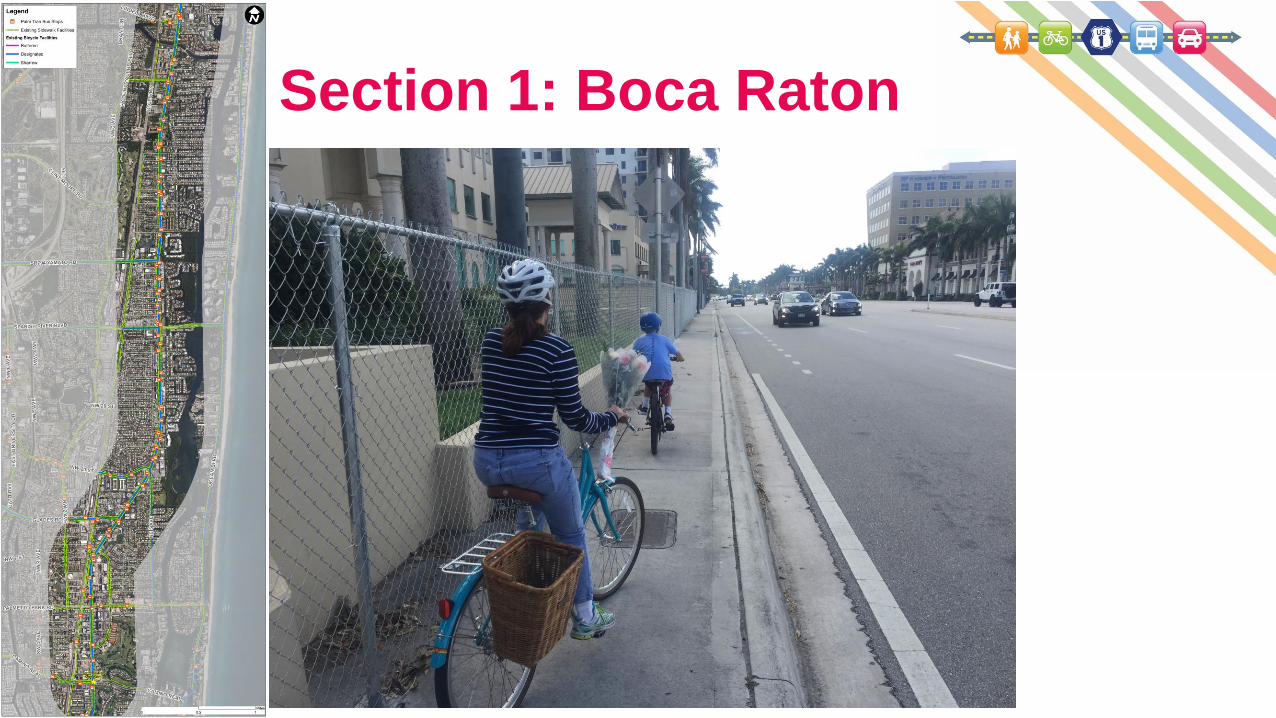
Section 1: Boca Raton
▪ Continuous sidewalk/bicycle facilities
▪ Transitions from 6-lane to 4-lane
▪ US-1 bridge across the canal at the
Boca Raton/Delray Beach city limits has
no bike lanes
Section 1: Boca Raton

Section 1: Boca Raton

Section 1: Boca Raton

Section 1: Boca Raton

Section 1: Boca Raton

Section 1: Boca Raton

Section 1: Boca Raton

Section 1: Boca Raton

Camino Real to SE Mizner Blvd

SE Mizner Blvd to NE Mizner Blvd

NE Mizner Blvd to Glades Rd

Glades Rd to Lindell Blvd

Potential Improvements
▪ Lighting
▪ Street trees
▪ Crosswalks
▪ Wider sidewalks
▪ Separated bicycle lanes
▪ Drainage
▪ Monitor the City’s US-1 one-way pair study

Schedule

Schedule
We are Here

Stakeholder Thoughts

Workshop/Charrette Schedule

US-1 Multimodal Facilities

Employment
Boca Raton
Delray Beach
Gulf Stream
Boynton Beach
Hypoluxo
Lake Worth
Lantana
West Palm Beach
Riviera Beach
Lake Park
North Palm Beach
Palm Beach Gardens
Juno Beach
Jupiter
PGA Blvd
Indiantown Rd
Northlake Blvd
Blue Heron Blvd
Okeechobee Blvd
Southern Blvd
Forest Hill Blvd
Lake Worth Rd
Lantana Rd
Boynton Beach Blvd
Atlantic Ave
Yamato Rd
Glades Rd
Camino Real
156,200Working Population(Workers who live + who live & work +
who commute into the corridor to work)
13% Of County Residents
88,400 Employees Coming into the
Study Area to Work
13,600 Residents Live & Work in
the Study Area
54,200 Residents Leaving the
Study Area to Work
19% Of County Jobs
Work Inflow / Outflow (1/2 mile of Study Corridor)
Source: LEHD, 2014; SERPM 7.061
Employment and Residents
100 jobs
100 residents

Demographics
White
Black
Asian
Hispanic
OtherMulti Racial
Boca Raton
Delray Beach
Gulf Stream
Boynton Beach
Hypoluxo
Lake Worth
Lantana
West Palm Beach
Riviera Beach
Lake Park
North Palm Beach
Palm Beach Gardens
Juno Beach
Jupiter
PGA Blvd
Northlake Blvd
Blue Heron Blvd
Okeechobee Blvd
Southern Blvd
Forest Hill Blvd
Lake Worth Rd
Lantana Rd
Boynton Beach Blvd
Atlantic Ave
Yamato Rd
Glades Rd
Camino Real
Highest Concentrations of Minorities:
Race + Ethnicity
WHITE
54.6%
BLACK
23.8%
ASIAN
1.5%
OTHER
0.5%HISPANIC
18.4%
MULTI-RACIAL
1.2%
Source: U.S. Census Bureau 2011-2015 5-Year Estimates
Racial + Ethnic Minorities
38% (County Avg) – 50%
51% - 75%
76% - 100%
Indiantown Rd
▪ Riviera Beach
▪ West Palm Beach
▪ Lake Worth
▪ Boynton Beach

Income + Poverty
Boca Raton
Delray Beach
Gulf Stream
Boynton Beach
Hypoluxo
Lake Worth
Lantana
West Palm Beach
Riviera Beach
Lake Park
North Palm Beach
Palm Beach Gardens
Juno Beach
Jupiter
PGA Blvd
Indiantown Rd
Northlake Blvd
Blue Heron Blvd
Okeechobee Blvd
Southern Blvd
Forest Hill Blvd
Lake Worth Rd
Lantana Rd
Boynton Beach Blvd
Atlantic Ave
Yamato Rd
Glades Rd
PGA Blvd
Indiantown Rd
Northlake Blvd
Blue Heron Blvd
Okeechobee Blvd
Southern Blvd
Forest Hill Blvd
Lake Worth Rd
Lantana Rd
Boynton Beach Blvd
Atlantic Ave
Yamato Rd
Glades Rd
Camino Real Source: U.S. Census Bureau 2011-2015 5-Year Estimates
Lowest Incomes +
Most Households
Under the Poverty
Line
Median Household Income
$0 - $ 26,945 (50% AMI)
$26,946 - $32,333 (60% AMI)
$32,334 - $43,111 (80% AMI)
$43,112 - $58,970 (100% AMI)
Households below the Poverty Line
0.29 (County Avg) – 1 / Acre
1.1 – 1.5 / Acre
1.6 – 10.5 / Acre
$58,970Palm Beach County
Median Household
Income
Lake Worth
West Palm Beach
Riviera Beach
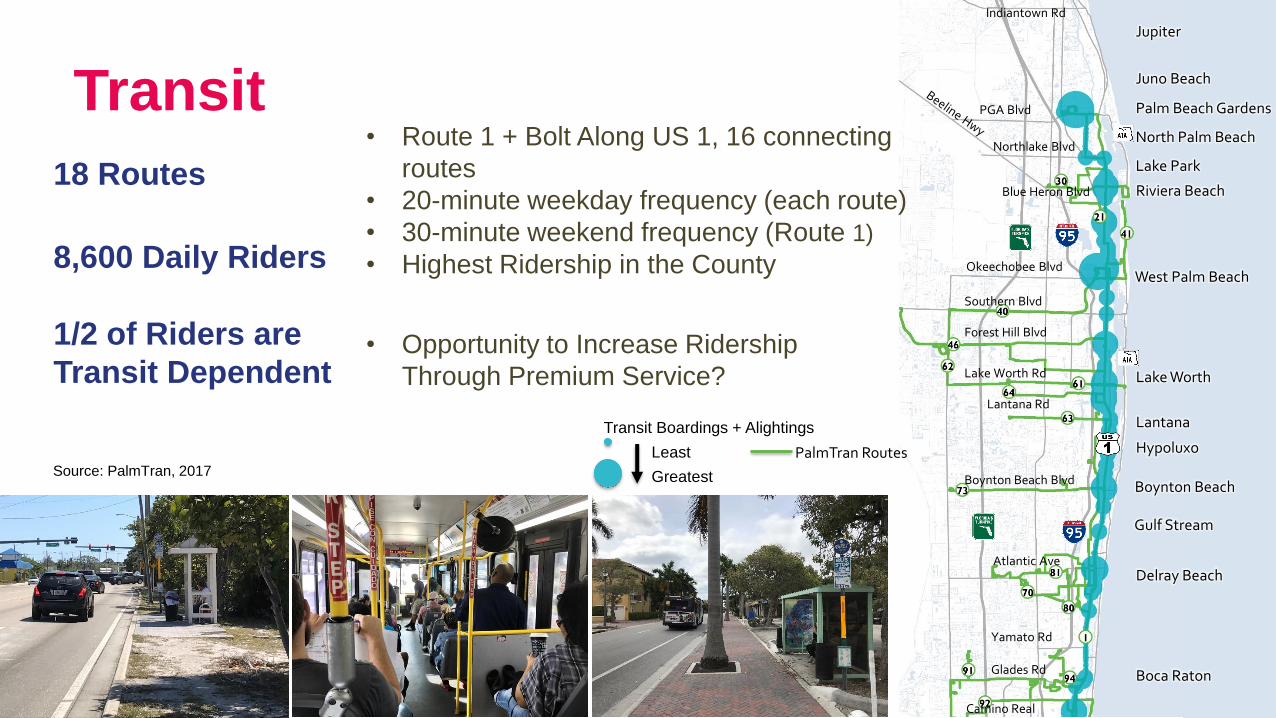
Transit
Boca Raton
Delray Beach
Gulf Stream
Boynton Beach
Hypoluxo
Lake Worth
Lantana
West Palm Beach
Riviera Beach
Lake Park
North Palm Beach
Palm Beach Gardens
Juno Beach
Jupiter
PGA Blvd
Indiantown Rd
Northlake Blvd
Blue Heron Blvd
Okeechobee Blvd
Southern Blvd
Forest Hill Blvd
Lake Worth Rd
Lantana Rd
Boynton Beach Blvd
Atlantic Ave
Yamato Rd
Glades Rd
Camino Real
• Opportunity to Increase Ridership
Through Premium Service?
18 Routes
8,600 Daily Riders
1/2 of Riders are
Transit Dependent
• Highest Ridership in the County
• Route 1 + Bolt Along US 1, 16 connecting
routes
• 20-minute weekday frequency (each route)
• 30-minute weekend frequency (Route 1)
Source: PalmTran, 2017
Transit Boardings + Alightings
Least
Greatest
PalmTran Routes
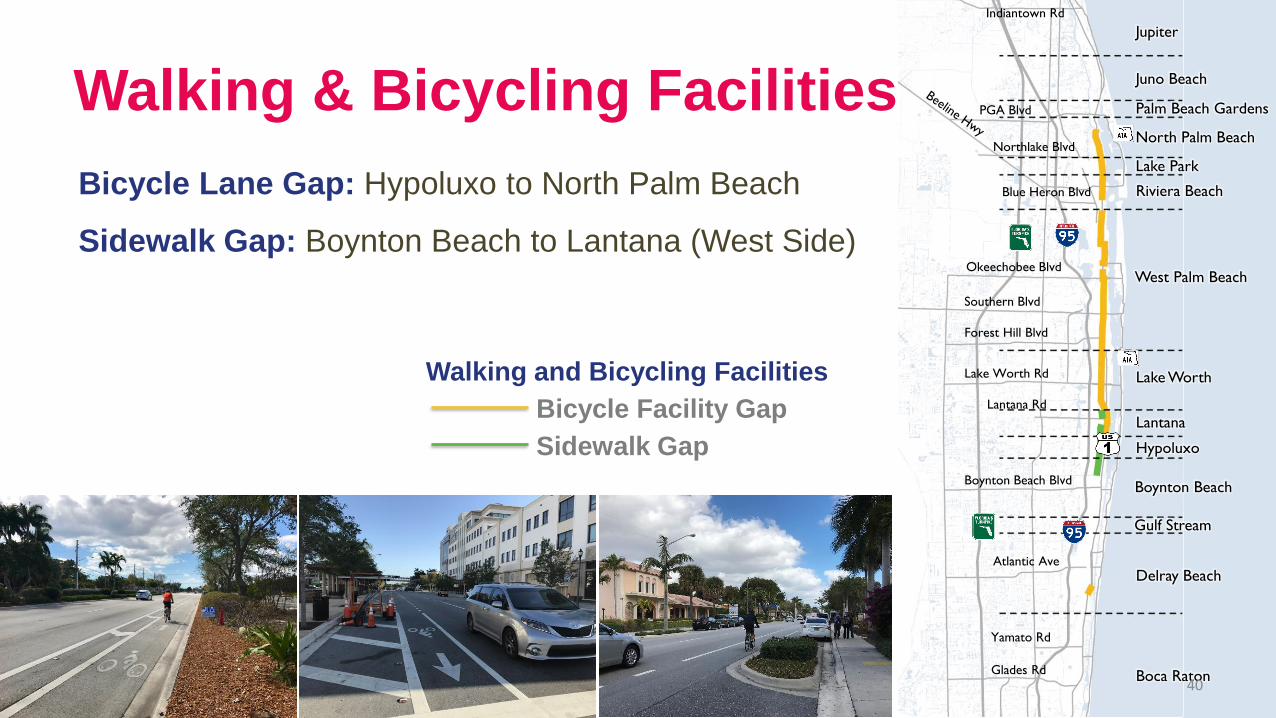
Walking & Bicycling Facilities
Boca Raton
Delray Beach
Gulf Stream
Boynton Beach
Hypoluxo
Lake Worth
Lantana
West Palm Beach
Riviera Beach
Lake Park
North Palm Beach
Palm Beach Gardens
Juno Beach
Jupiter
PGA Blvd
Indiantown Rd
Northlake Blvd
Blue Heron Blvd
Okeechobee Blvd
Southern Blvd
Forest Hill Blvd
Lake Worth Rd
Lantana Rd
Boynton Beach Blvd
Atlantic Ave
Yamato Rd
Glades Rd
Bicycle Lane Gap: Hypoluxo to North Palm Beach
Sidewalk Gap: Boynton Beach to Lantana (West Side)
40
Walking and Bicycling Facilities
Bicycle Facility Gap
Sidewalk Gap

Walking & Bicycling Safety2011-2016
Boca Raton
Delray Beach
Gulf Stream
Boynton Beach
Hypoluxo
Lake Worth
Lantana
West Palm Beach
Riviera Beach
Lake Park
North Palm Beach
Palm Beach Gardens
Juno Beach
Jupiter
PGA Blvd
Indiantown Rd
Northlake Blvd
Blue Heron Blvd
Okeechobee Blvd
Southern Blvd
Forest Hill Blvd
Lake Worth Rd
Lantana Rd
Boynton Beach Blvd
Atlantic Ave
Yamato Rd
Glades Rd
15 Fatalities• 100% Occurred in Dark or Dusk
• 12 Pedestrian Fatalities
• Concentrations in Lake Worth
and West Palm Beach
• 3 Bicyclist Fatalities
• Occurred in Boca Raton
Between Glades Rd and
Hidden Valley Blvd
321 Crashes• 58% Involved a Pedestrian
• 42% Involved a Bicyclist
• 82% of Bicyclist Crashes
Occurred in Locations Without a
Bike Lane
• Crash Concentrations in Lake
Worth and West Palm Beach
between Lantana Rd and Summit
BlvdSource: SignalFour Analytics, 2011 - 2016
Ped / Bike Crashes
Least
Greatest
Fatality
Crash Hot Spot
High Crash Corridor

Vehicle Access and Commuting
▪ Modes other than single
occupancy vehicles (SOVs) are
higher than elsewhere in County
Households Without Access
to a Vehicle
0.29 (County Avg) – 1 / Acre
1.01 – 1.5 / Acre
1.6 – 10.5 / Acre
Boca Raton
Delray Beach
Gulf Stream
Boynton Beach
Hypoluxo
Lake Worth
Lantana
West Palm Beach
Riviera Beach
Lake Park
North Palm Beach
Palm Beach Gardens
Juno Beach
Jupiter
PGA Blvd
Indiantown Rd
Northlake Blvd
Blue Heron Blvd
Okeechobee Blvd
Southern Blvd
Forest Hill Blvd
Lake Worth Rd
Lantana Rd
Boynton Beach Blvd
Atlantic Ave
Yamato Rd
Glades Rd
Camino Real
Source: U.S. Census Bureau 2011-2015 5-Year Estimates;
Robert Woods Johnson Foundation County Health Rankings
42

Vehicular Speed + Volumes
▪ Posted Speed Limits Vary; Majority <=
35 MPH
▪ Speeding Observed on Field Visits
▪ Moderate Traffic Volumes Throughout
Most of the Corridor
Boca Raton
Delray Beach
Gulf Stream
Boynton Beach
Hypoluxo
Lake Worth
Lantana
West Palm Beach
Riviera Beach
Lake Park
North Palm Beach
Palm Beach Gardens
Juno Beach
Jupiter
PGA Blvd
Indiantown Rd
Northlake Blvd
Blue Heron Blvd
Okeechobee Blvd
Southern Blvd
Forest Hill Blvd
Lake Worth Rd
Lantana Rd
Boynton Beach Blvd
Atlantic Ave
Yamato Rd
Glades Rd
Camino Real
PGA Blvd
Indiantown Rd
Northlake Blvd
Blue Heron Blvd
Okeechobee Blvd
Southern Blvd
Forest Hill Blvd
Lake Worth Rd
Lantana Rd
Boynton Beach Blvd
Atlantic Ave
Yamato Rd
Glades Rd
Camino Real
Posted Speed Limit
30
35
40
45
Annual Average Daily Traffic (AADT)
9,800 – 10,000
10,000 – 20,000
20,001 – 30,000
30,001 – 40,000
Source: FDOT GIS, 2017
Posted Speed Limit AADT

Health Impact Assessment
HIA Goal
The goal of the study is to better understand the impacts of the
potential US 1 multimodal improvements on the overall health of the
communities that would be served by this proposed transit investment.
This would include potential impacts of improvements on:
▪ Access to jobs and education
▪ Access to health and community services
▪ Safety for pedestrians and cyclists
▪ Development / redevelopment along corridor

Next Steps
▪ Charrettes & Interviews: May –
October
▪ Corridor Improvement & Transit
Analysis
▪ Health Impact Assessment