Embed Size (px)
Citation preview
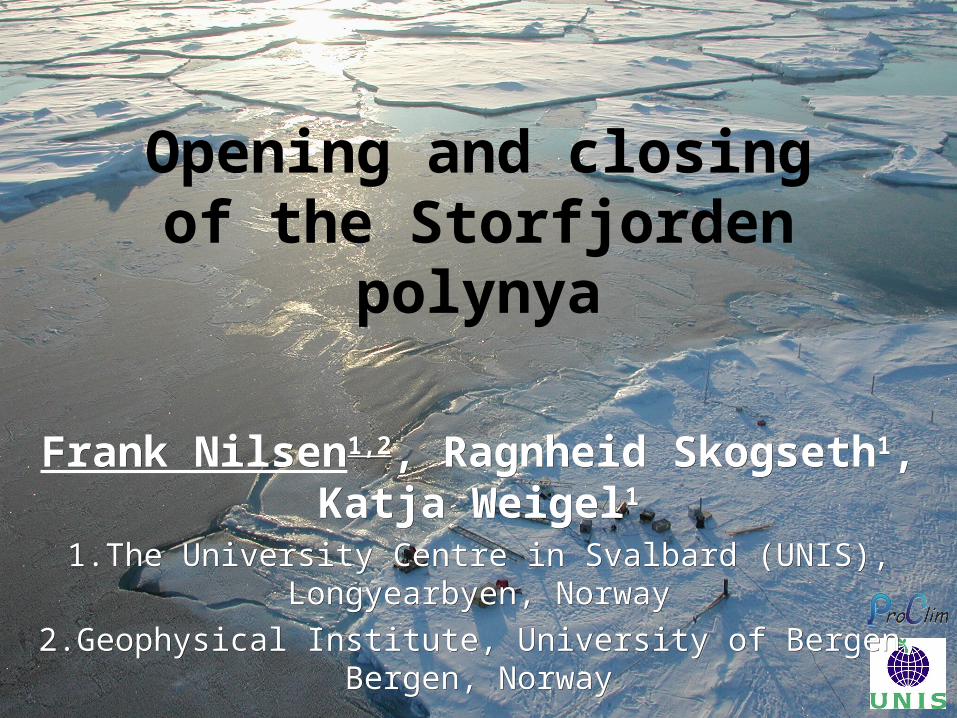
Opening and closing of the Storfjorden polynya
Frank NilsenFrank Nilsen1,21,2, Ragnheid Skogseth, Ragnheid Skogseth11, Katja Weigel, Katja Weigel11
1.The University Centre in Svalbard (UNIS), Longyearbyen, Norway1.The University Centre in Svalbard (UNIS), Longyearbyen, Norway
2.Geophysical Institute, University of Bergen, Bergen, Norway2.Geophysical Institute, University of Bergen, Bergen, Norway
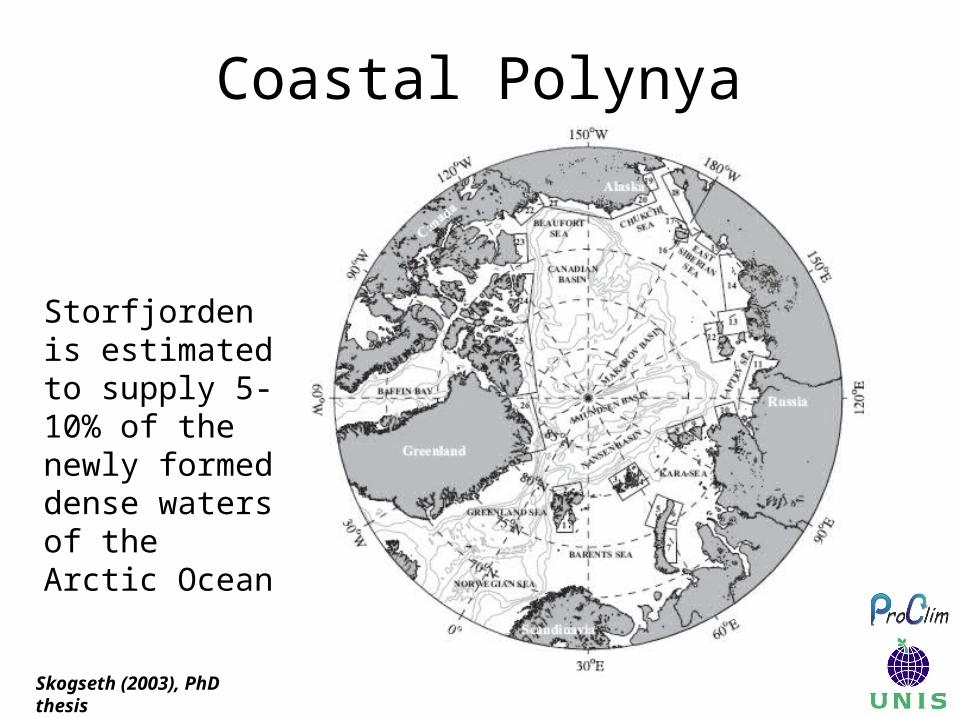
Coastal Polynya
Skogseth (2003), PhD thesis
Storfjorden is estimated to supply 5-10% of the newly formed dense waters of the Arctic Ocean
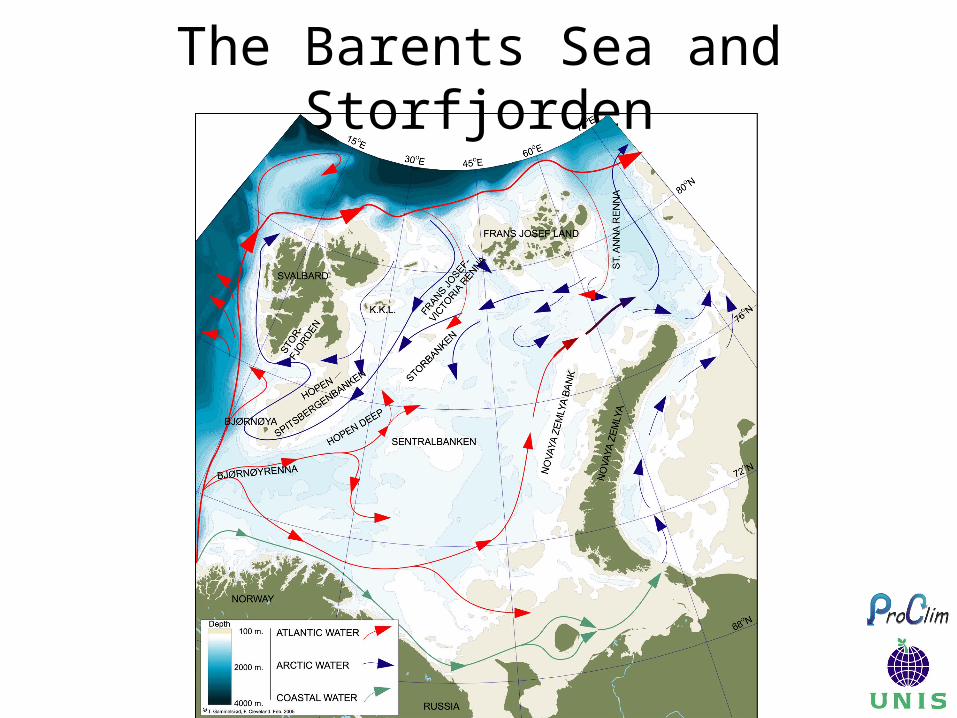
The Barents Sea and Storfjorden
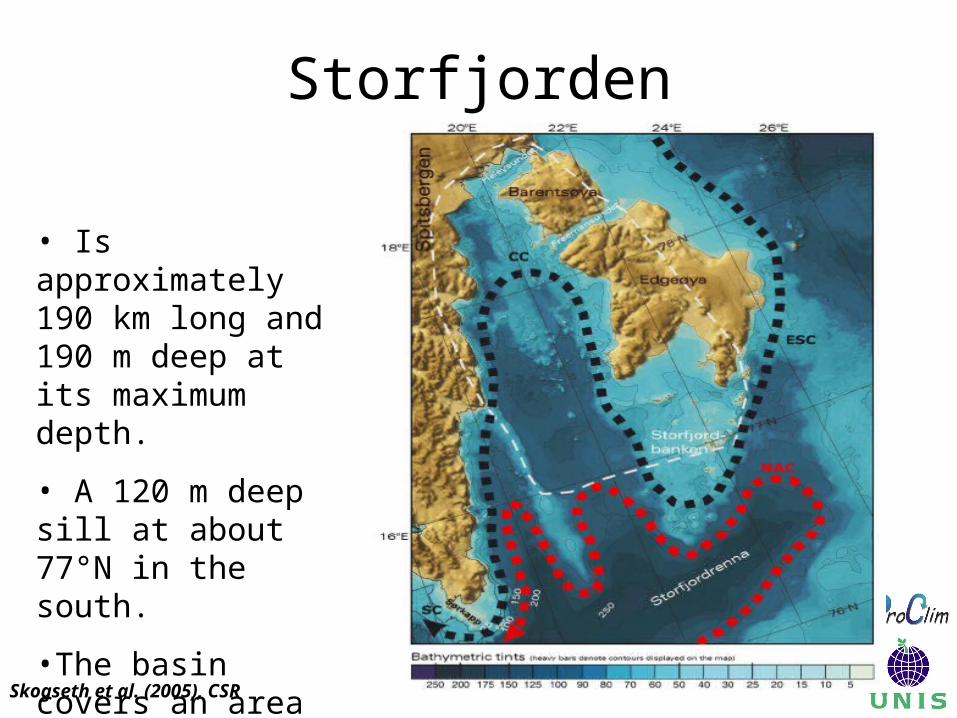
Storfjorden
Skogseth et al. (2005), CSR
• Is approximately 190 km long and 190 m deep at its maximum depth.
• A 120 m deep sill at about 77°N in the south.
•The basin covers an area of about 13·103 km2 with a volume of 8.5·1011 m3.
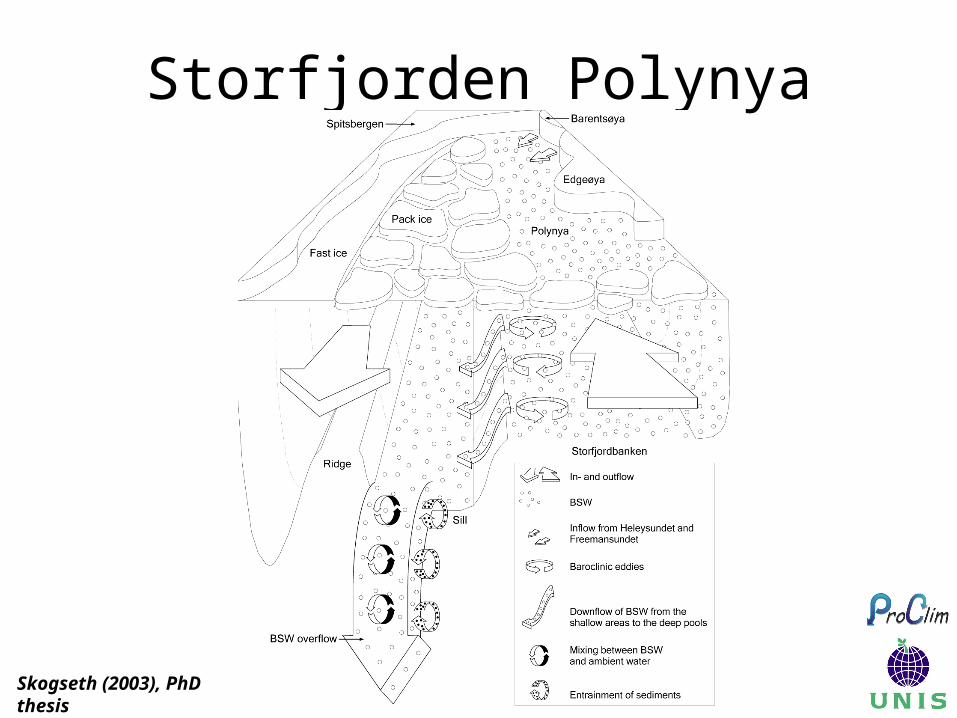
Storfjorden Polynya
Skogseth (2003), PhD thesis
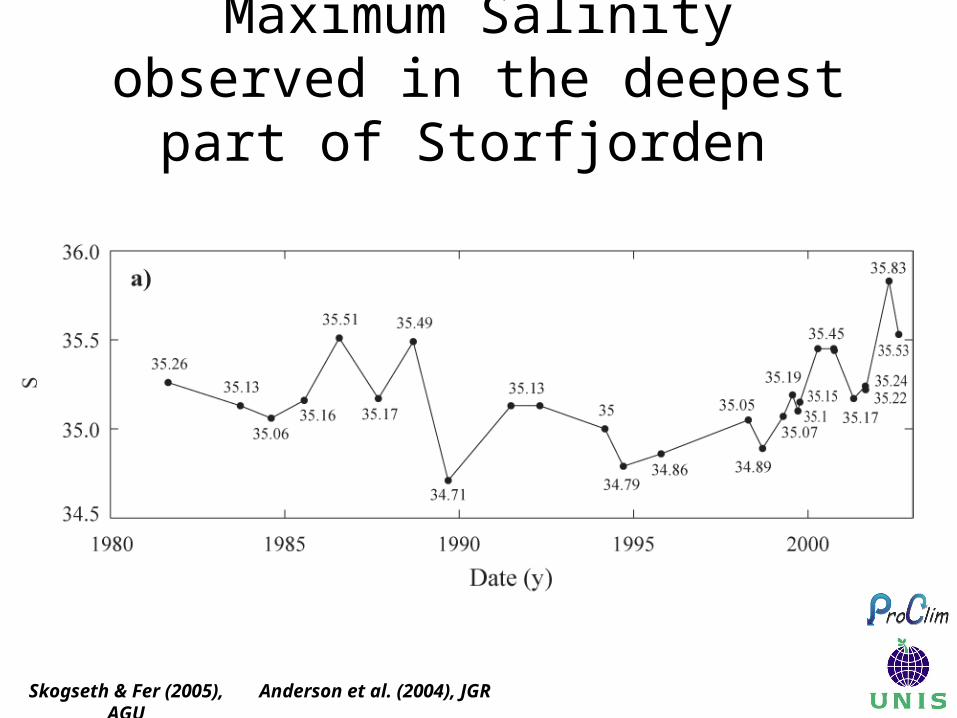
Maximum Salinity observed in the deepest part of Storfjorden
Skogseth & Fer (2005), AGU Anderson et al. (2004), JGR
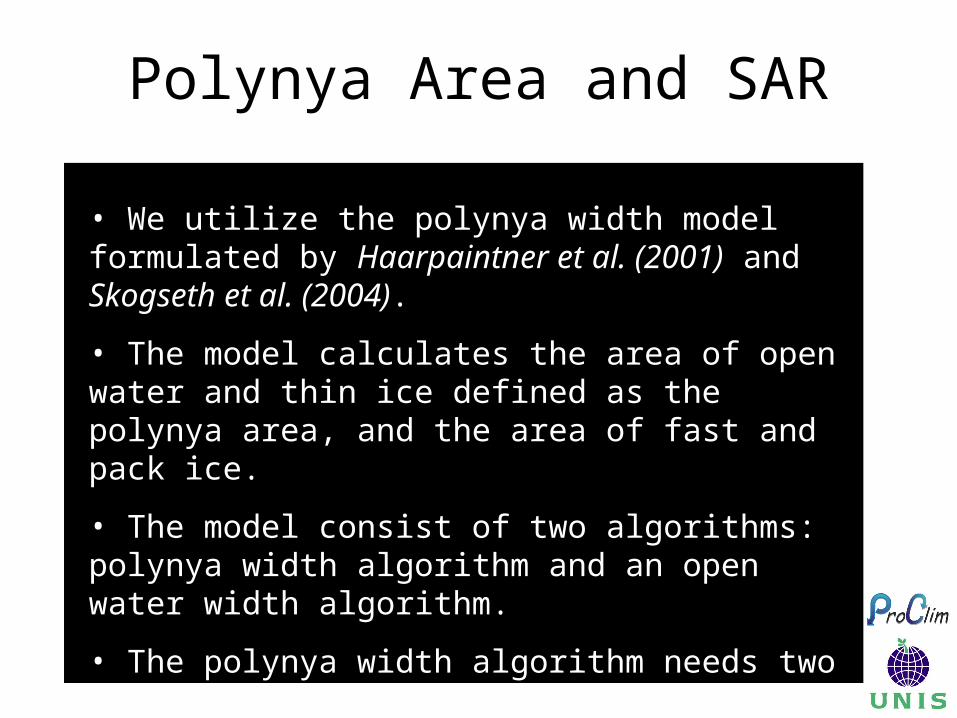
Polynya Area and SAR
• We utilize the polynya width model formulated by Haarpaintner et al. (2001) and Skogseth et al. (2004).
• The model calculates the area of open water and thin ice defined as the polynya area, and the area of fast and pack ice.
• The model consist of two algorithms: polynya width algorithm and an open water width algorithm.
• The polynya width algorithm needs two empirical factors as input: the opening (OF) and closing (CF) factors.
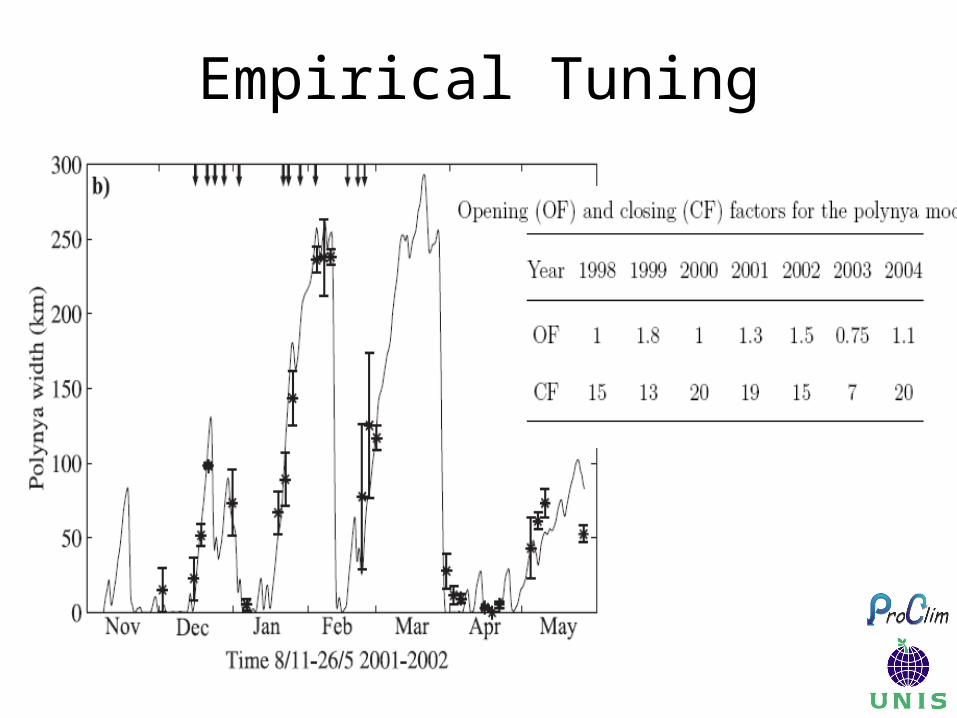
Empirical Tuning
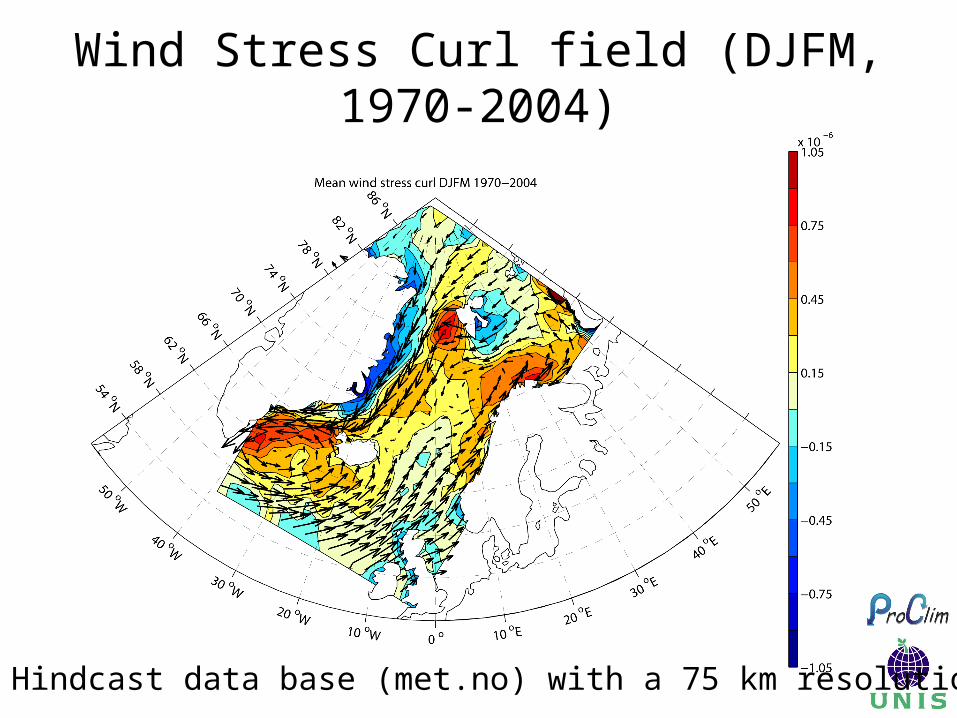
Wind Stress Curl field (DJFM, 1970-2004)
From the Hindcast data base (met.no) with a 75 km resolution
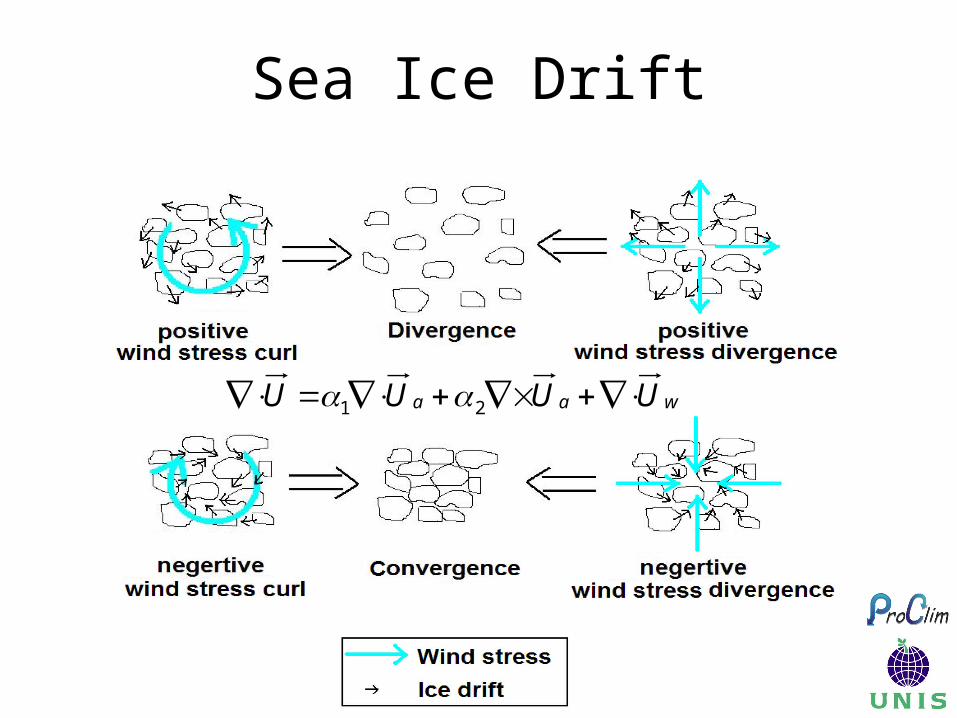
Sea Ice Drift
waa UUUU 21

DJFMA wind stress
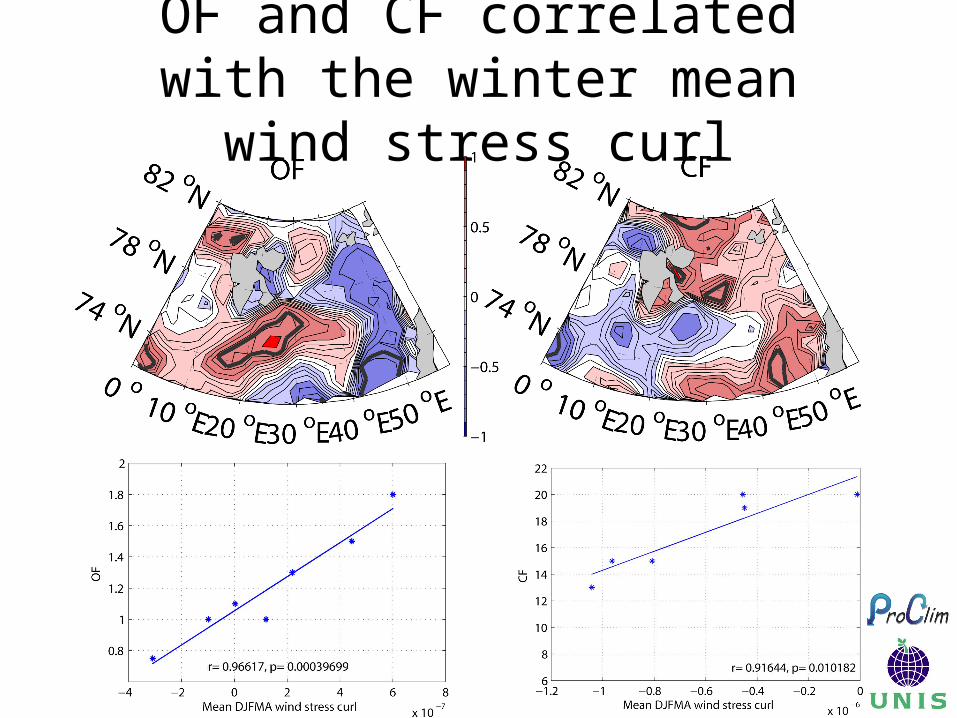
OF and CF correlated with the winter mean wind stress curl
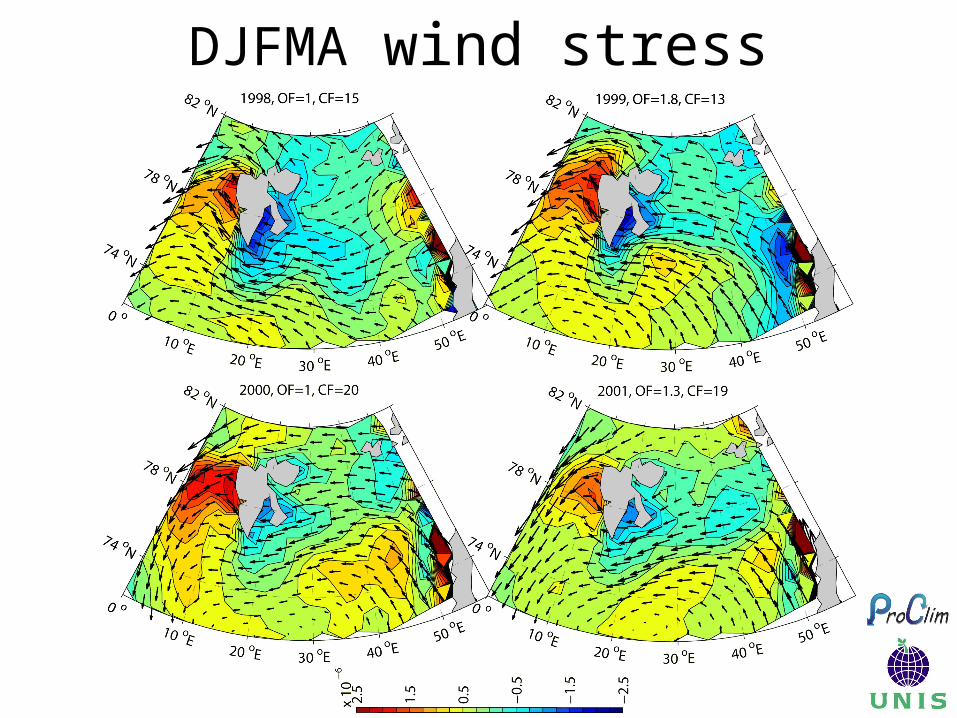
DJFMA wind stress
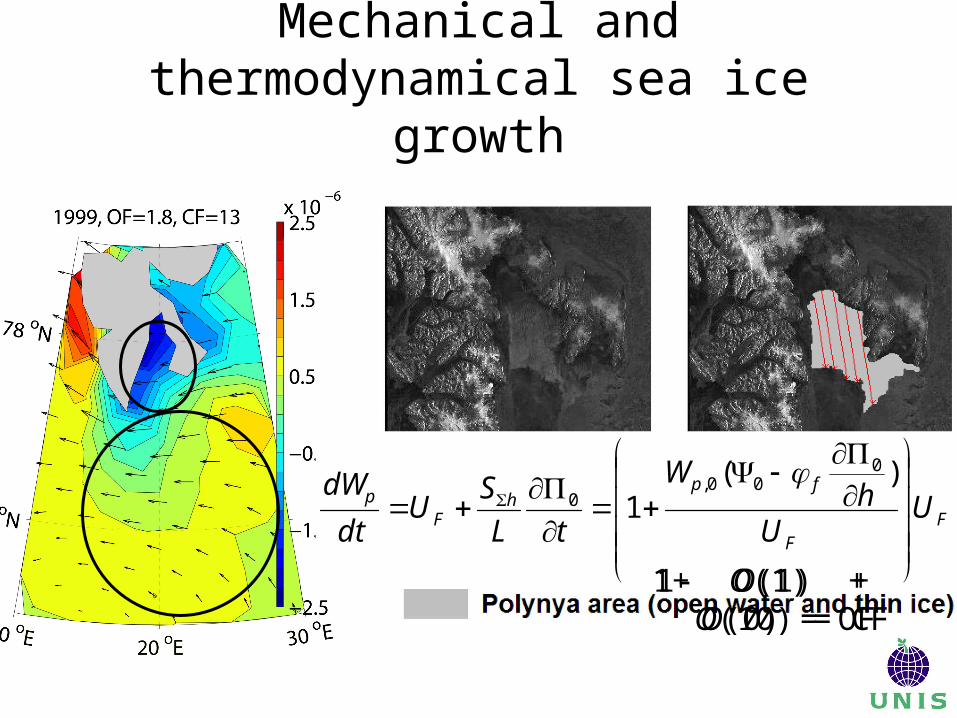
Mechanical and thermodynamical sea ice growth
FF
fph
Fp U
Uh
W
tL
SU
dt
dW
)(
1
000,
0
1- O(1) + O(10) = CF1+ O(1) + O(0) = OF
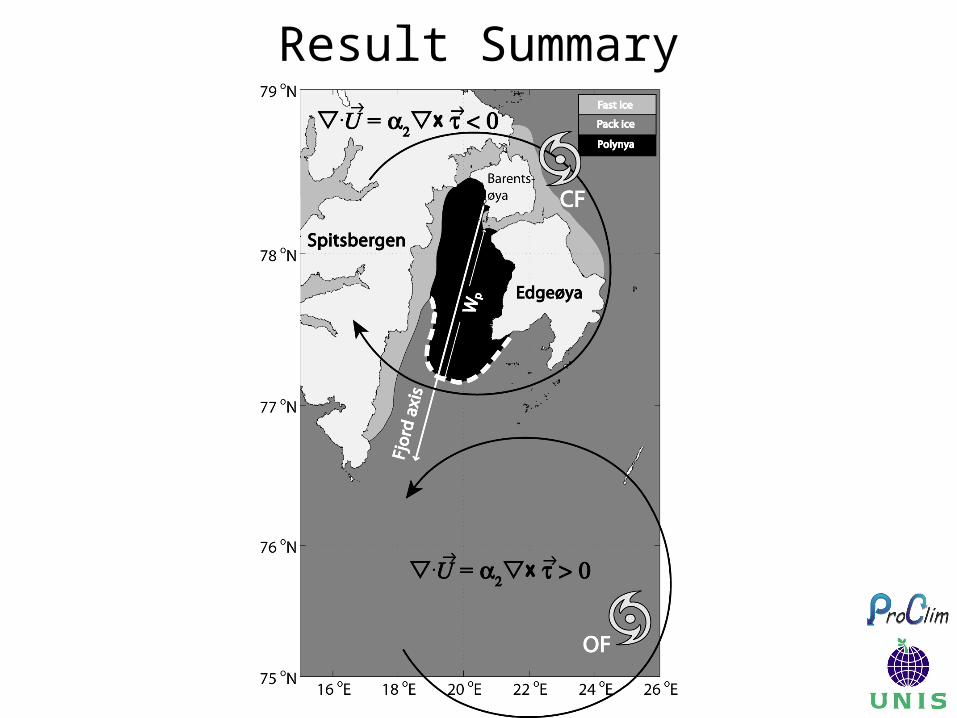
Result Summary
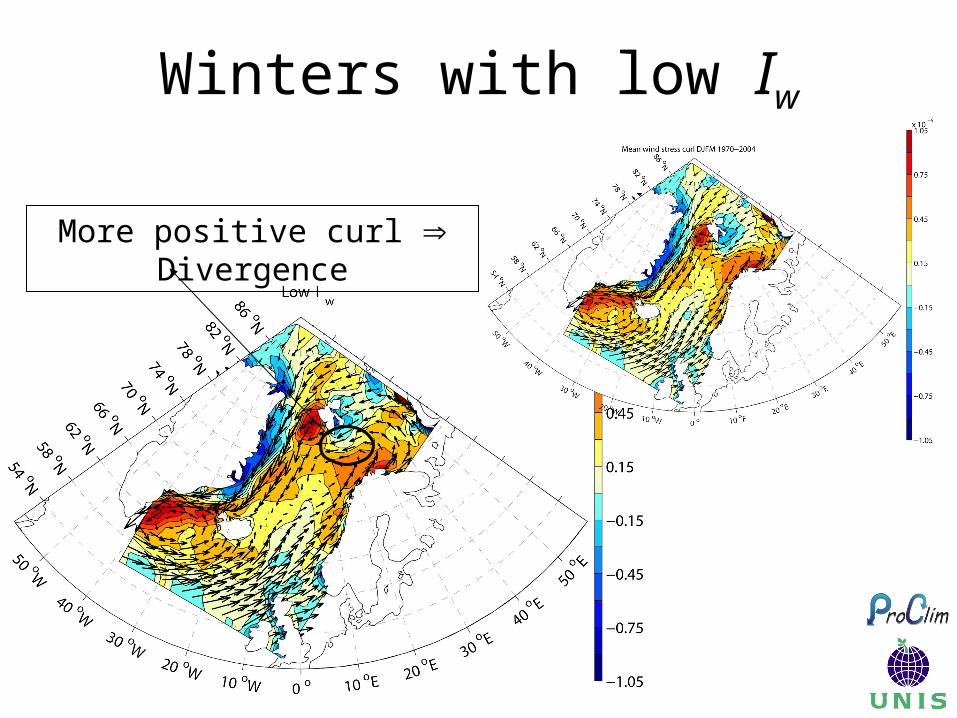
Winters with low Iw
More positive curl Divergence
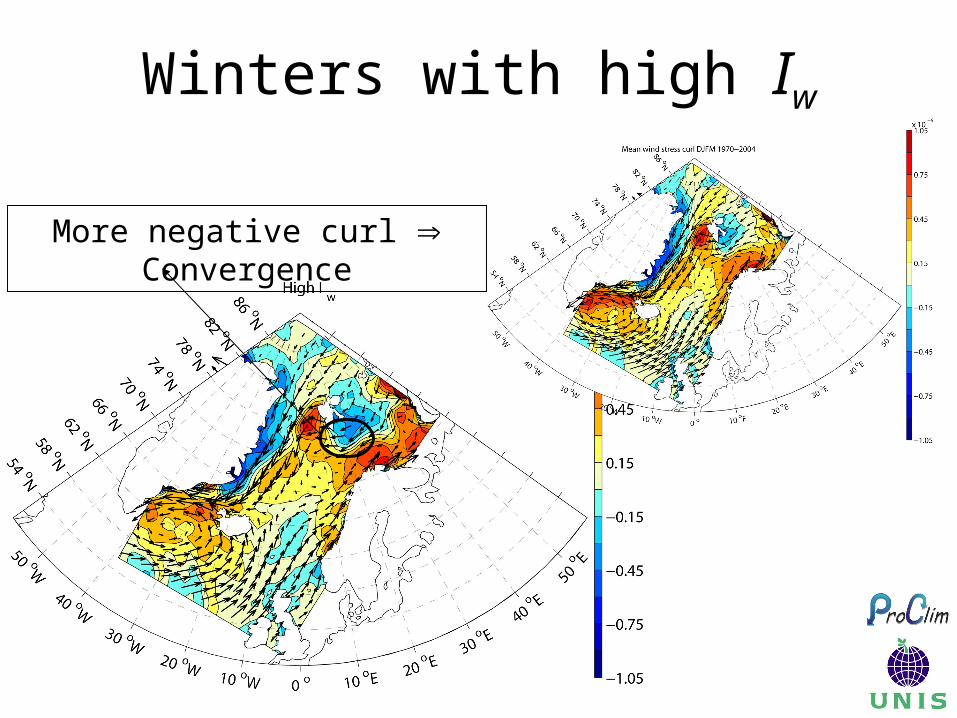
Winters with high Iw
More negative curl Convergence
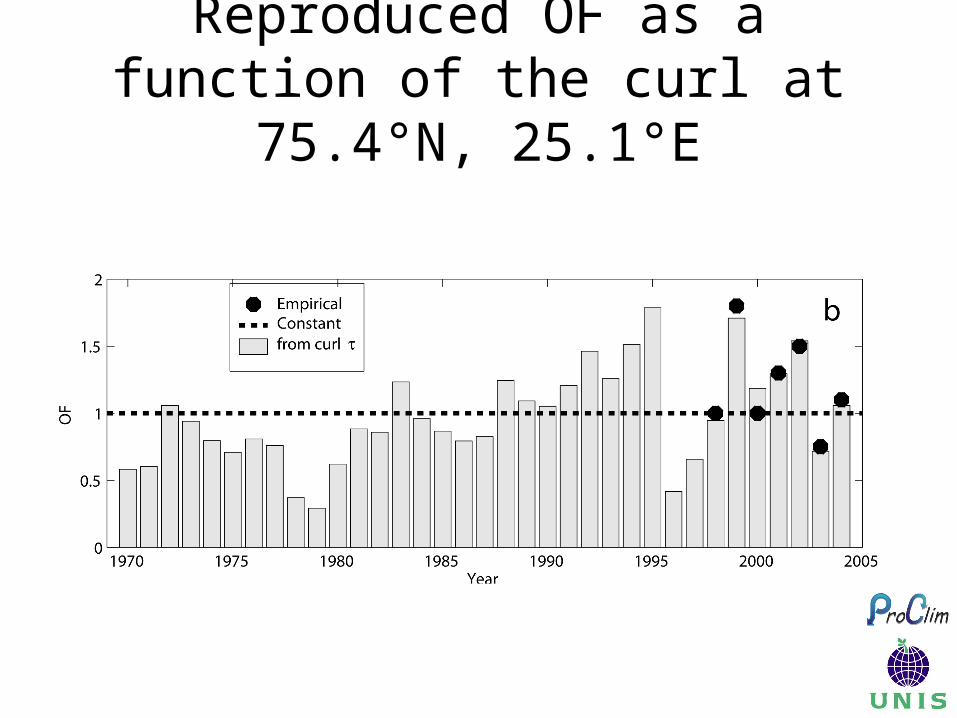
Reproduced OF as a function of the curl at 75.4°N, 25.1°E
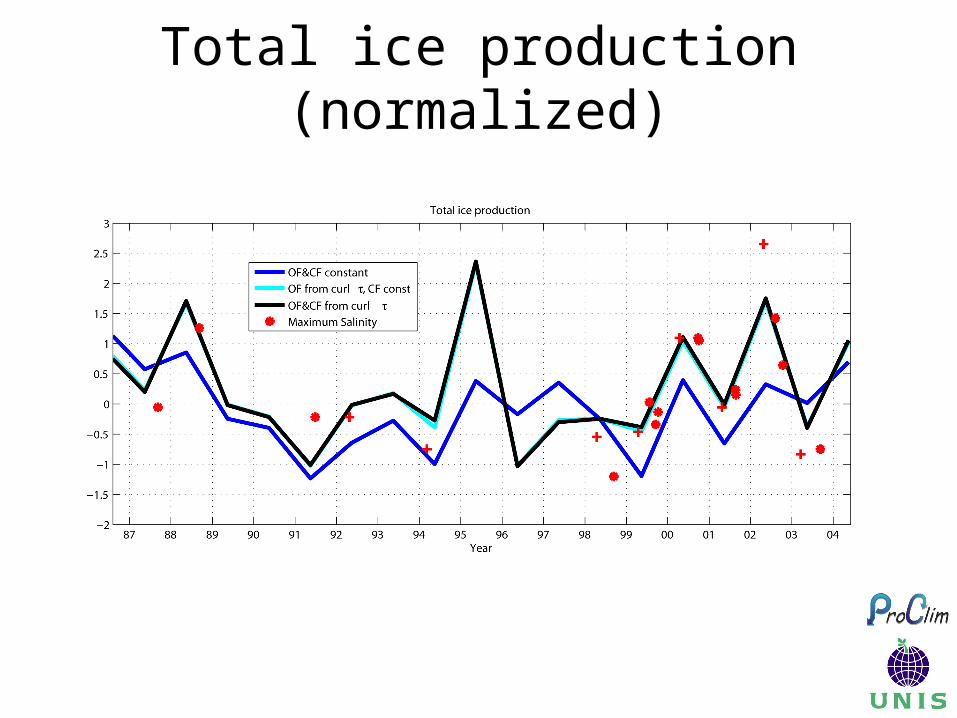
Total ice production (normalized)
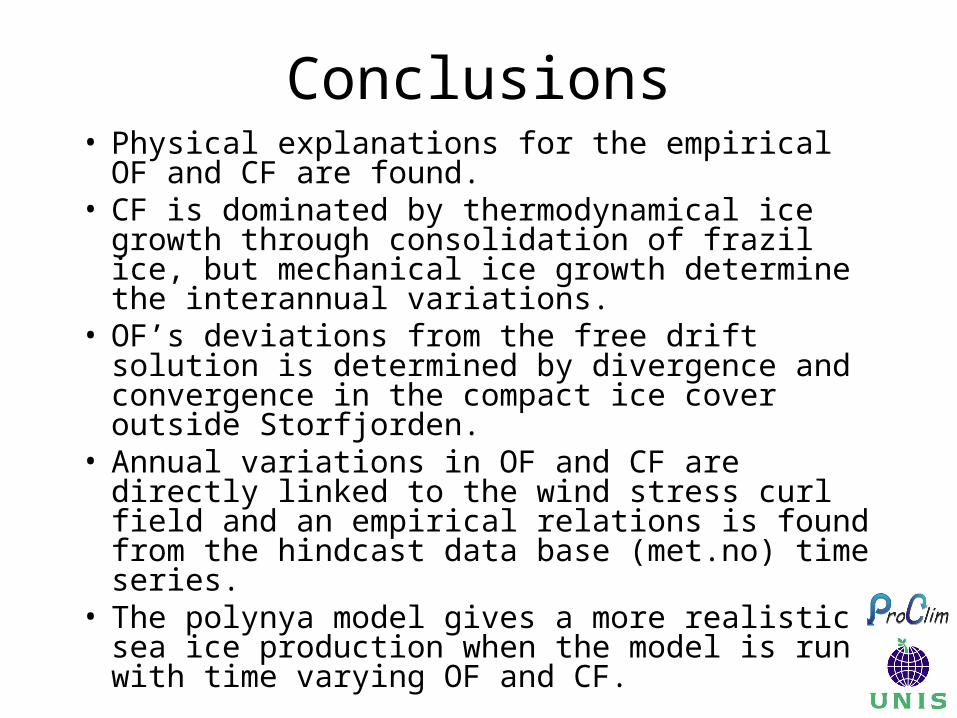
Conclusions• Physical explanations for the empirical OF and CF
are found.• CF is dominated by thermodynamical ice growth
through consolidation of frazil ice, but mechanical ice growth determine the interannual variations.
• OF’s deviations from the free drift solution is determined by divergence and convergence in the compact ice cover outside Storfjorden.
• Annual variations in OF and CF are directly linked to the wind stress curl field and an empirical relations is found from the hindcast data base (met.no) time series.
• The polynya model gives a more realistic sea ice production when the model is run with time varying OF and CF.
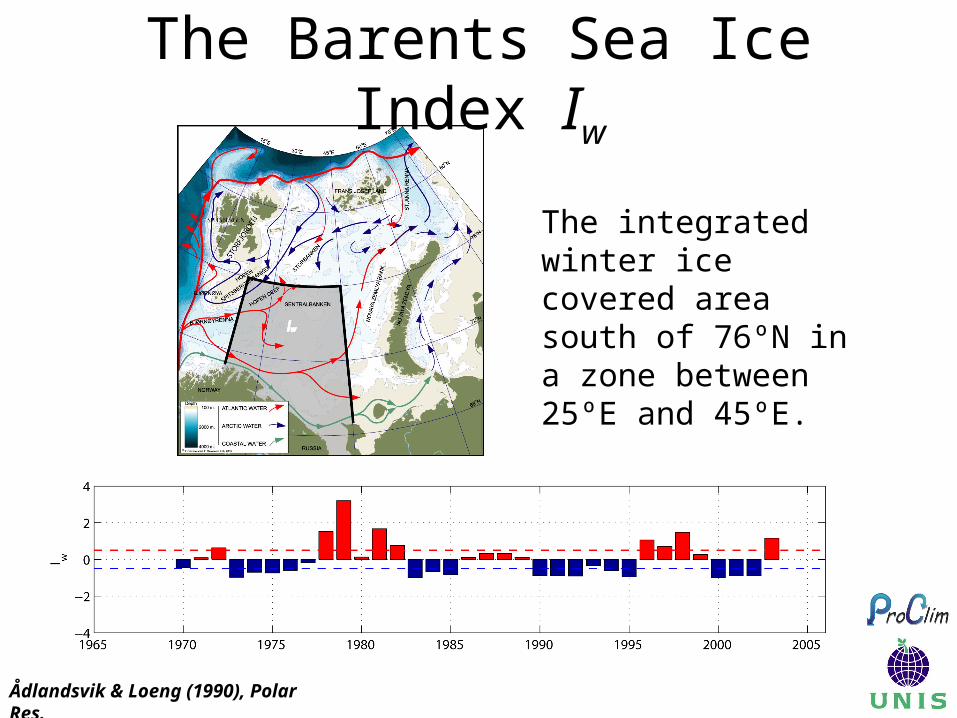
The Barents Sea Ice Index Iw
Ådlandsvik & Loeng (1990), Polar Res.
The integrated winter ice covered area south of 76ºN in a zone between 25ºE and 45ºE.
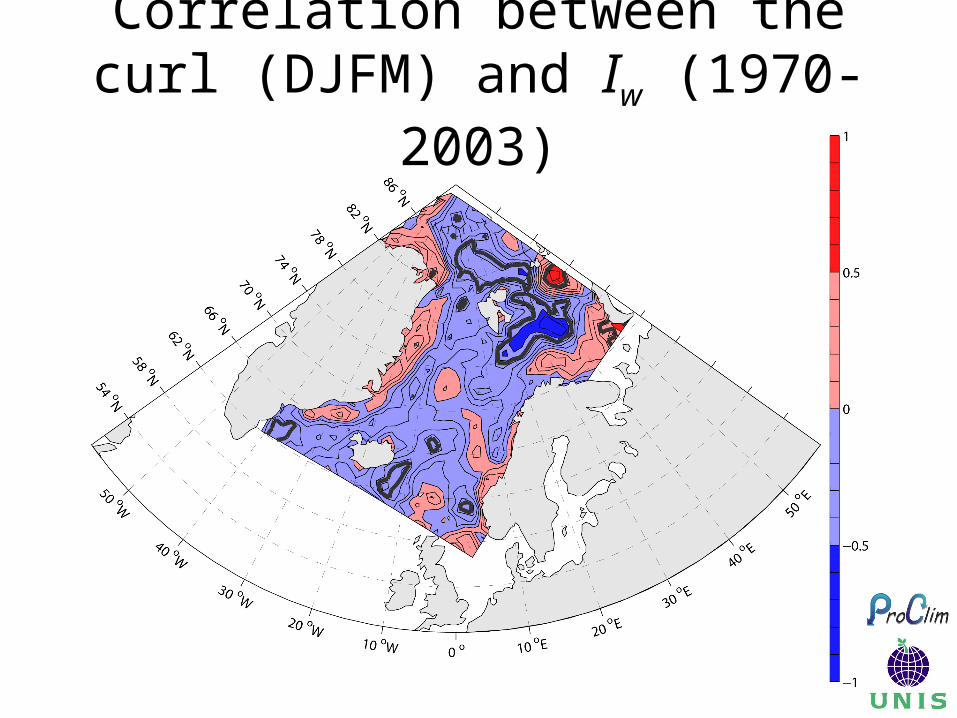
Correlation between the curl (DJFM) and Iw (1970-2003)


![Flux Modelling of Polynyas - University of Reading of Figures 1.1 Schematic of Sensible Heat polynya and Latent Heat polynya [16] 1 2.1 One Dimensional model diagram, adapted from](https://img.pdfslide.net/doc/110x75/5ab1681d7f8b9a6b468c7c20/flux-modelling-of-polynyas-university-of-reading-of-figures-11-schematic-of-sensible.jpg)