Embed Size (px)
Citation preview
OpenSwitch OPX Administration GuideRelease 2.1.0

2017 - 8
Rev. A02
Contents
1 Administration................................................................................................................................................ 4System utility commands ................................................................................................................................................. 4Default XML configuration files........................................................................................................................................5Operations...........................................................................................................................................................................5Maintenance....................................................................................................................................................................... 6Monitoring .......................................................................................................................................................................... 7Upgrade software image................................................................................................................................................... 7Boot different ONIE mode................................................................................................................................................ 8Puppet open source...........................................................................................................................................................8Nagios Open Source......................................................................................................................................................... 11
2 Troubleshooting............................................................................................................................................13Debug port interfaces...................................................................................................................................................... 13Layer 2 troubleshooting................................................................................................................................................... 13Layer 3 troubleshooting................................................................................................................................................... 14Log management.............................................................................................................................................................. 14Manage CPS API objects................................................................................................................................................ 16Password recovery........................................................................................................................................................... 17Port statistics.................................................................................................................................................................... 17
3 Linux management....................................................................................................................................... 18opx-config-fanout.............................................................................................................................................................18opx-chassis-beacon..........................................................................................................................................................19opx-config-switch.............................................................................................................................................................19opx-ethtool....................................................................................................................................................................... 20opx_logging_cli.................................................................................................................................................................22opx-show-alms................................................................................................................................................................. 22opx-show-env...................................................................................................................................................................22opx-show-packages.........................................................................................................................................................24opx-show-stats................................................................................................................................................................ 25opx-show-system-status................................................................................................................................................ 26opx-show-transceivers....................................................................................................................................................26opx-show-version.............................................................................................................................................................27opx-switch-log..................................................................................................................................................................27
Contents 3
AdministrationThis information covers tasks needed to properly maintain and upgrade the system running OpenSwitch OPX including system defaults, configuring interfaces, installing Linux packages, logging, and upgrades.
System defaults
When the system boots up, default system configuration is applied:
• All Linux interfaces are created and mapped to physical ports.
• All Linux interfaces are in an Administratively Down state.
• The Management interface is eth0, and the management IP address is dynamically assigned using DHCP.
• OpenSwitch OPX processes are activated after system boot up (see Run-time components in the OpenSwitch OPX Developers Guide for a list of processes).
• ACL entries are installed to direct control plane packets for protocols (such as LLDP and OSPF) directly to interfaces associated with physical ports (see Default XML configuration files for a list of ACL entries).
• QoS initialization sets up the default scheduler hierarchy and maps all packets to Queue 0.
Remote access
Access the system remotely via SSH, and ensure that the IP address of the Management interface is configured. By default, SSH service is enabled. The user name and password are both admin.
$ ssh admin@management_ipaddress
Topics:
• System utility commands
• Default XML configuration files
• Operations
• Maintenance
• Monitoring
• Upgrade software image
• Boot different ONIE mode
• Puppet open source
• Nagios Open Source
System utility commands • opx-config-fanout — enable or disable interface fan-out on a specific port (see opx-config-fanout)
• opx-chassis-beacon — toggle the port LED of an interface to easily identify each time a beacon is sent to check for pending packets on the interface (see opx-chassis-beacon)
• opx-config-switch — reconfigure the MAC age-time and view current switch values (see opx-config-switch)
• opx-ethtool — display statistics and media information from a Linux interface which maps to a physical port (see opx-ethtool)
• opx_logging_cli — enable logging for OpenSwitch OPX (see opx_logging_cli)
• opx-show-alms — display current alarms (see opx-show-alms)
1
4 Administration
• opx-show-env — display environmental system components such as temperature, fan, and voltage (see opx-show-env)
• opx-show-packages — display specific information for each package installed (see opx-show-packages)
• opx-show-stats — display detailed port and VLAN statistics (see opx-show-stats)
• opx-show-system-status — display system status information (see opx-show-system-status)
• opx-show-transceivers — display information about the current transceiver types (see opx-show-transceivers)
• opx-show-version — display OpenSwitch OPX software version information (see opx-show-version)
• opx-switch-log — enable SAI-specific logging (see opx-switch-log)
Default XML configuration filesXML configuration files are used for setting configuration defaults. Modify these files according to your network needs.
CAUTION: Modifying configuration files may negatively affect the default system behavior.
• base_qos_init.xml — default QoS entries applied to the NPU during system bootup as part of the systemd service (file is stored in /etc/opx/base_qos_init.xml)
• base_port_physical_mapping_table.xml — mapping between physical ports and Linux interfaces, and all interfaces created during system boot up (file is stored in /etc/opx/base_port_physical_mapping_table.xml)
• config.xml — configuration parameters for the PAS (file is stored in /etc/opx/pas/config.xml)
• device.xml — platform hardware description (file is stored in /etc/opx/sdi/device.xml)
• dn_nas_default_init_config.xml — default configuration of objects, such as mirroring, sFlow, and VLANs created during system boot up as part of the systemd service (file is stored in /etc/opx/dn_nas_default_init_config.xml)
• dn_nas_fanout_init_config.xml — interfaces fanned out during system boot up (file is stored in /etc/opx/dn_nas_fanout_init_config.xml)
• entity.xml — platform hardware entity resource association (file is stored in /etc/opx/sdi/entity.xml)
• env_tmpctl_config.xml — environmental parameters, such as sensor names and the algorithm for the temperature control module (file is stored in /etc/opx/env-tmpctl/config.json)
• init.xml — NPU-related settings during system boot up, such as physical port settings and hashing algorithms (file is stored in /etc/opx/sai/init.xml)
• mac_address_alloc.xml — MAC allocation for interfaces (file is stored in /etc/opx/mac_address_alloc.xml)
• nas_master_list.xml — all ACL entries installed during boot up (file is stored in /etc/opx/acl/nas_master_list.xml)
• nas_detail_list.xml — all fields for ACL entries in the nas_master_list.xml file (file is stored in /etc/opx/acl/nas_detail_list.xml)
• phy_media_default_npu_setting.xml — transceiver information, such as transceiver type and speed (file is stored in /etc/opx/phy_media_default_npu_setting.xml)
OperationsThis information describes the configuration required for OpenSwitch OPX operation.
Configure Management interface IP address
Edit the /etc/network/interfaces file to configure the management IP address.
$ cat /etc/network/interfaces# interfaces(5) file used by ifup(8) and ifdown(8)# Include files from /etc/network/interfaces.d:auto eth0 iface eth0 inet static address 10.11.133.40 netmask 255.255.0.0 gateway 10.11.133.254$ service networking restart
Secure Management interface
Administration 5
If extra security is desired other than what is provided by SSH, use iptables to enable Linux firewall features. You can also set up rate
limiting for incoming traffic to prevent denial of service attacks.
Configure physical port
See the OpenSwitch OPX Configuration Guide to configure physical port attributes.
Create user accounts
Use standard Linux commands to manage user accounts. Example Linux commands include useradd, userdel, usermod, and passwd.
Configure access privileges with the usermod command.
Configure date and time
Use the date command or NTP to configure the date and time.
$ date -s "16 FEB 2016 13:12:00"Tue Feb 16 13:12:00 UTC 2016
MaintenanceThis information describes how to manage Linux packages and system services.
Manage Linux packages
Use standard Linux utilities to manage Linux packages. These utilities provide a simple way to retrieve and install packages from multiple sources using the Linux command line.
Before installing a package, you must first configure the IP address of the Management port (see Operations).
NOTE: Ensure that the URLs in the sources list configuration files point to the proper repository before installing a Linux package.
Use the apt-get update command before installing a package, and use the dpkg —s package_name command to check the
installation status of a particular package.
System services
To check the status of a service, use the service service_name status command to check if the service is up and running, or
inactive.
Check service status
$ service snmpd status snmpd.service - LSB: SNMP agents Loaded: loaded (/etc/init.d/snmpd) Active: active (running) since Wed 2016-02-17 02:16:06 UTC; 2h 39min ago CGroup: /system.slice/snmpd.service └─930 /usr/sbin/snmpd -Lsd -Lf /dev/null -u snmp -g snmp -I -smux ...
Stop service
$ service snmpd stop$ service snmpd status snmpd.service - LSB: SNMP agents Loaded: loaded (/etc/init.d/snmpd) Active: inactive (dead) since Wed 2016-02-17 05:00:27 UTC; 3s ago Process: 3370 ExecStop=/etc/init.d/snmpd stop (code=exited, status=0/SUCCESS)
6 Administration
Start service
$ service snmpd start$ service snmpd status snmpd.service - LSB: SNMP agents Loaded: loaded (/etc/init.d/snmpd) Active: active (running) since Wed 2016-02-17 05:00:39 UTC; 1s ago Process: 3370 ExecStop=/etc/init.d/snmpd stop (code=exited, status=0/SUCCESS) Process: 3395 ExecStart=/etc/init.d/snmpd start (code=exited, status=0/SUCCESS) CGroup: /system.slice/snmpd.service └─3399 /usr/sbin/snmpd -Lsd -Lf /dev/null -u snmp -g snmp -I -smux...
Restart service
$ service snmpd restart$ service snmpd status snmpd.service - LSB: SNMP agents Loaded: loaded (/etc/init.d/snmpd) Active: active (running) since Wed 2016-02-17 05:00:46 UTC; 1s ago Process: 3407 ExecStop=/etc/init.d/snmpd stop (code=exited, status=0/SUCCESS) Process: 3412 ExecStart=/etc/init.d/snmpd start (code=exited, status=0/SUCCESS) CGroup: /system.slice/snmpd.service └─3416 /usr/sbin/snmpd -Lsd -Lf /dev/null -u snmp -g snmp -I -smux...
Monitoring OpenSwitch OPX supports network monitoring features to monitor and capture network traffic in the system. It also provides tools to collect port and VLAN statistics and port media information.
System alarms
System alarms alert you to conditions that might prevent normal operation of the switch—ranked by their impact on the network. The following shows the range of alarms—from alarms that have the most impact to alarms that have the least impact on the network:
• Critical — critical condition exists and requires immediate action. A critical alarm may be triggered if one or more hardware components has failed, or one or more hardware components has exceeded temperature thresholds.
• Major — major error occurred and requires escalation or notification. A major alarm may be triggered if an interface configuration has triggered a critical warning—such as a port-channel being down.
• Minor — minor error or non-critical condition occurred that, if left unchecked, might cause system interruption in service or degradation in performance. A minor alarm requires monitoring or maintenance.
• Informational — informational error occurred which does not impact performance. An information alarm should be monitored until the condition changes.
Once an alarm is active, it has one of these states:
• Active — alarms that are current and not yet acknowledged or cleared
• Cleared — alarms that are resolved and the device has returned to normal operation
Some alarms go directly from active to cleared state and require little to no administrative effort. Other alarms with a high severity should be acknowledged or investigated.
Show alarms
$ opx-show-alms2017-07-13 13:31:12.170129 Fan tray 1 absent2017-07-13 13:34:09.012345 Temperature sensor NPU sensor warning
Upgrade software imageRelease images are ONIE installers that contain a software image. See the OpenSwitch OPX Installation Guide for complete information on using ONIE to upgrade the software image.
Administration 7
Boot different ONIE modeYou can boot a software image from the Linux shell (in OPX runtime) into ONIE.
1 Change the next boot to ONIE using Grub.
$ sudo grub-reboot --boot-directory=/mnt/boot ONIE2 Change ONIE mode to Install, Rescue or Uninstall mode.
$ sudo /mnt/onie-boot/onie/tools/bin/onie-boot-mode -o install$ sudo /mnt/onie-boot/onie/tools/bin/onie-boot-mode -o rescue$ sudo /mnt/onie-boot/onie/tools/bin/onie-boot-mode -o uninstall
3 Reboot the switch.
$ sudo reboot
Next boot to ONIE Install mode
$ sudo grub-reboot --boot-directory=/mnt/boot ONIE$ sudo /mnt/onie-boot/onie/tools/bin/onie-boot-mode -o install$ sudo reboot
...
Booting `ONIE: Install OS'
ONIE: OS Install Mode ...Version : 3.21.1.1Build Date: 2015-03-17T12:32-0700Info: Mounting kernel filesystems... done.Info: Mounting LABEL=ONIE-BOOT on /mnt/onie-boot ...Info: Using eth0 MAC address: 34:17:eb:f2:57:c4Info: Using eth1 MAC address: 34:17:eb:f2:57:c5Info: eth0: Checking link... scsi 6:0:0:0: Direct-Access Generic Flash Disk 8.07 PQ: 0 ANSI: 4sd 6:0:0:0: [sdb] 15728640 512-byte logical blocks: (8.05 GB/7.50 GiB)sd 6:0:0:0: [sdb] Write Protect is offsd 6:0:0:0: [sdb] Write cache: disabled, read cache: enabled, doesn't support DPO or FUAsd 6:0:0:0: [sdb] Attached SCSI removable diskup.Info: Trying DHCPv4 on interface: eth0...
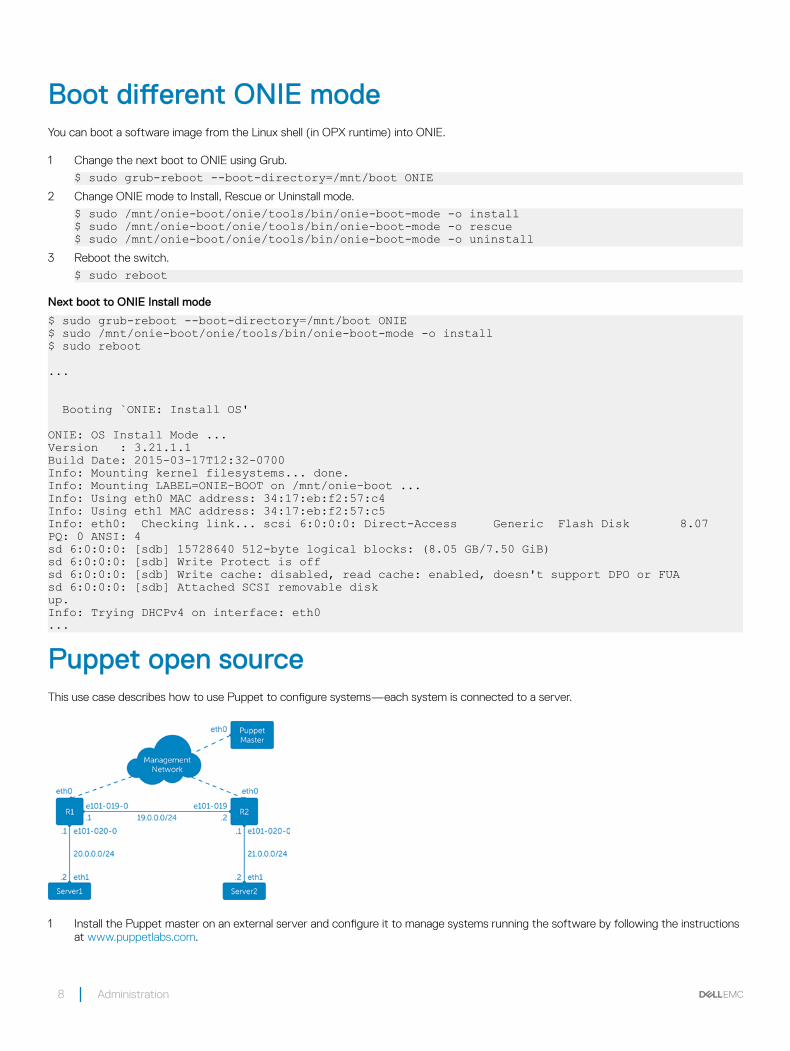
Puppet open sourceThis use case describes how to use Puppet to configure systems—each system is connected to a server.
1 Install the Puppet master on an external server and configure it to manage systems running the software by following the instructions at www.puppetlabs.com.
8 Administration
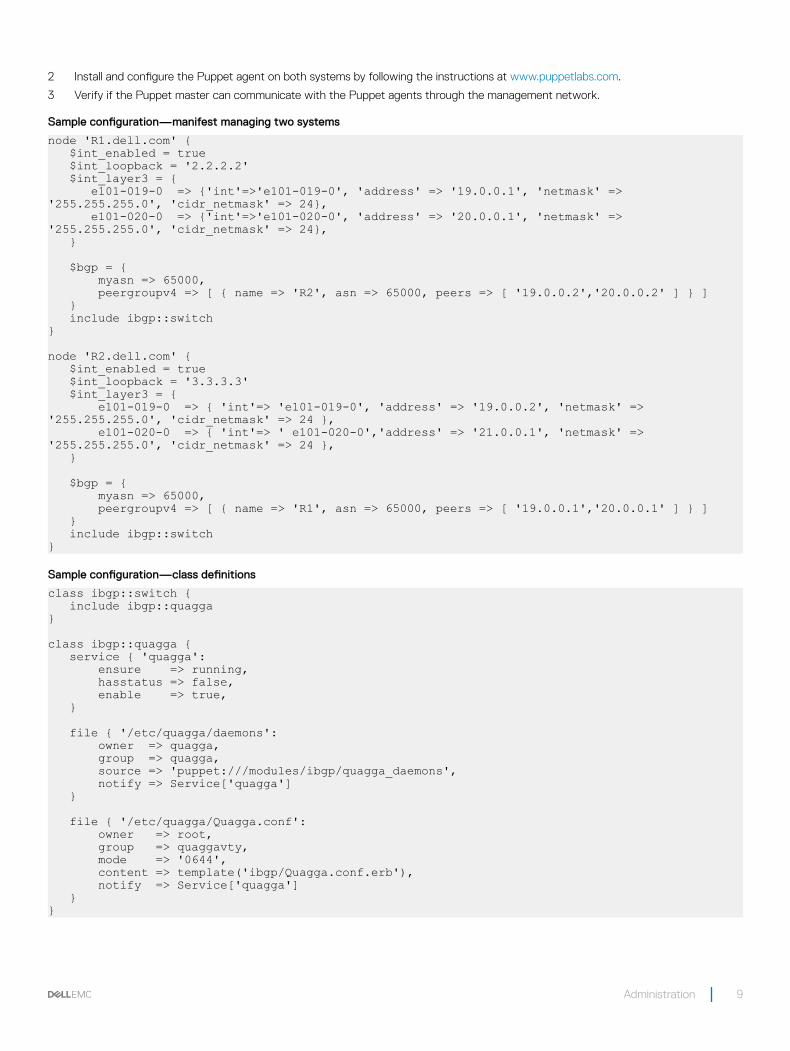
2 Install and configure the Puppet agent on both systems by following the instructions at www.puppetlabs.com.
3 Verify if the Puppet master can communicate with the Puppet agents through the management network.
Sample configuration—manifest managing two systems
node 'R1.dell.com' { $int_enabled = true $int_loopback = '2.2.2.2' $int_layer3 = { e101-019-0 => {'int'=>'e101-019-0', 'address' => '19.0.0.1', 'netmask' => '255.255.255.0', 'cidr_netmask' => 24}, e101-020-0 => {'int'=>'e101-020-0', 'address' => '20.0.0.1', 'netmask' => '255.255.255.0', 'cidr_netmask' => 24}, }
$bgp = { myasn => 65000, peergroupv4 => [ { name => 'R2', asn => 65000, peers => [ '19.0.0.2','20.0.0.2' ] } ] } include ibgp::switch}
node 'R2.dell.com' { $int_enabled = true $int_loopback = '3.3.3.3' $int_layer3 = { e101-019-0 => { 'int'=> 'e101-019-0', 'address' => '19.0.0.2', 'netmask' => '255.255.255.0', 'cidr_netmask' => 24 }, e101-020-0 => { 'int'=> ' e101-020-0','address' => '21.0.0.1', 'netmask' => '255.255.255.0', 'cidr_netmask' => 24 }, }
$bgp = { myasn => 65000, peergroupv4 => [ { name => 'R1', asn => 65000, peers => [ '19.0.0.1','20.0.0.1' ] } ] } include ibgp::switch}
Sample configuration—class definitions
class ibgp::switch { include ibgp::quagga}
class ibgp::quagga { service { 'quagga': ensure => running, hasstatus => false, enable => true, }
file { '/etc/quagga/daemons': owner => quagga, group => quagga, source => 'puppet:///modules/ibgp/quagga_daemons', notify => Service['quagga'] }
file { '/etc/quagga/Quagga.conf': owner => root, group => quaggavty, mode => '0644', content => template('ibgp/Quagga.conf.erb'), notify => Service['quagga'] }}
Administration 9
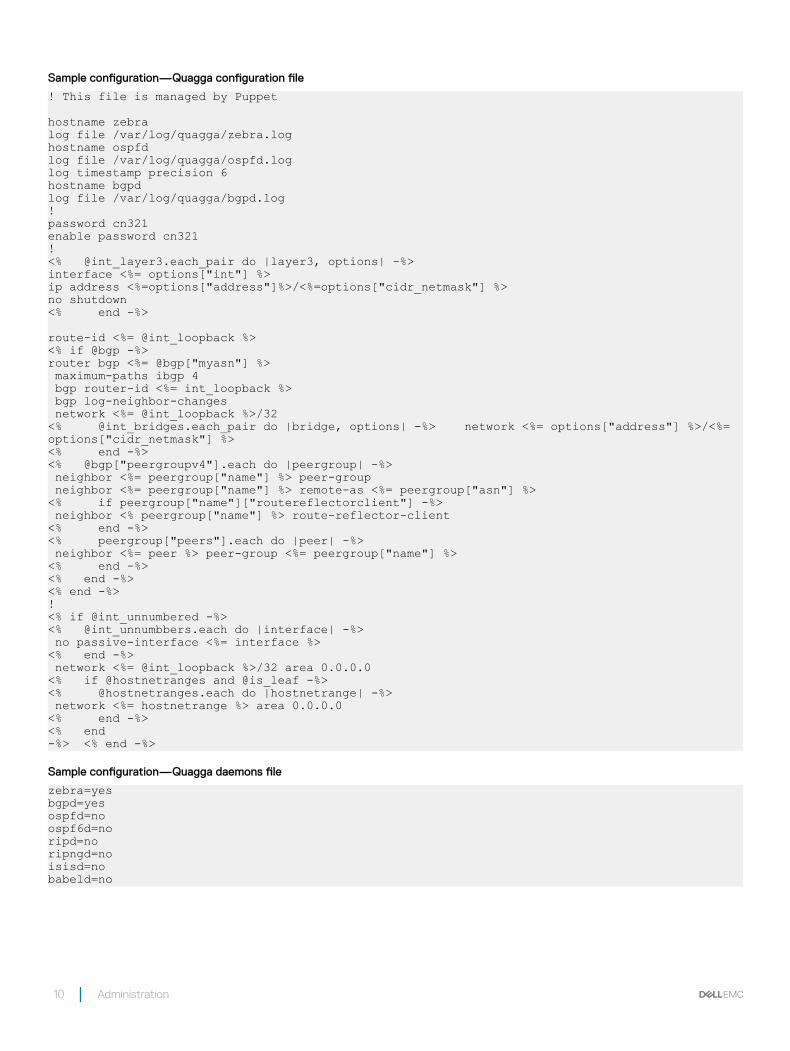
Sample configuration—Quagga configuration file
! This file is managed by Puppet
hostname zebralog file /var/log/quagga/zebra.loghostname ospfdlog file /var/log/quagga/ospfd.loglog timestamp precision 6hostname bgpdlog file /var/log/quagga/bgpd.log!password cn321enable password cn321!<% @int_layer3.each_pair do |layer3, options| -%>interface <%= options["int"] %>ip address <%=options["address"]%>/<%=options["cidr_netmask"] %>no shutdown<% end -%>
route-id <%= @int_loopback %><% if @bgp -%>router bgp <%= @bgp["myasn"] %> maximum-paths ibgp 4 bgp router-id <%= int_loopback %> bgp log-neighbor-changes network <%= @int_loopback %>/32<% @int_bridges.each_pair do |bridge, options| -%> network <%= options["address"] %>/<%= options["cidr_netmask"] %><% end -%><% @bgp["peergroupv4"].each do |peergroup| -%> neighbor <%= peergroup["name"] %> peer-group neighbor <%= peergroup["name"] %> remote-as <%= peergroup["asn"] %><% if peergroup["name"]["routereflectorclient"] -%> neighbor <% peergroup["name"] %> route-reflector-client<% end -%><% peergroup["peers"].each do |peer| -%> neighbor <%= peer %> peer-group <%= peergroup["name"] %><% end -%><% end -%><% end -%>!<% if @int_unnumbered -%><% @int_unnumbbers.each do |interface| -%> no passive-interface <%= interface %><% end -%> network <%= @int_loopback %>/32 area 0.0.0.0<% if @hostnetranges and @is_leaf -%><% @hostnetranges.each do |hostnetrange| -%> network <%= hostnetrange %> area 0.0.0.0<% end -%><% end-%> <% end -%>
Sample configuration—Quagga daemons file
zebra=yesbgpd=yesospfd=noospf6d=noripd=noripngd=noisisd=nobabeld=no
10 Administration
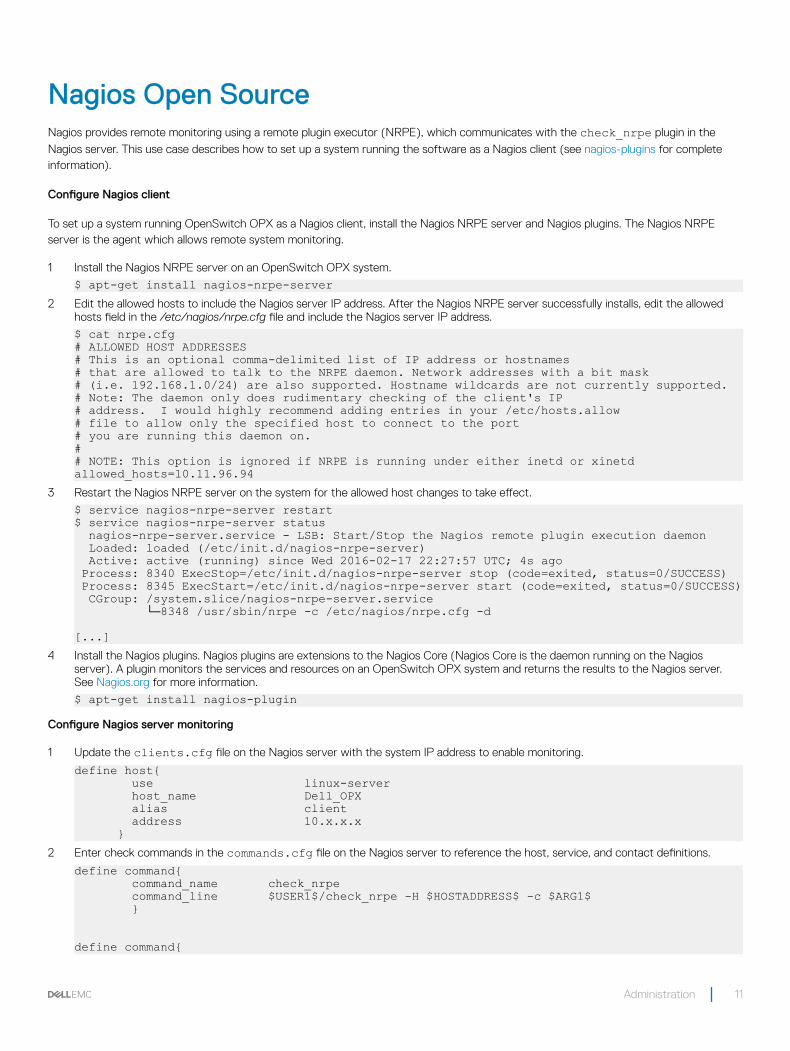
Nagios Open SourceNagios provides remote monitoring using a remote plugin executor (NRPE), which communicates with the check_nrpe plugin in the
Nagios server. This use case describes how to set up a system running the software as a Nagios client (see nagios-plugins for complete information).
Configure Nagios client
To set up a system running OpenSwitch OPX as a Nagios client, install the Nagios NRPE server and Nagios plugins. The Nagios NRPE server is the agent which allows remote system monitoring.
1 Install the Nagios NRPE server on an OpenSwitch OPX system.
$ apt-get install nagios-nrpe-server2 Edit the allowed hosts to include the Nagios server IP address. After the Nagios NRPE server successfully installs, edit the allowed
hosts field in the /etc/nagios/nrpe.cfg file and include the Nagios server IP address.
$ cat nrpe.cfg# ALLOWED HOST ADDRESSES# This is an optional comma-delimited list of IP address or hostnames# that are allowed to talk to the NRPE daemon. Network addresses with a bit mask# (i.e. 192.168.1.0/24) are also supported. Hostname wildcards are not currently supported.# Note: The daemon only does rudimentary checking of the client's IP# address. I would highly recommend adding entries in your /etc/hosts.allow# file to allow only the specified host to connect to the port# you are running this daemon on.## NOTE: This option is ignored if NRPE is running under either inetd or xinetdallowed_hosts=10.11.96.94
3 Restart the Nagios NRPE server on the system for the allowed host changes to take effect.
$ service nagios-nrpe-server restart$ service nagios-nrpe-server status nagios-nrpe-server.service - LSB: Start/Stop the Nagios remote plugin execution daemon Loaded: loaded (/etc/init.d/nagios-nrpe-server) Active: active (running) since Wed 2016-02-17 22:27:57 UTC; 4s ago Process: 8340 ExecStop=/etc/init.d/nagios-nrpe-server stop (code=exited, status=0/SUCCESS) Process: 8345 ExecStart=/etc/init.d/nagios-nrpe-server start (code=exited, status=0/SUCCESS) CGroup: /system.slice/nagios-nrpe-server.service └─8348 /usr/sbin/nrpe -c /etc/nagios/nrpe.cfg -d
[...]4 Install the Nagios plugins. Nagios plugins are extensions to the Nagios Core (Nagios Core is the daemon running on the Nagios
server). A plugin monitors the services and resources on an OpenSwitch OPX system and returns the results to the Nagios server. See Nagios.org for more information.
$ apt-get install nagios-plugin
Configure Nagios server monitoring
1 Update the clients.cfg file on the Nagios server with the system IP address to enable monitoring.
define host{ use linux-server host_name Dell_OPX alias client address 10.x.x.x }
2 Enter check commands in the commands.cfg file on the Nagios server to reference the host, service, and contact definitions.
define command{ command_name check_nrpe command_line $USER1$/check_nrpe -H $HOSTADDRESS$ -c $ARG1$ }
define command{
Administration 11
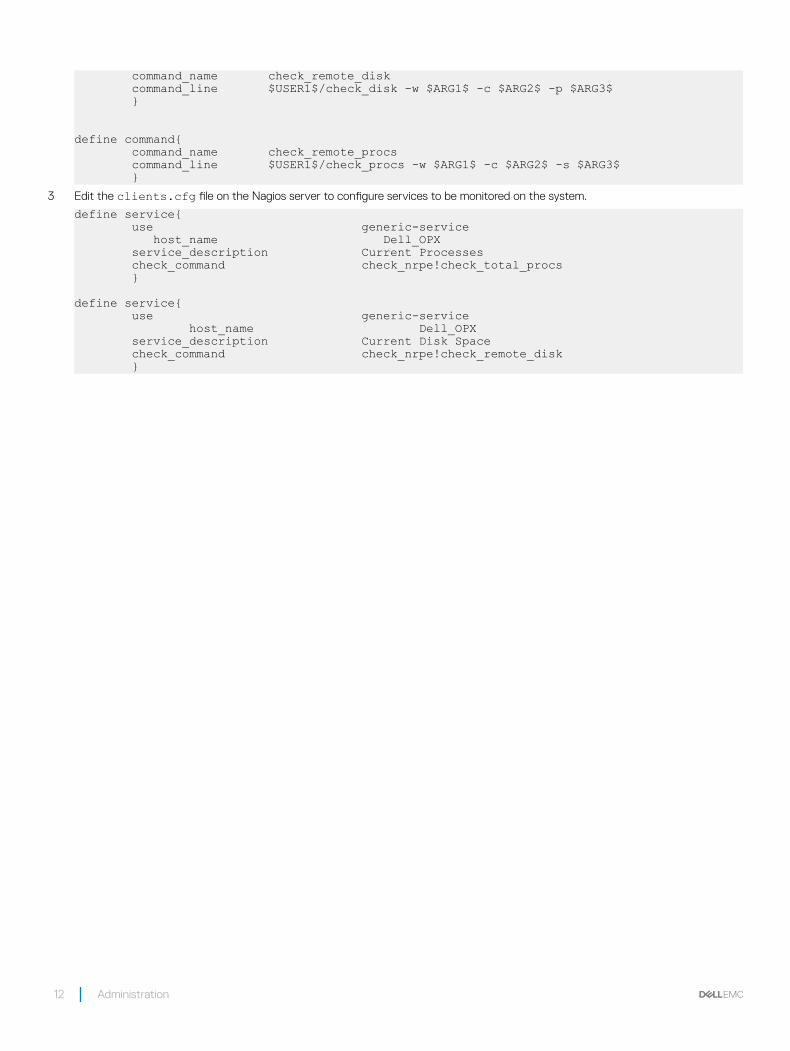
command_name check_remote_disk command_line $USER1$/check_disk -w $ARG1$ -c $ARG2$ -p $ARG3$ }
define command{ command_name check_remote_procs command_line $USER1$/check_procs -w $ARG1$ -c $ARG2$ -s $ARG3$ }
3 Edit the clients.cfg file on the Nagios server to configure services to be monitored on the system.
define service{ use generic-service host_name Dell_OPX service_description Current Processes check_command check_nrpe!check_total_procs }
define service{ use generic-service host_name Dell_OPX service_description Current Disk Space check_command check_nrpe!check_remote_disk }
12 Administration
TroubleshootingYou can use methods and tools available for gathering information and debugging OpenSwitch OPX including coredumps and firmware versions.
Firmware versions To display version information about installed firmware, open the /var/log/firmware_versions file.
Transceivers See opx-show-transceivers to view current transceiver information.
Topics:
• Debug port interfaces
• Layer 2 troubleshooting
• Layer 3 troubleshooting
• Log management
• Manage CPS API objects
• Password recovery
• Port statistics
Debug port interfacesDuring system startup, physical ports map to Linux network interfaces. See Physical ports in the OpenSwitch OPX Configuration Guide for information about the naming convention of Linux network interfaces.
Troubleshoot interfaces
• If Linux network interfaces are not created:
• Check that the NAS process is running, and check the /var/log/syslog file for errors.
• If the NAS is not running, check if other processes on which NAS depends are running.
• If physical port interfaces are not enabled (administratively up) in the NPU, check that the SAI/NPU SDK has initialized correctly. You can also use the journalctl utility.
Layer 2 troubleshootingUse Linux commands to troubleshoot Layer 2, and see the ip link show command to verify that all Linux network interfaces are
created.
Enable NAS and SAI Layer 2 logging
• opx_logging_cli enable NAS_L2• opx_logging_cli enable INTERFACE• opx_logging_cli enable L2MAC• opx_logging_cli enable SAI_FDB• opx_logging_cli enable SAI_STP
View NPU-related status
2
Troubleshooting 13
• opx–switch-shell “l2 show”• opx–switch-shell “stp show”• opx–switch-shell “vlan show”
Layer 3 troubleshootingUse opx_logging_cli commands to view the contents of NPU log files in Layer 3.
Verify routing-related tables
• ip route show• arp -a
IPv6 debugging
• ip -6 neighbor show• ip -6 route show
Troubleshoot routing issues in the NPU
• opx-switch-shell "l3 defip show"• opx-switch-shell "l3 l3table show"• opx-switch-shell "l3 egress show"
IPv6 routes
• opx-switch-shell "l3 ip6route show"• opx-switch-shell "l3 ip6host show"
Multi-path routes
• opx-switch-shell "l3 multipath show"• opx-switch-shell "l3 egress show"
Traffic
• opx-switch-shell "show c"
Enable NAS and SAI Layer 3 logging
• opx_logging_cli enable ROUTE• opx_logging_cli enable INTERFACE• opx_logging_cli enable NETLINK• opx_logging_cli enable SAI_NEXT_HOP• opx_logging_cli enable SAI_ROUTE
Log managementOpenSwitch OPX utilizes primary systemd-journald for all system logging. Log entries captured by journald can be viewed by the
journalctl command.
Application logging format
The Syslog format for logging application events is date timestamp hostname severity process_name filename function_name line_number string.
14 Troubleshooting
PAS logging
Jun 16 18:16:52 OPX pas_svc: [PAS:PAS]:pas_entity.c:dn_entity_poll:366, PSU 1 is presentJun 16 18:16:52 OPX pas_svc: [PAS:PAS]:pas_entity.c:dn_entity_poll:366, Fan Tray 1 is present
NAS logging
Jun 24 18:49:18 OPX nas_svc: [INTERFACE:INT-CREATE]:port/nas_int_port.cpp:nas_int_port_create:347, Interface created 0:29:e101-021-0 - 22Jun 24 18:49:18 OPX nas_svc: [INTERFACE:NAS-INT-CREATE], Interface e101-021-0 initial link state is 2Jun 24 18:49:18 OPX nas_svc: [INTERFACE:INT-STATE]:port/nas_int_port.cpp:nas_int_port_link_change:312, Interface state change 0:29 to 2
Enable and display application logs (except SAI)
Use the opx_logging_cli command to enable/disable logging and display logged events for OpenSwitch OPX applications, except SAI.
In the following opx_logging_cli commands, OpenSwitch OPX applications are identified by a module-id value. Valid values for
module-id are either the module ID numbers or the modules names (for example, L3_SERVICES) shown in the opx_logging_cli show-id command output.
• opx_logging_cli show [all | module-id] {log-level} {log-sub-level} — display the current log for all, or a specified, OpenSwitch OPX application modules with information at a specified level and sublevel.
• opx_logging_cli {enable | disable} {all log-level | module-id [log-level] — enable or disable logging for all OpenSwitch OPX application modules at all levels or for a specified application module at all levels or a specified level.
If you enter only a module ID, all log levels and log sublevels are enabled or disabled—if you enter only a module ID and log level, all log sublevels are enabled or disabled.
Enable and view SAI application log
The SAI application module has its own specific logging. To enable SAI-specific logs, enter the opx-switch-log set command:
opx-switch-log set [module_name] [level_name]where:
• module_name specifies a SAI module:
• WRED• FDB• ROUTE• VLAN• HOST_INTERFACE• ACL• MIRROR• QOS_QUEUE• SCHEDULER_GROUP• PORT• VIRTUAL_ROUTER• NEXT_HOP_GROUP• SWITCH• POLICER• NEIGHBOR• UNSPECIFIED• SAMPLEPACKET• QOS_MAPS
Troubleshooting 15
• ALL• STP• LAG• ROUTER_INTERFACE• NEXT_HOP• SCHEDULER
• level_name sets the SAI logging level to debug, info, notice, warning, critical, or error.
Manage CPS API objectsCommon commands used to manage CPS API objects are included. See CPS API programmability in the OpenSwitch OPX Developers Guide for detailed information.
get object
Retrieve and view the contents of a CPS API object.
cps_get_oid.py qualifier category/subcategory ... - qualifier = "{ target | observed | realtime | proposed | registration }"
• category/subcategory — category and subcategory of the requested CPS API object
• key=value — name of an object key attribute and its value—enter extra settings by leaving a space between each entry
Retrieve entity object for slot 1 PSU
cps_get_oid.py observed base-pas/entity entity-type=1 slot=1
set object
Set one or more attributes of a CPS API object.
cps_set_oid.py operation qualifier category/subcategory ...- qualifier = "{ target | observed | realtime | proposed | registration }"- operation = {create | set | delete}
• category/subcategory — category and subcategory of the target CPS API object
• key=value — name of an object key attribute and its value—enter additional settings by leaving a space between each entry
• attr=value — name of an attribute to set and its new value—enter additional settings by leaving a space between each entry
Turn on beacon LED
cps_set_oid.py base-pas/led entity-type=3 slot=1 name=Beacon on=1
Event trace
View CPS API events as they occur—enter the command as a CPS API key in A.B.C.D format. See CPS keys in the OpenSwitch OPX Developers Guide for information about how to build a key, and the appropriate header files for actual key values.
cps_trace_events.py qualifier category ...- qualifier = "{ target | observed | realtime | proposed | registration }"- object_path = YANG object path (e.g., base-pas/led)
where:
• qualifier — numeric qualifier of the CPS API object to trace
• category — category of the CPS API object
Print all CPS API events generated by PAS
cps_trace_events.py observed base-pas/entity
16 Troubleshooting
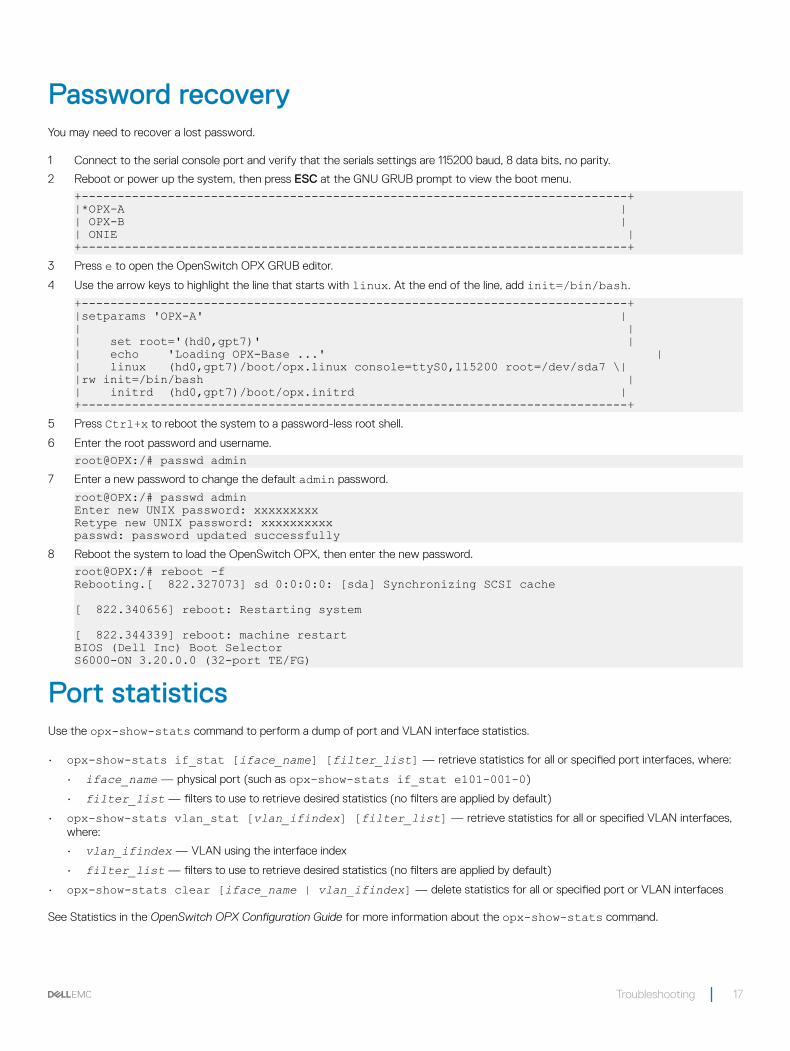
Password recoveryYou may need to recover a lost password.
1 Connect to the serial console port and verify that the serials settings are 115200 baud, 8 data bits, no parity.
2 Reboot or power up the system, then press ESC at the GNU GRUB prompt to view the boot menu.
+----------------------------------------------------------------------------+|*OPX-A || OPX-B || ONIE |+----------------------------------------------------------------------------+
3 Press e to open the OpenSwitch OPX GRUB editor.
4 Use the arrow keys to highlight the line that starts with linux. At the end of the line, add init=/bin/bash.
+----------------------------------------------------------------------------+|setparams 'OPX-A' || || set root='(hd0,gpt7)' || echo 'Loading OPX-Base ...' || linux (hd0,gpt7)/boot/opx.linux console=ttyS0,115200 root=/dev/sda7 \| |rw init=/bin/bash || initrd (hd0,gpt7)/boot/opx.initrd |+----------------------------------------------------------------------------+
5 Press Ctrl+x to reboot the system to a password-less root shell.
6 Enter the root password and username.
root@OPX:/# passwd admin7 Enter a new password to change the default admin password.
root@OPX:/# passwd adminEnter new UNIX password: xxxxxxxxxRetype new UNIX password: xxxxxxxxxxpasswd: password updated successfully
8 Reboot the system to load the OpenSwitch OPX, then enter the new password.
root@OPX:/# reboot -fRebooting.[ 822.327073] sd 0:0:0:0: [sda] Synchronizing SCSI cache
[ 822.340656] reboot: Restarting system
[ 822.344339] reboot: machine restartBIOS (Dell Inc) Boot SelectorS6000-ON 3.20.0.0 (32-port TE/FG)
Port statisticsUse the opx-show-stats command to perform a dump of port and VLAN interface statistics.
• opx-show-stats if_stat [iface_name] [filter_list] — retrieve statistics for all or specified port interfaces, where:
• iface_name — physical port (such as opx-show-stats if_stat e101-001-0)
• filter_list — filters to use to retrieve desired statistics (no filters are applied by default)
• opx-show-stats vlan_stat [vlan_ifindex] [filter_list] — retrieve statistics for all or specified VLAN interfaces, where:
• vlan_ifindex — VLAN using the interface index
• filter_list — filters to use to retrieve desired statistics (no filters are applied by default)
• opx-show-stats clear [iface_name | vlan_ifindex] — delete statistics for all or specified port or VLAN interfaces
See Statistics in the OpenSwitch OPX Configuration Guide for more information about the opx-show-stats command.
Troubleshooting 17
Linux management
Topics:
• opx-config-fanout
• opx-chassis-beacon
• opx-config-switch
• opx-ethtool
• opx_logging_cli
• opx-show-alms
• opx-show-env
• opx-show-packages
• opx-show-stats
• opx-show-system-status
• opx-show-transceivers
• opx-show-version
• opx-switch-log
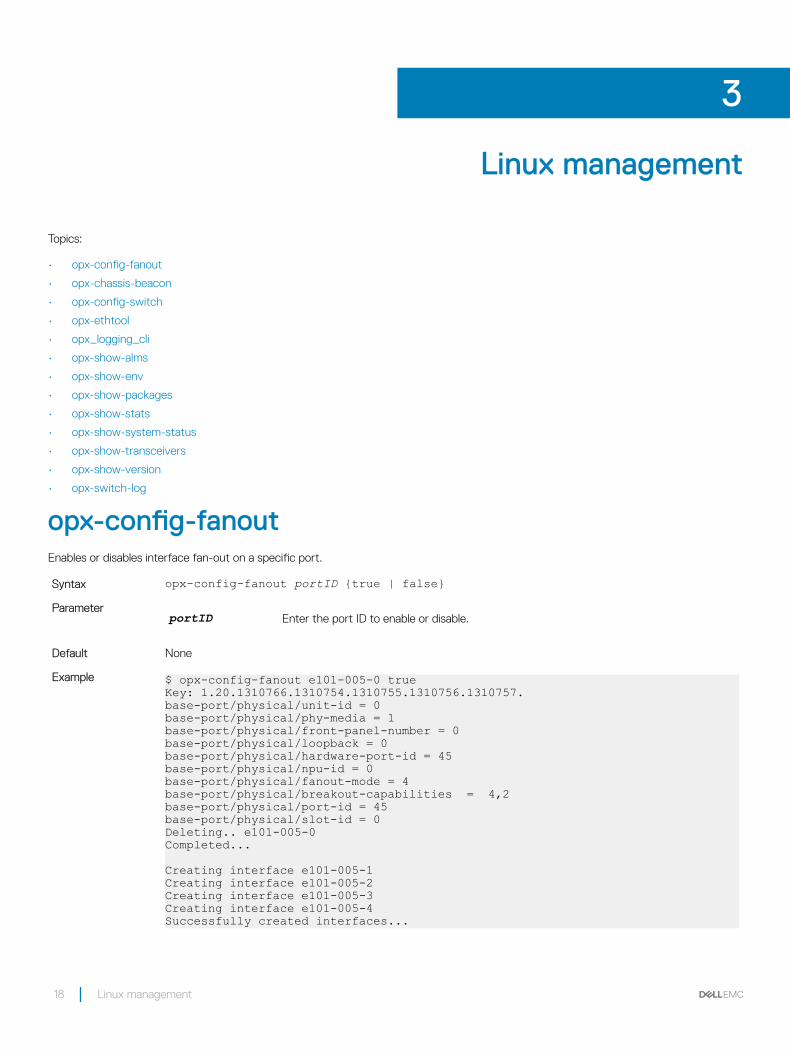
opx-config-fanoutEnables or disables interface fan-out on a specific port.
Syntax opx-config-fanout portID {true | false}Parameter
portID Enter the port ID to enable or disable.
Default None
Example $ opx-config-fanout e101-005-0 trueKey: 1.20.1310766.1310754.1310755.1310756.1310757.base-port/physical/unit-id = 0base-port/physical/phy-media = 1base-port/physical/front-panel-number = 0base-port/physical/loopback = 0base-port/physical/hardware-port-id = 45base-port/physical/npu-id = 0base-port/physical/fanout-mode = 4base-port/physical/breakout-capabilities = 4,2base-port/physical/port-id = 45base-port/physical/slot-id = 0Deleting.. e101-005-0Completed...
Creating interface e101-005-1Creating interface e101-005-2Creating interface e101-005-3Creating interface e101-005-4Successfully created interfaces...
3
18 Linux management
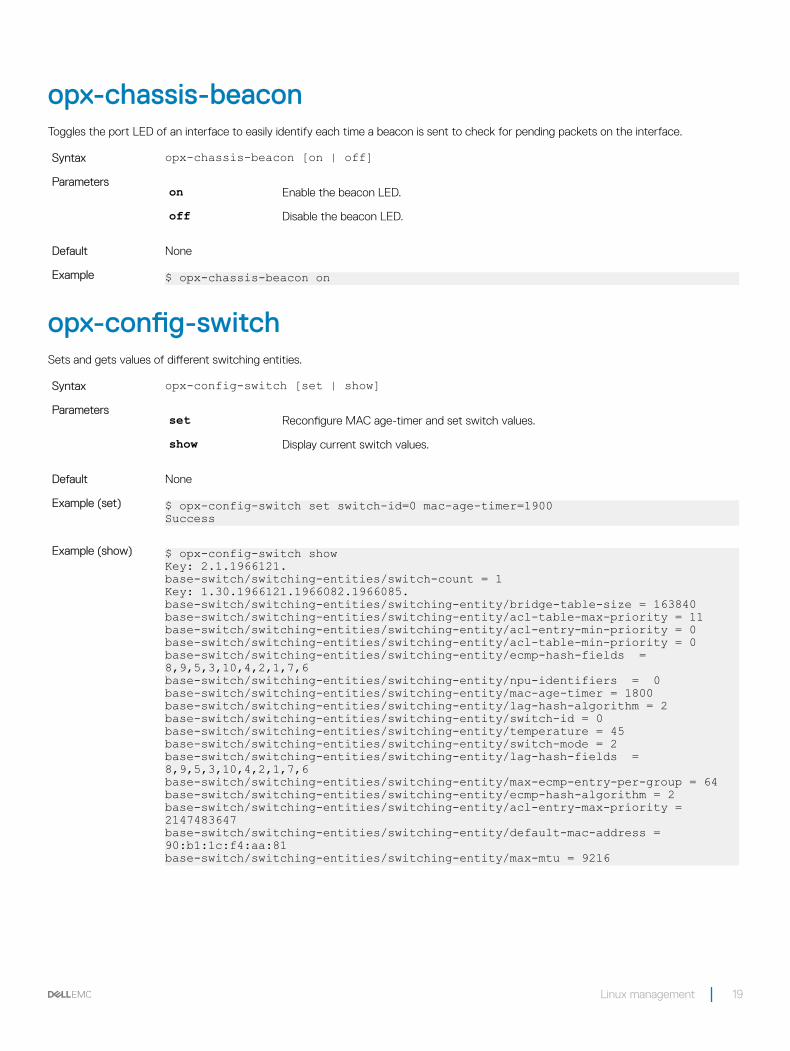
opx-chassis-beaconToggles the port LED of an interface to easily identify each time a beacon is sent to check for pending packets on the interface.
Syntax opx-chassis-beacon [on | off]Parameters on Enable the beacon LED.
off Disable the beacon LED.
Default None
Example $ opx-chassis-beacon on
opx-config-switchSets and gets values of different switching entities.
Syntax opx-config-switch [set | show]Parameters set Reconfigure MAC age-timer and set switch values.
show Display current switch values.
Default None
Example (set) $ opx-config-switch set switch-id=0 mac-age-timer=1900Success
Example (show) $ opx-config-switch showKey: 2.1.1966121.base-switch/switching-entities/switch-count = 1Key: 1.30.1966121.1966082.1966085.base-switch/switching-entities/switching-entity/bridge-table-size = 163840base-switch/switching-entities/switching-entity/acl-table-max-priority = 11base-switch/switching-entities/switching-entity/acl-entry-min-priority = 0base-switch/switching-entities/switching-entity/acl-table-min-priority = 0base-switch/switching-entities/switching-entity/ecmp-hash-fields = 8,9,5,3,10,4,2,1,7,6base-switch/switching-entities/switching-entity/npu-identifiers = 0base-switch/switching-entities/switching-entity/mac-age-timer = 1800base-switch/switching-entities/switching-entity/lag-hash-algorithm = 2base-switch/switching-entities/switching-entity/switch-id = 0base-switch/switching-entities/switching-entity/temperature = 45base-switch/switching-entities/switching-entity/switch-mode = 2base-switch/switching-entities/switching-entity/lag-hash-fields = 8,9,5,3,10,4,2,1,7,6base-switch/switching-entities/switching-entity/max-ecmp-entry-per-group = 64base-switch/switching-entities/switching-entity/ecmp-hash-algorithm = 2base-switch/switching-entities/switching-entity/acl-entry-max-priority = 2147483647base-switch/switching-entities/switching-entity/default-mac-address = 90:b1:1c:f4:aa:81base-switch/switching-entities/switching-entity/max-mtu = 9216
Linux management 19
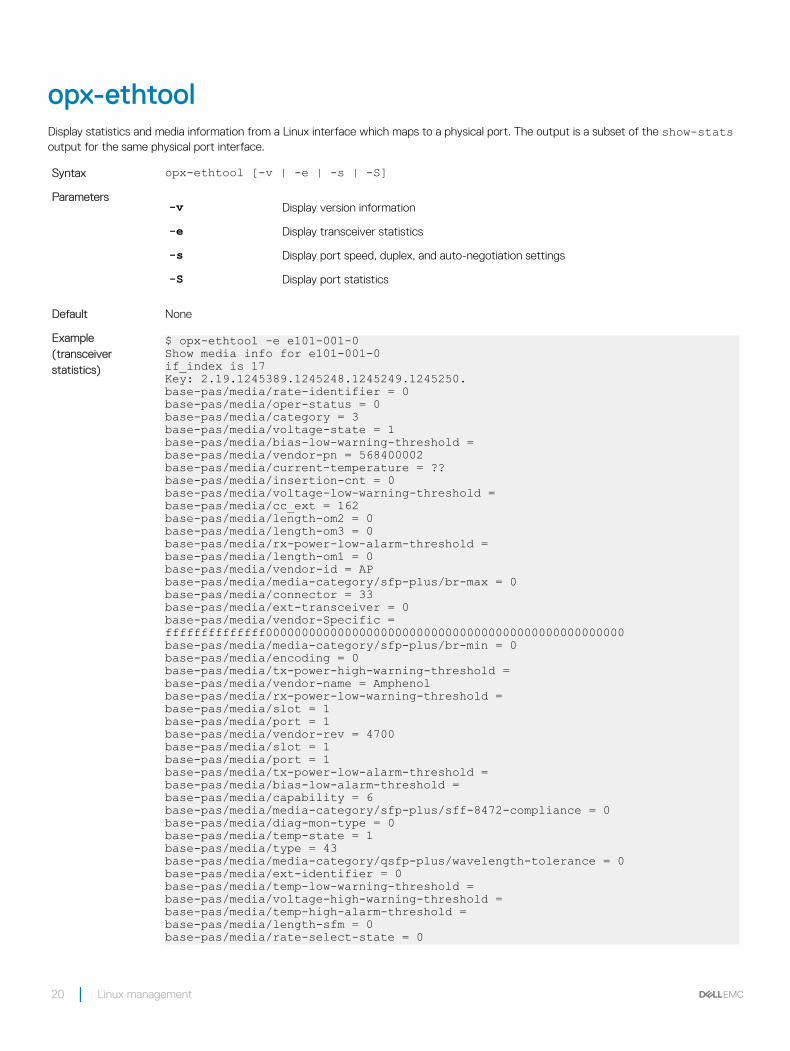
opx-ethtoolDisplay statistics and media information from a Linux interface which maps to a physical port. The output is a subset of the show-stats output for the same physical port interface.
Syntax opx-ethtool [-v | -e | -s | -S]Parameters -v Display version information
-e Display transceiver statistics
-s Display port speed, duplex, and auto-negotiation settings
-S Display port statistics
Default None
Example (transceiver statistics)
$ opx-ethtool -e e101-001-0Show media info for e101-001-0if_index is 17Key: 2.19.1245389.1245248.1245249.1245250.base-pas/media/rate-identifier = 0base-pas/media/oper-status = 0base-pas/media/category = 3base-pas/media/voltage-state = 1base-pas/media/bias-low-warning-threshold =base-pas/media/vendor-pn = 568400002base-pas/media/current-temperature = ??base-pas/media/insertion-cnt = 0base-pas/media/voltage-low-warning-threshold =base-pas/media/cc_ext = 162base-pas/media/length-om2 = 0base-pas/media/length-om3 = 0base-pas/media/rx-power-low-alarm-threshold =base-pas/media/length-om1 = 0base-pas/media/vendor-id = APbase-pas/media/media-category/sfp-plus/br-max = 0base-pas/media/connector = 33base-pas/media/ext-transceiver = 0base-pas/media/vendor-Specific = ffffffffffffff00000000000000000000000000000000000000000000000000base-pas/media/media-category/sfp-plus/br-min = 0base-pas/media/encoding = 0base-pas/media/tx-power-high-warning-threshold =base-pas/media/vendor-name = Amphenolbase-pas/media/rx-power-low-warning-threshold =base-pas/media/slot = 1base-pas/media/port = 1base-pas/media/vendor-rev = 4700base-pas/media/slot = 1base-pas/media/port = 1base-pas/media/tx-power-low-alarm-threshold =base-pas/media/bias-low-alarm-threshold =base-pas/media/capability = 6base-pas/media/media-category/sfp-plus/sff-8472-compliance = 0base-pas/media/diag-mon-type = 0base-pas/media/temp-state = 1base-pas/media/type = 43base-pas/media/media-category/qsfp-plus/wavelength-tolerance = 0base-pas/media/ext-identifier = 0base-pas/media/temp-low-warning-threshold =base-pas/media/voltage-high-warning-threshold =base-pas/media/temp-high-alarm-threshold =base-pas/media/length-sfm = 0base-pas/media/rate-select-state = 0
20 Linux management
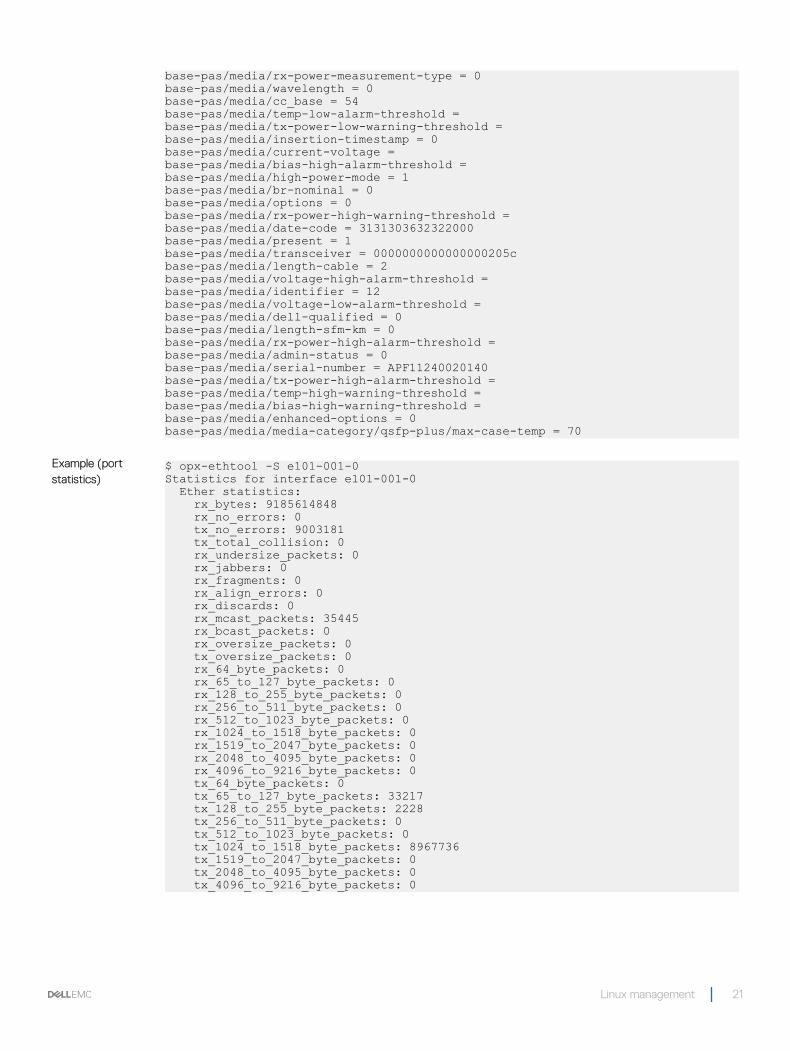
base-pas/media/rx-power-measurement-type = 0base-pas/media/wavelength = 0base-pas/media/cc_base = 54base-pas/media/temp-low-alarm-threshold =base-pas/media/tx-power-low-warning-threshold =base-pas/media/insertion-timestamp = 0base-pas/media/current-voltage =base-pas/media/bias-high-alarm-threshold =base-pas/media/high-power-mode = 1base-pas/media/br-nominal = 0base-pas/media/options = 0base-pas/media/rx-power-high-warning-threshold =base-pas/media/date-code = 3131303632322000base-pas/media/present = 1base-pas/media/transceiver = 0000000000000000205cbase-pas/media/length-cable = 2base-pas/media/voltage-high-alarm-threshold =base-pas/media/identifier = 12base-pas/media/voltage-low-alarm-threshold =base-pas/media/dell-qualified = 0base-pas/media/length-sfm-km = 0base-pas/media/rx-power-high-alarm-threshold =base-pas/media/admin-status = 0base-pas/media/serial-number = APF11240020140base-pas/media/tx-power-high-alarm-threshold =base-pas/media/temp-high-warning-threshold =base-pas/media/bias-high-warning-threshold =base-pas/media/enhanced-options = 0base-pas/media/media-category/qsfp-plus/max-case-temp = 70
Example (port statistics)
$ opx-ethtool -S e101-001-0Statistics for interface e101-001-0 Ether statistics: rx_bytes: 9185614848 rx_no_errors: 0 tx_no_errors: 9003181 tx_total_collision: 0 rx_undersize_packets: 0 rx_jabbers: 0 rx_fragments: 0 rx_align_errors: 0 rx_discards: 0 rx_mcast_packets: 35445 rx_bcast_packets: 0 rx_oversize_packets: 0 tx_oversize_packets: 0 rx_64_byte_packets: 0 rx_65_to_127_byte_packets: 0 rx_128_to_255_byte_packets: 0 rx_256_to_511_byte_packets: 0 rx_512_to_1023_byte_packets: 0 rx_1024_to_1518_byte_packets: 0 rx_1519_to_2047_byte_packets: 0 rx_2048_to_4095_byte_packets: 0 rx_4096_to_9216_byte_packets: 0 tx_64_byte_packets: 0 tx_65_to_127_byte_packets: 33217 tx_128_to_255_byte_packets: 2228 tx_256_to_511_byte_packets: 0 tx_512_to_1023_byte_packets: 0 tx_1024_to_1518_byte_packets: 8967736 tx_1519_to_2047_byte_packets: 0 tx_2048_to_4095_byte_packets: 0 tx_4096_to_9216_byte_packets: 0
Linux management 21
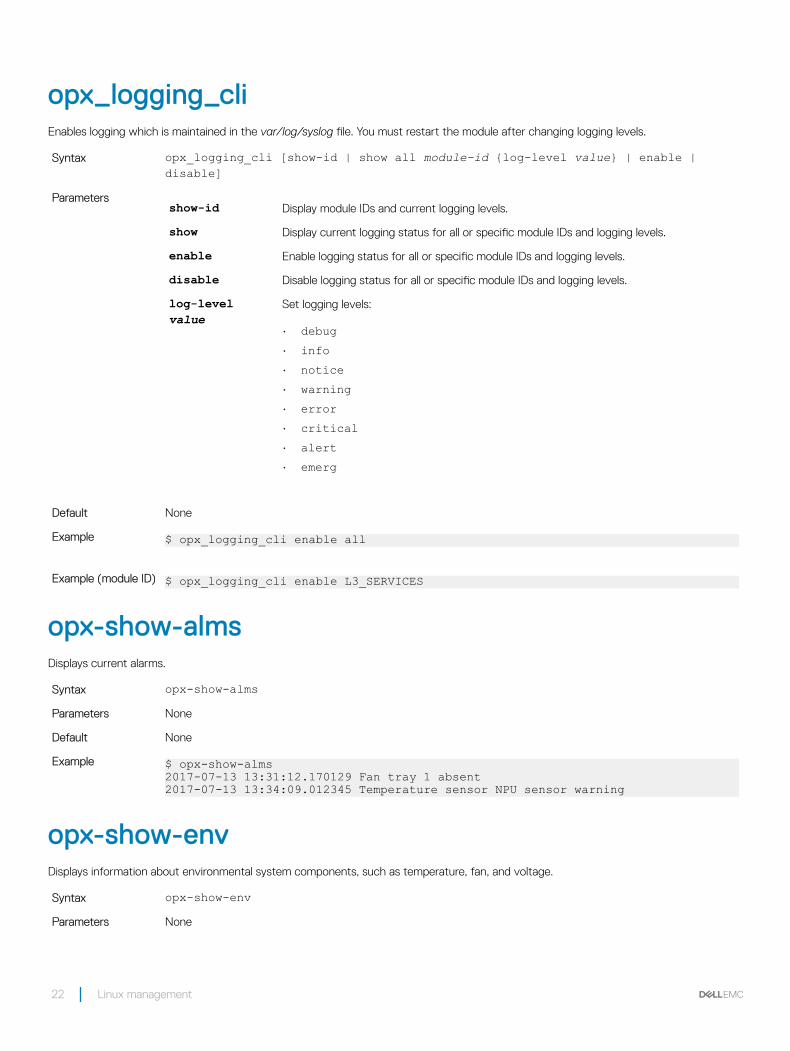
opx_logging_cliEnables logging which is maintained in the var/log/syslog file. You must restart the module after changing logging levels.
Syntax opx_logging_cli [show-id | show all module-id {log-level value} | enable | disable]
Parameters show-id Display module IDs and current logging levels.
show Display current logging status for all or specific module IDs and logging levels.
enable Enable logging status for all or specific module IDs and logging levels.
disable Disable logging status for all or specific module IDs and logging levels.
log-level value
Set logging levels:
• debug• info• notice• warning• error• critical• alert• emerg
Default None
Example $ opx_logging_cli enable all
Example (module ID) $ opx_logging_cli enable L3_SERVICES
opx-show-almsDisplays current alarms.
Syntax opx-show-almsParameters None
Default None
Example $ opx-show-alms2017-07-13 13:31:12.170129 Fan tray 1 absent2017-07-13 13:34:09.012345 Temperature sensor NPU sensor warning
opx-show-envDisplays information about environmental system components, such as temperature, fan, and voltage.
Syntax opx-show-envParameters None
22 Linux management
Default None
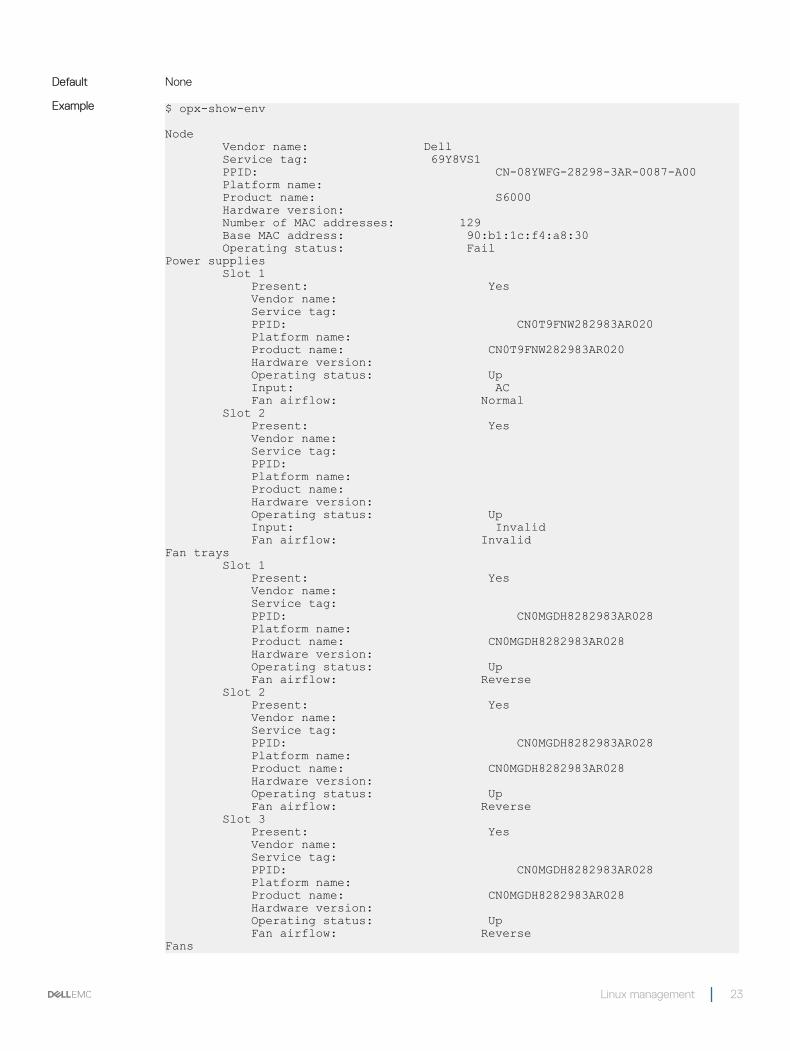
Example $ opx-show-env
Node Vendor name: Dell Service tag: 69Y8VS1 PPID: CN-08YWFG-28298-3AR-0087-A00 Platform name: Product name: S6000 Hardware version: Number of MAC addresses: 129 Base MAC address: 90:b1:1c:f4:a8:30 Operating status: FailPower supplies Slot 1 Present: Yes Vendor name: Service tag: PPID: CN0T9FNW282983AR020 Platform name: Product name: CN0T9FNW282983AR020 Hardware version: Operating status: Up Input: AC Fan airflow: Normal Slot 2 Present: Yes Vendor name: Service tag: PPID: Platform name: Product name: Hardware version: Operating status: Up Input: Invalid Fan airflow: InvalidFan trays Slot 1 Present: Yes Vendor name: Service tag: PPID: CN0MGDH8282983AR028 Platform name: Product name: CN0MGDH8282983AR028 Hardware version: Operating status: Up Fan airflow: Reverse Slot 2 Present: Yes Vendor name: Service tag: PPID: CN0MGDH8282983AR028 Platform name: Product name: CN0MGDH8282983AR028 Hardware version: Operating status: Up Fan airflow: Reverse Slot 3 Present: Yes Vendor name: Service tag: PPID: CN0MGDH8282983AR028 Platform name: Product name: CN0MGDH8282983AR028 Hardware version: Operating status: Up Fan airflow: ReverseFans
Linux management 23
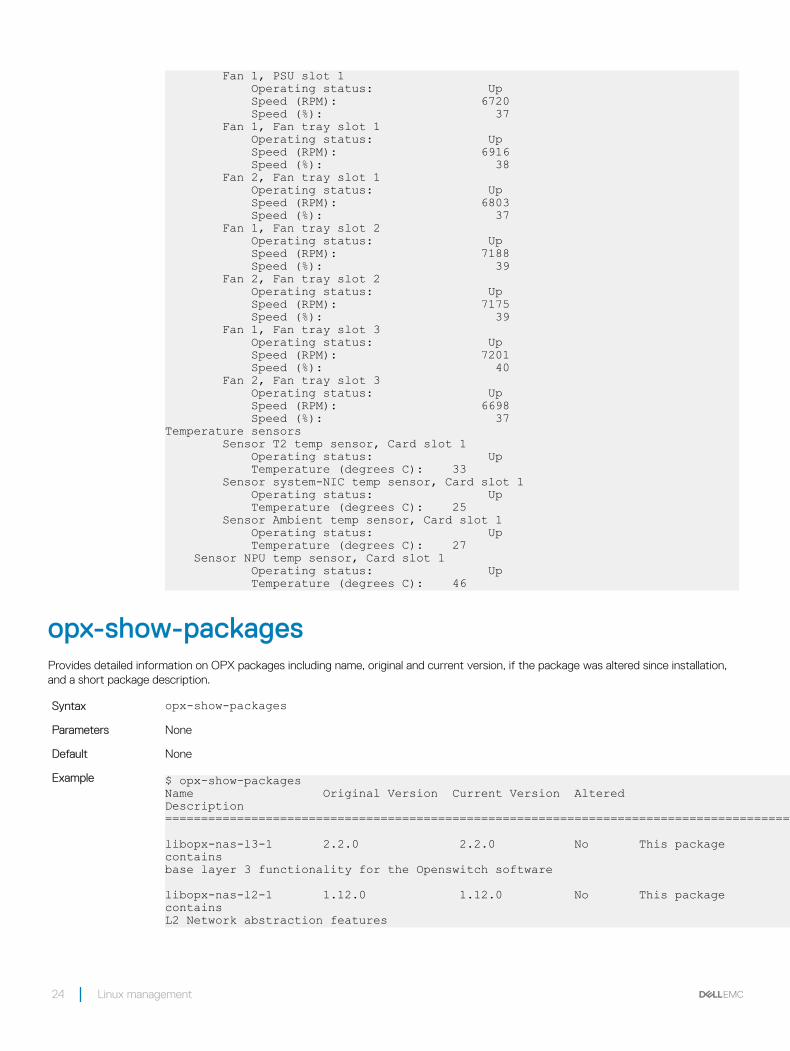
Fan 1, PSU slot 1 Operating status: Up Speed (RPM): 6720 Speed (%): 37 Fan 1, Fan tray slot 1 Operating status: Up Speed (RPM): 6916 Speed (%): 38 Fan 2, Fan tray slot 1 Operating status: Up Speed (RPM): 6803 Speed (%): 37 Fan 1, Fan tray slot 2 Operating status: Up Speed (RPM): 7188 Speed (%): 39 Fan 2, Fan tray slot 2 Operating status: Up Speed (RPM): 7175 Speed (%): 39 Fan 1, Fan tray slot 3 Operating status: Up Speed (RPM): 7201 Speed (%): 40 Fan 2, Fan tray slot 3 Operating status: Up Speed (RPM): 6698 Speed (%): 37Temperature sensors Sensor T2 temp sensor, Card slot 1 Operating status: Up Temperature (degrees C): 33 Sensor system-NIC temp sensor, Card slot 1 Operating status: Up Temperature (degrees C): 25 Sensor Ambient temp sensor, Card slot 1 Operating status: Up Temperature (degrees C): 27 Sensor NPU temp sensor, Card slot 1 Operating status: Up Temperature (degrees C): 46
opx-show-packagesProvides detailed information on OPX packages including name, original and current version, if the package was altered since installation, and a short package description.
Syntax opx-show-packagesParameters None
Default None
Example $ opx-show-packagesName Original Version Current Version Altered Description =======================================================================================
libopx-nas-l3-1 2.2.0 2.2.0 No This package contains base layer 3 functionality for the Openswitch software
libopx-nas-l2-1 1.12.0 1.12.0 No This package contains L2 Network abstraction features
24 Linux management
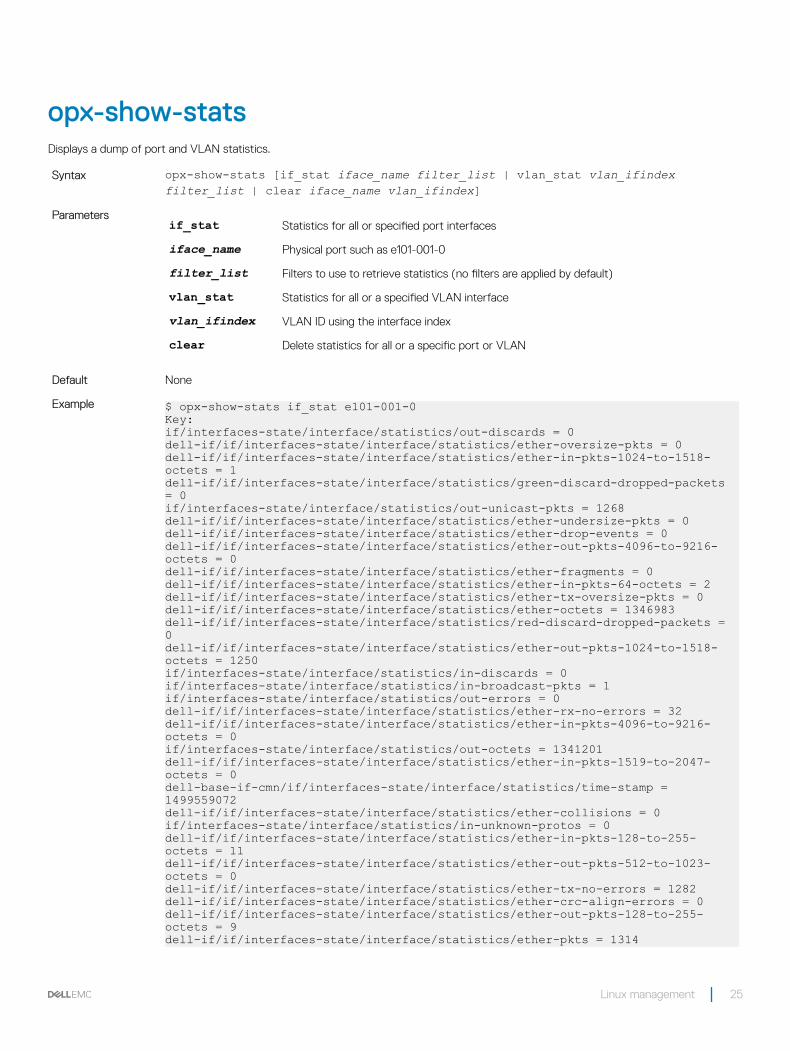
opx-show-statsDisplays a dump of port and VLAN statistics.
Syntax opx-show-stats [if_stat iface_name filter_list | vlan_stat vlan_ifindex filter_list | clear iface_name vlan_ifindex]
Parameters if_stat Statistics for all or specified port interfaces
iface_name Physical port such as e101-001-0
filter_list Filters to use to retrieve statistics (no filters are applied by default)
vlan_stat Statistics for all or a specified VLAN interface
vlan_ifindex VLAN ID using the interface index
clear Delete statistics for all or a specific port or VLAN
Default None
Example $ opx-show-stats if_stat e101-001-0Key:if/interfaces-state/interface/statistics/out-discards = 0dell-if/if/interfaces-state/interface/statistics/ether-oversize-pkts = 0dell-if/if/interfaces-state/interface/statistics/ether-in-pkts-1024-to-1518-octets = 1dell-if/if/interfaces-state/interface/statistics/green-discard-dropped-packets = 0if/interfaces-state/interface/statistics/out-unicast-pkts = 1268dell-if/if/interfaces-state/interface/statistics/ether-undersize-pkts = 0dell-if/if/interfaces-state/interface/statistics/ether-drop-events = 0dell-if/if/interfaces-state/interface/statistics/ether-out-pkts-4096-to-9216-octets = 0dell-if/if/interfaces-state/interface/statistics/ether-fragments = 0dell-if/if/interfaces-state/interface/statistics/ether-in-pkts-64-octets = 2dell-if/if/interfaces-state/interface/statistics/ether-tx-oversize-pkts = 0dell-if/if/interfaces-state/interface/statistics/ether-octets = 1346983dell-if/if/interfaces-state/interface/statistics/red-discard-dropped-packets = 0dell-if/if/interfaces-state/interface/statistics/ether-out-pkts-1024-to-1518-octets = 1250if/interfaces-state/interface/statistics/in-discards = 0if/interfaces-state/interface/statistics/in-broadcast-pkts = 1if/interfaces-state/interface/statistics/out-errors = 0dell-if/if/interfaces-state/interface/statistics/ether-rx-no-errors = 32dell-if/if/interfaces-state/interface/statistics/ether-in-pkts-4096-to-9216-octets = 0if/interfaces-state/interface/statistics/out-octets = 1341201dell-if/if/interfaces-state/interface/statistics/ether-in-pkts-1519-to-2047-octets = 0dell-base-if-cmn/if/interfaces-state/interface/statistics/time-stamp = 1499559072dell-if/if/interfaces-state/interface/statistics/ether-collisions = 0if/interfaces-state/interface/statistics/in-unknown-protos = 0dell-if/if/interfaces-state/interface/statistics/ether-in-pkts-128-to-255-octets = 11dell-if/if/interfaces-state/interface/statistics/ether-out-pkts-512-to-1023-octets = 0dell-if/if/interfaces-state/interface/statistics/ether-tx-no-errors = 1282dell-if/if/interfaces-state/interface/statistics/ether-crc-align-errors = 0dell-if/if/interfaces-state/interface/statistics/ether-out-pkts-128-to-255-octets = 9dell-if/if/interfaces-state/interface/statistics/ether-pkts = 1314
Linux management 25
if/interfaces-state/interface/statistics/in-unicast-pkts = 17if/interfaces-state/interface/statistics/out-multicast-pkts = 14dell-if/if/interfaces-state/interface/statistics/ether-multicast-pkts = 28dell-if/if/interfaces-state/interface/statistics/ether-broadcast-pkts = 1dell-if/if/interfaces-state/interface/statistics/ether-out-pkts-65-to-127-octets = 20if/interfaces-state/interface/statistics/in-multicast-pkts = 14dell-if/if/interfaces-state/interface/statistics/ether-in-pkts-512-to-1023-octets = 1dell-if/if/interfaces-state/interface/statistics/yellow-discard-dropped-packets = 0dell-if/if/interfaces-state/interface/statistics/ether-out-pkts-256-to-511-octets = 0dell-if/if/interfaces-state/interface/statistics/ether-rx-oversize-pkts = 0if/interfaces-state/interface/statistics/in-octets = 5782dell-if/if/interfaces-state/interface/statistics/ether-jabbers = 0dell-if/if/interfaces-state/interface/statistics/ether-in-pkts-2048-to-4095-octets = 0dell-if/if/interfaces-state/interface/statistics/if-out-qlen = 0dell-if/if/interfaces-state/interface/statistics/ether-in-pkts-65-to-127-octets = 17if/interfaces-state/interface/statistics/in-errors = 0dell-if/if/interfaces-state/interface/statistics/ether-out-pkts-1519-to-2047-octets = 0dell-if/if/interfaces-state/interface/statistics/ether-out-pkts-64-octets = 3dell-if/if/interfaces-state/interface/statistics/ether-in-pkts-256-to-511-octets = 0if/interfaces-state/interface/statistics/out-broadcast-pkts = 0dell-if/if/interfaces-state/interface/statistics/ether-out-pkts-2048-to-4095-octets = 0
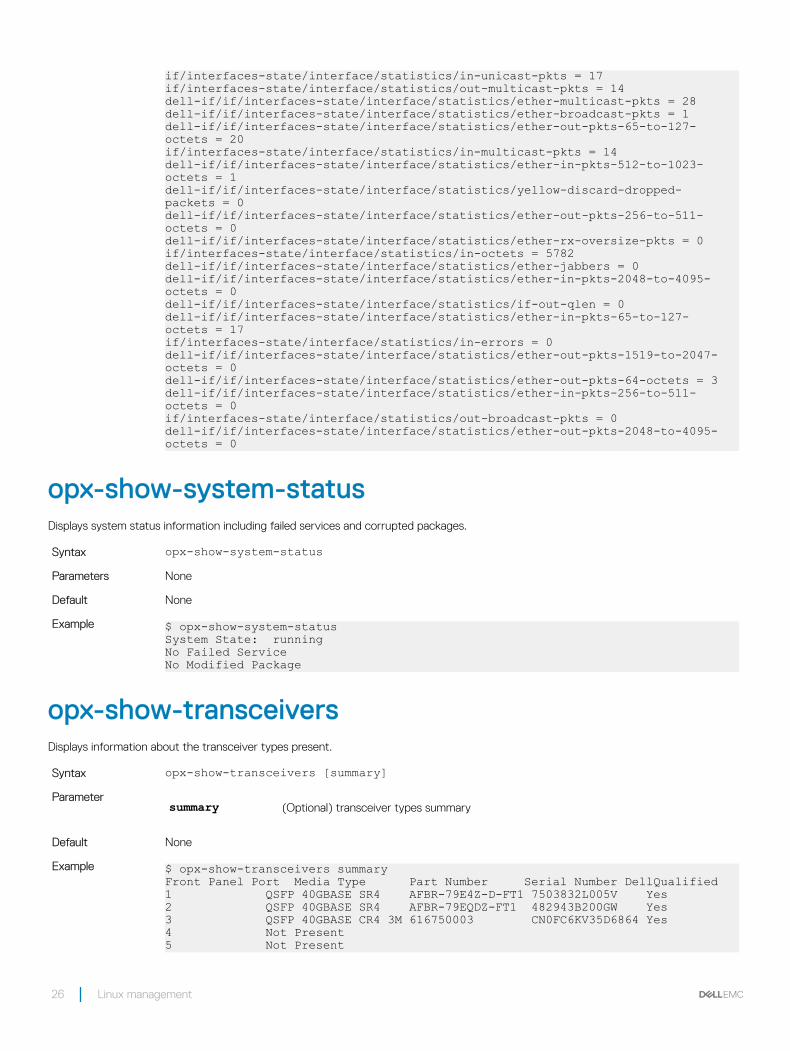
opx-show-system-statusDisplays system status information including failed services and corrupted packages.
Syntax opx-show-system-statusParameters None
Default None
Example $ opx-show-system-statusSystem State: runningNo Failed ServiceNo Modified Package
opx-show-transceiversDisplays information about the transceiver types present.
Syntax opx-show-transceivers [summary]Parameter summary (Optional) transceiver types summary
Default None
Example $ opx-show-transceivers summaryFront Panel Port Media Type Part Number Serial Number DellQualified1 QSFP 40GBASE SR4 AFBR-79E4Z-D-FT1 7503832L005V Yes2 QSFP 40GBASE SR4 AFBR-79EQDZ-FT1 482943B200GW Yes3 QSFP 40GBASE CR4 3M 616750003 CN0FC6KV35D6864 Yes4 Not Present5 Not Present
26 Linux management
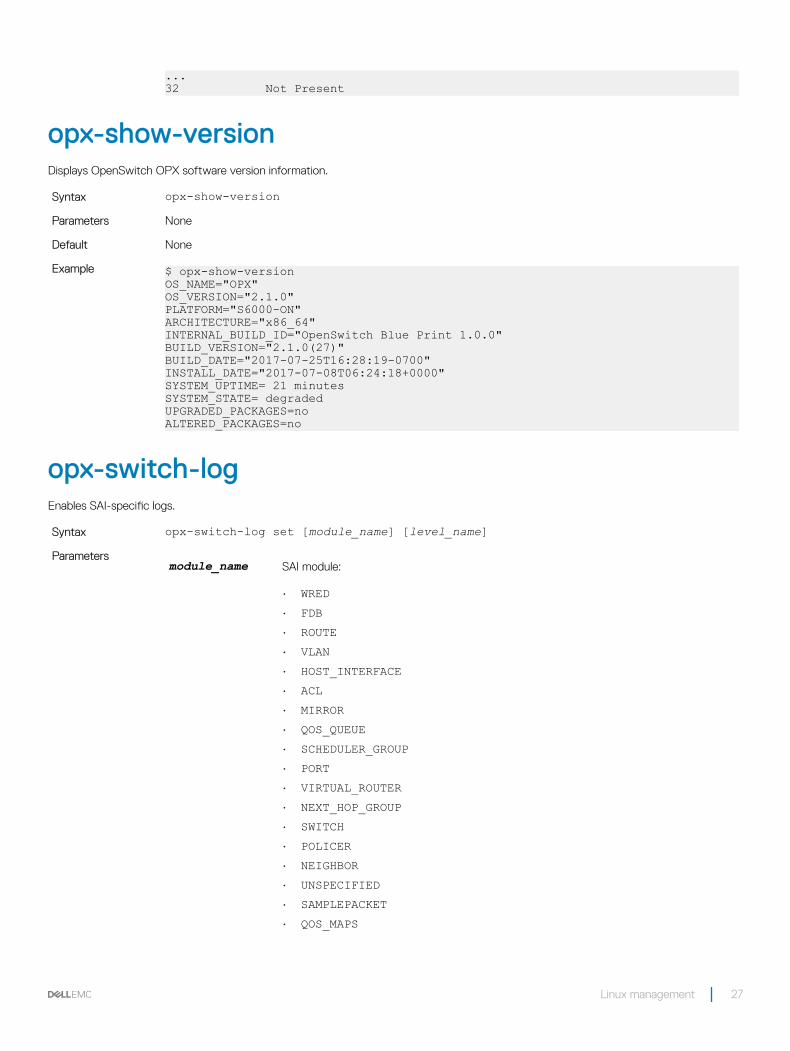
...32 Not Present
opx-show-versionDisplays OpenSwitch OPX software version information.
Syntax opx-show-versionParameters None
Default None
Example $ opx-show-versionOS_NAME="OPX"OS_VERSION="2.1.0"PLATFORM="S6000-ON"ARCHITECTURE="x86_64"INTERNAL_BUILD_ID="OpenSwitch Blue Print 1.0.0"BUILD_VERSION="2.1.0(27)"BUILD_DATE="2017-07-25T16:28:19-0700"INSTALL_DATE="2017-07-08T06:24:18+0000"SYSTEM_UPTIME= 21 minutesSYSTEM_STATE= degradedUPGRADED_PACKAGES=noALTERED_PACKAGES=no
opx-switch-logEnables SAI-specific logs.
Syntax opx-switch-log set [module_name] [level_name]Parameters
module_name SAI module:
• WRED• FDB• ROUTE• VLAN• HOST_INTERFACE• ACL• MIRROR• QOS_QUEUE• SCHEDULER_GROUP• PORT• VIRTUAL_ROUTER• NEXT_HOP_GROUP• SWITCH• POLICER• NEIGHBOR• UNSPECIFIED• SAMPLEPACKET• QOS_MAPS
Linux management 27

• ALL• STP• LAG• ROUTER_INTERFACE• NEXT_HOP• SCHEDULER
level_name SAI logging level:
• debug• info• notice• warning• critical• error
Default None
Example $ opx-switch-log set wred debug
28 Linux management