Embed Size (px)
Citation preview

TA EMG and SOL H-reflex Training Improves Function in SCI
1
Operant Conditioning to Increase Ankle Control or Decrease Reflex Excitability Improves 1 Reflex Modulation and Walking Function in Chronic Spinal Cord Injury 2 3 4 Kathleen J. Manella1, Kathryn E. Roach1, and Edelle C. Field-Fote1, 2 5 6 1Department of Physical Therapy and 2The Miami Project to Cure Paralysis, Miller School of 7 Medicine, University of Miami, Miami, FL USA 8 9 10 11 12 13 14 15 16 17 18 19 20 21 22 23 24 25 26 27 28 29 30 31 32 33 34 35 36 37 38 39 40 41 Address correspondence to: E. C. Field-Fote, Department of Physical Therapy, Miller School of 42 Medicine, University of Miami, 5915 Ponce de Leon Blvd, 5th Floor, Coral Gables, FL 33146 43 44
45
Articles in PresS. J Neurophysiol (March 6, 2013). doi:10.1152/jn.01039.2011
Copyright © 2013 by the American Physiological Society.

TA EMG and SOL H-reflex Training Improves Function in SCI
2
ABSTRACT 46 47 Ankle clonus is common after spinal cord injury (SCI) and is attributed to loss of supra-48
spinally mediated inhibition of soleus stretch reflexes and maladaptive reorganization of spinal 49
reflex pathways. The maladaptive reorganization underlying ankle clonus is associated with 50
other abnormalities such as coactivation and reciprocal facilitation of tibialis anterior (TA) and 51
soleus (SOL), which contribute to impaired walking ability in individuals with motor-incomplete 52
SCI. Operant conditioning can increase muscle activation and decrease stretch reflexes in 53
individuals with SCI. We compared two operant conditioning-based interventions in individuals 54
with ankle clonus and impaired walking ability due to SCI. Training included either TA EMG 55
activation (TA↑) to enhance supraspinal drive or SOL H-reflex suppression (SOL↓) to modulate 56
reflex pathways at the spinal cord level. We measured clonus duration, plantar flexor (PF) reflex 57
threshold angle, timed toe tapping, dorsiflexion (DF) active range of motion (ROM), lower 58
extremity motor scores (LEMS), walking foot clearance, speed and distance, SOL H-reflex 59
amplitude modulation as an index of reciprocal inhibition, presynaptic inhibition, and low-60
frequency depression, and SOL/TA clonus coactivation,. TA↑ decreased PF reflex threshold 61
angle (-4.33°) and DF active ROM angle (-4.32°), and increased LEMS of DF (+0.8 points), 62
training leg (+2.2 points), and non-training leg (+0.8 points), and increased walking foot 63
clearance (+ 4.8 mm) and distance (+12.09 m). SOL↓ decreased SOL/TA coactivation ratio (-64
0.21) and increased non-training leg LEMS (+1.8 points), walking speed (+0.02 m/s) and 65
distance (+6.25 m). We found increased voluntary control associated with TA↑ outcomes and 66
decreased reflex excitability associated with SOL↓ outcomes. 67
68 Key words: ankle clonus, soleus stretch reflex, reciprocal inhibition, presynaptic inhibition, 69 antagonist coactivation, plantar flexor spasticity 70
71
TA EMG and SOL H-reflex Training Improves Function in SCI
3
INTRODUCTION 72
In persons with spinal cord injury (SCI) (see Appendix 1 for complete list of 73
abbreviations), walking function is impaired by reduced ability to produce voluntary muscle 74
contraction and by hyperactive spinal reflex activity (hyperreflexia). In those with motor-75
incomplete SCI, the impaired voluntary muscle contraction arises primarily from corticospinal 76
tract disruption, but reduced corticomotor excitability, maladaptive cortical changes (Beekhuizen 77
and Field-Fote 2005, Thomas and Gorassini 2005) and limited motor unit rate modulation 78
(Zijdewind and Thomas 2003) also contribute to this impairment. During normal human 79
walking, control of the tibialis anterior (TA) muscle is strongly related to corticospinal input 80
(Capaday et al. 1999; Schubert et al. 1997). Evidence demonstrates that TA corticospinal 81
excitability is enhanced with dorsiflexion imagery during imagined walking in non-disabled 82
individuals (Bakker et al. 2008), functional electrical stimulation after chronic central nervous 83
system lesions (Thompson et al. 2009), and locomotor training in persons with chronic motor-84
incomplete SCI (Thomas and Gorassini 2005). 85
Beyond the impairment of voluntary control, SCI also results in loss of modulation of 86
involuntary reflex circuits. Clonus is a common manifestation of stretch reflex hyperexcitablity 87
(Decq 2003). Clonus manifests as involuntary 5-7 Hz joint oscillations (Wallace et al. 2005), 88
and commonly occurs at the ankle in individuals with motor-incomplete SCI, and other forms of 89
central nervous system pathology. Clonic soleus (SOL) activity due to inadequate modulation of 90
the SOL stretch reflex may impede walking progression (Yang et al. 1991), compromise 91
independent walking (Beres-Jones et al. 2003), and restrict quality of life in individuals with 92
motor-incomplete SCI. 93

TA EMG and SOL H-reflex Training Improves Function in SCI
4
Reflex pathophysiology contributes to ankle clonus after SCI (Katz and Rymer 1989). 94
Disrupted supraspinal input and maladaptive reorganization of spinal reflex pathways give rise to 95
impaired modulation of peripheral sensory feedback (Field-Fote 2004; Hultborn 2003) and 96
aberrant reflex responses (Gracies 2005); exaggerated soleus stretch reflexes emerge (Davies et 97
al. 1995; Dietz 1997) and contribute to clonus in plantar flexors. After SCI, impaired SOL 98
disynaptic reciprocal Ia inhibition (RI) manifests as SOL coactivation during TA contractions 99
(Boorman et al. 1996), SOL reciprocal facilitation after TA activation (a reversal of the normal 100
response) (Crone and Nielsen 1994; Crone et al. 2003; Morita et al. 2001), and antagonist 101
response to SOL or TA tendon tapping (Xia and Rymer 2005). In individuals with motor-102
incomplete SCI, decreased SOL PI contributes to soleus stretch reflex hyperexcitability (Dietz 103
2001; Faist et al. 1994). 104
Increased SOL motoneuron excitability, reduced post-activation depression of repeated 105
stretch activations, and antagonist coactivation may promote clonus. Elevated SOL H/M ratio, 106
found in individuals with clonus (Koelman et al. 1993), has been associated with increased 107
plantar flexor (PF) reflex threshold angle (the angle at clonus onset) (Manella and Field-Fote 108
2010) and number of clonic oscillations (Manella and Field-Fote 2009). SOL H-reflex low-109
frequency post-activation depression (LFD) (Lloyd and Wilson 1957; Pierrot-Deseilligny and 110
Burke 2005) is impaired in persons with chronic SCI (Grey et al. 2008; Schindler-Ivens and 111
Shields 2000), allowing the SOL to be easily activated with small amounts of sensory input. In 112
spastic hemiparesis, dorsiflexor force is inversely related to plantar flexor spasticity and EMG 113
SOL/TA cocontraction ratio (Levin and Hui-Chan 1994), suggesting a relationship between the 114
amount of voluntary TA control and SOL hyperexcitability. After motor-incomplete SCI, 115
SOL/TA coactivation during clonus has been reported (Manella and Field-Fote 2009). Therefore 116

TA EMG and SOL H-reflex Training Improves Function in SCI
5
a myriad of factors, including SOL reflex hyperexcitability, diminished SOL LFD, decreased 117
voluntary dorsiflexor activation, and SOL/TA coactivation appear to influence clonic activity. 118
Control of both voluntary movement and reflex activity are known to be modifiable with 119
operant conditioning training, wherein reward is contingent upon performance of a targeted 120
motor task. Operant conditioning training induces neuroplasticity in supraspinal and spinal reflex 121
pathways. Such training increases voluntary EMG responses (Brucker and Bulaeva 1996; 122
Seymour and Bassler 1977; Stein et al. 1990) and firing rates of spared motor units (Stein et al. 123
1990) after motor-incomplete SCI, and decreases stretch reflex excitability in individuals with 124
and without spasticity (Evatt et al. 1989; Segal 1997; Wolf and Segal 1996). Successful SOL H-125
reflex suppression in animals (Wolpaw and Herchenroder 1990; Wolpaw and Chen 2001; 126
Wolpaw and Chen 2006) and humans (Thompson et al. 2009, 2008, 2006) provides clear 127
evidence of activity-dependent plasticity in spinal circuitry induced by operant conditioning 128
training. 129
Based on the foregoing evidence that both impaired voluntary dorsiflexor control and 130
plantar flexor hyperexcitability contribute to functional deficits and spasticity in persons with 131
spastic hypertonia, we designed two operant conditioning-based interventions intended to 132
improve ankle motor control in individuals with motor-incomplete SCI. The interventions were: 133
1) TA EMG activation (TA↑) to enhance supraspinal drive to spinal circuits and 2) SOL H-134
reflex suppression during voluntary DF (SOL↓) to modulate reflex pathways at the spinal cord 135
level. TA↑ was intended to improve ability to voluntarily drive corticospinal activation of 136
spared TA motor neurons and activate inhibitory interneurons (Iles and Pisini 1992) comprising 137
SOL RI and PI pathways. We hypothesized TA↑ would be associated with increased DF active 138
ROM and DF strength, foot clearance in swing phase, and walking speed and distance. SOL↓ 139

TA EMG and SOL H-reflex Training Improves Function in SCI
6
was intended to suppress SOL H-reflex amplitude responses during DF. We hypothesized 140
SOL↓ would be associated with enhanced SOL H-reflex LFD, decreased SOL/TA clonus 141
coactivation, decreased clonus duration, decreased PF reflex threshold angle, and increased toe 142
tapping ability. We compared TA↑ and SOL↓ interventions and assessed 15 outcomes : 1) two 143
measures of ankle clonus (clonus duration, PF reflex threshold angle); 2) two measures of ankle 144
motor control (toe tap test, DF active ROM); 3) four measures of lower extremity strength (DF 145
strength, PF strength, [training and non-training leg]); 4) three walking-related measures (foot 146
clearance, speed, and distance); and 5) four neurophysiologic measures (SOL H-reflex RI, PI, 147
and LFD, and SOL/TA clonus coactivation ratio). Secondarily, we also explored relationships 148
among changes in outcome measures to determine if neurophysiological mechanisms are 149
associated with changes in training, clinical, or walking measures. 150
METHODS 151
Research participants 152
Of sixteen volunteers recruited from The Miami Project to Cure Paralysis research 153
subject registry; twelve signed written consent and were enrolled in the study (Figure 1). 154
Participants were 16 to 75 years old, with stable motor-incomplete SCI (> 1 year), lesion level of 155
T12 or above, and ability to walk 6 meters with devices or assistance as needed. All participants 156
exhibited an American Spinal Injury Association (ASIA) Impairment Scale D (AIS D) category 157
of SCI (ASIA 2002; Marino et al. 2003), and in at least one lower extremity had a palpable TA 158
contraction, a SOL H-reflex response, and ankle clonus elicited by manual plantar flexor stretch. 159
Participants were without other conditions impairing walking function, or cognitive deficits that 160
would impede adherence to the study protocol. Participants were stratified according to toe tap 161
score (toe taps in 10 seconds) into one of two categories indicating extent of voluntary ankle 162
TA EMG and SOL H-reflex Training Improves Function in SCI
7
control: low control (< 15 taps) and high control (≥ 15 taps) (Figure 1), with each training 163
session lasting approximately 2 hours including set-up time. Following stratification, 164
participants were randomly assigned to the TA↑ group (n = 6, mean age = 44.2, 6 men) or the 165
SOL↓ group (n = 6, mean age = 45.2, 4 men) (Table 1). We trained the ankle with most severe 166
clonus as assessed by clonus duration after manual plantar flexor stretch. Training was 167
conducted three times weekly for five weeks for a total of 15 sessions (3 baseline and 12 training 168
sessions) (Figure 1). Testing was performed the week before and the week after training. All 169
twelve participants completed the study (mean age = 44.6 years, 10 men). The study was 170
conducted in accordance with the standards of the Declaration of Helsinki and was approved by 171
the University of Miami Human Subjects Research Office. 172
<< INSERT FIGURE 1 AND TABLE 1 ABOUT HERE >> 173
Clinical Measures of Ankle Clonus, Motor Control, and Walking 174
Ankle clonus 175
The Ankle Clonus Drop Test (Manella and Field-Fote 2009) provides reliable ankle 176
clonus measures that correlate with the Spinal Cord Assessment Tool for Spastic reflexes clonus 177
score (Benz et al. 2005) and SOL H/M ratio (Manella and Field-Fote 2009). Briefly, with the 178
individual sitting, the foot was placed on a 10-cm high platform, the leg was lifted to a height of 179
10 cm above the platform and released; impact of the forefoot with the platform edge provided a 180
SOL stretch to elicit clonus (Figure 2). Kinematic ankle angles and SOL and TA EMG activity 181
were recorded for three trials. Clonus duration was measured from first PF deflection after 182
platform impact to last PF deflection of at least 1 degree greater than the rest angle. The PF 183
reflex threshold angle (Manella and Field-Fote 2010) was identified kinematically as first PF 184

TA EMG and SOL H-reflex Training Improves Function in SCI
8
deflection after platform impact. Mean clonus duration and PF reflex threshold angle were 185
calculated. 186
<< INSERT FIGURE 2 ABOUT HERE >> 187
Ankle motor control 188
Timed toe tapping (Knights and Moule 1967) was performed seated with the ball of the 189
foot positioned on a pressure sensitive footswitch embedded in a platform. Dorsiflexion 190
activated the footswitch that triggered data acquisition (Spike 2 v7, Cambridge Electronic 191
Design, Cambridge, England). With the heel maintaining platform contact, the participant 192
performed voluntary concentric and eccentric dorsiflexor contractions as quickly as possible for 193
10 seconds for four trials with 60-second rest periods between trials. Mean number of taps 194
achieved in the best 3 of 4 trials was calculated. 195
Voluntary DF active ROM was recorded using an 8-camera Peak Motus 8.5 motion 196
analysis system (Vicon, Centennial, CO, USA). Reflective markers were placed laterally on the 197
5th metatarsal head, malleolus, heel, and knee. In sitting, hip and knee were flexed to 90° and 198
30°, respectively, with the lower leg supported allowing unrestricted ankle motion. Three trials 199
of maximal voluntary dorsiflexion and 5 seconds of relaxation were performed; mean maximum 200
dorsiflexion angle was calculated. 201
Bilateral lower extremity strength was assessed using ASIA lower extremity motor scores 202
(LEMS) (ASIA 2002; Marino et al. 2003). With the subject supine, hip flexors, knee extensors, 203
dorsiflexors (DF), great toe extensor, and plantar flexors (PF) were graded from 0 (no palpable 204
contraction) to 5 (maximal resistance against gravity); LEMS for DF, PF, training leg and non-205
training leg were recorded. 206
207

TA EMG and SOL H-reflex Training Improves Function in SCI
9
Walking function 208
Foot clearance and speed were analyzed using an 8-camera Peak Motus 8.5 motion 209
analysis system (Vicon, Centennial, CO, USA); data were sampled at 60 Hz, smoothed (zero-lag 210
Butterworth filter) and low-pass filtered (6 Hz). Twenty-one reflective markers were placed 211
bilaterally at lateral 5th metatarsal head, malleolus, heel, and knee, and greater trochanter, 212
anterior superior iliac spine, posterior wrist, lateral elbow and shoulder; and at C7, T10 and the 213
sacrum. Participants, wearing a safety harness, walked with assistance and/or devices as needed 214
at their fastest comfortable speed over a 6-meter walkway for three trials. Foot clearance, 215
defined as maximal vertical excursion of the 5th metatarsal marker, was quantified for three 216
swing phases for each trial. Walking speed was calculated for the central 4 meters of each trial. 217
Mean foot clearance and speed were computed. Distance traversed during a 2-minute period was 218
determined by participants walking, with assistance and/or devices as needed, at fastest 219
comfortable speed around an 80-ft (24.39 m) track. 220
Neurophysiologic Tests 221
SOL H-reflexes (peak-to-peak amplitude, mV) in response to RI, PI, and LFD 222
conditioning stimuli were recorded using surface electrodes (interelectode distance, 36 mm) 223
positioned as described by Rainoldi et al. (2004). SOL electrodes were placed at mid-line, 10 cm 224
proximal to the calcaneus. Instrumentation included a constant current stimulator (Digitimer 225
DS7A , Digitimer Ltd, Hertfordshire, England), AC amplifier (Grass P511, Grass Technologies, 226
West Warwick, RI, USA), and analog-to-digital converter (CED 1401, Cambridge Electronic 227
Design, Cambridge, England). Inter-stimulus intervals (ISIs) were controlled with an electrical 228
stimulator (Grass S88, Grass Technologies, West Warwick, RI, USA). A peripheral nerve 229
stimulator (MiniStim MS-IVA, Life-Tech Inc, Stafford, TX, USA) was used to locate the 230
TA EMG and SOL H-reflex Training Improves Function in SCI
10
posterior tibial nerve (PTN) in the popliteal fossa, common peroneal nerve (CPN) distal to the 231
fibular head, and femoral nerve (FN) in the femoral triangle. Cathodes were placed at the nerve 232
site where the largest muscle contraction was evoked with lowest stimulus intensity; anodes were 233
placed on the patella medially for PTN, laterally for CPN, and superiorly for FN stimulation. 234
Stimulus intensity (mA) was maintained between 10 – 30% Mmax (Crone et al. 1990). 235
Reciprocal Ia inhibition test 236
For testing RI of the SOL H-reflex (Crone et al. 1987), TA electrodes were placed on the 237
muscle belly, lateral to tibial crest and at mid-point between tibial tuberosity and inter-malleolar 238
line. Twenty interleaved test (PTN) and conditioned (CPN-PTN, 2 ms ISI) reflexes were evoked 239
at 0.10 Hz. TI testing was repeated using CPN-PTN conditioning stimuli at 3 ms ISI. The 240
conditioned reflex amplitude was normalized to the test amplitude and expressed as percent (%) 241
of control reflex; for each ISI interval the mean RI% was calculated and smallest mean RI% was 242
selected. 243
Presynaptic inhibition test 244
PI of the SOL H-reflex was assessed using heteronymous SOL H-reflex facilitation (Faist 245
et al. 1994). Electrodes were placed on quadriceps of the training leg at mid-line on the muscle 246
belly, 15 cm proximal to the patella. A 0.5 ms PTN test pulse was administered prior to a 0.1 ms 247
FN conditioning pulse. FN stimulus intensity was 4X motor threshold. The ISI at onset of SOL 248
H-reflex facilitation was identified and increased by 0.4 ms. Twenty interleaved test and 249
conditioned reflexes were evoked at 0.10 Hz. The difference between test and conditioned reflex 250
amplitudes was expressed as a percent of Mmax. Values ranged from 2 – 18%, consistent with 251
Faist et al. (1994). The largest PI% was selected for analysis. 252
253

TA EMG and SOL H-reflex Training Improves Function in SCI
11
Low-Frequency Depression test 254
SOL H-reflexes were evoked using paired-pulse PTN stimuli with ISI of 1 second. Ten 255
trials with 10-second rests between trials were recorded. The amplitude of the conditioned 256
(second) response was expressed as % of the control (first) reflex amplitude (LFD%); mean 257
LFD% was calculated (Field-Fote et al. 2006). 258
Coactivation during clonus 259
SOL and TA EMG activity were recorded during the ankle clonus test (described above). 260
The coactivation ratio of SOL and TA EMG bursts (± 2SD mean resting EMG) during a 2-261
second window of clonus was calculated using customized software (MATLAB, The 262
MathWorks, Inc., Natick, MA, USA) (Manella and Field-Fote 2009). Mean SOL/TA clonus 263
coactivation ratio for three trials was calculated. 264
Training Procedures 265
Surface recording electrodes were placed after standard skin preparation. For both 266
interventions, the participant was seated with approximately 100° hip flexion, 70° knee flexion 267
and 120° ankle plantar flexion; the training foot was positioned on a footswitch imbedded in a 268
platform. A shoe was worn if footswitch activation was achieved with it on; if not then a sock 269
and shower slipper were used. An auditory signal cued the participant to perform DF at 0.10 Hz 270
for 30 repetitions; 10 bouts of 30 repetitions were performed with 60-second rest intervals 271
between each bout. During baseline testing no visual or auditory feedback was provided. 272
During training EMG biofeedback and a visual tally of the number of repetitions s that met or 273
exceeded target during each bout were displayed (methods for determining target TA↑ and 274
SOL↓ EMG are described below in the respective sections). Immediate verbal reward of “good 275

TA EMG and SOL H-reflex Training Improves Function in SCI
12
job” or similar accolade was given and faded to summary feedback upon 80% success rate 276
(number of repetitions exceeding target/total repetitions) (Figure 1). 277
TA↑ 278
TA electrodes were placed as described previously. EMG signals were amplified (x2k) 279
(Grass amplifier, Grass Technologies, West Warwick, RI, USA), notch filtered (60 Hz), 280
bandpass filtered (10 Hz - 1000 Hz), sampled at 1k Hz, full-wave rectified, and smoothed (RMS, 281
8 ms moving average filter). The footswitch was activated by dorsiflexion, and triggered a TTL 282
input to an analog-to-digital converter (CED 1401, Cambridge Electronic Design, Cambridge, 283
England). For each participant, at session start, three 3-second TA maximal voluntary 284
contractions (MVCs) were performed with 60-second rest intervals. Mean MVC peak amplitude 285
was computed and %MVC amplitude target for the session was identified. TA EMG 286
biofeedback using customized software (Spike 2, v7, Cambridge Electronic Design, Cambridge, 287
England) was displayed on a split screen (Figure 3A). On the right, the %MVC amplitude target 288
was displayed (horizontal line), a vertical bar moved up or down reflecting increasing or 289
decreasing TA EMG activity. Instructions were to dorsiflex the foot and move the TA EMG bar 290
above the target line; when the target was exceeded the screen flashed green. On the left side of 291
the screen, reward, EMG, and footswitch activations were displayed; a gold icon appeared when 292
TA EMG activity exceeded target. For training session 1, the mean %MVC amplitude of the 293
prior baseline session was used as the training target. For training sessions 2 – 12, each %MVC 294
amplitude target was based on prior session performance; for session success rates of at least 295
50%, the target was increased 10% for the next session. 296
297
298
TA EMG and SOL H-reflex Training Improves Function in SCI
13
SOL↓ 299
Footswitch activation, EMG recording and signal amplification equipment and 300
parameters were as described above for TA↑. During training, SOL H-reflexes during brief 301
voluntary DF contractions were recorded as described by Crone et al. (1987), Crone and Nielson 302
(1989), Morin and Pierrot-Deseilligny (1977), and Pierrot-Deseilligny and Burke (2005). 303
Electrodes were placed as described earlier for PTN stimulation and SOL H-reflex recording and 304
the foot was positioned on the platform over the embedded footswitch. The footswitch was 305
connected to a stimulator (Grass S88, Grass Technologies, West Warwick, RI, USA) that 306
provided a 50-ms delay between footswitch activation and SOL H-reflex stimulation. This delay 307
reflected the time course of depression of SOL H-reflex by voluntary DF, which increases 308
greatly from 50 – 100 ms following movement onset in non-disabled individuals (Crone et al. 309
1987). For each participant, at session start, SOL H-reflex and M-wave recruitment curves at 310
rest and during voluntary DF were obtained by incrementally increasing the stimulus intensity by 311
2 mA; H-reflex and M-wave maximum amplitudes were recorded. PTN stimulus intensity was 312
maintained at 20% of M-wave maximum amplitude during DF throughout each session. 313
SOL H-reflex biofeedback using customized software (Signal, Cambridge Electronic 314
Design, Cambridge, England) was presented on a split screen (Figure 3B). On the right, the SOL 315
H-reflex amplitude (mV) target was displayed (horizontal line). A black square, representing the 316
peak-to peak amplitude of the SOL H-reflex response, appeared above or below the target line 317
for responses greater or smaller than the target, respectively. Instructions were to dorsiflex 318
(which triggered SOL H-reflex stimulation) and generate a black square (reflex amplitude) below 319
the target line; the screen flashed green for responses smaller than target amplitude. On the left 320
side of the screen, the SOL H-reflex signal was displayed (Figure 3B). For each training session, 321

TA EMG and SOL H-reflex Training Improves Function in SCI
14
the first bout was a baseline bout (no feedback) in which the median SOL H-reflex amplitude 322
target was calculated to determine the training target for the second bout; for subsequent training 323
bouts the median SOL H-reflex target was calculated from the previous training bout. 324
Participants were encouraged to employ any strategy to accomplish the task while remaining 325
seated with the foot on the platform and footswitch. 326
<< INSERT FIGURE 3 ABOUT HERE >> 327
Data analysis 328
Non-parametric statistical tests were conducted using SPSS Statistics 18 software (SPSS, 329
Inc., Chicago, IL, USA) because the assumption of normal distribution required for use of 330
parametric test was not met due to small sample size. Mann-Whitney U or Chi-square statistics 331
were used to compare demographic and pre-intervention clinical characteristics for each 332
intervention group. Spearman correlation coefficients were used to determine pre-intervention 333
relationships between outcome measures. 334
Training dosage was compared between TA↑ and SOL↓ groups using Mann-Whitney U-335
test. For each group, the magnitude of change in the training measure was examined with one-336
tailed Wilcoxon signed ranks test. For the SOL↓ group, only SOL H-reflexes that were elicited 337
with stimulus intensities between 10 and 30% M-max were included in data analysis, to ensure 338
equivalence of stimuli across trials. Effect size was assessed with standardized response mean 339
(SRM) (Liang et al. 1990), which divides mean pre-post intervention change by standard 340
deviation of the change. SRM interpretation, based on Cohen’s criteria, was 0.20, 0.50 and 0.80 341
for small, moderate, and large effects, respectively (Liang et al. 1990). For TA↑, mean %MVC 342
amplitude was compared between three baseline sessions and the final three training sessions. 343
For SOL↓, stability of SOL Mmax across sessions was assessed using repeated measures 344

TA EMG and SOL H-reflex Training Improves Function in SCI
15
ANOVA; SOL Mmax values were obtained from the recruitment curve for each session and 345
were found to be stable (p = 0.24). Mean SOL H-reflex amplitude during dorsiflexion was 346
calculated for the last three training sessions (conditioned SOL HDF
) and was normalized to the 347
mean SOL HDF
for three baseline sessions and expressed as percent (%) of baseline (Thompson 348
et al. 2009). In four participants, the mean SOL HDF
value for baseline session 3 was identified 349
as an outlier (> 2 SD of mean of baseline sessions 1 and 2) and was removed from analysis. 350
Change was determined by subtracting the pretest from the posttest measure. One-tailed 351
Mann-Whitney U-tests were used to compare magnitude of change, between TA↑ and SOL↓ 352
groups for each outcome measure. Within each group, some outcome measures exhibited 353
change that appeared to be clinically relevant; therefore, for each group separately, we analyzed 354
change in outcome measures using one-tailed Wilcoxon signed ranks tests, calculated SRM 355
(Liang et al. 1990) for each outcome, and explored relationships among outcome changes with 356
one-tailed Spearman correlation coefficients. 357
RESULTS 358
Pre-intervention characteristics 359
The TA↑ and SOL↓ groups were similar in pre-intervention demographic, clinical, and 360
neurophysiologic measures. However, for clinical measures, the TA↑ group had greater DF 361
active ROM (96.9° vs. 112.4°, p = 0.04) and non-training leg strength (22.5 vs. 19.2 LEMS, p = 362
0.04) (Table 1). Stratification of participants by toe tap score resulted in equal distribution of 363
participants between the two groups based on level of ankle motor control; each group had four 364
individuals with low control (<15 taps) and two with high control (≥ 15 taps). 365
Change in training measures and effect size (standardized response mean) 366

TA EMG and SOL H-reflex Training Improves Function in SCI
16
Training dosage (repetitions) was similar between TA↑ and SOL↓ groups (3100 vs. 2740, 367
p = 0.21). For TA↑, TA%MVC amplitude increased between baseline (43% ± 17) and final 368
training sessions (91% ± 18, p = 0.01) (Table 2) and a large training effect was observed (SRM = 369
5.19). For SOL↓, the conditioned SOL HDF
% resulted in a decrease from baseline that 370
approached statistical significance (-16.17 % ± 26.22, p = 0.09) (Table 2) and a moderate 371
training effect was observed (SRM = -0.62). SOL HDF
-reflex responses during training sessions 372
2 and 11 for an example participant are illustrated in Figure 4. 373
<< INSERT FIGURE 4 AND TABLE 2 ABOUT HERE >> 374
Change in clinical measures and effect size (standardized response mean) 375
Change in PF reflex threshold angle was the only clinical measure for which there was a 376
between-groups difference that approached statistical significance (Table 2). This angle 377
decreased toward more dorsiflexion for TA↑ (-4.33°) and did not change significantly for SOL↓ 378
(+3.15°) (Table 2). Within-group analysis of data from the TA↑ group identified five clinical 379
measures that achieved statistical significance and had a large effect size. These outcomes were: 380
decreased PF reflex threshold angle (-4.33°) and DF active ROM angle (-4.32°), and increased 381
dorsiflexion LEMS (+0.8 points), walking foot clearance (+4.8 mm), and walking distance 382
(+12.09 m) (Table 2). In addition, an increase in LEMS for training leg (+2.2 points) and non-383
training leg (+0.8 points) approached statistical significance and demonstrated a large effect size 384
(Table 2). Within-group analysis of data from the SOL↓ group identified one clinical measure, 385
increased walking distance (+6.25 m), achieved statistical significance and had a large effect size 386
(Table 2). In addition, two clinical measures approached statistical significance: increased non-387
training leg LEMS (+1.8 points), which demonstrated a large effect size, and increased walking 388
speed (+0.02 m/s), which demonstrated a moderate effect size (Table 2). A power analysis of 389

TA EMG and SOL H-reflex Training Improves Function in SCI
17
the training and clinical outcomes that approached statistical significance revealed that our study 390
was considerably underpowered to detect change in the following measures: SOL HDF% (31%), 391
SOL and TA non-training LEMS (33%), TA non-training LEMS (20%), SOL walking speed 392
(14%), and between-groups difference for PF reflex threshold angle (34%). 393
Change in neurophysiologic measures and effect size (standardized response mean) 394
The only neurophysiologic measure in which we observed a significant change was 395
SOL/TA clonus coactivation ratio, which decreased (-0.21) for the SOL↓ group and exhibited a 396
moderate effect size (Table 2). 397
Relationship among training, clinical, and neurophysiologic outcomes 398
TA↑ 399
We had hypothesized TA↑, which was intended to activate SOL RI and PI pathways, 400
would be associated with increased DF active ROM and strength, walking foot clearance, speed, 401
and distance. We did not find a significant change in SOL RI, PI, or walking speed. However, 402
increased walking distance was moderately correlated with increased DF (r = 0.66, p = 0.08), and 403
training leg strength (r = 0.62, p = 0.10) (Figure 5). 404
<< INSERT FIGURE 5 ABOUT HERE >> 405
SOL↓ 406
We had hypothesized SOL↓ would be associated with increased SOL H-reflex LFD and 407
decreased SOL/TA clonus coactivation that would be related to decreased clonus duration, 408
decreased PF reflex threshold angle, and enhanced toe tap count. We did not find significant 409
change in SOL LFD, clonus duration, PF reflex threshold angle, or toe tap count. However, 410
decreased SOL/TA clonus coactivation ratio (-0.21, p = 0.02) was moderately correlated with 411
increased walking speed and distance (both r = -0.60, p = 0.10) (Figure 6). 412

TA EMG and SOL H-reflex Training Improves Function in SCI
18
<< INSERT FIGURE 6 ABOUT HERE >> 413
DISCUSSION 414
We investigated whether operant conditioning to either increase voluntary TA activation 415
or decrease SOL H-reflexes improved ankle clonus, motor control, or walking function in 416
individuals with AIS D SCI. We also explored relationships among change in training, clinical, 417
and neurophysiologic outcomes. Our hypotheses that TA↑ would increase DF active ROM and 418
strength, walking foot clearance, and walking distance were supported; however, improvement 419
in walking speed was not attained. In addition, an unexpected outcome of decreased PF reflex 420
threshold angle was observed. For SOL↓ our hypothesis of decreased SOL/TA coactivation was 421
supported; however, decreased clonus duration and PF reflex threshold angle, and increased toe 422
tap count were not observed. Unexpectedly, SOL↓ was associated with increased walking 423
distance. Only one measure, PF reflex threshold angle, differed substantially between the two 424
groups. Our findings provide evidence that both TA↑ and SOL↓ were associated with significant 425
improvement in distance walked during a 2-minute period. Each training protocol may have 426
modulated clinical and neurologic variables in unique ways. 427
Change in Training Measures 428
TA↑ was associated with an increase in TA contraction strength (%MVC amplitude) of 429
approximately 48% (Figure 5), a finding consistent with prior reports of increased voluntary 430
EMG responses after such training (Brucker and Bulaeva 1996; Seymour and Bassler 1977). 431
SOL↓ was associated with a decrease in SOL H-reflex excitability (conditioned SOL HDF
%) of 432
about 16% that approached statistical significance (Figure 6). This result concurs with 433
Thompson et al. (2008) who reported a 10 – 15% reduction after down-conditioning of SOL H-434
reflex in standing for three individuals with SCI. Our mean training dosage was approximately 435

TA EMG and SOL H-reflex Training Improves Function in SCI
19
3000 repetitions (300 X 12 training sessions) for TA↑ and SOL↓ and was less than the dosage of 436
5400 repetitions used in other studies (Birkenmeier et al. 2010; Thompson et al. 2009). Our 437
results are similar to Thompson et al. (2009) who used 225 repetitions per session and reported a 438
significant decrease in the conditioned SOL H-reflex within sessions 7 – 12 that continued to 439
decrease through session 24; change the investigators attributed to early phase task-dependent 440
adaptation. Thompson et al. (2009) also identified a significant change in the control SOL H-441
reflex within sessions 19 – 24 that was attributed to a long-term change in spinal cord plasticity. 442
In our participants with spinal cord injury, we observed a decrease in conditioned SOL H-reflex 443
that approached significance after 12 sessions; an additional six sessions (total of 5400 444
repetitions) may have improved the effectiveness of SOL↓ training. Further study is needed to 445
assess the most effective dosage-response parameters. 446
Effects of TA↑ and SOL↓ on Clinical Measures of Ankle Motor Control 447
Change in PF reflex threshold angle was the only outcome that differed substantially 448
between the two groups. TA↑ exhibited a decreased angle (i.e., towards more dorsiflexion, 449
indicating a more lengthened plantar flexor position at which stretch of the soleus evoked a 450
reflex contraction), signifying decreased responsiveness to muscle stretch and therefore 451
decreased spasticity (Ness and Field-Fote 2009). TA↑ was effective in enhancing TA activation, 452
as exhibited by increased DF active ROM and strength. In addition, increased DF strength was 453
associated with increased walking distance (Figure 5). Functional magnetic resonance imaging 454
studies suggest that 10° of voluntary ankle dorsiflexion is a useful measure of motor control of 455
walking that in depends, in part, upon increased TA activation (Dobkin et al. 2004). 456
In non-disabled individuals, PI of SOL motor neurons increases 60 – 80 ms after onset of 457
voluntary TA EMG activation, and the extent of inhibition is proportional to TA contraction 458

TA EMG and SOL H-reflex Training Improves Function in SCI
20
strength (Meunier and Morin 1989). Our findings for TA↑ of increased DF active ROM and 459
strength are congruent with a supraspinally-mediated enhancement of SOL PI. However, our 460
findings of no change in PI are in conflict with a mechanism of enhanced SOL PI. A possible 461
explanation is that SOL PI was tested at rest, which may not reflect modulation of the PI 462
pathway during active dorsiflexion. 463
TA↑ was associated with an increase in both training leg and non-training leg strength 464
that approached statistical significance (Figure 5), while SOL↓ was associated with an increase 465
in non-training leg strength that approached statistical significance (Figure 6). The finding of 466
increased strength in the non-training leg for both groups was unexpected. For TA↑ increased 467
DF strength and training leg strength were correlated with increased walking distance (Figure 5). 468
We surmise that TA↑ improved the ability to isolate and activate dorsiflexors in the weaker 469
training leg, which likely contributed to the ability to walk farther distances. Participants were 470
not restricted from walking outside of training sessions and reported the ability to walk farther 471
distances during their daily activities, which likely provided an opportunity for re-conditioning 472
of the non-training leg. Our finding of increased non-training leg strength is also congruent with 473
studies of contralateral strength training, wherein increased motor neuron output, increased 474
strength, and decreased H-reflex gain in the untrained homonymous muscle have been reported 475
(Dragert and Zehr 2012, Carroll et al 2006, Hortobagyi 2005). Wolf et al 1995 reported a 476
contralateral effect after down-training of biceps brachii stretch reflexes in human subjects 477
wherein contralateral responses were reduced to 80% of baseline. The authors suggested that 478
both intra-spinal mechanisms and bilateral descending systems may contribute to this 479
contralateral training effect. 480
481

TA EMG and SOL H-reflex Training Improves Function in SCI
21
Effects of TA↑ and SOL↓ on Walking Function 482
Both TA↑ and SOL↓ were associated with increased walking distances (Table 2) that 483
exceeded the minimally important difference of 4 meters reported for the 2-minute walk test in 484
individuals with motor-incomplete SCI (Field-Fote and Roach 2011). The cumulative effects of 485
TA↑ (decreased PF reflex threshold angle and increased DF active ROM, DF and leg strength, 486
foot clearance and walking distance) (Figure 5) are consistent with a mechanism of increased 487
corticospinal activation. Upon initiation of voluntary DF, the corticospinal tract activates TA 488
motor neurons in parallel with activation of interneurons mediating PI and RI of SOL motor 489
neurons (Iles and Pisini 1992). Our findings are consistent with studies of locomotor training 490
effects in chronic motor-incomplete SCI that report increased voluntary activation of TA and 491
slope of TMS-elicited TA motor evoked potential recruitment curves; findings that provide 492
evidence of a training-induced increase in corticospinal excitability (Thomas and Gorassini 493
2005). 494
For SOL↓, decreased SOL/TA coactivation was associated with increased walking 495
distance and increased walking speed that approached statistical significance (Figure 6). 496
However, the increase in speed did not exceed the minimally important difference of 0.05 m/s 497
reported for individuals with SCI (Musselman 2007). The SOL↓ effects are consistent with 498
improved SOL reflex modulation during walking. Both excitatory and inhibitory Ib interneuron 499
pathways to ankle extensors are easily activated by the corticospinal tract during voluntary 500
movement (Jankowska 1992), and appear to regulate stance-to-swing phase transition during 501
locomotion (Pearson et al. 1992). The cumulative effects of SOL↓ may be attributable to a Ib 502
neuroplastic effect of SOL↓ that may have contributed to improved walking function (Figure 6). 503
504
TA EMG and SOL H-reflex Training Improves Function in SCI
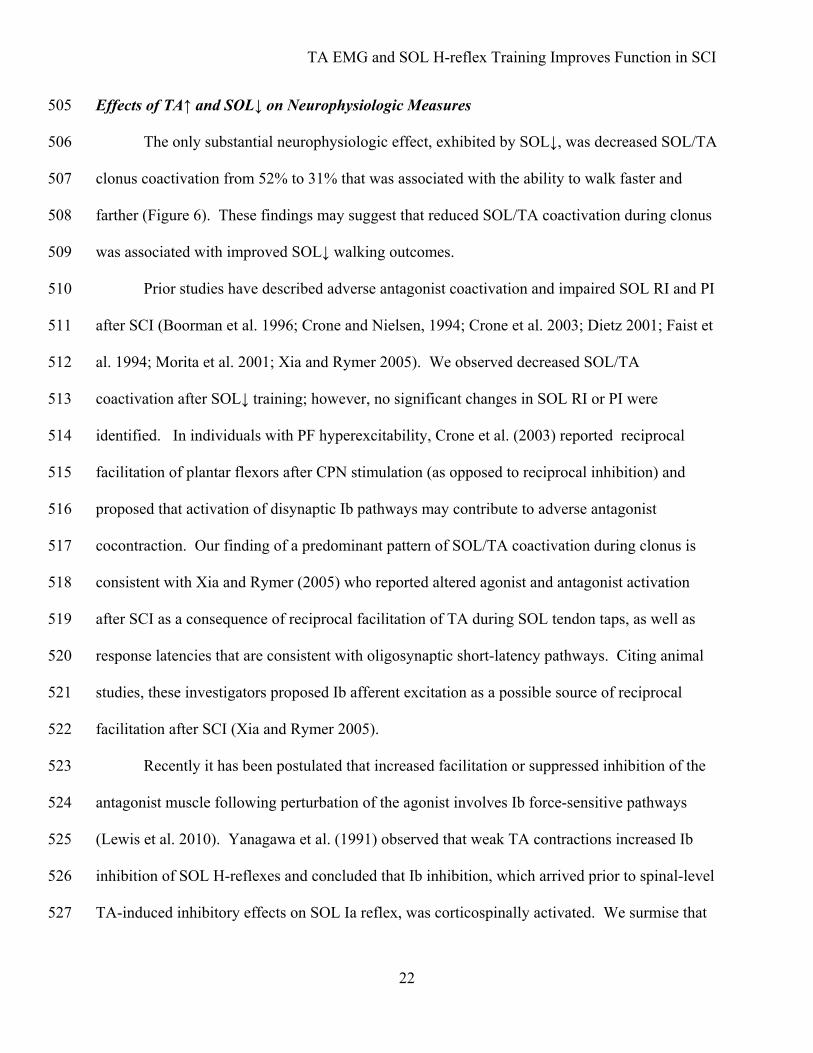
22
Effects of TA↑ and SOL↓ on Neurophysiologic Measures 505
The only substantial neurophysiologic effect, exhibited by SOL↓, was decreased SOL/TA 506
clonus coactivation from 52% to 31% that was associated with the ability to walk faster and 507
farther (Figure 6). These findings may suggest that reduced SOL/TA coactivation during clonus 508
was associated with improved SOL↓ walking outcomes. 509
Prior studies have described adverse antagonist coactivation and impaired SOL RI and PI 510
after SCI (Boorman et al. 1996; Crone and Nielsen, 1994; Crone et al. 2003; Dietz 2001; Faist et 511
al. 1994; Morita et al. 2001; Xia and Rymer 2005). We observed decreased SOL/TA 512
coactivation after SOL↓ training; however, no significant changes in SOL RI or PI were 513
identified. In individuals with PF hyperexcitability, Crone et al. (2003) reported reciprocal 514
facilitation of plantar flexors after CPN stimulation (as opposed to reciprocal inhibition) and 515
proposed that activation of disynaptic Ib pathways may contribute to adverse antagonist 516
cocontraction. Our finding of a predominant pattern of SOL/TA coactivation during clonus is 517
consistent with Xia and Rymer (2005) who reported altered agonist and antagonist activation 518
after SCI as a consequence of reciprocal facilitation of TA during SOL tendon taps, as well as 519
response latencies that are consistent with oligosynaptic short-latency pathways. Citing animal 520
studies, these investigators proposed Ib afferent excitation as a possible source of reciprocal 521
facilitation after SCI (Xia and Rymer 2005). 522
Recently it has been postulated that increased facilitation or suppressed inhibition of the 523
antagonist muscle following perturbation of the agonist involves Ib force-sensitive pathways 524
(Lewis et al. 2010). Yanagawa et al. (1991) observed that weak TA contractions increased Ib 525
inhibition of SOL H-reflexes and concluded that Ib inhibition, which arrived prior to spinal-level 526
TA-induced inhibitory effects on SOL Ia reflex, was corticospinally activated. We surmise that 527

TA EMG and SOL H-reflex Training Improves Function in SCI
23
decreased coactivation of SOL and TA during clonus following SOL↓ (which employed weak 528
TA contractions) may be attributable to enhanced Ib inhibitory mechanisms. 529
Conclusion and Functional Implications 530
Two operant conditioning training programs, one to increase voluntary dorsiflexor motor 531
control and the other to decrease plantar flexor stretch reflex excitability, were both associated 532
with improved walking function in individuals with chronic motor-incomplete spinal cord injury. 533
TA↑ decreased plantar flexor spasticity, increased ankle motor control and was associated 534
with increased walking foot clearance and walking distance. Step initiation is mediated by 535
supraspinal input to spinal interneurons that activate stepping (Gerasimenko et al. 2002) and the 536
corticospinal tract is more closely linked with TA and leg flexor spinal motor circuits (Capaday 537
et al. 1999; Schubert et al. 1997). Intensive, repetitive TA EMG activation during TA↑ may 538
have unmasked dormant corticospinal pathways that preferentially increased recruitment of TA 539
and leg flexor motor neurons, step initiation and walking function. 540
SOL↓ was associated with decreased SOL/TA coactivation during clonus and increased 541
walking distance. Antagonist coactivation modulation has been attributed to Ib input to spinal 542
interneurons (Feldman 1993, Morita et al. 2006, Yanagawa et al. 1991). It is possible that 543
intensive training to inhibit SOL H-reflexes during weak voluntary TA contractions enhanced 544
corticospinal activation of SOL Ib interneurons, and the combined effects of decreased SOL/TA 545
clonus coactivation and increased SOL stretch reflex inhibition improved ankle motor control 546
and walking function. 547
Our study was considerably underpowered to detect change in SOL HDF%, TA training 548
LEMS, TA and SOL non-training LEMS, and SOL walking speed. However, change in these 549
measures did approach statistical significance, and since the minimal clinically important 550

TA EMG and SOL H-reflex Training Improves Function in SCI
24
difference (MCID) for most of these measures is not known, it is possible that the changes 551
observed may be clinically relevant. The MCID for walking speed is 0.05m/s, the mean change 552
of 0.4m/s in the TA↑ approached this value. There were subjects in both groups that met the 553
criteria for clinically meaningful improvement in walking speed. We included these outcomes in 554
our discussion and interpretation of results to elucidate clinically relevant relationships among 555
change in training and clinical measures. 556
LIMITATIONS 557
Our two-group pre-test post-test randomized design allowed us to compare two different 558
interventions. Our study design lacked a no-treatment control group, which limits interpretation 559
of whether either training approach was more beneficial than no intervention (Portney and 560
Watkins 2000). However, given the chronicity of SCI in our participants, little change in motor 561
function and reflex activity would be expected in the absence of an intervention. We did not 562
monitor or control for background SOL EMG during SOL↓ training, therefore the effects of SOL 563
EMG activity on modulation of the SOL H-reflex are not known, which may have limited our 564
ability to fully assess the extent of inhibition. Additionally, the neurophysiologic tests for SOL 565
RI, PI, and LFD were performed at rest. Performing these tests during dorsiflexion may have 566
better elucidated modulation of these pathways during movement. Our conclusions are restricted 567
to outcomes observed in a small sample of individuals with AIS D SCI. Further research is 568
warranted to corroborate effects of TA↑ and SOL↓ in AIS D SCI and generalizability to 569
individuals with other similar upper motor neuron pathology and functional limitations. 570
ACKNOWLEDGEMENTS 571
The authors thank Simon Gray for software design, Ian Hentall, PhD, for footswitch 572
design, Meggie Safford, DPT, and Rachel Cowen, PhD, for data processing assistance, the 573

TA EMG and SOL H-reflex Training Improves Function in SCI
25
support of the Miami Project to Cure Paralysis, the contributions of Christine K. Thomas, PhD, 574
and T. George Hornby, PT, PhD to manuscript development, and the time and effort volunteered 575
by our research participants with spinal cord injury. 576
. 577
578
579
580

TA EMG and SOL H-reflex Training Improves Function in SCI
26
REFERENCES 581
American Spinal Injury Association. Reference Manual of the International Standards for 582
Neurological Classification of Spinal Cord Injury Chicago, IL: American Spinal Injury 583
Association, 2002. 584
Bakker M, Overeem S, Snijders AH, Borm G, van Elswijk G, Toni I, Bloem BR. Motor 585
imagery of foot dorsiflexion and gait: effects on corticospinal excitability. Clin Neurophysiol 586
119: 11: 2519-2527, 2008. 587
Beekhuizen KS, Field-Fote EC. Massed practice versus massed practice with stimulation: 588
effects on upper extremity function and cortical plasticity in individuals with incomplete 589
cervical spinal cord injury. Neurorehabil Neural Repair 19: 1: 33-45, 2005. 590
Benz EN, Hornby TG, Bode RK, Scheidt RA, Schmit BD. A physiologically based clinical 591
measure for spastic reflexes in spinal cord injury. Arch Phys Med Rehabil 86; 52-59, 2005. 592
Beres-Jones JA, Johnson TD, Harkema SJ. Clonus after human spinal cord injury cannot be 593
attributed solely to recurrent muscle-tendon stretch. Exp Brain Res 149: 2: 222-236, 2003. 594
Birkenmeier RL, Prager EM, Lang CE. Translating animal doses of task-specific training to 595
people with chronic stroke in 1-hour therapy sessions: a proof-of-concept study. Neurorehabil 596
Neural Repair 24: 7: 620-635, 2010. 597
Boorman GI, Lee RG, Becker WJ, Windhorst UR. Impaired "natural reciprocal inhibition" in 598
patients with spasticity due to complete spinal cord injury. Electromyogr Clin Neurophysiol 599
101: 84-92, 1996. 600
Brucker BS, Bulaeva NV. Biofeedback effect on electromyography responses in patients with 601
spinal cord injury. Arch Phys Med Rehabil 77: 2: 133-137, 1996. 602

TA EMG and SOL H-reflex Training Improves Function in SCI
27
Carroll TJ, Herbert RD, Munn J, Lee ML, Gandevia SC. Contralateral effects of unilateral 603
strength training: evidence and possible mechanisms. J Appl Physiol 101: 1514-1522, 2006. 604
Crone C, Hultborn H, Jespersen B, Nielsen J. Reciprocal Ia inhibition between ankle flexors 605
and extensors in man. J Physiol 389: 163-185, 1987. 606
Crone C, Hultborn H, Mazieres L, Morin C, Nielsen J, Pierrot-Deseilligny E. Sensitivity of 607
monosynaptic test reflexes to facilitation and inhibition as a function of the test reflex size: a 608
study in man and the cat. Exp Brain Res 81: 1: 35-45, 1990. 609
Crone C, Johnsen LL, Biering-Sorensen F, Nielsen JB. Appearance of reciprocal facilitation 610
of ankle extensors from ankle flexors in patients with stroke or spinal cord injury. Brain 126: 611
Pt 2: 495-507, 2003. 612
Crone C, Nielsen J. Spinal mechanisms in man contributing to reciprocal inhibition during 613
voluntary dorsiflexion of the foot. J Physiol 416:255-272, 1989. 614
Crone C, Nielsen J. Central control of disynaptic reciprocal inhibition in humans. Acta Physiol 615
Scand 152: 4: 351-363, 1994. 616
Davies S, Illis LS, Raisman G. Regeneration in the central nervous system and related factors. 617
Summary of the Bermuda Paraplegia Conference, April 1994 (International Spinal Research 618
Trust). Paraplegia 33: 1: 10-17, 1995. 619
Decq P. Pathophysiology of spasticity. Neurochirurgie 49: 2-3 Pt 2: 163-184, 2003. 620
Dietz V. Spinal cord lesion: effects of and perspectives for treatment. Neural Plast 8: 1-2: 83-90, 621
2001. 622
Dietz V. Locomotor recovery after spinal cord injury. Trends Neurosci 20: 8: 346-347, 1997. 623
Dragert K, Zehr EP. High-intensity unilateral dorsiflexor resistance training results in bilateral 624
neuromuscular plasticity after stroke. Exp Brain Res Nov 30 2012 [Epub ahead of print]. 625

TA EMG and SOL H-reflex Training Improves Function in SCI
28
Evatt ML, Wolf SL, Segal RL. Modification of human spinal stretch reflexes: preliminary 626
studies. Neurosci Lett 105: 3: 350-355, 1989. 627
Faist M, Mazevet D, Dietz V, Pierrot-Deseilligny E. A quantitative assessment of presynaptic 628
inhibition of Ia afferents in spastics. Differences in hemiplegics and paraplegics. Brain 117 ( 629
Pt 6): Pt 6: 1449-1455, 1994. 630
Feldman AG. The coactivation command for antagonist muscles involving Ib interneurons in 631
mammalian motor control systems: an electrophysiologically testable model. Neurosci Lett 632
155: 2: 167-170, 1993. 633
Field-Fote EC. Electrical stimulation modifies spinal and cortical neural circuitry. Exerc Sport 634
Sci Rev 32: 4: 155-160, 2004. 635
Field-Fote EC, Brown KM, Lindley SD. Influence of posture and stimulus parameters on post-636
activation depression of the soleus H-reflex in individuals with chronic spinal cord injury. 637
Neurosci Lett 410: 1: 37-41, 2006. 638
Field-Fote EC, Roach KE. Influence of a locomotor training approach on walking speed and 639
distance in people with chronic spinal cord injury: a randomized clinical trial. Phys Ther 91: 640
1: 48-60, 2011. 641
Gerasimenko YP, Makarovskii AN, Nikitin OA. Control of locomotor activity in humans and 642
animals in the absence of supraspinal influences. Neurosci Behav Physiol 32: 4: 417-423, 643
2002. 644
Gracies JM. Pathophysiology of spastic paresis. II: Emergence of muscle overactivity. Muscle 645
Nerve 31: 5: 552-571, 2005. 646

TA EMG and SOL H-reflex Training Improves Function in SCI
29
Grey MJ, Klinge K, Crone C, Lorentzen J, Biering-Sorensen F, Ravnborg M, Nielsen JB. 647
Post-activation depression of soleus stretch reflexes in healthy and spastic humans. Exp Brain 648
Res 185: 2: 189-197, 2008. 649
Hortobagyi T. Cross education and the human central nervous system. IEEE Eng Med Biol Mag 650
24: 22-28, 2005. 651
Hultborn H. Changes in neuronal properties and spinal reflexes during development of 652
spasticity following spinal cord lesions and stroke: studies in animal models and patients. J 653
Rehabil Med (41 Suppl): 41 Suppl: 46-55, 2003. 654
Iles JF, Pisini JV. Cortical modulation of transmission in spinal reflex pathways of man. J 655
Physiol 455: 425-446, 1992. 656
Jankowska E. Interneuronal relay in spinal pathways from proprioceptors. Prog Neurobiol 38: 657
335-378, 1992. 658
Katz RT, Rymer WZ. Spastic hypertonia: mechanisms and measurement. Arch Phys Med 659
Rehabil 70: 2: 144-155, 1989. 660
Knights RM, Moule AD. Normative and reliability data on finger and foot tapping in children. 661
Percept Mot Skills 25: 3: 717-720, 1967. 662
Koelman JH, Bour LJ, Hilgevoord AA, van Bruggen GJ, Ongerboer de Visser BW. Soleus 663
H-reflex tests and clinical signs of the upper motor neuron syndrome. J Neurol Neurosurg 664
Psychiatry 56: 7: 776-781, 1993. 665
Levin MF, Hui-Chan C. Ankle spasticity is inversely correlated with antagonist voluntary 666
contraction in hemiparetic subjects. Electromyogr Clin Neurophysiol 34: 7: 415-425, 1994. 667

TA EMG and SOL H-reflex Training Improves Function in SCI
30
Lewis GN, MacKinnon CD, Trumbower R, Perreault EJ. Co-contraction modifies the stretch 668
reflex elicited in muscles shortened by a joint perturbation. Exp Brain Res 207: 1-2: 39-48, 669
2010. 670
Liang MH, Fossel AH , Larson MG. Comparisons of five health status instruments for 671
orthopedic evaluation. Med Care 28: 7: 632-642, 1990. 672
Lloyd DP , Wilson VJ. Reflex depression in rhythmically active monosynaptic reflex pathways. 673
J Gen Physiol 40: 3: 409-426, 1957. 674
Manella KJ , Field-Fote EC. Ankle Clonus Drop Test and angle of muscle reaction for 675
assessing plantar flexor spasticity after spinal cord injury. 2010 Combined Sections Meeting, 676
San Diego, CA: American Physical Therapy Association, 2010. Online. 677
http://www.neuropt.org/. 678
Manella KJ , Field-Fote EC. Biomechanical measures of ankle clonus correlate with clinical 679
and electrophysiologic reflex measures. Program No. 861.16. 2009 Neuroscience Meeting 680
Planner. Chicago, IL: Society for Neuroscience, 2009. Online. http://www.sfn.org/ 681
Marino RJ, Barros T, Biering-Sorensen F, Burns SP, Donovan WH, Graves DE, Haak M, 682
Hudson LM, Priebe MM , ASIA Neurological Standards Committee 2002. International 683
standards for neurological classification of spinal cord injury. J Spinal Cord Med 26 Suppl 1: 684
S50-6, 2003. 685
Meunier S, Morin C. Changes in presynaptic inhibition of Ia fibres to soleus motoneurones 686
during voluntary dorsiflexion of the foot. Exp Brain Res 76: 3: 510-518, 1989. 687
Morin C, Pierrot-Deseilligny E. Role of Ia afferents in the soleus motoneurones inhibition 688
during a tibialis anterior voluntary contraction in man. Exp Brain Res 27:509-522, 1977. 689

TA EMG and SOL H-reflex Training Improves Function in SCI
31
Morita H, Crone C, Christenhuis D, Petersen NT , Nielsen JB. Modulation of presynaptic 690
inhibition and disynaptic reciprocal Ia inhibition during voluntary movement in spasticity. 691
Brain 124: Pt 4: 826-837, 2001. 692
Morita H, Shindo M, Momoi H, Yanagawa S, Ikeda S , Yanagisawa N. Lack of modulation 693
of Ib inhibition during antagonist contraction in spasticity. Neurology 67: 1: 52-56, 2006. 694
Musselman K. Clinical significance testing in rehabilitation research: what, why, and how? 695
Phys Ther Rev 12: 287-296, 2007. 696
Ness LL , Field-Fote EC. Effect of whole-body vibration on quadriceps spasticity in individuals 697
with spastic hypertonia due to spinal cord injury. Restor Neurol Neurosci 27: 6: 621-631, 698
2009. 699
Pearson KG, Ramirez JM, Jiang W. Entrainment of the locomotor rhythm by group Ib 700
afferents from ankle extensor muscles in spinal cats. Exp Brain Res 90: 557-566, 1992. 701
Pierrot-Deseilligny E, Burke D. Monosynaptic Ia excitation and post-activation depression. In: 702
The Circuitry of the Human Spinal Cord. New York: Cambridge University Press, p. 63-106, 703
2005. 704
Portney LG, Watkins MP. Experimental Design. In: Foundations of Clinical Research: 705
Applications to Practice. New Jersey: Prentice Hall Health, p. 180, 2000. 706
Rainoldi A, Melchiorri G , Caruso I. A method for positioning electrodes during surface EMG 707
recordings in lower limb muscles. J Neurosci Methods 134: 1: 37-43, 2004. 708
Schindler-Ivens S, Shields RK. Low frequency depression of H-reflexes in humans with acute 709
and chronic spinal-cord injury. Exp Brain Res 133: 2: 233-241, 2000. 710
Schubert M, Curt A, Jensen L, Dietz V. Corticospinal input in human gait: modulation of 711
magnetically evoked motor responses. Exp Brain Res 115: 2: 234-246, 1997. 712

TA EMG and SOL H-reflex Training Improves Function in SCI
32
Segal RL. Plasticity in the central nervous system: operant conditioning of the spinal stretch 713
reflex. Top Stoke Rehabil 3: 76-87, 1997. 714
Seymour RJ , Bassler CR. Electromyographic biofeedback in the treatment of incomplete 715
paraplegia. Phys Ther 57: 10: 1148-1150, 1977. 716
Stein RB, Brucker BS , Ayyar DR. Motor units in incomplete spinal cord injury: electrical 717
activity, contractile properties and the effects of biofeedback. J Neurol Neurosurg Psychiatry 718
53: 10: 880-885, 1990. 719
Thomas SL, Gorassini MA. Increases in corticospinal tract function by treadmill training after 720
incomplete spinal cord injury. J Neurophysiol 94: 4: 2844-2855, 2005. 721
Thompson AK, Chen XY, Wolpaw JR. Acquisition of a simple motor skill: task-dependent 722
adaptation plus long-term change in the human soleus H-reflex. J Neurosci 29: 18: 5784-723
5792, 2009. 724
Thompson AK, Estabrooks KL, Chong SL, Stein RB. Spinal reflexes and ankle flexor and 725
extensor muscles after chronic central nervous system lesions and functional electrical 726
stimulation. Neurorehabil Neural Repair 23; 133-142, 2009. 727
Thompson AK, Stein RB, Chen XY , Wolpaw JR. Modulation in spinal circuits and 728
corticospinal connections following nerve stimulation and operant conditioning. Conf Proc 729
IEEE Eng Med Biol Soc 1: 2138-2141, 2006. 730
Thompson A, Wolpaw JR, Lichtman SW, Defrancesco E, Pomerantz F. Operant down-731
conditioning of soleus H-reflex in incomplete spinal cord injury. Program No. 73.4. 2008 732
Neuroscience Meeting Planner. Washington, DC: Society for Neuroscience, 2008. Online. 733
Wallace DM, Ross BH , Thomas CK. Motor unit behavior during clonus. J Appl Physiol 99: 6: 734
2166-2172, 2005. 735

TA EMG and SOL H-reflex Training Improves Function in SCI
33
Wolf SL, Segal RL. Reducing human biceps brachii spinal stretch reflex magnitude. J 736
Neurophysiol 75: 4: 1637-1646, 1996. 737
Wolf SL, Segal RL, Heter ND, Catlin PA. Contralateral and long latency effects of human 738
biceps brachii stretch reflex conditioning. Exp Brain Res 107: 96-102, 1995. 739
Wolpaw JR, Chen XY. The cerebellum in maintenance of a motor skill: a hierarchy of brain 740
and spinal cord plasticity underlies H-reflex conditioning. Learn Mem 13: 2: 208-215, 2006. 741
Wolpaw JR, Chen XY. Operant conditioning of rat H-reflex: effects on mean latency and 742
duration. Exp Brain Res 136: 2: 274-279, 2001. 743
Wolpaw JR, Herchenroder PA. Operant conditioning of H-reflex in freely moving monkeys. J 744
Neurosci Methods 31: 2: 145-152, 1990. 745
Xia R, Rymer WZ. Reflex reciprocal facilitation of antagonist muscles in spinal cord injury. 746
Spinal Cord 43: 1: 14-21, 2005. 747
Yanagawa S, Shindo M, Nakagawa S. Increase in Ib inhibition by antagonistic voluntary 748
contraction in man. J Physiol 440: 311-323, 1991. 749
Yang JF, Fung J, Edamura M, Blunt R, Stein RB , Barbeau H. H-reflex modulation during 750
walking in spastic paretic subjects. Can J Neurol Sci 18: 4: 443-452, 1991. 751
Zijdewind I, Thomas CK. Motor unit firing during and after voluntary contractions of human 752
thenar muscles weakened by spinal cord injury. J Neurophysiol 89: 4: 2065-2071, 2003. 753
754
755

TA EMG and SOL H-reflex Training Improves Function in SCI
34
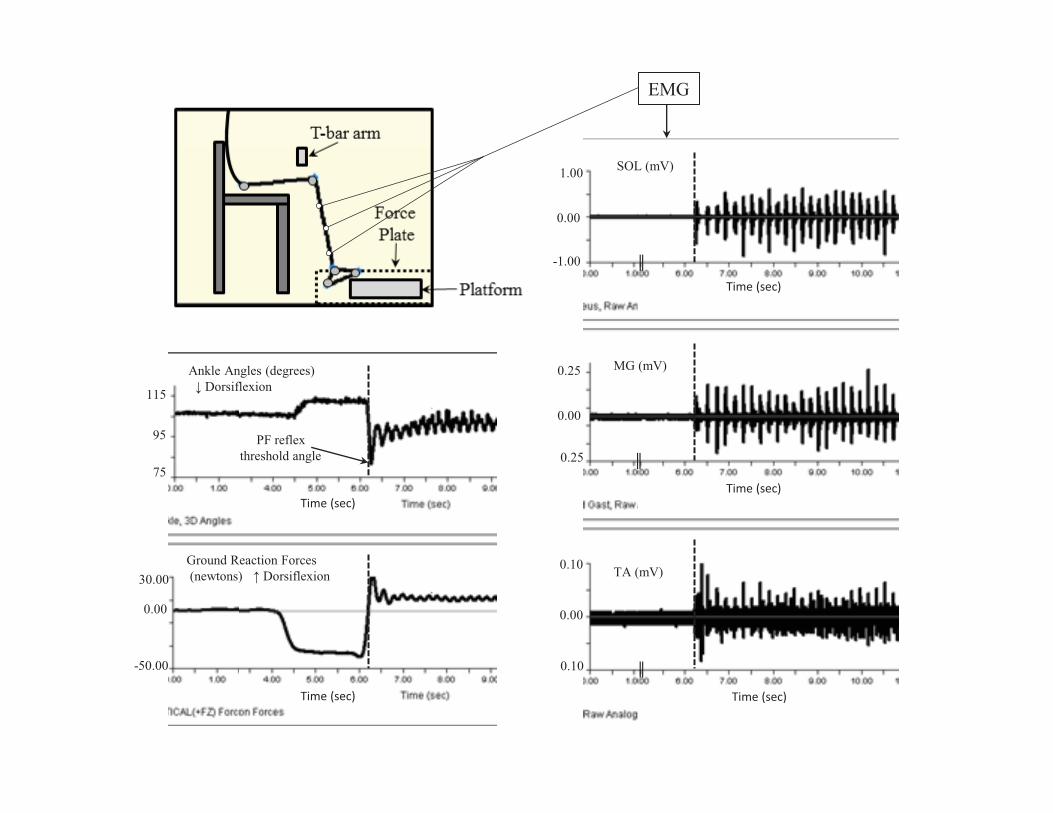
FIGURE LEGEND 756 757 Figure 1. Methodological design of study. RI, reciprocal inhibition; PI, presynaptic inhibition; 758 LFD, low frequency depression; SOL/TA, soleus/tibialis anterior; PF, plantar flexor; DF, 759 dorsiflexion; ROM, range of motion; LE, lower extremity; MVC, maximum voluntary 760 contraction. 761 762 Figure 2. Schematic of ankle clonus drop test set-up and kinematic, kinetic, and EMG output. 763 PF, plantar flexor; SOL, soleus; MG, medial gastrocnemius; TA, tibialis anterior. 764 765 Figure 3. Feedback displays and change in performance measures. A. TA↑ training display: left 766 screen, TA EMG feedback and reward; right screen, TA%MVC amplitude target and response. B. 767 SOL↓ training display: left screen SOL H-reflex stimulus, M-wave, and HDF-reflex; right screen, 768 SOL HDF-reflex amplitude target and response. C. TA↑ graph of change in mean TA %MVC 769 amplitude, (*) p = 0.02. D. SOL↓ graph of change in conditioned SOL H
DF reflex (% baseline), 770
(+) p = 0.09. Week 1= Baseline, Week 5 = last week of training. (Wilcoxon signed ranks one-771 tailed tests) 772 773 Figure 4. Example of effect of SOL↓ training on SOL HDF –reflex amplitude responses in one 774 participant. A. Training session 2. B. Training session 11. Black line, SOL HDF –reflex 775 responses; Grey line, M-wave responses evoked at 10-30% Mmax stimulus intensity. Baseline 776 bout, 30 repetitions without feedback; Training bouts, 30 repetitions with feedback with 1-minute 777 rests between bouts. 778 779 Figure 5. Effects of TA (↑) training. Change in outcome measures and change score 780 correlations. Solid single headed arrow, p ≤ 0.05, change achieved significance; Dashed single 781 headed arrow, 0.05 < p ≤ 0.10, change approached statistical significance; Dashed double 782 headed arrow, moderate correlation, 0.5 ≤ r < 0.75, 0.05 < p ≤ 0.10; Spearman correlation 783 coefficients, one-tailed test. 784 785 Figure 6. Effects of SOL (↓) training. Change in outcome measures and change score 786 correlations. Solid single headed arrow, p ≤ 0.05, change achieved statistical significance; 787 Dashed single headed arrow, 0.05 < p ≤ 0.10, change approached statistical significance; Dashed 788 double headed arrow, moderate correlation, 0.5 ≤ r < 0.75, 0.05 < p ≤ 0.10; Spearman correlation 789 coefficients, one-tailed test. 790
791

TA EMG and SOL H-reflex Training Improves Function in SCI
35
Appendix 1. List of Abbreviations 792 793 AIS – ASIA Impairment Scale 794
ASIA – American Spinal Injury Association 795
CPN – common peroneal nerve 796
DF - dorsiflexion 797
DFAROM – dorsiflexion active range of motion 798
EMG - electromyography 799
FN – femoral nerve 800
H/M – H-reflex/M-wave ratio 801
HDF
– H-reflex during dorsiflexion 802
HmaxDF
– H-reflex maximum amplitude during dorsiflexion 803
Hmaxrest
- H-reflex maximum amplitude at rest 804
ISI – inter-stimulus interval 805
LEMS – lower extremity motor score 806
LFD – low frequency depression 807
MmaxDF
– M-wave maximum amplitude during dorsiflexion 808
Mmaxrest
– M-wave maximum amplitude at rest 809
MVC – maximum voluntary contraction 810
PF – plantar flexion 811
PFRTA – plantar flexion reflex threshold angle 812
PI – presynaptic inhibition 813
PTN – posterior tibial nerve 814
RI – reciprocal inhibition 815

TA EMG and SOL H-reflex Training Improves Function in SCI
36
ROM – range of motion 816
SCI – spinal cord injury 817
SOL - soleus 818
SRM – standardized response mean 819
TA – tibialis anterior 820
TTL – Transistor-Transistor Logic 821
822 823 824 825 826
827 828

TA EMG and SOL H-reflex Training Improves Function in SCI
37
Appendix 2A. Pre-intervention relationships between neurophysiologic measures and clinical and walking measures. 829 Measure Clonus
duration Plantar flexor Reflex Threshold Angle
Toe Tap Test
Dorsiflexion active ROM
Dorsiflexion strength
Plantar flexion strength
Training leg strength
Non-training leg strength
Foot Clear-ance
Distance Speed
RI (%)
0.035 0.457
-0.280 0.189
-0.028 0.465
0.077 0.406
-0.085 0.396
0.486 0.054
0.169 0.299
0.139 0.333
-0.042 0.448
0.217 0.249
0.105 0.373
PI (%)
-0.287 0.183
0.014 0.483
0.392 0.104
-0.294 0.177
0.074 0.410
0.247 0.219
0.261 0.206
0.275 0.193
-0.294 0.177
0.448 0.072
0.573 0.026
LFD (%)
0.350 0.133
-0.343 0.138
-0.018 0.478
-0.049 0.440
-0.052 0.436
-0.020 0.475
-0.141 0.331
-0.018 0.478
0.140 0.332
0.161 0.309
0.077 0.406
SOL/TA Ratio
0.112 0.365
0.133 0.340
0.042 0.448
0.524 0.040
-0.333 0.145
0.056 0.432
-0.533 0.037
-0.543 0.034
-0.364 0.123
-0.140 0.332
-0.091 0.389
830 Appendix 2B. Pre-intervention relationships between gait and clinical measures. 831 Measure Clonus
duration Plantar flexor Reflex Threshold Angle
Toe Tap Test
Dorsiflexion active ROM
Dorsiflexion strength
Plantar flexion strength
Training leg strength
Non-training leg strength
Foot Clearance
-0.259 0.208
-0.580 0.024
-0.409 0.093
-0.154 0.317
-0.026 0.468
-0.187 0.280
0.014 0.483
0.079 0.404
Speed
-0.538 0.035
-0.091 0.389
0.166 0.303
-0.594 0.021
0.100 0.379
0.614 0.017
0.476 0.059
0.718 0.004
Distance
-0.294 0.177
0.021 0.474
0.374 0.116
-0.524 0.040
0.344 0.137
0.702 0.005
0.646 0.012
0.711 0.005
Spearman correlation coefficients (top number) and p-value (bottom number) within each cell; RI = reciprocal inhibition; 832 PI = presynaptic inhibition; LFD = low frequency depression; SOL/TA = Soleus/Tibialis Anterior; ROM = range of motion. 833

TA EMG and SOL H-reflex Training Improves Function in SCI
38
Appendix 3A. Relationship between changes in neurophysiologic and clinical, gait and performance measures for TA↑ group 834 Measure ↓
Clonus duration
↓ Plantar flexor reflex threshold angle
↑ Toe Tap Test
↓ Dorsi flexion active ROM
↑ Dorsi flexion strength
↑ Plantar flexion strength
↑ Training leg strength
↑ Non-training leg strength
↑ Foot Clear-ance
↑ Distance
↑ Speed
↑ %MVC Ampli-tude
↑ RI (%)
-0.086 0.436
0.657 0.078
0.609 0.100
0.429 0.198
-0.393 0.221
-0.525 0.143
-0.883 0.010
-0.278 0.297
0.714 0.055
-0.429 0.198
-0.257 0.311
-0.486 0.164
↑ PI (%)
-0.086 0.436
-0.829 0.021
-0.551 0.129
-0.771 0.036
-0.393 0.221
-0.216 0.341
0.265 0.306
0.802 0.027
-0.371 0.234
-0.486 0.164
0.429 -0.198
0.657 0.078
↓LFD (%)
-0.600 0.104
-0.086 0.436
0.145 0.392
-0.714 0.055
-0.655 0.079
-0.463 0.178
-0.618 0.096
0.309 0.276
-0.200 0.352
-0.714 0.055
0.600 0.104
-0.086 0.436
↓ SOL/TA Ratio
-0.029 0.479
0.257 0.311
0.348 0.250
0.143 0.394
0.655 0.079
0.309 0.276
0.265 0.306
-0.772 0.036
-0.314 0.272
0.771 0.036
-0.200 0.352
-0.771 0.036
835 Appendix 3B. Relationship between changes in gait and clinical and performance measures for TA↑ group 836 Measure ↓
Clonus duration
↓ Plantar flexor Reflex Threshold Angle
↑ Toe Tap Test
↓ Dorsiflexion active ROM angle
↑ Dorsiflexion strength
↑ Plantar flexion strength
↑ Training leg strength
↑ Non-training leg strength
↑ % MVC Amplitude
↑ Foot Clearance
0.257 0.311
0.314 0.272
0.058 0.457
0.714 0.055
-0.131 0.402
-0.432 0.196
-0.441 0.190
-0.093 0.431
0.029 0.479
↑ Speed
0.143 0.394
-0.486 0.164
0.290 0.289
-0.543 0.133
-0.655 0.079
-0.926 0.004
-0.265 0.306
0.463 0.178
-0.200 0.352
↑ Distance
0.314 0.272
0.143 0.394
0.174 0.371
0.275 0.311
0.655 0.079
0.617 0.096
0.618 0.096
-0.463 0.178
-0.314 0.272
↑%MVC Amplitude
0.143 0.394
-0.486 0.164
-0.754 0.042
-0.086 0.436
-0.131 0.402
-0.185 0.363
0.353 0.246
0.679 0.069
1.000
Arrows indicate direction of change; Spearman correlation coefficients (top number) and p-value (bottom number) within each cell; 837 RI = reciprocal inhibition; PI = presynaptic inhibition; LFD = low frequency depression; SOL/TA = Soleus/Tibialis Anterior; ROM = 838 range of motion. Yellow = measures related to hypotheses; Blue: direction of correlation differed from results unclear relationship; 839 Grey = moderate or strong correlations not related to original hypotheses 840

TA EMG and SOL H-reflex Training Improves Function in SCI
39
841 842 Appendix 4A. Relationship between changes in neurophysiologic and clinical, gait and performance measures for SOL↓ group 843
Measure ↓ Clonus duration
↑ Plantar flexor reflex threshold angle
↑ Toe Tap Test
↓ Dorsi flexion active ROM angle
↑ Dorsi flexion strength
↑ Plantar flexion strength
↑ Training leg strength
↑ Non-training leg strength
↑ Foot Clear-ance
↑ Distance
↑ Speed
↓ H
DF %
of baseline
↑ RI (%)
-0.314 0.272
-0.714 0.055
0.290 0.289
-0.086 0.436
-0.169 0.354
0.372 0.234
0.232 0.329
0.464 0.177
-0.754 0.042
-0.200 0.352
-0.143 0.394
-0.029 0.479
↓ PI (%)
0.086 0.436
-0.314 0.272
0.754 0.042
-0.143 0.394
0.304 0.279
-0.270 0.302
0.609 0.100
0.174 0.371
-0.116 0.413
0.029 0.479
-0.143 0.394
-0.143 0.394
↑ LFD (%)
0.667 0.074
0.203 0.350
-0.132 0.401
0.551 0.129
0.017 0.487
-0.051 0.461
0.206 0.348
0.162 0.380
-0.309 0.276
-0.232 0.329
-0.232 0.329
0.551 0.129
↓ SOL/TA Ratio
0.371 0.234
-0.143 0.394
-0.029 0.478
0.714 0.055
-0.845 0.017
0.778 0.034
-0.580 0.114
0.464 0.177
-0.377 0.231
-0.600 0.104
-0.600 0.104
0.371 0.234
844 Appendix 4B. Relationship between changes in gait and clinical and performance measures for SOL↓ group 845 Measure ↓
Clonus duration
↑ Plantar flexor Reflex Threshold Angle
↑ Toe Tap Test
↓ Dorsiflexion active ROM angle
↑ Dorsiflexion strength
↑ Plantar flexion strength
↑ Training leg strength
↑ Non-training leg strength
↓ H
DF %
of baseline
↑ Foot Clearance
0.116 0.413
0.638 0.087
-0.059 0.456
-0.058 0.457
-0.017 0.487
-0.189 0.360
-0.471 0.173
-0.426 0.200
-0.928 0.004
↑ Distance
-0.771 0.036
-0.257 0.311
-0.319 0.269
-0.886 0.009
0.778 0.034
-0.372 0.234
0.638 0.087
-0.116 0.413
0.257 0.311
↑ Speed
-0.771 0.036
-0.429 0.198
0.029 0.478
-0.543 0.133
0.372 0.234
-0.788 0.034
0.290 0.289
-0.812 0.025
0.086 0.436
↓ HDF
% of
baseline
-0.029 0.479
-0.543 0.133
-0.058 0.457
-0.200 0.352
-0.034 0.475
0.068 0.449
0.377 0.231
0.232 0.329
1.000
Arrows indicate direction of change; Spearman correlation coefficients (top number) and p-value (bottom number) within each cell; 846 RI, reciprocal inhibition; PI, presynaptic inhibition; LFD, low frequency depression; SOL/TA, Soleus/Tibialis Anterior; ROM, range 847 of motion; HDF, SOL H-reflex during dorsiflexion 848

Participants (n=12)
Pre-training Tests
SOL H-Reflex RI PI LFD
Clonus Drop Test Clonus duratiom PF reflex threshold angle SOL/TA Coactivation
Ankle Motor Control 10-s Toe Tap Test DF Active ROM
Walking 6-m walk Foot Clearance Speed 2-min Distance
LE Motor Scores Dorsiflexors Plantar flexors Training leg Non-training leg
Randomization Toe Tap Score
< 15
TA↑ (n=6)
≥ 15
SOL↓ (n=6)
15 Sessions 30 repetitions/bout 1 minute rest between bouts 10 bouts 300 total repetitions/session 2-hr, 3X/week
12 Training Sessions Dosage: 3600 repetitions
3 Baseline Sessions Dosage: 900 repetitions
Post-Training Tests
Training Parameter Increase % TA MVC Amplitude
Training Parameter Decrease SOL H-reflex amplitude during active dorsiflexion
EMG
TA (mV)
MG (mV)
SOL (mV) 1.00
0.00
-1.00
0.25
0.00
0.25
0.10
0.00
0.10
║
║
║
║
║
Time (sec)
Time (sec)
Time (sec)
115
95
0.00
75
30.00
-50.00
Ankle Angles (degrees) ↓ Dorsiflexion
Ground Reaction Forces (newtons) ↑ Dorsiflexion
PF reflex threshold angle
Time (sec)
Time (sec)

EEMG
0
20
40
60
80
100
1 5
TA %
MV
C A
mpl
itude
Week
1
2
3
4
5
6
mean
A. TA ↑
*
%MVC target
100%
0%
%MVC Amplitude response
mV
Stimulus
H-reflex M-wave
mV
HDF-reflex target (mV)
HDF-reflex response
mV
+
C. TA↑
D. SOL↓ B. SOL↓
40
60
80
100
120
1 5
Week
123456mean
Con
ditio
ned
SOL
HD
F ref
lex
(% b
asel
ine)
EMG
Reward
%MVC Amp (RMS)
Footswitch

0
0.5
1
1.5
2
2.5
3
3.5
1 7 13 19 25 31 37 43 49 55 61 67 73 79 85 91 97 103
109
115
121
127
133
139
145
151
157
163
169
175
181
187
193
199
205
211
217
223
229
235
241
247
253
259
265
271
277
283
289
Am
plitu
de (m
V)
Repetition Baseline Bout
Training Bouts
0
0.5
1
1.5
2
2.5
3
3.5
1 6 11 16 21 26 31 36 41 46 51 56 61 66 71 76 81 86 91 96 101
106
111
116
121
126
131
136
141
146
151
156
161
166
171
176
181
186
191
196
201
206
211
216
221
226
231
236
241
246
251
Am
plitu
de (m
V)
Repetition Training
Bouts Baseline
Bout
A. Training Session 2
B. Training Session 11

1
↓ PF reflex threshold angle
↓ Clonus
↓ DF active ROM angle
↑ ROM
↑ Distance ↑ Foot Clearance
↑ Walking Function
↑ TA % MVC Amplitude
TA ↑
↑ Target Stimulus
↑ Non-training Leg
↑ Training Leg ↑ DF
↑ Strength (LEMS)

↓ Conditioned SOL HDF reflex
↓ Target Stimulus
↓ SOL/TA Coactivation
↓ Clonus
↑ Non-training leg
↑ Strength (LEMS)
↑ Speed ↑ Distance
↑ Walking Function
SOL ↓
2

Table 1. Analysis of differences in participant baseline characteristics and pre-intervention outcome measures (mean ± SD) between TA↑ and SOL↓ groups TA↑ SOL↓ p-value Characteristics: Age (yrs) 44.2 ± 12.0 45.2 ± 12.8 1.00 Post-injury (yrs) 10.8 ± 10.0 10.8 ± 08.8 1.00 Gender 6 men 4 men, 2 women 0.12 (Х2) Injury Level C7 (median) C5 (median) 0.39 (X2) AIS D (all) D (all) N/A Clinical Measures: Clonus Duration (sec) 11.3 ± 14.5 12.4 ±10.2 0.75 PFRTA (degrees) 83.7 ± 5.5 85.2 ± 7.2 0.75 Toe Tap Test Score 13.5 ± 10.9 11.5 ± 6.3 0.75 DF AROM (degrees) 96.9 ± 13.7 112.4 ± 11.8 0.05 * DF LEMS 3.5 ± 1.1 3.8 ± 0.8 0.55 PF LEMS 2.5 ± 0.8 2.5 ± 0.6 0.78 Training leg LEMS 17.3 ± 3.4 16.2 ± 3.2 0.42 Non-training leg LEMS 22.5 ± 2.0 19.2 ± 2.8 0.04 * Walking Measures: Foot Clearance (mm) 5.0 ± 2.0 5.1 ± 1.6 0.87 Speed (m/s) 0.29 ± 0.26 0.14 ± 0.08 0.15 § Distance (m) 44.9 ± 49.3 21.3 ± 17.2 0.52 § Neurophysiologic Measures: RI SOL H-reflex (%) 98.9 ± 4.5 99.6 ± 1.1 0.87 PI SOL H-reflex (%) 7.8 ± 5.8 4.2 ± 1.6 0.20 LFD SOL H-reflex (%) 91.9 ± 16.5 95.0 ± 10.0 0.75 SOL/TA Ratio 0.49 ± 0.23 0.52 ± 0.39 0.63 Mann-Whitney U-test for all analyses, except Chi-square (X2) test for nominal data; C, cervical; AIS, American Spinal Injury Association Impairment Scale (ASIA, 2002); RI, reciprocal inhibition as a % of control reflex; PI, presynaptic inhibition as a % of Mmax; LFD, low frequency depression as a % of control reflex; H/M, H-reflex/M-wave; SOL/TA, soleus/tibialis anterior; PFRTA, plantar flexor reflex threshold angle; DF, dorsiflexion; AROM, active range of motion; LEMS, lower extremity motor score; PF, plantar flexion; (*) significant difference (p ≤ 0.05); (§) large but not significant difference.
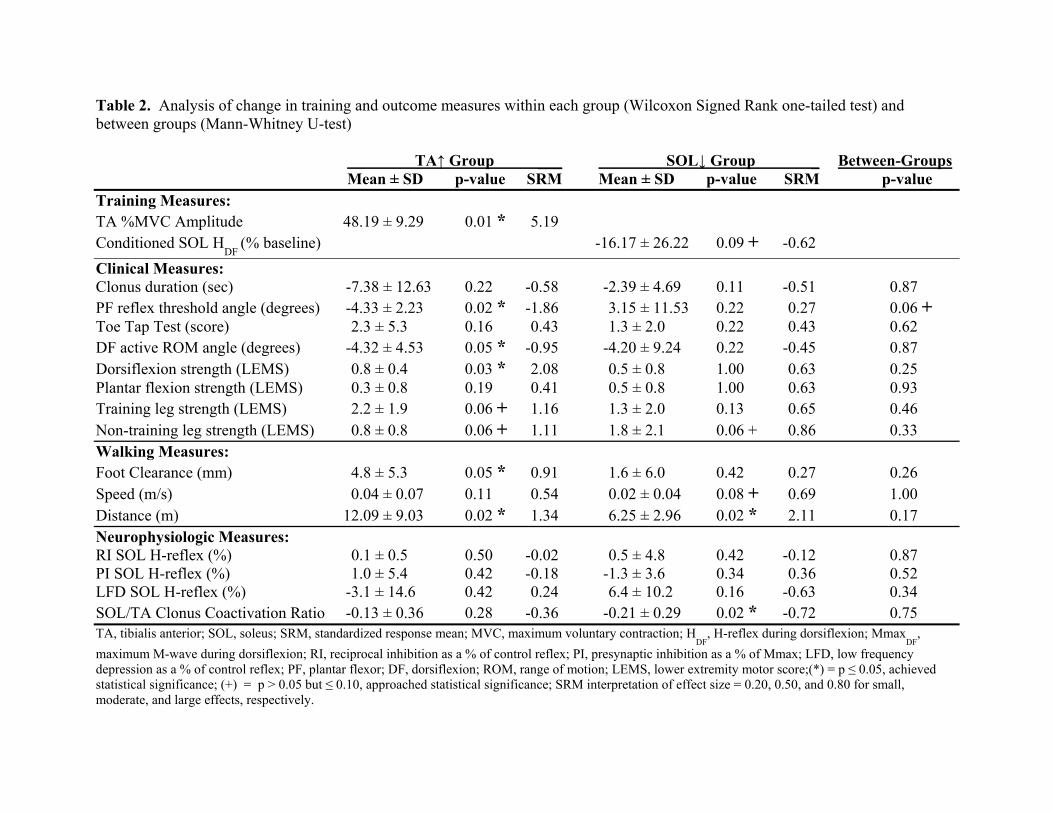
Table 2. Analysis of change in training and outcome measures within each group (Wilcoxon Signed Rank one-tailed test) and between groups (Mann-Whitney U-test) TA↑ Group ___ SOL↓ Group _ Between-Groups Mean ± SD p-value SRM Mean ± SD p-value SRM p-value Training Measures: TA %MVC Amplitude 48.19 ± 9.29 0.01 * 5.19 Conditioned SOL H
DF (% baseline) -16.17 ± 26.22 0.09 + -0.62
Clinical Measures: Clonus duration (sec) -7.38 ± 12.63 0.22 -0.58 -2.39 ± 4.69 0.11 -0.51 0.87 PF reflex threshold angle (degrees) -4.33 ± 2.23 0.02 * -1.86 3.15 ± 11.53 0.22 0.27 0.06 + Toe Tap Test (score) 2.3 ± 5.3 0.16 0.43 1.3 ± 2.0 0.22 0.43 0.62 DF active ROM angle (degrees) -4.32 ± 4.53 0.05 * -0.95 -4.20 ± 9.24 0.22 -0.45 0.87 Dorsiflexion strength (LEMS) 0.8 ± 0.4 0.03 * 2.08 0.5 ± 0.8 1.00 0.63 0.25 Plantar flexion strength (LEMS) 0.3 ± 0.8 0.19 0.41 0.5 ± 0.8 1.00 0.63 0.93 Training leg strength (LEMS) 2.2 ± 1.9 0.06 + 1.16 1.3 ± 2.0 0.13 0.65 0.46 Non-training leg strength (LEMS) 0.8 ± 0.8 0.06 + 1.11 1.8 ± 2.1 0.06 + 0.86 0.33 Walking Measures: Foot Clearance (mm) 4.8 ± 5.3 0.05 * 0.91 1.6 ± 6.0 0.42 0.27 0.26 Speed (m/s) 0.04 ± 0.07 0.11 0.54 0.02 ± 0.04 0.08 + 0.69 1.00 Distance (m) 12.09 ± 9.03 0.02 * 1.34 6.25 ± 2.96 0.02 * 2.11 0.17 Neurophysiologic Measures: RI SOL H-reflex (%) 0.1 ± 0.5 0.50 -0.02 0.5 ± 4.8 0.42 -0.12 0.87 PI SOL H-reflex (%) 1.0 ± 5.4 0.42 -0.18 -1.3 ± 3.6 0.34 0.36 0.52 LFD SOL H-reflex (%) -3.1 ± 14.6 0.42 0.24 6.4 ± 10.2 0.16 -0.63 0.34 SOL/TA Clonus Coactivation Ratio -0.13 ± 0.36 0.28 -0.36 -0.21 ± 0.29 0.02 * -0.72 0.75 TA, tibialis anterior; SOL, soleus; SRM, standardized response mean; MVC, maximum voluntary contraction; H
DF, H-reflex during dorsiflexion; Mmax
DF,
maximum M-wave during dorsiflexion; RI, reciprocal inhibition as a % of control reflex; PI, presynaptic inhibition as a % of Mmax; LFD, low frequency depression as a % of control reflex; PF, plantar flexor; DF, dorsiflexion; ROM, range of motion; LEMS, lower extremity motor score;(*) = p ≤ 0.05, achieved statistical significance; (+) = p > 0.05 but ≤ 0.10, approached statistical significance; SRM interpretation of effect size = 0.20, 0.50, and 0.80 for small, moderate, and large effects, respectively.