Embed Size (px)
Citation preview

AUGUST 2016
The University of Texas at Arlington The University of Texas at Austin The University of Texas at Dallas The University of Texas at El Paso The University of Texas of the Permian Basin The University of Texas at Rio Grande Valley The University of Texas at San Antonio The University of Texas at Tyler The University of Texas Southwestern Medical Center The University of Texas Medical Branch at Galveston The University of Texas Health Science Center at Houston The University of Texas Health Science Center at San Antonio The University of Texas M. D. Anderson Cancer Center The University of Texas Health Science Center at Tyler The University of Texas System Administration
THE UNIVERSITY OF TEXAS SYSTEM
OPERATING BUDGET SUMMARIESAND RESERVE ALLOCATIONS FOR
LIBRARY, EQUIPMENT, REPAIR AND REHABILITATION
AND FACULTY STARS
FISCAL YEAR 2017


THE UNIVERSITY OF TEXAS SYSTEM OPERATING BUDGET SUMMARIES AND RESERVE ALLOCATIONS FOR
LIBRARY, EQUIPMENT, REPAIR AND REHABILITATION AND FACULTY STARS
For Fiscal Year Ending August 31, 2017
Table of Contents
TAB 1 – Operating Budget Summaries Page
Operating Budget Highlights (including Background and Glossary of Terms) ............................................................... 1 The University of Texas System ‐ Combined ................................................................................................................. 10 The University of Texas System Academic Institutions ‐ Combined ............................................................................. 11 The University of Texas System Health Related Institutions ‐ Combined .................................................................... 12 The University of Texas System Administration ........................................................................................................... 13 The University of Texas at Arlington ............................................................................................................................. 15 The University of Texas at Austin ................................................................................................................................. 17 The University of Texas at Austin ‐ Application of Available University Fund .............................................................. 19 The University of Texas at Brownsville ......................................................................................................................... 26 The University of Texas at Dallas .................................................................................................................................. 28 The University of Texas at El Paso ................................................................................................................................ 30 The University of Texas of the Permian Basin .............................................................................................................. 32 The University of Texas Rio Grande Valley ................................................................................................................... 34 The University of Texas at San Antonio ........................................................................................................................ 36 The University of Texas at Tyler .................................................................................................................................... 38 The University of Southwestern Medical Center ......................................................................................................... 40 The University of Texas Medical Branch at Galveston ................................................................................................. 42 The University of Texas Health Science Center at Houston ......................................................................................... 44 The University of Texas Health Science Center at San Antonio.................................................................................... 46 The University of Texas M. D. Anderson Cancer Center ............................................................................................... 48 The University of Texas Health Science Center at Tyler ............................................................................................... 50
TAB 2 – Reserve Allocations for Library, Equipment, Repair and Rehabilitation (LERR) and Faculty Science and Technology Acquisition and Retention (STARs) Program
LERR/Faculty STARs Allocations Summary ................................................................................................................... 52 TAB 3 – Budget Rules and Procedures
Operating Budget Rules and Procedures ...................................................................................................................... 56
Medical, Dental, Nursing, Faculty Services Research and Development Plans, Allied Health Faculty Services Plan and Physicians Referral Service .............................................................................................................. 61
Academic Workload Requirements for Academic Institutions..................................................................................... 62
LERR, Faculty STARs and Similar Funded Programs Budget Rules and Procedures ..................................................... 63 LERR, Faculty STARs, and Similar Funded Programs Expenditure Guidelines .............................................................. 65
U. T. System Office of the Controller ‐ 201 Seventh Street, ASH 5 ‐ Austin, Texas 78701 ‐ 512.499.4527


The University of Texas System Operating Budget Highlights
For the Year Ending August 31, 2017
INTRODUCTION The University of Texas System (the “System”) is one of the largest and most comprehensive institutions of higher education in the country, as well as one of the largest employers in Texas. The System’s eight general academic campuses educate one‐third of Texas’ public university students and its six health‐related campuses educate two‐thirds of the health professional students attending Texas’ public health‐related institutions of higher education. 2017 represents a landmark year for the System with the inaugural medical school classes at The University of Texas at Austin and The University of Texas Rio Grande Valley. The effect of the System’s expenditures on the Texas economy is profound. The State Comptroller of Public Accounts has estimated that every $1 spent generates as much as $5 in additional economic activity. U. T. System’s research funding level is the largest in Texas and the second largest in the country. The U. T. System educates more than 221,000 students and produces more than 54,000 graduates each year. The operating budget provides a wide range of services for Texans. Beyond the primary mission of higher education and research, a significant amount of health care is provided for uninsured and underinsured Texans and several initiatives are supported to improve K‐12 education in the public schools. The System’s extensive research and development advancements strengthen the Texas economy. All of the System’s work revolves around people – the students served, the faculty recruited and retained, and the staff that makes the work of teachers, physicians, and researchers possible. As an educational institution, the System is part of a uniquely labor‐intensive industry – one that requires nothing less than the best from all individuals involved. For FY 2017, changes in the operating budget are largely driven by growth in health care activities including hospital charges, professional fees and contractual arrangements with affiliated hospitals and health care systems. In addition, System institutions will benefit from a modest tuition increase for 2017. For most resident undergraduate students, this was the first increase in four years.
U. T. System Office of the Controller 1

REVENUES $18.3 BILLION
Revenues included in the operating budget include both operating and nonoperating revenues used to finance the operating budget. Combined revenues for FY 2017 are $18.3 billion, up 7.6 percent or $1.3 billion from FY 2016. Areas of growth include Net Sales and Services of Hospitals and Clinics (14.7 percent, $768 million), Net Professional Fees (7.9 percent, $129 million), and Tuition and Fees (6.2 percent, $99 million). Budgeted State Appropriations also increased (3.7 percent, $83 million) largely as a result of additional appropriations made by the 84th Texas Legislature for debt service on new tuition revenue bonds. For FY 2017, general revenue will decline to 13.0 percent of the total expense budget, compared to 13.2 percent for 2016. Net Sales and Services of Hospital and Clinics primarily includes income generated from patient care at the System’s hospitals and represents the major driver of budget increases for FY 2017. The largest increases are anticipated by U. T. M. D. Anderson Cancer Center ($468 million), U. T. Southwestern Medical Center ($174 million) and U. T. Medical Branch ‐ Galveston ($106 million). U. T. M. D. Anderson Cancer Center expects a rebound to normal levels for FY 2017 after experiencing a temporary decline in patient volumes resulting from the implementation of a new electronic health record (EHR) system. The first full year of operations for the William P. Clements, Jr. University Hospital (Clements Hospital) at U. T. Southwestern Medical Center has exceeded expectations, and a solid growth trend is anticipated for FY 2017. Opening the new League City Campus Hospital, growth at Angleton‐Danbury and Alvin campuses, along with expanded correctional managed care revenue account for most of the change at U. T. Medical Branch – Galveston. Growth in Net Professional Fees principally results from growth in the health‐related institutions medical practice plans, including expansion of both practice specialties and clinic locations. The most significant increases are occurring at U. T. M. D. Anderson Cancer Center ($54 million) and U. T. Health Science Center ‐ Houston ($37 million). U. T. M. D. Anderson Cancer Center again anticipates a full recovery from the temporary decline related to the EHR system implementation. U. T. Health Science Center – Houston attributes additional revenue to volume growth and revenue cycle enhancements. Tuition and Fee revenue growth results from both additional enrollment and a modest rate increase. The most significant changes occurred at U. T. Arlington ($20 million) and U. T. Dallas ($35 million). U. T. Arlington anticipates additional revenue related to the rate increase, an overall enrollment increase of 2 percent, unbudgeted growth carrying over from FY 2016 and large increases in accelerated online programs. U. T. Dallas anticipates 7 percent enrollment growth for 2017 as well as the rate increase.
U. T. System Office of the Controller 2

EXPENSES $17.9 BILLION
Expenses reflected in the operating budget include all operational functions, limited nonoperating expenses, and transfers to U. T. System Administration made to fund debt service interest. Depreciation and Amortization expenses are also included in the budget. Conversely, capital outlay and transfers for debt service principal payments are excluded. Combined expenses for FY 2017 are $17.9 billion, up 5.4 percent or $0.9 billion from FY 2016. Significant functional areas of growth include Hospital and Clinics (7.3 percent, $381 million), Instruction/Academic Support (6.0 percent, $280 million), and Depreciation and Amortization (10.1 percent, $129 million). Hospital and Clinics expenses increased due largely to growth in patient care costs associated with increasing volume and related costs including the upward volume trend of U. T. Southwestern Medical Center’s Clements Hospital, U. T. Medical Branch – Galveston’s new locations and correctional managed care and the volume recovery at U. T. M. D. Anderson after implementation of the new EHR system. The most significant increases are at U. T. Southwestern Medical Center ($84 million), U. T. Medical Branch – Galveston ($101 million), U. T. Health Science Center ‐ Houston ($39 million), and U. T. M. D. Anderson Cancer Center ($132 million). Instruction/Academic Support expenses increased due to support for new academic and medical faculty, and academic programs. Expansion of medical practice plans continues to require additional physician faculty. Most academic institutions also experienced enrollment growth. U. T. Austin dedicated the majority of its increase in the Available University Fund allocation to an instructional reserve to be allocated by the Provost and Chief Financial Officer. The most significant increases were at U. T. Austin ($42 million), U. T. Southwestern Medical Center ($56 million), and U. T. Health Science Center ‐ Houston ($50 million). Depreciation and Amortization has increased largely due to the completion or anticipated completion of a number of major construction and information technology projects. Significant examples are the EHR system at U. T. M. D. Anderson and a inclusion of a full year’s depreciation expense for the Jennie Sealy and League City Campus Hospitals at U. T. Medical Branch – Galveston. The most significant increases occur at U. T. Austin ($17 million), U. T. Medical Branch ‐ Galveston ($12 million) and U. T. M. D. Anderson Cancer Center ($67 million).
U. T. System Office of the Controller 3

BACKGROUND The System reports financial information based on Governmental Accounting Standards Board (GASB) Statement No. 35, Basic Financial Statements – Management’s Discussion and Analysis – for Public Colleges and Universities, as amended by GASB Statements No. 37, Basic Financial Statements – and Management’s Discussion and Analysis – for State and Local Governments: Omnibus, and GASB Statement No. 38, Certain Financial Statement Note Disclosures. These statements establish standards for external financial reporting for public colleges and universities and require that financial statements be presented on a consolidated basis to focus on the entity as a whole. Previously, financial statements focused on the accountability of individual fund groups rather than on the entity as a whole. The U. T. System Annual Operating Budget has historically presented sources and uses of funds in select fund groups rather than on operating results of the entity as a whole. As a result, several significant differences existed between the budget and the financial reporting presentations at year‐end. Beginning in the FY 2007 budget, the underlying operating budget maintains the sources and uses information but allows the focus of the budget to conform more closely to the entity‐wide financial performance measures of the annual financial report through a series of adjustments incorporated into the budget totals. The major differences that have been resolved included the following items: The budget reflects tuition discounting and related scholarship/fellowship activities in a manner
comparable to the GASB Rules for the annual financial report. Depreciation expense is incorporated into the budgeted expense totals. Capital outlay from operating funds is eliminated from budgeted expenditure totals. Debt service principal repayments are eliminated from budgeted expenditure totals. The information presented in this summary document nets budgeted revenues and expenses to arrive at a “Budget Margin (Deficit).” Beginning with this calculated margin, a reconciliation has been included to arrive at a forecasted Change in Net Assets that would be comparable to the Statement of Revenues, Expenses, and Changes in Net Position (SRECNP) included in the System’s Annual Financial Report.
PRESENTATION OF FY 2016 PROJECTED ACTUAL TOTALS All U. T. institutions have prepared a projection of FY 2016 activity in a format comparable to that presented for the FY 2016 adjusted and FY 2017 proposed budgets. This projection was based on activity through May 2016.
RESTATEMENT AND RECLASSIFICATION OF FY 2016 BUDGET TOTALS In certain situations, reclassifications have been made between FY 2016 line items to enhance comparability with the FY 2017 presentation.
U. T. System Office of the Controller 4

GLOSSARY OF TERMS Operating Revenues: TUITION AND FEES – All student tuition and fee revenues earned at the U. T. institutions for educational purposes. Tuition is reported net of discounting. SPONSORED PROGRAMS – Funding received from local, state, and federal governments or private agencies, organizations, or individuals. Includes amounts received for services performed on grants, contracts, and agreements from these entities for current operations. This also includes indirect cost recoveries and pass‐through federal and state grants. NET SALES AND SERVICES OF EDUCATIONAL ACTIVITIES – Revenues related to the conduct of instruction, research, and public service and revenues from activities that exist to provide an instructional and laboratory experience for students that create goods and services that may be sold. Examples include revenues received from activities such as performing arts, continuing education, charter schools, the University Interscholastic League, trademarks programs, and sports camps. NET SALES AND SERVICES OF HOSPITALS AND CLINICS – Revenues (net of discounts, allowances, and bad debt expense) generated from U. T. health institutions’ daily patient care, special or other services, as well as revenues from health clinics that are part of a hospital. NET PROFESSIONAL FEES – Revenues (net of discounts, allowances, and bad debt expense) derived from the fees charged by the professional staffs at U. T. health institutions and U. T. Rio Grande Valley as part of the medical, dental, and other practice plans. Examples of such fees include doctor’s fees for clinic visits, medical and dental procedures, professional opinions, and anatomical procedures, such as analysis of specimens after a surgical procedure, etc. NET AUXILIARY ENTERPRISES – Revenues derived from a service to students, faculty, or staff in which a fee is charged that is directly related to, although not necessarily equal to the cost of the service (e.g., bookstores, dormitories, dining halls, snack bars, inter‐collegiate athletic programs, etc.). OTHER OPERATING REVENUES – Other revenues generated from sales or services provided to meet current fiscal year operating expenses, which are not included in the preceding categories. Also included in this category are Delivery System Reform Incentive Payment funds (DSRIP) which are payments made to providers who agree to participate in Medicaid health care quality and delivery system reforms. Operating Expenses: INSTRUCTION AND ACADEMIC SUPPORT – Expenditures for salaries, wages, and all other costs related to those engaged in the teaching function including operating costs of instructional departments. This would include the salaries of faculty, teaching assistants, lecturers, and teaching equipment. Library materials and related salaries are also included. RESEARCH – Expenditures for salaries and wages and other costs associated with the support of research conducted by faculty members. PUBLIC SERVICE – Expenditures for activities providing noninstructional services beneficial to individuals and groups external to the institution (e.g. conferences, institutes such as the Institute for Texan Cultures, general advisory services, reference bureaus, radio, and television).
U. T. System Office of the Controller 5

GLOSSARY OF TERMS (CONTINUED) HOSPITALS AND CLINICS – Expenditures of U. T. health‐related institutions with teaching hospital affiliations for costs associated with providing patient care and operating the entity (i.e., labs, pharmacies, personnel salaries, etc.). INSTITUTIONAL SUPPORT – Expenditures for central executive‐level activities concerned with management and long‐range planning for the entire institution, such as the governing board, planning and programming, and legal services; fiscal operations, including the investment office; administrative data processing; space management; employee personnel and records; logistical activities that provide procurement, storerooms, printing, and transportation services to the institution; support services to faculty and staff that are not operated as auxiliary enterprises; and activities concerned with community and alumni relations, including development and fund raising. STUDENT SERVICES – Expenditures for offices of admissions and of the registrar and activities with the primary purpose of contributing to students’ emotional and physical well‐being and intellectual, cultural, and social development outside the context of the formal instruction program. OPERATION AND MAINTENANCE OF PLANT – Expenditures of current operating funds for the operation and maintenance of the physical plant. This includes all expenditures for operations established to provide services and maintenance related to grounds and facilities. Also included are utilities, fire protection, property insurance, and similar items. Specifically included are: salaries, wages, supplies materials, and other expenses necessary to keep each building in good repair and usable condition. Also includes expenses necessary to keep the buildings in a clean and sanitary condition, provide upkeep of all lands designated as campus proper (improved and unimproved) not occupied by actual buildings. SCHOLARSHIPS AND FELLOWSHIPS – Expenditures for scholarships and fellowships in the form of grants to students resulting from selection by the institution or from an entitlement program. Amounts reported are net of the effects of tuition discounting. AUXILIARY ENTERPRISES – Expenditures of essentially self‐supporting institution enterprises (e.g. bookstores, dormitories, inter‐collegiate athletic programs, etc.). DEPRECIATION AND AMORTIZATION – A noncash expense that reduces the value of a capital asset as a result of wear and tear, age, or obsolescence. Also includes amortization expense, which is the gradual elimination of a liability in regular payments over a specified period of time. Nonoperating Revenues (Expenses): STATE APPROPRIATIONS – Appropriations from the State General Revenue Fund, which supplement the U. T. institutional revenue in meeting operating expenses, such as faculty salaries, utilities, and institutional support. Also includes estimated state‐paid fringe benefits costs and funding for debt service on tuition revenue bonds. FEDERAL SPONSORED PROGRAMS ‐ NONOPERATING – Funding received from the federal government for which no exchange of goods or services is perceived to have occurred. This typically includes federal Pell Grants and other miscellaneous awards from the State of Texas. STATE AND LOCAL SPONSORED PROGRAMS ‐ NONOPERATING – Funding received from state or local governments for which no exchange of goods or services is perceived to have occurred. This typically includes Texas Research Incentive Program awards from the State of Texas and funding for the U. T. Austin Medical School provided by the local health care district.
U. T. System Office of the Controller 6
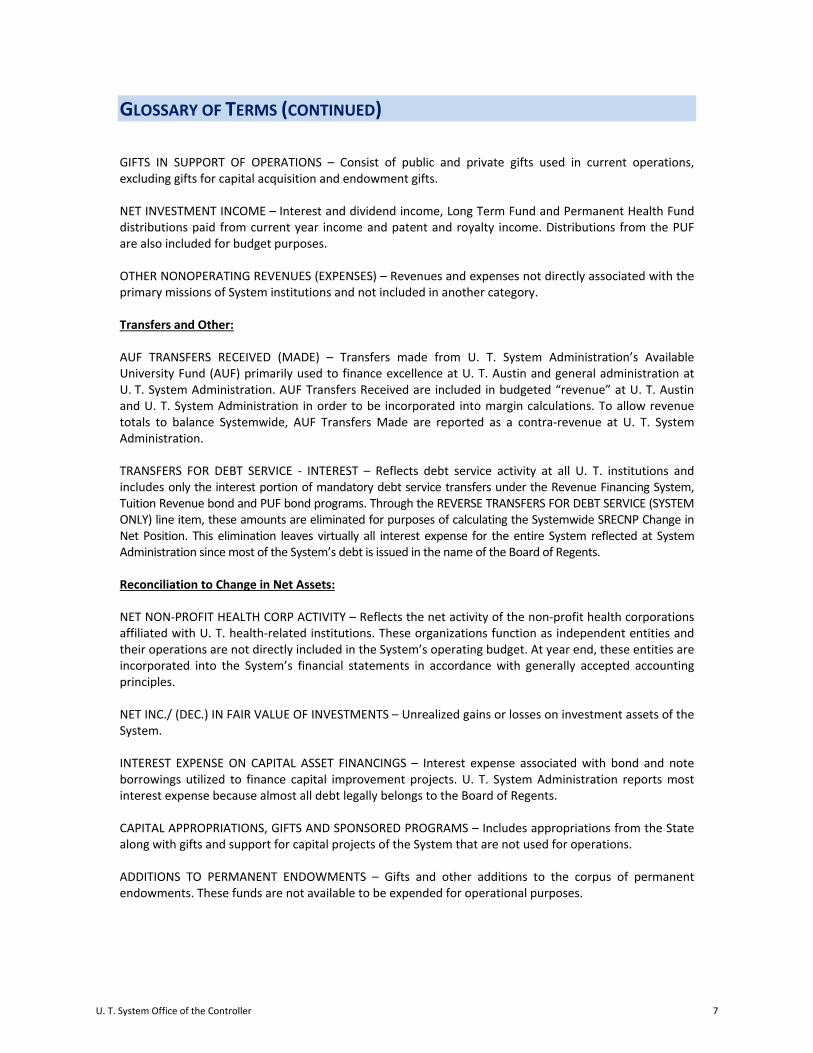
GLOSSARY OF TERMS (CONTINUED) GIFTS IN SUPPORT OF OPERATIONS – Consist of public and private gifts used in current operations, excluding gifts for capital acquisition and endowment gifts. NET INVESTMENT INCOME – Interest and dividend income, Long Term Fund and Permanent Health Fund distributions paid from current year income and patent and royalty income. Distributions from the PUF are also included for budget purposes. OTHER NONOPERATING REVENUES (EXPENSES) – Revenues and expenses not directly associated with the primary missions of System institutions and not included in another category. Transfers and Other: AUF TRANSFERS RECEIVED (MADE) – Transfers made from U. T. System Administration’s Available University Fund (AUF) primarily used to finance excellence at U. T. Austin and general administration at U. T. System Administration. AUF Transfers Received are included in budgeted “revenue” at U. T. Austin and U. T. System Administration in order to be incorporated into margin calculations. To allow revenue totals to balance Systemwide, AUF Transfers Made are reported as a contra‐revenue at U. T. System Administration. TRANSFERS FOR DEBT SERVICE ‐ INTEREST – Reflects debt service activity at all U. T. institutions and includes only the interest portion of mandatory debt service transfers under the Revenue Financing System, Tuition Revenue bond and PUF bond programs. Through the REVERSE TRANSFERS FOR DEBT SERVICE (SYSTEM ONLY) line item, these amounts are eliminated for purposes of calculating the Systemwide SRECNP Change in Net Position. This elimination leaves virtually all interest expense for the entire System reflected at System Administration since most of the System’s debt is issued in the name of the Board of Regents. Reconciliation to Change in Net Assets: NET NON‐PROFIT HEALTH CORP ACTIVITY – Reflects the net activity of the non‐profit health corporations affiliated with U. T. health‐related institutions. These organizations function as independent entities and their operations are not directly included in the System’s operating budget. At year end, these entities are incorporated into the System’s financial statements in accordance with generally accepted accounting principles. NET INC./ (DEC.) IN FAIR VALUE OF INVESTMENTS – Unrealized gains or losses on investment assets of the System. INTEREST EXPENSE ON CAPITAL ASSET FINANCINGS – Interest expense associated with bond and note borrowings utilized to finance capital improvement projects. U. T. System Administration reports most interest expense because almost all debt legally belongs to the Board of Regents. CAPITAL APPROPRIATIONS, GIFTS AND SPONSORED PROGRAMS – Includes appropriations from the State along with gifts and support for capital projects of the System that are not used for operations. ADDITIONS TO PERMANENT ENDOWMENTS – Gifts and other additions to the corpus of permanent endowments. These funds are not available to be expended for operational purposes.
U. T. System Office of the Controller 7

GLOSSARY OF TERMS (CONTINUED) TRANSFERS FOR DEBT SERVICE – PRINCIPAL – Reflects debt service activity at all U. T. institutions and includes only the principal portion of mandatory debt service transfers under the Revenue Financing System, Tuition Revenue bond and PUF bond programs. Through the REVERSE TRANSFERS FOR DEBT SERVICE (SYSTEM ONLY) line item, these amounts are eliminated for purposes of calculating the Systemwide SRECNP Change in Net Position as retirement of principal is a balance sheet transaction and do not impact net position. REVERSE TRANSFERS FOR DEBT SERVICE (SYSTEM ONLY) – This line is used to eliminate the effects of transfers for debt service received by U. T. System Administration on the SRECNP Change in Net Position. TRANSFERS AND OTHER – Includes all interfund transfers and other activity not categorized elsewhere. For U. T. System, this total also includes the income and distribution to Texas A&M University System for their annual one‐third participation in the PUF endowment.
U. T. System Office of the Controller 8

THE UNIVERSITY OF TEXAS SYSTEM
INSTITUTION BUDGET HIGHLIGHTS
AND BUDGET SUMMARIES
U. T. System Office of the Controller 9


The University of Texas SystemOperating Budget
Fiscal Year Ending August 31, 2017
BudgetFY 2016 FY 2017 Increases (Decreases)
FY 2016 Adjusted Operating From 2016 to 2017 Projected Budget Budget Amount Percent
Operating Revenues: Tuition and Fees $ 1,622,869,833 1,597,665,701 1,696,889,558 99,223,857 6.2% Federal Sponsored Programs 1,371,051,034 1,389,765,767 1,371,033,197 (18,732,570) ‐1.3% State Sponsored Programs 337,289,725 314,280,171 340,458,292 26,178,121 8.3% Local and Private Sponsored Programs 1,290,245,907 1,272,405,367 1,335,783,787 63,378,420 5.0% Net Sales and Services of Educational Activities 459,205,903 402,062,829 425,413,044 23,350,215 5.8% Net Sales and Services of Hospital and Clinics 5,413,550,519 5,237,917,437 6,005,936,393 768,018,956 14.7% Net Professional Fees 1,671,831,050 1,629,615,533 1,759,026,791 129,411,258 7.9% Net Auxiliary Enterprises 571,067,604 576,706,264 612,825,903 36,119,639 6.3% Other Operating Revenues 441,683,714 361,506,015 367,556,544 6,050,529 1.7%Total Operating Revenues 13,178,795,289 12,781,925,084 13,914,923,509 1,132,998,425 8.9%
Operating Expenses: Instruction 3,671,926,568 3,765,360,335 4,002,864,306 237,503,971 6.3% Academic Support 764,194,445 893,246,596 935,356,682 42,110,086 4.7% Research 2,240,107,445 2,288,924,816 2,266,799,932 (22,124,884) ‐1.0% Public Service 318,819,590 300,093,664 303,154,073 3,060,409 1.0% Hospitals and Clinics 5,362,500,626 5,202,217,657 5,583,641,729 381,424,072 7.3% Institutional Support 1,900,597,181 882,737,264 917,437,110 34,699,846 3.9% Student Services 247,851,552 259,154,881 271,341,507 12,186,626 4.7% Operations and Maintenance of Plant 735,676,648 736,135,138 738,424,396 2,289,258 0.3% Scholarships and Fellowships 371,497,040 408,604,754 393,240,803 (15,363,951) ‐3.8% Auxiliary Enterprises 588,473,815 609,573,381 646,943,119 37,369,738 6.1% Depreciation and Amortization 1,301,084,561 1,279,853,024 1,409,222,636 129,369,612 10.1%Total Operating Expenses 17,502,729,471 16,625,901,510 17,468,426,293 842,524,783 5.1%Operating Surplus/Deficit (4,323,934,182) (3,843,976,426) (3,553,502,784) 290,473,642 ‐7.6%
Budgeted Nonoperating Revenues (Expenses): State Appropriations 2,234,775,638 2,233,035,807 2,315,820,983 82,785,176 3.7% Federal Sponsored Programs (Nonoperating) 359,038,925 303,748,948 304,895,835 1,146,887 0.4% State/Local Sponsored Programs (Nonoperating) 20,661,721 79,792,066 46,790,198 (33,001,868) ‐41.4% Gifts in Support of Operations 459,239,270 404,260,580 422,367,172 18,106,592 4.5% Net Investment Income 1,278,821,866 1,190,103,012 1,281,561,520 91,458,508 7.7%Other Non‐Operating Revenue ‐ ‐ ‐ ‐ ‐ Other Non‐Operating (Expenses) ‐ ‐ ‐ ‐ ‐ Net Non‐Operating Revenue/(Expenses) 4,352,537,420 4,210,940,413 4,371,435,708 160,495,295 3.8%
Transfers and Other: AUF Transfers Received for Operations 403,661,610 359,987,789 409,017,461 49,029,672 13.6% AUF Transfers (Made) for Operations (403,661,610) (359,987,789) (409,017,461) (49,029,672) 13.6% Transfers for Debt Service ‐ Interest (305,669,013) (315,557,291) (393,857,861) (78,300,570) 24.8%Total Transfers and Other (305,669,013) (315,557,291) (393,857,861) (78,300,570) 24.8%
Budget Margin (Deficit) (277,065,775) 51,406,696 424,075,063 372,668,367 724.9%
Reconciliation to Change in Net Assets: Net Non‐Profit Health Corp Activity 19,292,843 8,000,000 3,000,000 (5,000,000) ‐62.5% Net Inc./(Dec.) in Fair Value of Investments (828,962,296) ‐ ‐ ‐ ‐ Interest Expense on Capital Asset Financings (308,258,943) (316,707,291) (395,057,861) (78,350,570) 24.7% Capital Approp., Gifts and Sponsored Programs 131,969,681 280,325,966 234,216,194 (46,109,772) ‐16.4% Additions to Permanent Endowments 119,924,213 114,251,474 132,630,936 18,379,462 16.1% Transfers for Debt Service ‐ Principal (401,647,798) (438,953,147) (453,868,341) (14,915,194) 3.4% Reverse Transfers for Debt Service (System Only) 707,316,811 754,510,438 847,726,202 93,215,764 12.4% Transfers and Other (134,645,232) 63,538,692 89,145,632 25,606,940 40.3%SRECNA Change in Net Assets $ (972,076,496) 516,372,828 881,867,825 365,494,997 70.8%
Total Revenues and AUF Transfers $ 17,531,332,709 16,992,865,497 18,286,359,217 1,293,493,720 7.6%Total Expenses (Including Transfers for Interest) (17,808,398,484) (16,941,458,801) (17,862,284,154) (920,825,353) 5.4%Budget Margin (Deficit) $ (277,065,775) 51,406,696 424,075,063 372,668,367
Reconciliation to Use of Prior Year Balances Depreciation 1,279,853,024 1,409,222,636 Capital Outlay (786,436,236) (1,082,803,059) Transfers for Debt Service ‐ Principal (438,953,147) (453,868,341) Budgeted Transfers (37,560,796) (30,452,496) Net Additions to (Uses of) Prior Year Balances 68,309,541 266,173,803
Note: Operating Budget Highlights with a glossary of terms are included on Page 1.
U. T. System Office of the Controller 10

The University of Texas Academic InstitutionsOperating Budget
Fiscal Year Ending August 31, 2017
BudgetFY 2016 FY 2017 Increases (Decreases)
FY 2016 Adjusted Operating From 2016 to 2017 Projected Budget Budget Amount Percent
Operating Revenues: Tuition and Fees $ 1,473,274,609 1,450,153,174 1,544,717,614 94,564,440 6.5% Federal Sponsored Programs 622,838,996 630,229,886 638,476,117 8,246,231 1.3% State Sponsored Programs 184,877,088 194,699,706 193,357,761 (1,341,945) ‐0.7% Local and Private Sponsored Programs 165,422,834 179,097,737 171,529,406 (7,568,331) ‐4.2% Net Sales and Services of Educational Activities 328,584,203 310,703,704 330,523,434 19,819,730 6.4% Net Sales and Services of Hospital and Clinics ‐ ‐ ‐ ‐ ‐ Net Professional Fees 1,838,717 4,743,153 6,192,161 1,449,008 30.5% Net Auxiliary Enterprises 457,976,670 458,542,111 486,539,547 27,997,436 6.1% Other Operating Revenues 34,746,560 29,325,981 38,231,519 8,905,538 30.4%Total Operating Revenues 3,269,559,677 3,257,495,452 3,409,567,559 152,072,107 4.7%
Operating Expenses: Instruction 1,471,859,448 1,569,655,716 1,679,606,753 109,951,037 7.0% Academic Support 469,271,995 603,220,194 608,375,502 5,155,308 0.9% Research 776,623,096 815,014,984 766,338,174 (48,676,810) ‐6.0% Public Service 194,809,448 172,338,080 172,588,658 250,578 0.1% Hospitals and Clinics 8,104,510 14,463,908 20,938,150 6,474,242 44.8% Institutional Support 402,624,127 397,599,996 373,436,805 (24,163,191) ‐6.1% Student Services 223,738,786 233,199,886 244,430,327 11,230,441 4.8% Operations and Maintenance of Plant 350,085,706 318,744,885 328,175,555 9,430,670 3.0% Scholarships and Fellowships 348,733,304 382,879,272 368,188,941 (14,690,331) ‐3.8% Auxiliary Enterprises 501,980,900 518,249,875 554,029,206 35,779,331 6.9% Depreciation and Amortization 504,698,564 495,132,061 529,667,859 34,535,798 7.0%Total Operating Expenses 5,252,529,884 5,520,498,857 5,645,775,930 125,277,073 2.3%Operating Surplus/Deficit (1,982,970,207) (2,263,003,405) (2,236,208,371) 26,795,034 ‐1.2%
Budgeted Nonoperating Revenues (Expenses): State Appropriations 1,051,481,341 1,055,537,995 1,093,954,659 38,416,664 3.6% Federal Sponsored Programs (Nonoperating) 328,382,016 300,418,948 301,561,833 1,142,885 0.4% State/Local Sponsored Programs (Nonoperating) 20,661,721 79,792,066 46,790,198 (33,001,868) ‐41.4% Gifts in Support of Operations 190,615,053 179,486,278 185,881,555 6,395,277 3.6% Net Investment Income 310,753,633 284,496,350 295,742,942 11,246,592 4.0%Other Non‐Operating Revenue ‐ ‐ ‐ ‐ ‐ Other Non‐Operating (Expenses) ‐ ‐ ‐ ‐ ‐ Net Non‐Operating Revenue/(Expenses) 1,901,893,764 1,899,731,637 1,923,931,187 24,199,550 1.3%
Transfers and Other: AUF Transfers Received for Operations 300,512,341 268,905,000 297,620,000 28,715,000 10.7% AUF Transfers (Made) for Operations ‐ ‐ ‐ ‐ ‐ Transfers for Debt Service ‐ Interest (123,499,946) (121,665,370) (149,469,528) (27,804,158) 22.9%Total Transfers and Other 177,012,395 147,239,630 148,150,472 910,842 0.6%
Budget Margin (Deficit) 95,935,952 (216,032,138) (164,126,712) 51,905,426 ‐24.0%
Reconciliation to Change in Net Assets: Net Non‐Profit Health Corp Activity ‐ ‐ ‐ ‐ ‐ Net Inc./(Dec.) in Fair Value of Investments (3,929,264) ‐ ‐ ‐ ‐ Interest Expense on Capital Asset Financings (1,266,236) (1,150,000) (1,200,000) (50,000) 4.3% Capital Approp., Gifts and Sponsored Programs 44,154,240 110,836,795 77,341,391 (33,495,404) ‐30.2% Additions to Permanent Endowments 81,596,236 73,354,173 78,230,936 4,876,763 6.6% Transfers for Debt Service ‐ Principal (157,221,191) (151,000,596) (178,498,918) (27,498,322) 18.2% Reverse Transfers for Debt Service (System Only) ‐ ‐ ‐ ‐ ‐ Transfers and Other 193,197,032 220,524,868 371,605,879 151,081,011 68.5%SRECNA Change in Net Assets $ 252,466,769 36,533,102 183,352,576 146,819,474 401.9%
Total Revenues and AUF Transfers $ 5,471,965,782 5,426,132,089 5,631,118,746 204,986,657 3.8%Total Expenses (Including Transfers for Interest) (5,376,029,830) (5,642,164,227) (5,795,245,458) (153,081,231) 2.7%Budget Margin (Deficit) $ 95,935,952 (216,032,138) (164,126,712) 51,905,426
Reconciliation to Use of Prior Year Balances Depreciation 495,132,061 529,667,859 Capital Outlay (112,658,874) (149,283,009) Transfers for Debt Service ‐ Principal (151,000,596) (178,498,918) Budgeted Transfers (37,141,311) (28,699,786) Net Additions to (Uses of) Prior Year Balances (21,700,858) 9,059,434
Note: Operating Budget Highlights with a glossary of terms are included on Page 1.
U. T. System Office of the Controller 11

The University of Texas Health‐Related InstitutionsOperating Budget
Fiscal Year Ending August 31, 2017
BudgetFY 2016 FY 2017 Increases (Decreases)
FY 2016 Adjusted Operating From 2016 to 2017 Projected Budget Budget Amount Percent
Operating Revenues: Tuition and Fees $ 149,595,224 147,512,527 152,171,944 4,659,417 3.2% Federal Sponsored Programs 739,678,561 750,275,881 727,557,080 (22,718,801) ‐3.0% State Sponsored Programs 139,955,843 107,123,671 144,850,531 37,726,860 35.2% Local and Private Sponsored Programs 1,124,423,073 1,093,307,630 1,164,254,381 70,946,751 6.5% Net Sales and Services of Educational Activities 98,099,189 89,043,488 92,445,207 3,401,719 3.8% Net Sales and Services of Hospital and Clinics 5,413,550,519 5,237,917,437 6,005,936,393 768,018,956 14.7% Net Professional Fees 1,669,992,333 1,624,872,380 1,752,834,630 127,962,250 7.9% Net Auxiliary Enterprises 113,090,934 118,164,153 126,286,356 8,122,203 6.9% Other Operating Revenues 378,738,522 332,180,034 329,325,025 (2,855,009) ‐0.9%Total Operating Revenues 9,827,124,198 9,500,397,201 10,495,661,547 995,264,346 10.5%
Operating Expenses: Instruction 2,200,067,120 2,195,704,619 2,323,257,553 127,552,934 5.8% Academic Support 285,972,534 281,759,368 318,714,146 36,954,778 13.1% Research 1,463,484,349 1,473,909,832 1,500,461,758 26,551,926 1.8% Public Service 121,760,142 125,505,584 128,315,415 2,809,831 2.2% Hospitals and Clinics 5,354,396,116 5,187,753,749 5,562,703,579 374,949,830 7.2% Institutional Support 379,555,922 351,739,043 396,939,546 45,200,503 12.9% Student Services 24,112,766 25,954,995 26,911,180 956,185 3.7% Operations and Maintenance of Plant 383,850,626 417,390,253 410,248,841 (7,141,412) ‐1.7% Scholarships and Fellowships 22,550,936 24,011,122 22,997,002 (1,014,120) ‐4.2% Auxiliary Enterprises 86,492,915 91,323,506 92,913,913 1,590,407 1.7% Depreciation and Amortization 778,620,488 771,453,275 862,206,423 90,753,148 11.8%Total Operating Expenses 11,100,863,914 10,946,505,346 11,645,669,356 699,164,010 6.4%Operating Surplus/Deficit (1,273,739,716) (1,446,108,145) (1,150,007,809) 296,100,336 ‐20.5%
Budgeted Nonoperating Revenues (Expenses): State Appropriations 1,180,794,297 1,177,497,812 1,221,866,324 44,368,512 3.8% Federal Sponsored Programs (Nonoperating) 3,232,149 3,330,000 3,334,002 4,002 0.1% State Sponsored Programs (Nonoperating) ‐ ‐ ‐ ‐ ‐ Gifts in Support of Operations 266,994,915 223,619,202 235,011,160 11,391,958 5.1% Net Investment Income 299,605,831 357,716,096 374,642,387 16,926,291 4.7%Other Non‐Operating Revenue ‐ ‐ ‐ ‐ ‐ Other Non‐Operating (Expenses) ‐ ‐ ‐ ‐ ‐ Net Non‐Operating Revenue/(Expenses) 1,750,627,192 1,762,163,110 1,834,853,873 72,690,763 4.1%
Transfers and Other: AUF Transfers Received for Operations ‐ ‐ ‐ ‐ ‐ AUF Transfers (Made) for Operations ‐ ‐ ‐ ‐ ‐ Transfers for Debt Service ‐ Interest (115,683,339) (106,329,299) (134,384,033) (28,054,734) 26.4%Total Transfers and Other (115,683,339) (106,329,299) (134,384,033) (28,054,734) 26.4%
Budget Margin (Deficit) 361,204,137 209,725,666 550,462,031 340,736,365 162.5%
Reconciliation to Change in Net Assets: Net Non‐Profit Health Corp Activity 19,292,843 8,000,000 3,000,000 (5,000,000) ‐62.5% Net Inc./(Dec.) in Fair Value of Investments (51,247,848) ‐ ‐ ‐ ‐ Interest Expense on Capital Asset Financings (1,323,694) ‐ ‐ ‐ ‐ Capital Approp., Gifts and Sponsored Programs 87,815,441 169,489,171 156,874,803 (12,614,368) ‐7.4% Additions to Permanent Endowments 38,327,977 40,897,301 54,400,000 13,502,699 33.0% Transfers for Debt Service ‐ Principal (207,206,607) (200,563,626) (234,749,423) (34,185,797) 17.0% Reverse Transfers for Debt Service (System Only) ‐ ‐ ‐ ‐ ‐ Transfers and Other 252,899,990 271,880,800 547,801,363 275,920,563 101.5%SRECNA Change in Net Assets $ 499,762,239 499,429,312 1,077,788,774 578,359,462 115.8%
Total Revenues and AUF Transfers $ 11,577,751,390 11,262,560,311 12,330,515,420 1,067,955,109 9.5%Total Expenses (Including Transfers for Interest) (11,216,547,253) (11,052,834,645) (11,780,053,389) (727,218,744) 6.6%Budget Margin (Deficit) $ 361,204,137 209,725,666 550,462,031 340,736,365
Reconciliation to Use of Prior Year Balances Depreciation 771,453,275 862,206,423 Capital Outlay (667,777,362) (930,720,050) Transfers for Debt Service ‐ Principal (200,563,626) (234,749,423) Budgeted Transfers 756,000 (567,875) Net Additions to (Uses of) Prior Year Balances 113,593,953 246,631,106
Note: Operating Budget Highlights with a glossary of terms are included on Page 1.
U. T. System Office of the Controller 12
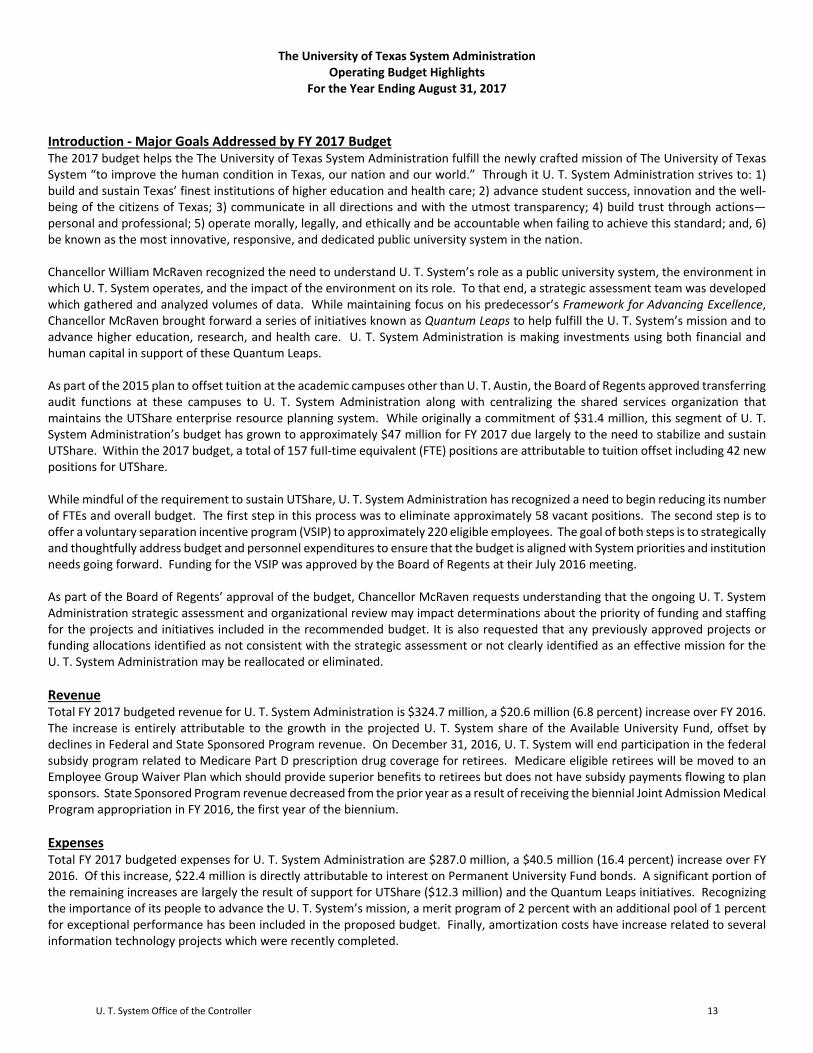
The University of Texas System Administration Operating Budget Highlights
For the Year Ending August 31, 2017
Introduction ‐ Major Goals Addressed by FY 2017 Budget The 2017 budget helps the The University of Texas System Administration fulfill the newly crafted mission of The University of Texas System “to improve the human condition in Texas, our nation and our world.” Through it U. T. System Administration strives to: 1) build and sustain Texas’ finest institutions of higher education and health care; 2) advance student success, innovation and the well‐being of the citizens of Texas; 3) communicate in all directions and with the utmost transparency; 4) build trust through actions—personal and professional; 5) operate morally, legally, and ethically and be accountable when failing to achieve this standard; and, 6) be known as the most innovative, responsive, and dedicated public university system in the nation. Chancellor William McRaven recognized the need to understand U. T. System’s role as a public university system, the environment in which U. T. System operates, and the impact of the environment on its role. To that end, a strategic assessment team was developed which gathered and analyzed volumes of data. While maintaining focus on his predecessor’s Framework for Advancing Excellence, Chancellor McRaven brought forward a series of initiatives known as Quantum Leaps to help fulfill the U. T. System’s mission and to advance higher education, research, and health care. U. T. System Administration is making investments using both financial and human capital in support of these Quantum Leaps. As part of the 2015 plan to offset tuition at the academic campuses other than U. T. Austin, the Board of Regents approved transferring audit functions at these campuses to U. T. System Administration along with centralizing the shared services organization that maintains the UTShare enterprise resource planning system. While originally a commitment of $31.4 million, this segment of U. T. System Administration’s budget has grown to approximately $47 million for FY 2017 due largely to the need to stabilize and sustain UTShare. Within the 2017 budget, a total of 157 fuIl‐time equivalent (FTE) positions are attributable to tuition offset including 42 new positions for UTShare. While mindful of the requirement to sustain UTShare, U. T. System Administration has recognized a need to begin reducing its number of FTEs and overall budget. The first step in this process was to eliminate approximately 58 vacant positions. The second step is to offer a voluntary separation incentive program (VSIP) to approximately 220 eligible employees. The goal of both steps is to strategically and thoughtfully address budget and personnel expenditures to ensure that the budget is aligned with System priorities and institution needs going forward. Funding for the VSIP was approved by the Board of Regents at their July 2016 meeting. As part of the Board of Regents’ approval of the budget, Chancellor McRaven requests understanding that the ongoing U. T. System Administration strategic assessment and organizational review may impact determinations about the priority of funding and staffing for the projects and initiatives included in the recommended budget. It is also requested that any previously approved projects or funding allocations identified as not consistent with the strategic assessment or not clearly identified as an effective mission for the U. T. System Administration may be reallocated or eliminated.
Revenue Total FY 2017 budgeted revenue for U. T. System Administration is $324.7 million, a $20.6 million (6.8 percent) increase over FY 2016. The increase is entirely attributable to the growth in the projected U. T. System share of the Available University Fund, offset by declines in Federal and State Sponsored Program revenue. On December 31, 2016, U. T. System will end participation in the federal subsidy program related to Medicare Part D prescription drug coverage for retirees. Medicare eligible retirees will be moved to an Employee Group Waiver Plan which should provide superior benefits to retirees but does not have subsidy payments flowing to plan sponsors. State Sponsored Program revenue decreased from the prior year as a result of receiving the biennial Joint Admission Medical Program appropriation in FY 2016, the first year of the biennium.
Expenses Total FY 2017 budgeted expenses for U. T. System Administration are $287.0 million, a $40.5 million (16.4 percent) increase over FY 2016. Of this increase, $22.4 million is directly attributable to interest on Permanent University Fund bonds. A significant portion of the remaining increases are largely the result of support for UTShare ($12.3 million) and the Quantum Leaps initiatives. Recognizing the importance of its people to advance the U. T. System’s mission, a merit program of 2 percent with an additional pool of 1 percent for exceptional performance has been included in the proposed budget. Finally, amortization costs have increase related to several information technology projects which were recently completed.
U. T. System Office of the Controller 13

The University of Texas System Administration Operating Budget
Fiscal Year Ending August 31, 2017
BudgetFY 2016 FY 2017 Increases (Decreases)
FY 2016 Adjusted Operating From 2016 to 2017 Projected Budget Budget Amount Percent
Operating Revenues: Tuition and Fees $ ‐ ‐ ‐ ‐ ‐ Federal Sponsored Programs 8,533,477 9,260,000 5,000,000 (4,260,000) ‐46.0% State Sponsored Programs 12,456,794 12,456,794 2,250,000 (10,206,794) ‐81.9% Local and Private Sponsored Programs 400,000 ‐ ‐ ‐ ‐ Net Sales and Services of Educational Activities 32,522,511 2,315,637 2,444,403 128,766 5.6% Net Sales and Services of Hospital and Clinics ‐ ‐ ‐ ‐ ‐ Net Professional Fees ‐ ‐ ‐ ‐ ‐ Net Auxiliary Enterprises ‐ ‐ ‐ ‐ ‐ Other Operating Revenues 28,198,632 ‐ ‐ ‐ ‐ Total Operating Revenues 82,111,414 24,032,431 9,694,403 (14,338,028) ‐59.7%
Operating Expenses: Instruction ‐ ‐ ‐ ‐ ‐ Academic Support 8,949,916 8,267,034 8,267,034 ‐ 0.0% Research ‐ ‐ ‐ ‐ ‐ Public Service 2,250,000 2,250,000 2,250,000 ‐ 0.0% Hospitals and Clinics ‐ ‐ ‐ ‐ ‐ Institutional Support 1,118,417,132 133,398,225 147,060,759 13,662,534 10.2% Student Services ‐ ‐ ‐ ‐ ‐ Operations and Maintenance of Plant 1,740,316 ‐ ‐ ‐ ‐ Scholarships and Fellowships 212,800 1,714,360 2,054,860 340,500 19.9% Auxiliary Enterprises ‐ ‐ ‐ ‐ ‐ Depreciation and Amortization 17,765,509 13,267,688 17,348,354 4,080,666 30.8%Total Operating Expenses 1,149,335,673 158,897,307 176,981,007 18,083,700 11.4%Operating Surplus/Deficit (1,067,224,259) (134,864,876) (167,286,604) (32,421,728) 24.0%
Budgeted Nonoperating Revenues (Expenses): State Appropriations 2,500,000 ‐ ‐ ‐ ‐ Federal Sponsored Programs (Nonoperating) 27,424,760 ‐ ‐ ‐ ‐ State Sponsored Programs (Nonoperating) ‐ ‐ ‐ ‐ ‐ Gifts in Support of Operations 1,629,302 1,155,100 1,474,457 319,357 27.6% Net Investment Income 668,462,402 547,890,566 611,176,191 63,285,625 11.6%Other Non‐Operating Revenue ‐ ‐ ‐ ‐ ‐ Other Non‐Operating (Expenses) ‐ ‐ ‐ ‐ ‐ Net Non‐Operating Revenue/(Expenses) 700,016,464 549,045,666 612,650,648 63,604,982 11.6%
Transfers and Other: AUF Transfers Received for Operations 103,149,269 91,082,789 111,397,461 20,314,672 22.3% AUF Transfers (Made) for Operations (403,661,610) (359,987,789) (409,017,461) (49,029,672) 13.6% Transfers for Debt Service ‐ Interest (66,485,728) (87,562,622) (110,004,300) (22,441,678) 25.6%Total Transfers and Other (366,998,069) (356,467,622) (407,624,300) (51,156,678) 14.4%
Budget Margin (Deficit) (734,205,864) 57,713,168 37,739,744 (19,973,424) ‐34.6%
Reconciliation to Change in Net Assets: Net Non‐Profit Health Corp Activity ‐ ‐ ‐ ‐ ‐ Net Inc./(Dec.) in Fair Value of Investments (773,785,184) ‐ ‐ ‐ ‐ Interest Expense on Capital Asset Financings (305,669,013) (315,557,291) (393,857,861) (78,300,570) 24.8% Capital Approp., Gifts and Sponsored Programs ‐ ‐ ‐ ‐ ‐ Additions to Permanent Endowments 120,000,000 112,501,474 132,630,936 20,129,462 17.9% Transfers for Debt Service ‐ Principal (37,220,000) (87,388,925) (40,620,000) 46,768,925 ‐53.5% Reverse Transfers for Debt Service (System Only) 707,316,811 754,510,438 847,726,202 93,215,764 12.4% Transfers and Other (254,742,254) (51,311,265) (89,197,593) (37,886,328) 73.8%SRECNA Change in Net Assets $ (1,278,305,504) 470,467,599 494,421,428 23,953,829 5.1%
Total Revenues and AUF Transfers $ 481,615,537 304,173,097 324,725,051 20,551,954 6.8%Total Expenses (Including Transfers for Interest) (1,215,821,401) (246,459,929) (286,985,307) (40,525,378) 16.4%Budget Margin (Deficit) $ (734,205,864) 57,713,168 37,739,744 (19,973,424)
Reconciliation to Use of Prior Year Balances Depreciation 13,267,688 17,348,354 Capital Outlay (6,000,000) (2,800,000) Transfers for Debt Service ‐ Principal (87,388,925) (40,620,000) Budgeted Transfers (1,175,485) (1,184,835) Net Additions to (Uses of) Prior Year Balances (23,583,554) 10,483,263
Note: Operating Budget Highlights with a glossary of terms are included on Page 1.
U. T. System Office of the Controller 14

The University of Texas at Arlington Operating Budget Highlights
For the Year Ending August 31, 2017
Introduction ‐ Major Goals Addressed by FY 2017 Budget The University of Texas at Arlington’s Strategic Plan “Bold Solutions/Global Impact” charts an ambitious agenda with the goal of ensuring that U. T. Arlington will be one of the “best of the best”, a thought leader, and an institution that sets standards for others to follow. With a focus on enabling a sustainable megacity and developed around four themes of (1) Health and the Human Condition, (2) Sustainable Urban Communities, (3) Global Environmental Impact, and (4) Data‐Driven Discovery, the plan fosters the collaborative and cross‐disciplinary thinking that the future demands and will help U. T. Arlington address the epic challenges that face the community – an urgent calling as the Dallas‐Fort Worth‐Arlington Metropolitan Area with almost seven million people today rapidly approaches megacity status. Based on the plan, five areas of strategic priority were identified in the Institutional Scope of Work submitted to U. T. System in October 2015 namely: enhancing student access and increasing success; increasing faculty excellence and numbers and developing appropriate staff support; developing infrastructure and addressing maintenance and obsolescence; increasing the research and innovation enterprise; and enhancing donor support. While maintaining a focus on achieving improved efficiencies, cost containment and revenue enhancement, U. T. Arlington is making further investments in key theme areas that support strategic priorities.
Revenue Total annual operating revenue is expected to increase by 4.6 percent in FY 2017 due to increased enrollments in on‐campus and accelerated online programs leading to additional tuition income. Additionally, the tuition increases approved by the U. T. System Board of Regents will generate 3.1 percent of the increase in tuition revenue. High demand for campus housing and the maximization of capacity have led to an increase in housing, parking, and dining services revenue. Total non‐operating revenue is expected to increase by 4.4 percent as a result of additional state appropriations from formula funding and for tuition revenue bond funding appropriated during the 84th Texas legislative session. An increase in net investment income is also expected.
Expenses U. T. Arlington’s operating expenses are expected to increase by 4.3 percent in FY 2017. This is primarily due to a merit increase for qualifying faculty and staff effective September 1, 2016, subject to U. T. System Board of Regents approval, in addition to further investment in student support and instructional services, technology, student transportation needs, campus security initiatives, and faculty and staff market based salary adjustments.
U. T. System Office of the Controller 15

The University of Texas at ArlingtonOperating Budget
Fiscal Year Ending August 31, 2017
BudgetFY 2016 FY 2017 Increases (Decreases)
FY 2016 Adjusted Operating From 2016 to 2017 Projected Budget Budget Amount Percent
Operating Revenues: Tuition and Fees $ 247,184,586 233,913,138 253,843,849 19,930,711 8.5% Federal Sponsored Programs 41,808,955 56,769,540 53,769,540 (3,000,000) ‐5.3% State Sponsored Programs 13,719,132 21,962,472 21,999,031 36,559 0.2% Local and Private Sponsored Programs 9,798,433 13,199,681 12,702,277 (497,404) ‐3.8% Net Sales and Services of Educational Activities 20,035,555 25,586,676 24,727,165 (859,511) ‐3.4% Net Sales and Services of Hospital and Clinics ‐ ‐ ‐ ‐ ‐ Net Professional Fees ‐ ‐ ‐ ‐ ‐ Net Auxiliary Enterprises 39,786,542 33,848,487 36,100,928 2,252,441 6.7% Other Operating Revenues 9,669,324 6,737,850 6,934,007 196,157 2.9%Total Operating Revenues 382,002,527 392,017,844 410,076,797 18,058,953 4.6%
Operating Expenses: Instruction 181,306,900 184,476,463 191,461,903 6,985,440 3.8% Academic Support 46,398,612 49,295,145 51,824,689 2,529,544 5.1% Research 69,551,653 65,944,273 68,662,309 2,718,036 4.1% Public Service 8,562,553 8,398,225 10,017,140 1,618,915 19.3% Hospitals and Clinics ‐ ‐ ‐ ‐ ‐ Institutional Support 54,655,106 58,538,839 60,556,488 2,017,649 3.4% Student Services 59,669,620 67,528,039 69,870,520 2,342,481 3.5% Operations and Maintenance of Plant 30,139,639 28,007,239 31,453,005 3,445,766 12.3% Scholarships and Fellowships 26,181,562 29,484,505 28,326,380 (1,158,125) ‐3.9% Auxiliary Enterprises 42,598,255 45,028,999 49,393,181 4,364,182 9.7% Depreciation and Amortization 48,377,158 48,268,770 48,802,217 533,447 1.1%Total Operating Expenses 567,441,058 584,970,497 610,367,832 25,397,335 4.3%Operating Surplus/Deficit (185,438,531) (192,952,653) (200,291,035) (7,338,382) 3.8%
Budgeted Nonoperating Revenues (Expenses): State Appropriations 131,482,991 131,482,991 138,749,561 7,266,570 5.5% Federal Sponsored Programs (Nonoperating) 51,049,978 46,000,000 50,000,000 4,000,000 8.7% State Sponsored Programs (Nonoperating) 7,159,022 7,159,022 3,080,758 (4,078,264) ‐57.0% Gifts in Support of Operations 4,980,889 6,993,585 6,535,755 (457,830) ‐6.5% Net Investment Income 12,608,642 10,586,329 12,692,949 2,106,620 19.9%Other Non‐Operating Revenue ‐ ‐ ‐ ‐ ‐ Other Non‐Operating (Expenses) ‐ ‐ ‐ ‐ ‐ Net Non‐Operating Revenue/(Expenses) 207,281,522 202,221,927 211,059,023 8,837,096 4.4%
Transfers and Other: AUF Transfers Received for Operations ‐ ‐ ‐ ‐ ‐ AUF Transfers (Made) for Operations ‐ ‐ ‐ ‐ ‐ Transfers for Debt Service ‐ Interest (11,740,979) (11,618,936) (14,532,993) (2,914,057) 25.1%Total Transfers and Other (11,740,979) (11,618,936) (14,532,993) (2,914,057) 25.1%
Budget Margin (Deficit) 10,102,012 (2,349,662) (3,765,005) (1,415,343) 60.2%
Reconciliation to Change in Net Assets: Net Non‐Profit Health Corp Activity ‐ ‐ ‐ ‐ ‐ Net Inc./(Dec.) in Fair Value of Investments ‐ ‐ ‐ ‐ ‐ Interest Expense on Capital Asset Financings ‐ ‐ ‐ ‐ ‐ Capital Approp., Gifts and Sponsored Programs 1,002,225 6,064,981 6,196,591 131,610 2.2% Additions to Permanent Endowments 3,949,871 5,042,510 5,546,761 504,251 10.0% Transfers for Debt Service ‐ Principal (17,462,701) (17,462,701) (17,920,000) (457,299) 2.6% Reverse Transfers for Debt Service (System Only) ‐ ‐ ‐ ‐ ‐ Transfers and Other 5,598,140 7,524,484 54,507,000 46,982,516 624.4%SRECNA Change in Net Assets $ 3,189,547 (1,180,388) 44,565,347 45,745,735 ‐3875.5%
Total Revenues and AUF Transfers $ 589,284,049 594,239,771 621,135,820 26,896,049 4.5%Total Expenses (Including Transfers for Interest) (579,182,037) (596,589,433) (624,900,825) (28,311,392) 4.7%Budget Margin (Deficit) $ 10,102,012 (2,349,662) (3,765,005) (1,415,343)
Reconciliation to Use of Prior Year Balances Depreciation 48,268,770 48,802,217 Capital Outlay (24,608,789) (26,339,743) Transfers for Debt Service ‐ Principal (17,462,701) (17,920,000) Budgeted Transfers (3,847,618) (777,469) Net Additions to (Uses of) Prior Year Balances ‐ ‐
Note: Operating Budget Highlights with a glossary of terms are included on Page 1.
U. T. System Office of the Controller 16

The University of Texas at Austin Operating Budget Highlights
For the Year Ending August 31, 2017
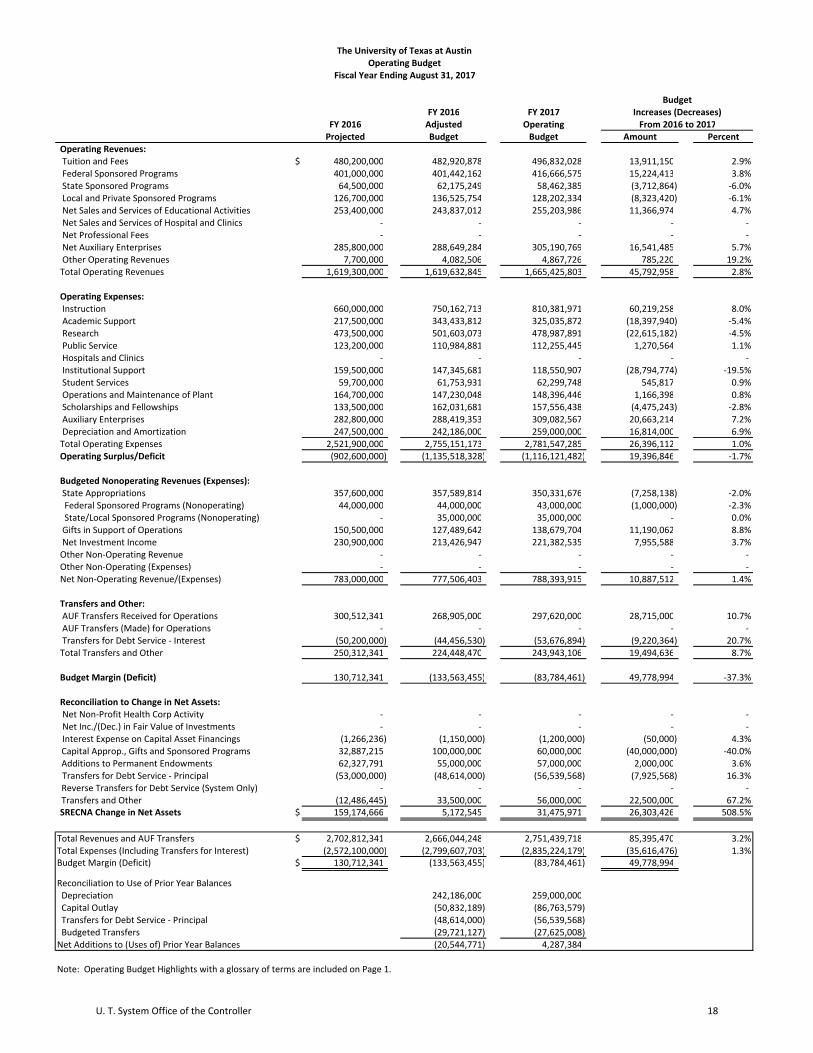
Introduction ‐ Major Goals Addressed by FY 2017 Budget The University of Texas at Austin remains focused on advancing U. T. Austin to become one of the top public universities in the nation. U. T. Austin will continue to be innovative in educating undergraduate students to be tomorrow’s leaders in a globally competitive and diverse environment while increasing opportunities to learn from its research mission in order to have the greatest impact and value to the people of Texas. U. T. Austin will transform lives by sharing its unique resources with the state, nation, and the world while being good stewards of taxpayer and tuition dollars to maximize the value from every dollar spent. The faculty is at the heart of the education and research mission. To maintain competitiveness for faculty, it is essential to pre‐emptively adjust the salaries of the best faculty across all departments. The Faculty Investment Initiative was funded to provide recurring salary support for the upper decile of senior faculty as identified by deans of the colleges and schools. U. T. Austin was able to fund an institutional merit pool of 2 percent for faculty. Deans will use this merit pool to address high‐priority salary competitiveness for faculty not included in the Faculty Investment Initiative. Undergraduate education and student success initiatives remain critical elements of this budget. In January, the university‐wide Project 2021 was launched to work with faculty to create next generation undergraduate degrees by redesigning courses, incorporating experiential learning, integrating technology, and rigorously evaluating results. U. T. Austin has a ten‐year goal to double sponsored research. To accomplish this, funding strategies are being identified, including interdisciplinary opportunities and those that involve centers of excellence. U. T. Austin is investing in the research infrastructure and technology commercialization support, which are essential for faculty members and students to excel. The Dell Medical School will welcome its inaugural class this summer. They will begin their medical education in the new Center for Health Building. With the support of Travis County taxpayers and the Board of Regents, three more new buildings will open for the medical center, creating the health care system of the future with person‐centered, valued‐added health care that provides for healthier communities. Crucial to the University’s success in meeting its teaching and research mission, and in being counted among the world’s best institutions of higher education, is addressing the challenges of providing a diverse campus. The University must continue to devote financial resources to this critical element of excellence. The University and the nation benefit when students are educated in an environment rich in the very diversity that has made this nation great.
Revenue The state general revenue funding for FY 2017 decreased by $7.3 million. This reduction is due to one‐time funding that ends in FY 2016, including a $9.2 million decrease for the Darrell K. Royal (DKR) Alzheimer’s Initiative, a $3.7 million decrease for Emerging Technology funds, and a $2.9 million decrease in Marine Science Institute funding for repairs. These reductions were partially offset by a $5.8 million increase in tuition revenue bond funding. Tuition revenue increased about $16.6 million due to the Board of Regents’ approved 3 percent increase and the addition of tuition for medical students. The overall Available University Fund (AUF) amount increased by $28.7 million, of which $27.7 million is recurring and $1 million is due to a one‐time Board approved payout increase. Sponsored program revenue was adjusted to remove Emerging Technology Funds and to reflect historical actual revenue. Gift estimated revenue increased to align with historical actual revenue.
Expenses Subject to approval by the Board of Regents, U. T. Austin plans to implement a modest average 2 percent strategic merit‐based salary increase policy to remain a leading university that is competitive in attracting and retaining talented faculty and staff. State‐funded expenses were adjusted for the noted reductions in the one‐time funding of DKR Alzheimer’s Initiative, Emerging Technology and Marine Science Institute. Faculty and staff salaries increased for the 2 percent salary policy, and staff benefits increased proportionally and for an average 5.5 percent increase in health care premiums. Reserves were budgeted to allow for the new Executive Vice President and Provost and Senior Vice President and Chief Financial Officer to collaborate on strategic priorities. The AUF increase will be used to fund academic initiatives.
U. T. System Office of the Controller 17
The University of Texas at AustinOperating Budget
Fiscal Year Ending August 31, 2017
BudgetFY 2016 FY 2017 Increases (Decreases)
FY 2016 Adjusted Operating From 2016 to 2017 Projected Budget Budget Amount Percent
Operating Revenues: Tuition and Fees $ 480,200,000 482,920,878 496,832,028 13,911,150 2.9% Federal Sponsored Programs 401,000,000 401,442,162 416,666,575 15,224,413 3.8% State Sponsored Programs 64,500,000 62,175,249 58,462,385 (3,712,864) ‐6.0% Local and Private Sponsored Programs 126,700,000 136,525,754 128,202,334 (8,323,420) ‐6.1% Net Sales and Services of Educational Activities 253,400,000 243,837,012 255,203,986 11,366,974 4.7% Net Sales and Services of Hospital and Clinics ‐ ‐ ‐ ‐ ‐ Net Professional Fees ‐ ‐ ‐ ‐ ‐ Net Auxiliary Enterprises 285,800,000 288,649,284 305,190,769 16,541,485 5.7% Other Operating Revenues 7,700,000 4,082,506 4,867,726 785,220 19.2%Total Operating Revenues 1,619,300,000 1,619,632,845 1,665,425,803 45,792,958 2.8%
Operating Expenses: Instruction 660,000,000 750,162,713 810,381,971 60,219,258 8.0% Academic Support 217,500,000 343,433,812 325,035,872 (18,397,940) ‐5.4% Research 473,500,000 501,603,073 478,987,891 (22,615,182) ‐4.5% Public Service 123,200,000 110,984,881 112,255,445 1,270,564 1.1% Hospitals and Clinics ‐ ‐ ‐ ‐ ‐ Institutional Support 159,500,000 147,345,681 118,550,907 (28,794,774) ‐19.5% Student Services 59,700,000 61,753,931 62,299,748 545,817 0.9% Operations and Maintenance of Plant 164,700,000 147,230,048 148,396,446 1,166,398 0.8% Scholarships and Fellowships 133,500,000 162,031,681 157,556,438 (4,475,243) ‐2.8% Auxiliary Enterprises 282,800,000 288,419,353 309,082,567 20,663,214 7.2% Depreciation and Amortization 247,500,000 242,186,000 259,000,000 16,814,000 6.9%Total Operating Expenses 2,521,900,000 2,755,151,173 2,781,547,285 26,396,112 1.0%Operating Surplus/Deficit (902,600,000) (1,135,518,328) (1,116,121,482) 19,396,846 ‐1.7%
Budgeted Nonoperating Revenues (Expenses): State Appropriations 357,600,000 357,589,814 350,331,676 (7,258,138) ‐2.0% Federal Sponsored Programs (Nonoperating) 44,000,000 44,000,000 43,000,000 (1,000,000) ‐2.3% State/Local Sponsored Programs (Nonoperating) ‐ 35,000,000 35,000,000 ‐ 0.0% Gifts in Support of Operations 150,500,000 127,489,642 138,679,704 11,190,062 8.8% Net Investment Income 230,900,000 213,426,947 221,382,535 7,955,588 3.7%Other Non‐Operating Revenue ‐ ‐ ‐ ‐ ‐ Other Non‐Operating (Expenses) ‐ ‐ ‐ ‐ ‐ Net Non‐Operating Revenue/(Expenses) 783,000,000 777,506,403 788,393,915 10,887,512 1.4%
Transfers and Other: AUF Transfers Received for Operations 300,512,341 268,905,000 297,620,000 28,715,000 10.7% AUF Transfers (Made) for Operations ‐ ‐ ‐ ‐ ‐ Transfers for Debt Service ‐ Interest (50,200,000) (44,456,530) (53,676,894) (9,220,364) 20.7%Total Transfers and Other 250,312,341 224,448,470 243,943,106 19,494,636 8.7%
Budget Margin (Deficit) 130,712,341 (133,563,455) (83,784,461) 49,778,994 ‐37.3%
Reconciliation to Change in Net Assets: Net Non‐Profit Health Corp Activity ‐ ‐ ‐ ‐ ‐ Net Inc./(Dec.) in Fair Value of Investments ‐ ‐ ‐ ‐ ‐ Interest Expense on Capital Asset Financings (1,266,236) (1,150,000) (1,200,000) (50,000) 4.3% Capital Approp., Gifts and Sponsored Programs 32,887,215 100,000,000 60,000,000 (40,000,000) ‐40.0% Additions to Permanent Endowments 62,327,791 55,000,000 57,000,000 2,000,000 3.6% Transfers for Debt Service ‐ Principal (53,000,000) (48,614,000) (56,539,568) (7,925,568) 16.3% Reverse Transfers for Debt Service (System Only) ‐ ‐ ‐ ‐ ‐ Transfers and Other (12,486,445) 33,500,000 56,000,000 22,500,000 67.2%SRECNA Change in Net Assets $ 159,174,666 5,172,545 31,475,971 26,303,426 508.5%
Total Revenues and AUF Transfers $ 2,702,812,341 2,666,044,248 2,751,439,718 85,395,470 3.2%Total Expenses (Including Transfers for Interest) (2,572,100,000) (2,799,607,703) (2,835,224,179) (35,616,476) 1.3%Budget Margin (Deficit) $ 130,712,341 (133,563,455) (83,784,461) 49,778,994
Reconciliation to Use of Prior Year Balances Depreciation 242,186,000 259,000,000 Capital Outlay (50,832,189) (86,763,579) Transfers for Debt Service ‐ Principal (48,614,000) (56,539,568) Budgeted Transfers (29,721,127) (27,625,008) Net Additions to (Uses of) Prior Year Balances (20,544,771) 4,287,384
Note: Operating Budget Highlights with a glossary of terms are included on Page 1.
U. T. System Office of the Controller 18


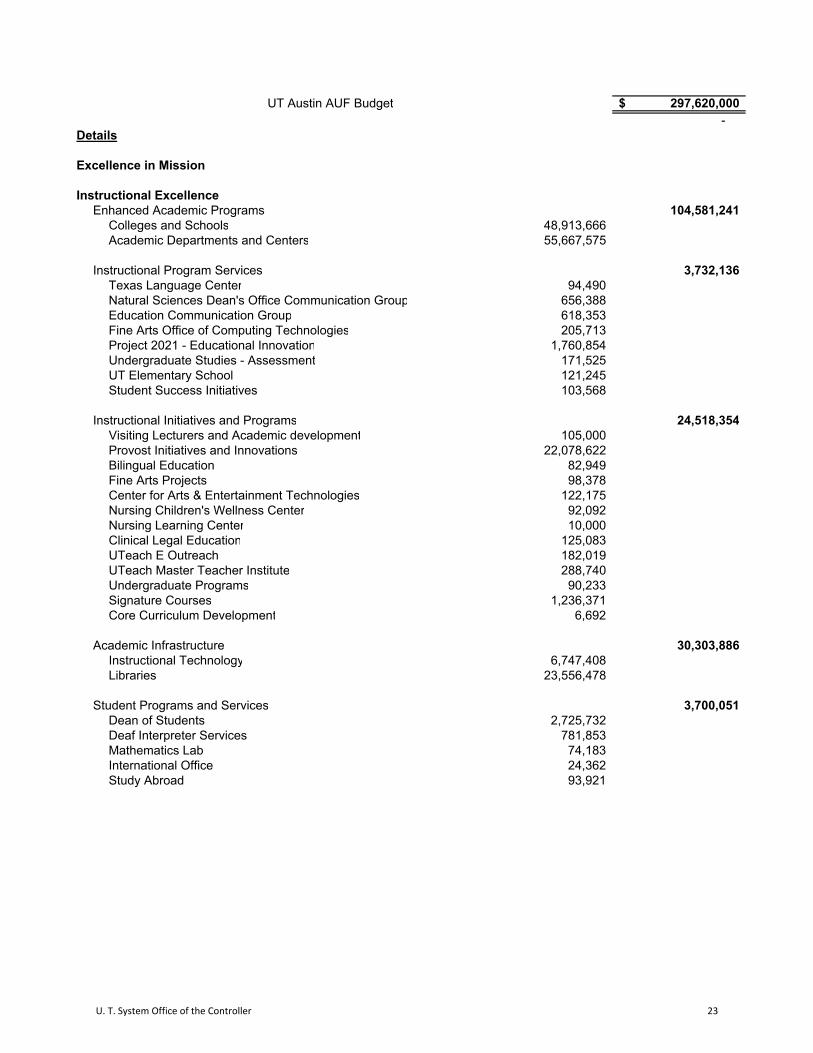
Application of Available University Fund (AUF)Recommended Budget 2016-17
Excellence in Mission: 184,686,760$ Instructional Excellence
Enhanced Academic Programs 104,581,241$
Instructional Program Services 3,732,136
Instructional Initiatives and Programs 24,518,354
The mission of the University is to achieve excellence in the interrelated areas of undergraduate education, graduate education, research, and public service. And all sources of funds (appropriated, AUF, tuition, grants, and gifts) are expended to this end.
According to the Texas Constitution, one of the uses of the AUF is the support and maintenance of the University. Over the years, the AUF has provided the margin of excellence that permits UT Austin to achieve and maintain its place as one of the premier public institutions of higher education in the nation.
The margin of excellence and operations support of the University are described below:
Academic initiatives at the college and departmental level enhanced by the AUF include curriculum innovation, development of new degree programs, interdisciplinary program planning and coordination, honors programs, internship programs, academic technology and facility support, K-12 and community outreach activities, and continuing education. For FY 16-17, it also includes reserves to be allocated by new executive leadership (Executive Vice President & Provost and Senior Vice President & CFO).
These services include educational innovation, student success initiatives, college computing services, instructional and technology enhanced teaching support, provision of Web-based student-faculty communication platforms, teaching effectiveness services, credit by examination, new and experienced faculty training, assessment methods, student course-instructor evaluations, the UT Elementary School, and coordination of University-wide K-12 activities.
The School of Undergraduate Studies was developed to enhance the education for all undergraduates through core curriculum, advising, learning communities, signature courses, interdisciplinary programs, and research.
Other instructional initiatives and programs include course transformation and innovation and visiting lecturers. Students have access to specialized centers for arts & entertainment technology; clinical legal, pharmacy and nursing experiences; fine arts productions; and the UTeach program.
The University of Texas at Austin
U. T. System Office of the Controller 19

Academic Infrastructure (Libraries, Instructional Technology) 30,303,886
Student Programs and Services 3,700,051
Research Excellence
Research Competitiveness 14,432,426
Outreach Excellence
3,418,666
Instructional technology services include providing access to computing, voice and data networks, internet, and email. Library services include access to comprehensive print and digital resources supporting all disciplines, and access to specialized collections within the Humanities Research Center, the Benson Latin American Collection and the Law Library.
These services encompass new student orientation, career services, welcoming and mentoring programs, student organizations, campus and community involvement, Greek life, services for students with disabilities, student governance, judicial services and volunteer and service learning, and study abroad programs.
Support is provided for the critical research infrastructure required for faculty to be competitive for federal, state, and private sector research grant funding, to meet the ever increasing regulatory and compliance requirements associated with this external funding, to provide specialized services for areas such as animal care and high performance computing, and to help support research centers and institutes targeting areas critical to the economic development of Texas and the nation.
Academic Program/Community Interface
These programs help define and characterize the role of a flagship institution within the larger community and include such units as: Texas Performing Arts, Blanton Museum, and Winedale Historical Center.
U. T. System Office of the Controller 20

Recruitment and Retention of Talent: 55,812,850 Faculty 3,093,301
K-12 Outreach and Undergraduate Students 16,018,433
Graduate Students 36,701,116
Institutional Accountability and Enhanced Connections to the Public 30,187,750
UT Austin is committed to continuing to advance as one of the world’s finest universities. Achieving this goal is directly connected to our ability to recruit and retain faculty of the highest caliber. UT Austin must compete for this top talent.
The intellectual and research accomplishments of the University depend critically on our ability to recruit and retain the very best graduate students from across the nation. These funds provide the scholarships, fellowships and infrastructure support necessary for UT Austin to compete with its peer institutions for these excellent students.
Institutional accountability programs and offices are dedicated to providing support services for excellence in teaching, research, and public service. Development efforts expand private support by presenting evidence of the University's distinctive character, valuable service, and efficient management. University Communications has leadership responsibility for the institution's interaction with the media and with the public at large. The Office of the Executive Vice President and Provost serves as the chief academic officer of the university overseeing the academic programs on campus. The Office of Institutional Reporting, Research, and Information Systems provides information and analytical support to university decision makers and submits numerous reports to the Texas Higher Education Coordinating Board and the Department of Education. University Operations is dedicated to enhancing the development and delivery of most supporting services for on-campus clients, including public and environmental safety and the integrity of the physical infrastructure of the campus. Project Information Quest (IQ) uses business intelligence tools to provide critical information to University decision makers.
The University Outreach Centers provide an intensive college preparatory program for under-represented students beginning in eighth grade and continuing through high school. The purpose is to increase the number of educationally disadvantaged students who graduate from Texas high schools prepared to matriculate and be successful in Texas colleges and universities. Funds for various admission, scholarship and retention programs (Gateway, Multicultural Engagement Center, satellite admissions offices) help insure the quality and diversity of students.
U. T. System Office of the Controller 21

Dell Medical School 24,977,265
UT System 1,955,375
The Dell Medical School at The University of Texas at Austin will improve health in Travis County and throughout the country by training new physicians, providing treatment in a new teaching hospital and conducting research to expand knowledge of medicine and medical technology.
The UT System Office of Telecommunication Services and the Network Bandwidth were established by the UT System Board of Regents to provide other UT campuses with inter-institutional voice, video, and computer communications in support of their missions of instruction and research. These services are managed by UT Austin, and therefore, appear in UT Austin's budget.
U. T. System Office of the Controller 22
UT Austin AUF Budget 297,620,000$ -
Details
Excellence in Mission
Instructional ExcellenceEnhanced Academic Programs 104,581,241
Colleges and Schools 48,913,666 Academic Departments and Centers 55,667,575
Instructional Program Services 3,732,136 Texas Language Center 94,490 Natural Sciences Dean's Office Communication Group 656,388 Education Communication Group 618,353 Fine Arts Office of Computing Technologies 205,713 Project 2021 - Educational Innovation 1,760,854 Undergraduate Studies - Assessment 171,525 UT Elementary School 121,245 Student Success Initiatives 103,568
Instructional Initiatives and Programs 24,518,354 Visiting Lecturers and Academic development 105,000 Provost Initiatives and Innovations 22,078,622 Bilingual Education 82,949 Fine Arts Projects 98,378 Center for Arts & Entertainment Technologies 122,175 Nursing Children's Wellness Center 92,092 Nursing Learning Center 10,000 Clinical Legal Education 125,083 UTeach E Outreach 182,019 UTeach Master Teacher Institute 288,740 Undergraduate Programs 90,233 Signature Courses 1,236,371 Core Curriculum Development 6,692
Academic Infrastructure 30,303,886 Instructional Technology 6,747,408 Libraries 23,556,478
Student Programs and Services 3,700,051 2,725,732
781,853 74,183 24,362 93,921
Deaf Interpreter ServicesMathematics LabInternational OfficeStudy Abroad
Dean of Students
U. T. System Office of the Controller 23

Research Excellence 14,432,426 Research Competitiveness
Research grant infrastructure, compliance and supportVP For Research - Research Support And Compliance Office 917,169 Institutional Capital Projects 818,684 Research Grants 55,100 Animal Resources Center 578,997 Texas Advanced Computing Center 3,333,023 College of Liberal Arts - Research 322,425 Statistics & Scientific Computation Program 421,608
Research InitiativesOrganized Research Units 5,868,516 University Of Texas Press 1,008,363 Undergraduate Research 6,237 Center For Studies In Texas History 374,351 Research Instruments Laboratory 100,635 Integrative Biology - Biodiversity Collections 352,410Clements Center for National Security 274,908
Outreach Excellence 3,418,666 Academic Program/Community Interface
Texas Performing Arts 1,658,719 Jack S. Blanton Museum of Art 1,634,024 Winedale Historical Center 125,923
Recruitment and Retention of Talent: 55,812,850 Initiatives to ensure quality and diversity
Faculty 3,093,301 Faculty Development Program 2,236,833 Faculty Recruitment 856,468
Undergraduate Students 16,018,433 Admission 2,104,443 Registrar 1,712,911 Freshman Admissions Center 1,359,759 University Outreach Centers 416,860 Multicultural Engagement Center 85,627 Tuition and Fees Scholarship 69,129 Student Gateway Program 155,222 U T Learning Center - Student Retention - Tutorial Services 3,905 Student Services 1,179,043 Former Student Records 465,398 Satellite Admissions Office 2,212,848 Student Financial Services 3,062,928 Center for Strategic Advising 42,201 Hardship Waivers 3,113,159 Institutional Tuition Rebates 35,000
U. T. System Office of the Controller 24

Graduate Students 36,701,116 Dean of Graduate Studies 1,947,979 Tuition Benefits - Teaching Asst/Asst Instructor 22,760,327 Graduate Fellowships and Scholarships 9,189,575 Graduate Research Fellowships and Scholarships 200,000 Graduate and International Admissions 357,892 School Of Law Scholarships 1,214,429 Law Admissions Outreach 362,109 L B J School Of Public Affairs Fellowships and Scholarship 225,000 Natural Sciences Dean's Excellence Graduate Awards 180,000 Natural Sciences Graduate Education 263,805
Institutional Accountability and Enhanced Connections to the Public 30,187,750 84,635
6,686,105 Institutional Accreditation And Effectiveness 459,074
1,968,193 1,211,689
135,276 3,368,234
336,505 643,566 503,386
1,211,671 ADA Accommodations 98,930
245,813 332,800 368,067
1,110,461 533,041
Natural Sciences Business Services 36,000 10,854,304
Dell Medical School 24,977,265
UT System 1,955,375 1,221,348
204,802 529,225
TOTAL 297,620,000$
Division of Diversity and Community Engagement
University CommunicationsEqual Employment Opportunity
VP University Operations Communications DepartmentIQ Project
Telecomm Services Office - UT System SupportTelecomm Infrastructure - Network Bandwidth
Institutional Memberships
Office of President - Staff OmbudsOffice of the Executive Vice President And Provost
Institutional Reporting, Research, and Information SystemsVice President for University OperationsCampus Security and Safety
General Faculty Office
Information Technology Assessments - UT Austin Support
Liberal Arts Public AffairsLiberal Arts Business AffairsLiberal Arts Centralized Business Office
Development - support for scholarships, facilities, research, academic programs, faculty endowments, etc.
U. T. System Office of the Controller 25

The University of Texas at Brownsville Operating Budget Highlights
For the Year Ending August 31, 2017 The transfer of assets, facilities, operations, programs, and liabilities of The University of Texas at Brownsville is subject to the need to maintain a minimal administrative structure for the sole purpose of facilitating the continued partnership with Texas Southmost College (TSC), until that institution achieves accreditation independent of U. T. Brownsville. The budget for FY 2017 is prepared under the assumption that TSC will achieve accreditation independent of U. T. Brownsville and that complete dissolution of the partnership and U. T. Brownsville will occur prior to the start of FY 2017.
Background Information Senate Bill 24 of the 83rd Texas Legislature created a new university in south Texas and granted to The University of Texas System Board of Regents the duty to provide for the organization, administration, location, and name of the University. In addition to creating the new University, which the Board of Regents named The University of Texas Rio Grande Valley, Senate Bill 24 gave to the Board all the powers and duties provided by law in relation to U. T. Brownsville and The University of Texas‐Pan American and acknowledged that the assets, facilities, operations, programs, and liabilities would be transferred to U. T. Rio Grande Valley in anticipation of the abolition of those two universities. Consistent with the Board of Regents’ general authority and with its specific authority in relation to U. T. Rio Grande Valley, Senate Bill 24 directed the Board to choose a date of abolition of the two existing universities that the Board determines is appropriate to achieve maximum operating efficiency of The University of Texas System. As a result, The University of Texas‐Pan American was previously dissolved. Senate Bill 24 also required that the partnership agreement between U. T. Brownsville and TSC be continued at least until September 1, 2015, to the extent necessary to ensure accreditation of the respective entities. TSC has not achieved accreditation independent of U. T. Brownsville. Accordingly, even though the statutory obligation of the University to remain in partnership with the College District expired September 1, 2015, the U. T. System has continued in partnership with TSC. For accreditation purposes, U. T. Brownsville and TSC are a single institution; as a result, for TSC students to have classes offered by an accredited institution and to receive federal financial aid, the College has continued to operate under the accreditation of The University of Texas at Brownsville/Texas Southmost College (as the institution is recognized by the accrediting agency). For this purpose, even as the assets, facilities, programs, liabilities, and other operations of U. T. Brownsville were transferred to U. T. Rio Grande Valley, the accrediting agency requires a facility and minimal administrative structure to remain for U. T. Brownsville, including a full‐time chief executive officer.
U. T. System Office of the Controller 26

The University of Texas at BrownsvilleOperating Budget
Fiscal Year Ending August 31, 2017
BudgetFY 2016 FY 2017 Increases (Decreases)
FY 2016 Adjusted Operating From 2016 to 2017 Projected Budget Budget Amount Percent
Operating Revenues: Tuition and Fees $ ‐ ‐ ‐ ‐ ‐ Federal Sponsored Programs ‐ ‐ ‐ ‐ ‐ State Sponsored Programs ‐ ‐ ‐ ‐ ‐ Local and Private Sponsored Programs ‐ ‐ ‐ ‐ ‐ Net Sales and Services of Educational Activities ‐ ‐ ‐ ‐ ‐ Net Sales and Services of Hospital and Clinics ‐ ‐ ‐ ‐ ‐ Net Professional Fees ‐ ‐ ‐ ‐ ‐ Net Auxiliary Enterprises ‐ ‐ ‐ ‐ ‐ Other Operating Revenues ‐ ‐ ‐ ‐ ‐ Total Operating Revenues ‐ ‐ ‐ ‐ ‐
Operating Expenses: Instruction ‐ ‐ ‐ ‐ ‐ Academic Support ‐ ‐ ‐ ‐ ‐ Research ‐ ‐ ‐ ‐ ‐ Public Service ‐ ‐ ‐ ‐ ‐ Hospitals and Clinics ‐ ‐ ‐ ‐ ‐ Institutional Support ‐ ‐ ‐ ‐ ‐ Student Services ‐ ‐ ‐ ‐ ‐ Operations and Maintenance of Plant ‐ ‐ ‐ ‐ ‐ Scholarships and Fellowships ‐ ‐ ‐ ‐ ‐ Auxiliary Enterprises ‐ ‐ ‐ ‐ ‐ Depreciation and Amortization 591,425 591,425 ‐ (591,425) ‐100.0%Total Operating Expenses 591,425 591,425 ‐ (591,425) ‐100.0%Operating Surplus/Deficit (591,425) (591,425) ‐ 591,425 ‐100.0%
Budgeted Nonoperating Revenues (Expenses): State Appropriations ‐ ‐ ‐ ‐ ‐ Federal Sponsored Programs (Nonoperating) ‐ ‐ ‐ ‐ ‐ State Sponsored Programs (Nonoperating) ‐ ‐ ‐ ‐ ‐ Gifts in Support of Operations ‐ ‐ ‐ ‐ ‐ Net Investment Income ‐ ‐ ‐ ‐ ‐ Other Non‐Operating Revenue ‐ ‐ ‐ ‐ ‐ Other Non‐Operating (Expenses) ‐ ‐ ‐ ‐ ‐ Net Non‐Operating Revenue/(Expenses) ‐ ‐ ‐ ‐ ‐
Transfers and Other: AUF Transfers Received for Operations ‐ ‐ ‐ ‐ ‐ AUF Transfers (Made) for Operations ‐ ‐ ‐ ‐ ‐ Transfers for Debt Service ‐ Interest ‐ ‐ ‐ ‐ ‐ Total Transfers and Other ‐ ‐ ‐ ‐ ‐
Budget Margin (Deficit) (591,425) (591,425) ‐ 591,425 ‐100.0%
Reconciliation to Change in Net Assets: Net Non‐Profit Health Corp Activity ‐ ‐ ‐ ‐ ‐ Net Inc./(Dec.) in Fair Value of Investments ‐ ‐ ‐ ‐ ‐ Interest Expense on Capital Asset Financings ‐ ‐ ‐ ‐ ‐ Capital Approp., Gifts and Sponsored Programs ‐ ‐ ‐ ‐ ‐ Additions to Permanent Endowments ‐ ‐ ‐ ‐ ‐ Transfers for Debt Service ‐ Principal ‐ ‐ ‐ ‐ ‐ Reverse Transfers for Debt Service (System Only) ‐ ‐ ‐ ‐ ‐ Transfers and Other ‐ ‐ ‐ ‐ ‐ SRECNA Change in Net Assets $ (591,425) (591,425) ‐ 591,425 ‐100.0%
Total Revenues and AUF Transfers $ ‐ ‐ ‐ ‐ ‐ Total Expenses (Including Transfers for Interest) (591,425) (591,425) ‐ 591,425 ‐100.0%Budget Margin (Deficit) $ (591,425) (591,425) ‐ 591,425
Reconciliation to Use of Prior Year Balances Depreciation 591,425 ‐ Capital Outlay ‐ ‐ Transfers for Debt Service ‐ Principal ‐ ‐ Budgeted Transfers ‐ ‐ Net Additions to (Uses of) Prior Year Balances ‐ ‐
Note: Operating Budget Highlights with a glossary of terms are included on Page 1.
U. T. System Office of the Controller 27

The University of Texas at Dallas Operating Budget Highlights
For the Year Ending August 31, 2017
Introduction ‐ Major Goals Addressed by FY 2017 Budget The University of Texas at Dallas continues to refine budget transparency and align budget decisions closely with the University’s focused strategic plan. Expansion of student enrollment, improvement in undergraduate student access and success, and continued expansion of research activities remain high priorities. The FY 2017 budget reflects investments in new faculty, student success programs, support for research, and facilities operations. Key elements of U. T. Dallas's strategic plan are continued growth in student enrollment, faculty, and research activities. The FY 2017 budget reflects a $3.1 million reallocation from administrative units to academic units to support enrollment growth and excellence in academic programs. U. T. Dallas is anticipating another record year of enrollment. Last fall, enrollment stood at 24,554 (up 6.3 percent from the previous year), and this fall an enrollment of approximately 26,318 students, or a 7.2 percent increase, was budgeted. The budget provides additional funding for growth and expansion including new faculty, additional instructional support, and increased debt payments for new or upgraded facilities. U. T. Dallas is committed to maintaining quality through managed growth and continuous improvement initiatives such as investments in faculty excellence, research emphasizing competitive faculty and awards, building capacity in Ph.D. programs, ensuring high quality and focusing on improving time to graduation, as well as improvements in efficiency and productivity through participation in shared services and technology improvements. The primary challenges for U. T. Dallas in maintaining quality during this period of rapid growth are centered in a need for additional instructional space, especially for the Science, Technology, Engineering, and Mathematics programs, and lagging formula funding.
Revenue Total projected revenue for FY 2017 is approximately $605.7 million, an increase of $19.5 million over FY 2016. Incremental operating revenue is due mainly to increases in tuition and fees ($35.2 million), consisting of rate increases of 2.9 percent in undergraduate tuition, 3.9 percent in resident graduate, and 4.5 percent in non‐resident graduate ($5.0 million), plus enrollment growth estimated at 7 percent ($30.2 million). As U. T. Dallas offers a guaranteed tuition program, only incoming students will experience the tuition increase. In the category of State Sponsored Programs, TEXAS Research Incentive Program (TRIP) funding for FY 2017 decreased by $24.6 million. The increase to auxiliary revenues ($5.7 million) is derived from an increase to parking, dining and housing charges. The increase in State Appropriations of $6.8 million is due to the approved Tuition Revenue Bond (TRB) funding for the new Engineering Building ($5.4 million) plus additional state paid benefits ($1.3 million).
Expenses Projected expenses for FY 2017, including Transfers for Interest, total approximately $619.7 million, an increase of $8.7 million over FY 2016. The FY 2017 budget includes the decrease in TRIP funding ($24.6 million), increased funding for new faculty hires ($5.0 million, increased academic support ($5.0 million), a merit program for faculty and staff ($4.3 million), increased benefits costs ($3.3 million), increase in depreciation ($8.0 million), increase in Research Assistant Tuition and Fee expense ($2.5 million), and increases related to growth in Auxiliary Enterprises ($6.0 million). Transfers for Debt Service ‐ Interest increased 19.4 percent related to debt for newly constructed buildings, including the TRB amount for the new Engineering building. Net Use of Prior Year Balances is projected at a positive $8.0 million, a net improvement of $13.7 million over FY 2016.
U. T. System Office of the Controller 28

The University of Texas at DallasOperating Budget
Fiscal Year Ending August 31, 2017
BudgetFY 2016 FY 2017 Increases (Decreases)
FY 2016 Adjusted Operating From 2016 to 2017 Projected Budget Budget Amount Percent
Operating Revenues: Tuition and Fees $ 282,006,339 264,904,749 300,123,577 35,218,828 13.3% Federal Sponsored Programs 34,571,090 39,127,589 35,542,791 (3,584,798) ‐9.2% State Sponsored Programs 9,955,780 12,174,129 11,905,070 (269,059) ‐2.2% Local and Private Sponsored Programs 13,367,964 11,739,652 12,792,896 1,053,244 9.0% Net Sales and Services of Educational Activities 18,627,537 13,684,332 12,104,194 (1,580,138) ‐11.5% Net Sales and Services of Hospital and Clinics ‐ ‐ ‐ ‐ ‐ Net Professional Fees ‐ ‐ ‐ ‐ ‐ Net Auxiliary Enterprises 28,535,767 34,923,795 40,641,239 5,717,444 16.4% Other Operating Revenues 4,968,397 2,588,943 3,179,891 590,948 22.8%Total Operating Revenues 392,032,874 379,143,189 416,289,658 37,146,469 9.8%
Operating Expenses: Instruction 175,462,300 165,712,577 177,772,001 12,059,424 7.3% Academic Support 64,645,361 65,137,588 73,393,647 8,256,059 12.7% Research 86,643,383 113,213,058 83,180,853 (30,032,205) ‐26.5% Public Service 10,729,485 8,410,530 7,757,098 (653,432) ‐7.8% Hospitals and Clinics ‐ ‐ ‐ ‐ ‐ Institutional Support 52,393,217 51,514,859 52,856,880 1,342,021 2.6% Student Services 16,620,393 16,917,200 18,588,417 1,671,217 9.9% Operations and Maintenance of Plant 34,447,746 30,391,215 29,738,385 (652,830) ‐2.1% Scholarships and Fellowships 28,865,020 32,675,655 30,866,380 (1,809,275) ‐5.5% Auxiliary Enterprises 38,254,394 41,892,741 47,928,869 6,036,128 14.4% Depreciation and Amortization 63,582,000 62,000,000 70,000,000 8,000,000 12.9%Total Operating Expenses 571,643,299 587,865,423 592,082,530 4,217,107 0.7%Operating Surplus/Deficit (179,610,425) (208,722,234) (175,792,872) 32,929,362 ‐15.8%
Budgeted Nonoperating Revenues (Expenses): State Appropriations 110,622,488 112,166,733 119,018,809 6,852,076 6.1% Federal Sponsored Programs (Nonoperating) 46,988,121 23,158,610 23,264,093 105,483 0.5% State Sponsored Programs (Nonoperating) 6,973,939 32,383,099 7,728,440 (24,654,659) ‐76.1% Gifts in Support of Operations 13,000,000 16,093,627 14,922,979 (1,170,648) ‐7.3% Net Investment Income 23,695,895 23,268,123 24,501,440 1,233,317 5.3%Other Non‐Operating Revenue ‐ ‐ ‐ ‐ ‐ Other Non‐Operating (Expenses) ‐ ‐ ‐ ‐ ‐ Net Non‐Operating Revenue/(Expenses) 201,280,443 207,070,192 189,435,761 (17,634,431) ‐8.5%
Transfers and Other: AUF Transfers Received for Operations ‐ ‐ ‐ ‐ ‐ AUF Transfers (Made) for Operations ‐ ‐ ‐ ‐ ‐ Transfers for Debt Service ‐ Interest (21,051,067) (23,131,272) (27,628,652) (4,497,380) 19.4%Total Transfers and Other (21,051,067) (23,131,272) (27,628,652) (4,497,380) 19.4%
Budget Margin (Deficit) 618,951 (24,783,314) (13,985,763) 10,797,551 ‐43.6%
Reconciliation to Change in Net Assets: Net Non‐Profit Health Corp Activity ‐ ‐ ‐ ‐ ‐ Net Inc./(Dec.) in Fair Value of Investments ‐ ‐ ‐ ‐ ‐ Interest Expense on Capital Asset Financings ‐ ‐ ‐ ‐ ‐ Capital Approp., Gifts and Sponsored Programs 8,438,700 2,000,000 8,438,700 6,438,700 321.9% Additions to Permanent Endowments 4,405,500 5,200,000 4,405,500 (794,500) ‐15.3% Transfers for Debt Service ‐ Principal (26,613,902) (26,613,902) (31,753,000) (5,139,098) 19.3% Reverse Transfers for Debt Service (System Only) ‐ ‐ ‐ ‐ ‐ Transfers and Other 104,329,290 35,000,000 94,500,000 59,500,000 170.0%SRECNA Change in Net Assets $ 91,178,539 (9,197,216) 61,605,437 70,802,653 ‐769.8%
Total Revenues and AUF Transfers $ 593,313,317 586,213,381 605,725,419 19,512,038 3.3%Total Expenses (Including Transfers for Interest) (592,694,366) (610,996,695) (619,711,182) (8,714,487) 1.4%Budget Margin (Deficit) $ 618,951 (24,783,314) (13,985,763) 10,797,551
Reconciliation to Use of Prior Year Balances Depreciation 62,000,000 70,000,000 Capital Outlay (16,337,500) (16,272,270) Transfers for Debt Service ‐ Principal (26,613,902) (31,753,000) Budgeted Transfers ‐ ‐ Net Additions to (Uses of) Prior Year Balances (5,734,716) 7,988,967
Note: Operating Budget Highlights with a glossary of terms are included on Page 1.
U. T. System Office of the Controller 29

The University of Texas at El Paso Operating Budget Highlights
For the Year Ending August 31, 2017
Introduction ‐ Major Goals Addressed by FY 2017 Budget The University of Texas at El Paso will continue to build on past successes in fulfilling its highly acclaimed access and excellence mission and achieving the vision of becoming the first national research university with a 21st century demographic during the upcoming fiscal year. The University’s success in providing largely first‐generation, low‐income and Hispanic student population access to competitive educational opportunities continues to gain highly positive national recognition. The FY 2017 budget emphasizes the following four strategic priorities: student success, recruitment and retention of diverse faculty, regional economic development, and technology enhancements. U. T. El Paso will advance student achievement and social mobility by implementing a highly integrated student success initiative that will expand student engagement in innovative applied learning activities, experiences, and groundbreaking professional development programs. The student success initiative prioritizes activities in two specific areas: use of integrative and applied learning curriculum development to advance student success and redesigned faculty and staff development programs focused on key student success priorities of engagement, professional preparation, leadership, retention, and degree completion. The University will continue to leverage resources to increase capacity for research and scholarship including the expansion and development of research facilities, such as the new inter‐disciplinary research building, to foster the recruitment of highly competitive and diverse faculty. U. T. El Paso has gained national recognition for success in expanding student access to higher education by recruiting highly talented nationally competitive faculty who are not only excellent teachers but also highly productive researchers. Assisted by the grants development team in the Office of Research and Sponsored Projects, faculty have greatly expanded the University’s externally funded research portfolio. However, in order to sustain the access and excellence mission, the University must continue to allocate resources to ensure the recruitment and retention of diverse research productive faculty.
Revenue Total projected revenues for FY 2017 are expected to increase by 4.0 percent to $434.4 million. Tuition and fee revenue is increasing to $117.4 million as a result of an approved tuition increase and modest enrollment growth of 1.5 percent. State appropriations reflect additional funding for the inter‐disciplinary research facility tuition revenue bonds and an increase in funding for staff group insurance premiums.
Expenses Total expenses, including transfers for interest, are expected to increase to $445.4 million. The budget allocates funds for a 2.5 percent merit pool for faculty and staff. Additional investments include student success initiatives such as student advising, financial literacy, and on campus employment. U. T. El Paso also anticipates increased activity related to the expansion of its online degree programs.
U. T. System Office of the Controller 30

The University of Texas at El PasoOperating Budget
Fiscal Year Ending August 31, 2017
BudgetFY 2016 FY 2017 Increases (Decreases)
FY 2016 Adjusted Operating From 2016 to 2017 Projected Budget Budget Amount Percent
Operating Revenues: Tuition and Fees $ 111,054,831 109,012,635 117,435,595 8,422,960 7.7% Federal Sponsored Programs 55,153,252 52,212,172 53,057,822 845,650 1.6% State Sponsored Programs 22,888,515 25,520,377 24,180,951 (1,339,426) ‐5.2% Local and Private Sponsored Programs 6,504,294 7,205,684 7,329,984 124,300 1.7% Net Sales and Services of Educational Activities 7,753,214 4,292,264 8,787,613 4,495,349 104.7% Net Sales and Services of Hospital and Clinics ‐ ‐ ‐ ‐ ‐ Net Professional Fees ‐ ‐ ‐ ‐ ‐ Net Auxiliary Enterprises 33,973,534 35,470,719 35,202,031 (268,688) ‐0.8% Other Operating Revenues 60,000 60,000 60,000 ‐ 0.0%Total Operating Revenues 237,387,640 233,773,851 246,053,996 12,280,145 5.3%
Operating Expenses: Instruction 109,741,937 113,690,922 122,383,011 8,692,089 7.6% Academic Support 22,497,219 24,224,914 24,179,037 (45,877) ‐0.2% Research 70,168,721 66,118,412 65,165,394 (953,018) ‐1.4% Public Service 10,041,444 10,820,041 11,095,896 275,855 2.5% Hospitals and Clinics ‐ ‐ ‐ ‐ ‐ Institutional Support 29,637,128 33,188,908 33,074,535 (114,373) ‐0.3% Student Services 18,784,887 18,269,984 19,934,881 1,664,897 9.1% Operations and Maintenance of Plant 28,935,155 27,732,929 30,450,926 2,717,997 9.8% Scholarships and Fellowships 58,039,848 49,923,395 47,235,963 (2,687,432) ‐5.4% Auxiliary Enterprises 45,854,932 45,128,871 45,765,531 636,660 1.4% Depreciation and Amortization 31,973,201 33,728,573 33,750,223 21,650 0.1%Total Operating Expenses 425,674,472 422,826,949 433,035,397 10,208,448 2.4%Operating Surplus/Deficit (188,286,832) (189,053,098) (186,981,401) 2,071,697 ‐1.1%
Budgeted Nonoperating Revenues (Expenses): State Appropriations 108,000,878 107,634,278 114,631,887 6,997,609 6.5% Federal Sponsored Programs (Nonoperating) 54,665,421 53,000,000 53,398,988 398,988 0.8% State Sponsored Programs (Nonoperating) ‐ ‐ ‐ ‐ ‐ Gifts in Support of Operations 6,379,063 9,689,326 7,370,000 (2,319,326) ‐23.9% Net Investment Income 13,543,098 13,387,500 12,930,000 (457,500) ‐3.4%Other Non‐Operating Revenue ‐ ‐ ‐ ‐ ‐ Other Non‐Operating (Expenses) ‐ ‐ ‐ ‐ ‐ Net Non‐Operating Revenue/(Expenses) 182,588,460 183,711,104 188,330,875 4,619,771 2.5%
Transfers and Other: AUF Transfers Received for Operations ‐ ‐ ‐ ‐ ‐ AUF Transfers (Made) for Operations ‐ ‐ ‐ ‐ ‐ Transfers for Debt Service ‐ Interest (9,368,307) (9,368,307) (12,344,639) (2,976,332) 31.8%Total Transfers and Other (9,368,307) (9,368,307) (12,344,639) (2,976,332) 31.8%
Budget Margin (Deficit) (15,066,679) (14,710,301) (10,995,165) 3,715,136 ‐25.3%
Reconciliation to Change in Net Assets: Net Non‐Profit Health Corp Activity ‐ ‐ ‐ ‐ ‐ Net Inc./(Dec.) in Fair Value of Investments 833,861 ‐ ‐ ‐ ‐ Interest Expense on Capital Asset Financings ‐ ‐ ‐ ‐ ‐ Capital Approp., Gifts and Sponsored Programs 476,100 321,814 476,100 154,286 47.9% Additions to Permanent Endowments 4,283,074 2,131,663 3,175,815 1,044,152 49.0% Transfers for Debt Service ‐ Principal (13,944,588) (13,944,588) (16,122,000) (2,177,412) 15.6% Reverse Transfers for Debt Service (System Only) ‐ ‐ ‐ ‐ ‐ Transfers and Other 31,338,647 20,517,440 21,303,515 786,075 3.8%SRECNA Change in Net Assets $ 7,920,415 (5,683,972) (2,161,735) 3,522,237 ‐62.0%
Total Revenues and AUF Transfers $ 419,976,100 417,484,955 434,384,871 16,899,916 4.0%Total Expenses (Including Transfers for Interest) (435,042,779) (432,195,256) (445,380,036) (13,184,780) 3.1%Budget Margin (Deficit) $ (15,066,679) (14,710,301) (10,995,165) 3,715,136
Reconciliation to Use of Prior Year Balances Depreciation 33,728,573 33,750,223 Capital Outlay (3,980,396) (4,484,624) Transfers for Debt Service ‐ Principal (13,944,588) (16,122,000) Budgeted Transfers 470,727 158,414 Net Additions to (Uses of) Prior Year Balances 1,564,015 2,306,848
Note: Operating Budget Highlights with a glossary of terms are included on Page 1.
U. T. System Office of the Controller 31

The University of Texas of the Permian Basin Operating Budget Highlights
For the Year Ending August 31, 2017
Introduction ‐ Major Goals Addressed by FY 2017 Budget The University of Texas of the Permian Basin seeks to provide greater access to higher education for Texans, particularly west Texans; to award degrees of value; to conduct meaningful research; to improve the overall quality of life of the West Texas region; and, to do so while being a good steward of resources entrusted to it. To advance efforts to obtain these goals, U. T. Permian Basin has six institutional initiatives: 1) to grow enrollment, 2) to increase student retention and graduation rates, 3) to enhance the quality of its academic programs, 4) to further develop its research initiatives, 5) to maintain and create new community partnerships, and 6) to strengthen public trust and accountability. Greater access for all Texans is being provided through expanded online and technology assisted degree programs. Efforts to offer degrees of value are being enhanced by expanding degree program options in science, technology, engineering, nursing, and mathematics and other critical need areas. Petroleum and Mechanical Engineering Program enrollments continue to grow at well above anticipated levels; and the University’s Bachelor of Science Nursing Program graduated its first class in May 2015. Near term goals to grow enrollment and enhance retention and graduation rates are being pursued through strategies aimed at increasing the visibility and profile of the University throughout Texas and by expanding on‐line degree program offerings. U. T. Permian Basin’s dual credit and remote Early College High School initiatives continue to build growing interest and participation across the State. U. T. Permian Basin’s initiative with Academic Partnerships (AP) is another key strategic element as the ten completely online degree programs (three masters and seven baccalaureate) first introduced in FY 2013 are generating enrollment increases that continue to exceed expectations. The compressed format – six eight‐week “terms” per year – and AP’s program of continued contact with registered students have both proven to encourage continued academic progress. Completion of construction of a new residence hall and dining facility in August 2016 and further investment in the expansion of various Student Success Initiatives for retention like the Education Advisory Board (EAB) in the Student Success Center are also keys to achieving goals for student retention and improving the sense of community for resident students.
Revenue Resident undergraduate and graduate tuition and fee rates were increased in FY 2017. U. T. Permian Basin sought and was granted a decrease in nonresident tuition in an effort to attract students from outside the State and to align with other institutions of higher education operating within the catchment area. This change has shown some small increases in enrollment and U. T. Permian Basin will make further efforts to promote the lower rates in FY 2017. Total projected revenue for FY 2016 is approximately $81.0 million, an increase of $9.8 million over FY 2016. This increase in the overall revenue budget over the prior year reflects additional Tuition Revenue Bond and benefit appropriations, as well as increases in Tuition and Fees and Auxiliary Enterprises. Additionally, projected increased tuition and fee revenue is also derived from continued enrollment growth. The increase to auxiliary revenues is derived from projected housing charges and the opening of a new 300 bed residence hall and dining facility.
Expenses A staff and faculty salary merit increase pool of 2.0 percent based on FY 2016 salaries has been created, and budgeted increases will be implemented on September 1, 2016. Salary increases will be awarded only on the basis of merit. Merit increases are a critical component of plans designed to retain existing employees. Fringe benefits budgets reflect increases for proportional increases in salaries. Projected expenses for FY 2017, including Transfers for Interest, total approximately $81.7 million, an increase of $8.9 million over FY 2016. The FY 2017 budget includes a merit program for faculty and staff ($481,000), additional funding for the Police Department ($200,000), funding for the EAB Initiative ($200,000), increased instructional costs ($1.3 million), increases related to growth in Auxiliary Enterprises ($1.9 million) and an increase in institutionally funded scholarships ($2.7 million). Transfers for Debt Service ‐ Interest increased 33.1 percent related to debt for newly constructed buildings including debt for the new Residence Hall and Dining Facility that will come online in Fall 2016 and the start of construction of the new $52 million Engineering Building on the Midland campus funded by Tuition Revenue Bonds.
U. T. System Office of the Controller 32

The University of Texas of the Permian BasinOperating Budget
Fiscal Year Ending August 31, 2017
BudgetFY 2016 FY 2017 Increases (Decreases)
FY 2016 Adjusted Operating From 2016 to 2017 Projected Budget Budget Amount Percent
Operating Revenues: Tuition and Fees $ 16,802,243 17,037,612 18,853,179 1,815,567 10.7% Federal Sponsored Programs 4,760,383 1,695,809 1,167,483 (528,326) ‐31.2% State Sponsored Programs 1,549,399 1,383,383 1,635,775 252,392 18.2% Local and Private Sponsored Programs 1,194,645 52,220 378,219 325,999 624.3% Net Sales and Services of Educational Activities 2,098,937 2,409,681 2,696,745 287,064 11.9% Net Sales and Services of Hospital and Clinics ‐ ‐ ‐ ‐ ‐ Net Professional Fees ‐ ‐ ‐ ‐ ‐ Net Auxiliary Enterprises 4,773,109 7,078,758 9,586,337 2,507,579 35.4% Other Operating Revenues 350,597 200,000 232,500 32,500 16.3%Total Operating Revenues 31,529,313 29,857,463 34,550,238 4,692,775 15.7%
Operating Expenses: Instruction 21,170,137 20,187,064 21,564,090 1,377,026 6.8% Academic Support 4,293,294 5,534,232 5,553,619 19,387 0.4% Research 781,420 1,581,260 1,756,367 175,107 11.1% Public Service 6,135,126 1,051,117 1,084,452 33,335 3.2% Hospitals and Clinics ‐ ‐ ‐ ‐ ‐ Institutional Support 6,584,050 5,679,470 5,863,539 184,069 3.2% Student Services 2,501,740 3,295,118 3,503,314 208,196 6.3% Operations and Maintenance of Plant 5,065,004 6,718,144 6,839,344 121,200 1.8% Scholarships and Fellowships 5,783,123 3,189,303 5,943,939 2,754,636 86.4% Auxiliary Enterprises 6,839,081 5,047,852 6,965,602 1,917,750 38.0% Depreciation and Amortization 13,965,000 13,965,000 13,965,000 ‐ 0.0%Total Operating Expenses 73,117,975 66,248,560 73,039,266 6,790,706 10.3%Operating Surplus/Deficit (41,588,662) (36,391,097) (38,489,028) (2,097,931) 5.8%
Budgeted Nonoperating Revenues (Expenses): State Appropriations 29,162,789 34,042,585 38,302,200 4,259,615 12.5% Federal Sponsored Programs (Nonoperating) 5,536,476 3,760,338 4,198,752 438,414 11.7% State Sponsored Programs (Nonoperating) 1,278,766 ‐ ‐ ‐ ‐ Gifts in Support of Operations 2,622,198 1,500,000 1,500,000 ‐ 0.0% Net Investment Income 2,093,610 2,080,000 2,441,251 361,251 17.4%Other Non‐Operating Revenue ‐ ‐ ‐ ‐ ‐ Other Non‐Operating (Expenses) ‐ ‐ ‐ ‐ ‐ Net Non‐Operating Revenue/(Expenses) 40,693,839 41,382,923 46,442,203 5,059,280 12.2%
Transfers and Other: AUF Transfers Received for Operations ‐ ‐ ‐ ‐ ‐ AUF Transfers (Made) for Operations ‐ ‐ ‐ ‐ ‐ Transfers for Debt Service ‐ Interest (5,712,637) (6,487,098) (8,633,137) (2,146,039) 33.1%Total Transfers and Other (5,712,637) (6,487,098) (8,633,137) (2,146,039) 33.1%
Budget Margin (Deficit) (6,607,460) (1,495,272) (679,962) 815,310 ‐54.5%
Reconciliation to Change in Net Assets: Net Non‐Profit Health Corp Activity ‐ ‐ ‐ ‐ ‐ Net Inc./(Dec.) in Fair Value of Investments ‐ ‐ ‐ ‐ ‐ Interest Expense on Capital Asset Financings ‐ ‐ ‐ ‐ ‐ Capital Approp., Gifts and Sponsored Programs ‐ 800,000 800,000 ‐ 0.0% Additions to Permanent Endowments ‐ 1,000,000 1,000,000 ‐ 0.0% Transfers for Debt Service ‐ Principal (9,333,000) (7,171,755) (9,333,000) (2,161,245) 30.1% Reverse Transfers for Debt Service (System Only) ‐ ‐ ‐ ‐ ‐ Transfers and Other ‐ 28,000,000 34,000,000 6,000,000 21.4%SRECNA Change in Net Assets $ (15,940,460) 21,132,973 25,787,038 4,654,065 22.0%
Total Revenues and AUF Transfers $ 72,223,152 71,240,386 80,992,441 9,752,055 13.7%Total Expenses (Including Transfers for Interest) (78,830,612) (72,735,658) (81,672,403) (8,936,745) 12.3%Budget Margin (Deficit) $ (6,607,460) (1,495,272) (679,962) 815,310
Reconciliation to Use of Prior Year Balances Depreciation 13,965,000 13,965,000 Capital Outlay (600,000) (805,000) Transfers for Debt Service ‐ Principal (7,171,755) (9,333,000) Budgeted Transfers ‐ ‐ Net Additions to (Uses of) Prior Year Balances 4,697,973 3,147,038
Note: Operating Budget Highlights with a glossary of terms are included on Page 1.
U. T. System Office of the Controller 33

The University of Texas Rio Grande Valley Operating Budget Highlights
For the Year Ending August 31, 2017
Introduction ‐ Major Goals Addressed by FY 2017 Budget In its second year, The University of Texas Rio Grande Valley seeks to positively impact Texas and the nation through the success of students and research, healthcare, and commercialization activities. Total enrollment for the Fall 2016 semester is projected at 29,139 students, an increase of 1.9% over Fall 2015. Not included are the 164 high school students receiving education through the University’s math and science academy with locations at the main campuses in Brownsville and Edinburg. Also not included are students participating in high school concurrent enrollment. U. T. Rio Grande Valley continues the tradition of affordability with a Fall 2015 average total academic cost of $3,438; 33 public universities in Texas had higher rates. The Institution seeks to reduce time‐to‐degree and save taxpayer dollars with its affordable rates and predictable mandated fixed price tuition plans. In addition, a 12‐hour cap beyond which tuition and mandatory fees are not charged provides an “instant” rebate for students enrolled in more than 12 hours. Finally, participation in the University’s high school concurrent enrollment program allows students the opportunity to earn up to 60 hours of college credit at no charge, saving a minimum of $14,896 on the cost of a degree. Importantly, the coming year will see the enrollment of the University’s inaugural class of medical students.
Revenue Appropriated general revenue of $158 million includes $27.9 million for benefits and $45 million in special line item funding; the latter includes $30.7 million for the School of Medicine. Also included is $1.5 million to be transferred to U. T. Health Science Center – San Antonio for operations still in transition. Total operating revenue is projected at $246 million with tuition and fees accounting for $124.5 million after $82.3 million in discounts. Tuition and fees are budgeted at $124.5 million and include a 2 percent increase in academic cost which applies only to newly entering students. Also included is $0.5 million in state support to partially address the projected $5.9 million associated with state mandated Hazlewood Act Exemptions. Sponsored program revenues are projected at $150.2 million, a $5.4 million drop mostly attributed to decreases on estimated revenues for the Pell and TEXAS Grant programs.
Expenses Total expenses are projected at $508 million inclusive of noncash adjustments such as depreciation. Marginal expenses above original FY 2016 levels include $1.5 million for faculty positions in engineering and environmental sciences, faculty promotions, and faculty gender equity adjustments. Also included is funding for additional campus security positions. Funds have been set aside to distribute among various priorities including faculty and staff merit, pay plan adjustments, and additional faculty positions. Scholarships, before discounts, are projected at $145.5 million that includes $37.9 million in TEXAS Grants and $72 million in federal Pell Grants. Also included is $5.9 million in Hazlewood Act Exemptions. Employee benefits include a 5.2% percent increase in group insurance premiums. The $6.8 million increase in depreciation is primarily due to completion of a new medical school building as well as the transfer over of Regional Academic Health Center assets. Finally, two Tuition Revenue Bond projects contribute to the increase in debt service.
U. T. System Office of the Controller 34

The University of Texas Rio Grande ValleyOperating Budget
Fiscal Year Ending August 31, 2017
BudgetFY 2016 FY 2017 Increases (Decreases)
FY 2016 Adjusted Operating From 2016 to 2017 Projected Budget Budget Amount Percent
Operating Revenues: Tuition and Fees $ 108,920,082 113,796,318 124,480,355 10,684,037 9.4% Federal Sponsored Programs 39,109,922 31,726,961 32,920,806 1,193,845 3.8% State Sponsored Programs 44,438,544 44,338,605 41,080,291 (3,258,314) ‐7.3% Local and Private Sponsored Programs 5,576,875 4,588,715 4,205,724 (382,991) ‐8.3% Net Sales and Services of Educational Activities 5,970,800 6,204,277 6,019,837 (184,440) ‐3.0% Net Sales and Services of Hospital and Clinics ‐ ‐ ‐ ‐ ‐ Net Professional Fees 1,838,717 4,743,153 6,192,161 1,449,008 30.5% Net Auxiliary Enterprises 10,568,364 9,896,496 9,824,357 (72,139) ‐0.7% Other Operating Revenues 7,443,207 14,251,395 21,529,261 7,277,866 51.1%Total Operating Revenues 223,866,511 229,545,920 246,252,792 16,706,872 7.3%
Operating Expenses: Instruction 134,795,075 141,843,998 149,672,823 7,828,825 5.5% Academic Support 39,800,622 43,611,411 51,965,026 8,353,615 19.2% Research 22,929,313 24,756,595 24,372,025 (384,570) ‐1.6% Public Service 14,564,341 15,089,522 13,381,016 (1,708,506) ‐11.3% Hospitals and Clinics 8,104,510 14,463,908 20,938,150 6,474,242 44.8% Institutional Support 46,270,892 41,897,841 45,191,848 3,294,007 7.9% Student Services 27,895,072 29,356,914 31,198,275 1,841,361 6.3% Operations and Maintenance of Plant 32,254,583 30,301,491 31,636,691 1,335,200 4.4% Scholarships and Fellowships 57,950,106 69,216,687 63,243,394 (5,973,293) ‐8.6% Auxiliary Enterprises 25,189,457 26,817,390 26,882,245 64,855 0.2% Depreciation and Amortization 36,475,282 33,792,293 40,559,419 6,767,126 20.0%Total Operating Expenses 446,229,253 471,148,050 499,040,912 27,892,862 5.9%Operating Surplus/Deficit (222,362,742) (241,602,130) (252,788,120) (11,185,990) 4.6%
Budgeted Nonoperating Revenues (Expenses): State Appropriations 150,469,092 149,991,312 158,059,363 8,068,051 5.4% Federal Sponsored Programs (Nonoperating) 70,338,887 75,000,000 72,000,000 (3,000,000) ‐4.0% State Sponsored Programs (Nonoperating) ‐ ‐ ‐ ‐ ‐ Gifts in Support of Operations 5,632,903 8,228,431 6,974,721 (1,253,710) ‐15.2% Net Investment Income 6,560,711 5,898,624 5,548,132 (350,492) ‐5.9%Other Non‐Operating Revenue ‐ ‐ ‐ ‐ ‐ Other Non‐Operating (Expenses) ‐ ‐ ‐ ‐ ‐ Net Non‐Operating Revenue/(Expenses) 233,001,593 239,118,367 242,582,216 3,463,849 1.4%
Transfers and Other: AUF Transfers Received for Operations ‐ ‐ ‐ ‐ ‐ AUF Transfers (Made) for Operations ‐ ‐ ‐ ‐ ‐ Transfers for Debt Service ‐ Interest (6,317,844) (6,687,565) (9,128,262) (2,440,697) 36.5%Total Transfers and Other (6,317,844) (6,687,565) (9,128,262) (2,440,697) 36.5%
Budget Margin (Deficit) 4,321,007 (9,171,328) (19,334,166) (10,162,838) 110.8%
Reconciliation to Change in Net Assets: Net Non‐Profit Health Corp Activity ‐ ‐ ‐ ‐ ‐ Net Inc./(Dec.) in Fair Value of Investments (4,763,125) ‐ ‐ ‐ ‐ Interest Expense on Capital Asset Financings ‐ ‐ ‐ ‐ ‐ Capital Approp., Gifts and Sponsored Programs 100,000 100,000 180,000 80,000 80.0% Additions to Permanent Endowments 1,880,000 480,000 2,452,860 1,972,860 411.0% Transfers for Debt Service ‐ Principal (12,727,000) (12,961,318) (15,731,000) (2,769,682) 21.4% Reverse Transfers for Debt Service (System Only) ‐ ‐ ‐ ‐ ‐ Transfers and Other 55,360,339 86,482,944 96,245,364 9,762,420 11.3%SRECNA Change in Net Assets $ 44,171,221 64,930,298 63,813,058 (1,117,240) ‐1.7%
Total Revenues and AUF Transfers $ 456,868,104 468,664,287 488,835,008 20,170,721 4.3%Total Expenses (Including Transfers for Interest) (452,547,097) (477,835,615) (508,169,174) (30,333,559) 6.3%Budget Margin (Deficit) $ 4,321,007 (9,171,328) (19,334,166) (10,162,838)
Reconciliation to Use of Prior Year Balances Depreciation 33,792,293 40,559,419 Capital Outlay (8,650,000) (5,610,000) Transfers for Debt Service ‐ Principal (12,961,318) (15,731,000) Budgeted Transfers 1,340,363 676,168 Net Additions to (Uses of) Prior Year Balances 4,350,010 560,421
Note: Operating Budget Highlights with a glossary of terms are included on Page 1.
U. T. System Office of the Controller 35

The University of Texas at San Antonio Operating Budget Highlights
For the Year Ending August 31, 2017
Introduction ‐ Major Goals Addressed by FY 2017 Budget The proposed budget of The University of Texas at San Antonio addresses the highest priorities in UTSA 2020 Blueprint, the institution’s strategic plan. The University’s primary goal is to transform students into successful scholars, global citizens, and leaders. The primary investments include support for student success and timely completion, merit and need‐based scholarships, and the GoldStar Initiative. The GoldStar Initiative provides for the recruitment of top‐tier researchers to enhance U. T. San Antonio’s research capabilities and lower the student‐to‐faculty ratio which is currently 26:1. The six‐year graduation rate improved almost 19 percent since the FY 2000 to a rate of 53.4 percent and U. T. San Antonio anticipates continued improvement. U. T. San Antonio’s second goal is to create scholarly work and research that impacts society. Recruitment of top‐tier faculty will allow for a high caliber of research activities that will lead to innovation and development of new technology in areas such as cyber security, open cloud, and big data to name a few. The expansion of research will attract additional graduate students and increase masters and doctoral degree programs. The budget provides for support of Ph.D. programs and a Graduate Tuition Assistantship Program. GoldStar provides for cluster hiring in the area of Brain Health and in Cyber Security which also advances the Chancellor’s Quantum Leaps initiative. U.T. San Antonio plans on continuing and expanding strategic research partnerships. In addition, the Institution is committed to undergraduate student internships, postdoctoral salaries, and small equipment grants. The Institution’s third goal is to enrich the quality of life and economic prosperity of the communities served. The University invested resources for UTSA Ready, a bridge program working in partnership with over fifteen school districts in the region and connecting high schools with the University in an effort to prepare and orient them for success in college. U. T. San Antonio’s fourth goal is to deliver world‐class support and infrastructure commensurate with a Tier One Institution. U. T. San Antonio will invest in information technology research infrastructure and look for ways to reallocate additional resources for research infrastructure. The University will continue to budget resources to build, maintain, and renovate its buildings and infrastructure. The University is honored to receive the Association of Physical Plant Administrators Award for Excellence; this award is designed to recognize outstanding achievements in facilities management. The Award for Excellence evaluates: leadership, strategic and operational planning, customer focus, information and analysis, development and management of human resources, process management, and performance results. The final goal is to achieve recognition and esteem as a premier research university. The budget includes resources to continue the Institution’s marketing and branding efforts. The above initiatives will also provide support for the previously implemented Graduation Rate Improvement Plan (GRIP). Reserves will also be used to provide additional support for these initiatives along with reallocation of existing resources.
Revenue The FY 2017 budget includes a 3.56 percent rate increase in total academic cost for undergraduate residents. Student tuition and fee revenue increased $6.2 million while the tuition discount and allowances also increased $10.8 million for the net decrease of $4.6 million. The Hazlewood veterans’ exemptions present significant lost tuition and fee revenue and are expected to total approximately $12.0 million in FY 2017. The budget includes an estimated $1.7 million of related state allocations to partially offset the loss of tuition revenue. Sponsored program revenue reflects an increase of $6.6 million largely due to an increase in TEXAS Grant of $6.2 million. The Intensive English Program contributed to increases in net sales and services revenue. Auxiliary revenue is anticipated to increase by $0.7 million due to relatively flat enrollment, limited rate increases for housing and increases in parking and athletic revenues. State appropriations reflect an increase in group insurance premium of $1.0 million, an additional proportionality related to benefits of $0.7 million, and Tuition Revenue Bonds of $5.4 million to support the new Science and Engineering Building. U. T. San Antonio anticipates a decline of $4.3 million in Texas Research Incentive Program revenue.
Expenses U. T. San Antonio will allocate approximately $3.6 million to the GoldStar Initiative to recruit top‐tier researchers, provide administrative staff to support our researchers, and to provide start‐up funds. In addition, Academic Affairs will continue to evaluate vacant faculty lines and reallocate them with priority to be given based on strategic initiatives and teaching demands. The University anticipates an increase in research expenses of $2.4 million. The budget does not include a permanent merit program but will be considered after the fall enrollment is evaluated. Almost $0.6 million will be used to support faculty tenure and promotions and to provide equity to improve recruitment and retention of staff. Benefit and other related costs will see an increase of almost $2.7 million. U. T. San Antonio allocated resources to support the GRIP of $0.7 million which includes strategies designed to improve student services, retention, time to graduate, and degrees awarded. The budget includes resources of $2.5 million for Ph.D. programs, Ph.D. assistantships, and other course related cost which will support goal three. U. T. San Antonio will allocate an additional $7.3 million towards needs‐based and merit financial aid to increase recruitment, retention, and graduation rates. This is offset by an increase in exemptions of $10.8 million. Auxiliary operation cost will increase by $1.4 million predominantly related to housing, athletics, and parking. Net sales and services expenses will increase by $2.5 million due to increases in many programs.
U. T. System Office of the Controller 36

The University of Texas at San AntonioOperating Budget
Fiscal Year Ending August 31, 2017
BudgetFY 2016 FY 2017 Increases (Decreases)
FY 2016 Adjusted Operating From 2016 to 2017 Projected Budget Budget Amount Percent
Operating Revenues: Tuition and Fees $ 186,098,708 189,212,202 184,535,307 (4,676,895) ‐2.5% Federal Sponsored Programs 41,723,835 41,160,653 41,579,725 419,072 1.0% State Sponsored Programs 19,737,188 19,260,673 25,875,879 6,615,206 34.3% Local and Private Sponsored Programs 2,166,530 5,505,031 5,790,544 285,513 5.2% Net Sales and Services of Educational Activities 15,082,473 9,591,595 12,429,748 2,838,153 29.6% Net Sales and Services of Hospital and Clinics ‐ ‐ ‐ ‐ ‐ Net Professional Fees ‐ ‐ ‐ ‐ ‐ Net Auxiliary Enterprises 46,318,730 41,294,212 41,981,485 687,273 1.7% Other Operating Revenues 4,168,854 1,405,287 1,218,229 (187,058) ‐13.3%Total Operating Revenues 315,296,318 307,429,653 313,410,917 5,981,264 1.9%
Operating Expenses: Instruction 136,029,298 141,953,759 150,868,075 8,914,316 6.3% Academic Support 56,892,007 54,877,031 57,663,990 2,786,959 5.1% Research 51,245,161 40,952,487 43,380,585 2,428,098 5.9% Public Service 21,341,660 16,339,939 16,773,465 433,526 2.7% Hospitals and Clinics ‐ ‐ ‐ ‐ ‐ Institutional Support 39,196,802 43,172,824 41,920,424 (1,252,400) ‐2.9% Student Services 27,249,511 25,109,005 26,676,783 1,567,778 6.2% Operations and Maintenance of Plant 43,670,916 40,911,881 41,671,948 760,067 1.9% Scholarships and Fellowships 35,393,425 32,818,380 30,547,729 (2,270,651) ‐6.9% Auxiliary Enterprises 50,977,163 56,371,510 57,774,563 1,403,053 2.5% Depreciation and Amortization 47,734,691 48,100,000 48,591,000 491,000 1.0%Total Operating Expenses 509,730,634 500,606,816 515,868,562 15,261,746 3.0%Operating Surplus/Deficit (194,434,316) (193,177,163) (202,457,645) (9,280,482) 4.8%
Budgeted Nonoperating Revenues (Expenses): State Appropriations 124,172,673 122,784,250 129,974,088 7,189,838 5.9% Federal Sponsored Programs (Nonoperating) 45,999,951 46,000,000 46,000,000 ‐ 0.0% State Sponsored Programs (Nonoperating) 5,249,994 5,249,945 981,000 (4,268,945) ‐81.3% Gifts in Support of Operations 5,000,000 8,000,000 8,000,000 ‐ 0.0% Net Investment Income 16,347,145 10,633,043 11,131,163 498,120 4.7%Other Non‐Operating Revenue ‐ ‐ ‐ ‐ ‐ Other Non‐Operating (Expenses) ‐ ‐ ‐ ‐ ‐ Net Non‐Operating Revenue/(Expenses) 196,769,763 192,667,238 196,086,251 3,419,013 1.8%
Transfers and Other: AUF Transfers Received for Operations ‐ ‐ ‐ ‐ ‐ AUF Transfers (Made) for Operations ‐ ‐ ‐ ‐ ‐ Transfers for Debt Service ‐ Interest (15,130,243) (14,932,068) (17,447,235) (2,515,167) 16.8%Total Transfers and Other (15,130,243) (14,932,068) (17,447,235) (2,515,167) 16.8%
Budget Margin (Deficit) (12,794,796) (15,441,993) (23,818,629) (8,376,636) 54.2%
Reconciliation to Change in Net Assets: Net Non‐Profit Health Corp Activity ‐ ‐ ‐ ‐ ‐ Net Inc./(Dec.) in Fair Value of Investments ‐ ‐ ‐ ‐ ‐ Interest Expense on Capital Asset Financings ‐ ‐ ‐ ‐ ‐ Capital Approp., Gifts and Sponsored Programs 1,000,000 1,000,000 1,000,000 ‐ 0.0% Additions to Permanent Endowments 4,000,000 4,000,000 4,000,000 ‐ 0.0% Transfers for Debt Service ‐ Principal (18,688,000) (18,597,913) (21,948,350) (3,350,437) 18.0% Reverse Transfers for Debt Service (System Only) ‐ ‐ ‐ ‐ ‐ Transfers and Other 7,000,000 7,000,000 10,000,000 3,000,000 42.9%SRECNA Change in Net Assets $ (19,482,796) (22,039,906) (30,766,979) (8,727,073) 39.6%
Total Revenues and AUF Transfers $ 512,066,081 500,096,891 509,497,168 9,400,277 1.9%Total Expenses (Including Transfers for Interest) (524,860,877) (515,538,884) (533,315,797) (17,776,913) 3.4%Budget Margin (Deficit) $ (12,794,796) (15,441,993) (23,818,629) (8,376,636)
Reconciliation to Use of Prior Year Balances Depreciation 48,100,000 48,591,000 Capital Outlay (6,500,000) (7,743,018) Transfers for Debt Service ‐ Principal (18,597,913) (21,948,350) Budgeted Transfers (5,249,946) (981,003) Net Additions to (Uses of) Prior Year Balances 2,310,148 (5,900,000)
Note: Operating Budget Highlights with a glossary of terms are included on Page 1.
U. T. System Office of the Controller 37

The University of Texas at Tyler Operating Budget Highlights
For the Year Ending August 31, 2017
Introduction ‐ Major Goals Addressed by FY 2017 Budget The FY 2017 budget further promotes The University of Texas at Tyler’s vision to be nationally recognized as a destination university for high‐ability, flagship‐capable students that is focused on excellence in undergraduate and professional graduate education. U. T. Tyler has a culture of excellence and innovation that also provides a nurturing environment to prepare students to be future problem solvers and leaders. U. T. Tyler remains one of the best values in higher education in Texas. With tuition and fees below the mean for the U. T. System, the State, and regional competitors, U. T. Tyler takes great pride in the tradition of offering quality academic programs, expert faculty, active student life programs and well‐rounded service opportunities. Approximately 60 percent of new funding is earmarked to support academic programs including the start‐up of new academic programs. Faculty and student services administrative staff positions were added to keep up with enrollment growth. A 2 percent merit pool is budgeted for qualifying faculty and staff. Budgeting was adjusted to optimize the use of all fee account revenues for the applicable fee purpose. The campus fiscal year base budget operating deficit was reduced to approximately $3.2 million. The School of Pharmacy start‐up costs are included in the FY 2017 budget and accounts for nearly one‐half of the fiscal year budget deficit.
Revenue U. T. Tyler’s FY 2017 budget reflects approximately $9.3 million in tuition and fee revenue growth over FY 2016. Approximately one‐half of the revenue growth can be attributed to anticipated enrollment growth and the other one‐half can be attributed to a 3% rate increase and a 6.5% prior year unbudgeted growth. No mandatory student fees are being increased. The new Pharmacy program is entering into its second year of existence and will add 102 students which approximates $3.2 million in additional revenue. Sponsored grant revenue will be down significantly due to the completion of large grants without replacement grants. State appropriations and transfers are up significantly due to tuition revenue bond debt service funding for the new Science, Technology, Engineering, and Mathematics Business Building.
Expenses Significant expenditure budget changes are included in this budget. Previous fiscal year institutional support budget items meant to be one‐time expenses were removed from the base budget. Items not previously budgeted are now reflected in the base budget. Significant new spending on academic and administrative initiatives are also reflected in the FY 2017 budget. Total budgeted operating expenditures increased by approximately $9.7 million. Depreciation expense will increase significantly due to the addition of the Pharmacy Building and Music Building during FY 2016 and the Alumni House in FY 2017. Scholarships expenses are expected to increase significantly due to an increase in Pell Grants for additional students and for employee scholarships.
U. T. System Office of the Controller 38

The University of Texas at TylerOperating Budget
Fiscal Year Ending August 31, 2017
BudgetFY 2016 FY 2017 Increases (Decreases)
FY 2016 Adjusted Operating From 2016 to 2017 Projected Budget Budget Amount Percent
Operating Revenues: Tuition and Fees $ 41,007,820 39,355,642 48,613,724 9,258,082 23.5% Federal Sponsored Programs 4,711,559 6,095,000 3,771,375 (2,323,625) ‐38.1% State Sponsored Programs 8,088,530 7,884,818 8,218,379 333,561 4.2% Local and Private Sponsored Programs 114,093 281,000 127,428 (153,572) ‐54.7% Net Sales and Services of Educational Activities 5,615,687 5,097,867 8,554,146 3,456,279 67.8% Net Sales and Services of Hospital and Clinics ‐ ‐ ‐ ‐ ‐ Net Professional Fees ‐ ‐ ‐ ‐ ‐ Net Auxiliary Enterprises 8,220,624 7,380,360 8,012,401 632,041 8.6% Other Operating Revenues 386,181 ‐ 209,905 209,905 ‐ Total Operating Revenues 68,144,494 66,094,687 77,507,358 11,412,671 17.3%
Operating Expenses: Instruction 53,353,801 51,628,220 55,502,879 3,874,659 7.5% Academic Support 17,244,880 17,106,061 18,759,622 1,653,561 9.7% Research 1,803,445 845,826 832,750 (13,076) ‐1.5% Public Service 234,839 1,243,825 224,146 (1,019,679) ‐82.0% Hospitals and Clinics ‐ ‐ ‐ ‐ ‐ Institutional Support 14,386,932 16,261,574 15,422,184 (839,390) ‐5.2% Student Services 11,317,563 10,969,695 12,358,389 1,388,694 12.7% Operations and Maintenance of Plant 10,872,663 7,451,938 7,988,810 536,872 7.2% Scholarships and Fellowships 3,020,220 3,539,666 4,468,718 929,052 26.2% Auxiliary Enterprises 9,467,618 9,543,159 10,236,648 693,489 7.3% Depreciation and Amortization 14,499,807 12,500,000 15,000,000 2,500,000 20.0%Total Operating Expenses 136,201,768 131,089,964 140,794,146 9,704,182 7.4%Operating Surplus/Deficit (68,057,274) (64,995,277) (63,286,788) 1,708,489 ‐2.6%
Budgeted Nonoperating Revenues (Expenses): State Appropriations 39,970,430 39,846,032 44,887,075 5,041,043 12.7% Federal Sponsored Programs (Nonoperating) 9,803,182 9,500,000 9,700,000 200,000 2.1% State Sponsored Programs (Nonoperating) ‐ ‐ ‐ ‐ ‐ Gifts in Support of Operations 2,500,000 1,491,667 1,898,396 406,729 27.3% Net Investment Income 5,004,532 5,215,784 5,115,472 (100,312) ‐1.9%Other Non‐Operating Revenue ‐ ‐ ‐ ‐ ‐ Other Non‐Operating (Expenses) ‐ ‐ ‐ ‐ ‐ Net Non‐Operating Revenue/(Expenses) 57,278,144 56,053,483 61,600,943 5,547,460 9.9%
Transfers and Other: AUF Transfers Received for Operations ‐ ‐ ‐ ‐ ‐ AUF Transfers (Made) for Operations ‐ ‐ ‐ ‐ ‐ Transfers for Debt Service ‐ Interest (3,978,869) (4,983,594) (6,077,716) (1,094,122) 22.0%Total Transfers and Other (3,978,869) (4,983,594) (6,077,716) (1,094,122) 22.0%
Budget Margin (Deficit) (14,757,999) (13,925,388) (7,763,561) 6,161,827 ‐44.2%
Reconciliation to Change in Net Assets: Net Non‐Profit Health Corp Activity ‐ ‐ ‐ ‐ ‐ Net Inc./(Dec.) in Fair Value of Investments ‐ ‐ ‐ ‐ ‐ Interest Expense on Capital Asset Financings ‐ ‐ ‐ ‐ ‐ Capital Approp., Gifts and Sponsored Programs 250,000 550,000 250,000 (300,000) ‐54.5% Additions to Permanent Endowments 750,000 500,000 650,000 150,000 30.0% Transfers for Debt Service ‐ Principal (5,452,000) (5,634,419) (9,152,000) (3,517,581) 62.4% Reverse Transfers for Debt Service (System Only) ‐ ‐ ‐ ‐ ‐ Transfers and Other 2,057,061 2,500,000 5,050,000 2,550,000 102.0%SRECNA Change in Net Assets $ (17,152,938) (16,009,807) (10,965,561) 5,044,246 ‐31.5%
Total Revenues and AUF Transfers $ 125,422,638 122,148,170 139,108,301 16,960,131 13.9%Total Expenses (Including Transfers for Interest) (140,180,637) (136,073,558) (146,871,862) (10,798,304) 7.9%Budget Margin (Deficit) $ (14,757,999) (13,925,388) (7,763,561) 6,161,827
Reconciliation to Use of Prior Year Balances Depreciation 12,500,000 15,000,000 Capital Outlay (1,150,000) (1,264,775) Transfers for Debt Service ‐ Principal (5,634,419) (9,152,000) Budgeted Transfers (133,710) (150,888) Net Additions to (Uses of) Prior Year Balances (8,343,517) (3,331,224)
Note: Operating Budget Highlights with a glossary of terms are included on Page 1.
U. T. System Office of the Controller 39

The University of Texas Southwestern Medical Center Operating Budget Highlights
For the Year Ending August 31, 2017
Introduction ‐ Major Goals Addressed by FY 2017 Budget The University of Texas Southwestern Medical Center is among the leading biomedical research institutions in the country and continues to develop as one of the world’s great academic medical centers. The goals and objectives of U. T. Southwestern Medical Center are to: improve health care in the community, Texas, our nation, and the world through innovation and education; educate the next generation of leaders in patient care, biomedical science, and disease prevention; conduct high‐impact, internationally recognized research; deliver patient care that brings scientific advances from the bench to the bedside– focusing on quality, safety, and service. The University is guided by the overarching principles of excellence and distinction in all that it does to fulfill the missions. Its strategic positioning and programmatic investments are designed to sustain this trajectory into the future.
In the educational realm, to ensure medical students receive the best possible preparation for the changing landscape in health care delivery, the Medical School, after several years of planning, launched the new Foundation for Excellence Curriculum when the Class of 2019 began Medical School last summer. The new curriculum creates a more integrated approach to the basic science and clinical components of medical education, emphasizes team‐based learning, and provides closer contact with faculty for ongoing mentoring as well as in‐depth scholarly experience.
The University continues to gain recognition through national and international awards to faculty for their innovative, path‐breaking research and for the quality and safety of the patient care provided in its William P. Clements Jr. and Zale Lipshy University Hospitals. The new Peter O’Donnell Jr. Brain Institute encompasses both research and clinical programs. This includes the Texas Institute for Brain Injury and Repair, which has been especially active in promoting awareness about concussions, and the Center for Alzheimer’s and Neurodegenerative Diseases, which is significantly advancing the understanding of the causes of Alzheimer’s disease. Leadership renewal also continues through the appointments, following national searches, of new department chairs who are prominent leaders in their fields. The most recent appointments are Dane Wukich, M.D. as Chair of the Department of Orthopedic Surgery and Duojia “DJ” Pan, Ph.D. as Chair of the Department of Physiology.
In addition to its outstanding education and research programs, U. T. Southwestern Medical Center is committed to being a leader in patient care. In October 2015, the U. T. Southwestern Medical Center and Texas Health Resources (THR) announced the formation of Southwestern Health Resources (SWHR). This innovative new organization is being developed as a clinically integrated network of physicians and hospitals associated with both U. T. Southwestern Medical Center and THR. SWHR encompasses 27 hospitals and 300 clinics throughout north Texas, as well as more than 2,600 physicians across a 16‐county area. It leverages the University’s and THR’s complementary strengths, and will provide increased access to primary and specialty care for the people of north Texas. It will also create expanded opportunities for education and training, and for clinical, translational, and health services research.
In addition, U. T. Southwestern Medical Center has expanded its ability to provide services to patients in Fort Worth. The Harold C. Simmons Comprehensive Cancer Center has opened a satellite clinic in the Moncrief Cancer Institute building, and as the result of an extraordinary gift from W. A. “Tex” Moncrief, Jr., the U. T. Southwestern Monty and Tex Moncrief Medical Center at Fort Worth is now under construction. The first building, a multi‐disciplinary outpatient facility, is expected to be completed in 2017.
On the University campus in Dallas, construction of a new radiation therapy building is in process and scheduled to open in 2017. In addition, the first phase of the multi‐year master plan for the West Campus site is well along, and the first building, which will house faculty offices, outpatient clinics, and a state‐of‐the‐art Simulation Center for education and training, is scheduled to open in 2018. Patient volume at Clements and Zale Lipshy University Hospitals has so exceeded expectations that U. T. Southwestern Medical Center has begun to plan the addition of a third bed tower for Clements to accommodate patient needs.
Revenue The revenue budget of $2.785 billion for FY 2017 represents a 5.7 percent increase, or $150 million, over the FY 2016 projection with the majority of the increase driven by Hospital and Clinical operations. Roughly two‐thirds of the increase is hospital revenue resulting from higher than anticipated patient volumes. The majority of the remaining increase is the result of the continued expansion of the clinical practice activity. The budget for Sponsored Programs continues to reflect a modest increase due to increased number of grant applications and a higher success rate of awards.
Expenses The expenditure budget for FY 2017 is $2.706 billion. Budgeted expenses include a 3.0 percent merit pool for faculty, administrative and professional, and classified employees. The growth in expenses related to University Hospitals, Clinical Operations, and Instruction are in proportion to growth in revenue for the upcoming fiscal year. The budgeted expenses also include sufficient funds to cover projected debt service to finance clinical expansion activities and major information resources system projects for patient services and administrative systems.
U. T. System Office of the Controller 40

The University of Texas Southwestern Medical CenterOperating Budget
Fiscal Year Ending August 31, 2017
BudgetFY 2016 FY 2017 Increases (Decreases)
FY 2016 Adjusted Operating From 2016 to 2017 Projected Budget Budget Amount Percent
Operating Revenues: Tuition and Fees $ 24,720,865 24,232,027 24,973,929 741,902 3.1% Federal Sponsored Programs 200,146,691 204,692,798 199,518,112 (5,174,686) ‐2.5% State Sponsored Programs 48,565,010 38,568,079 47,379,299 8,811,220 22.8% Local and Private Sponsored Programs 329,303,515 320,279,153 333,283,062 13,003,909 4.1% Net Sales and Services of Educational Activities 13,362,937 16,369,454 15,040,115 (1,329,339) ‐8.1% Net Sales and Services of Hospital and Clinics 1,053,513,814 987,015,250 1,160,707,534 173,692,284 17.6% Net Professional Fees 554,980,326 554,337,719 565,449,473 11,111,754 2.0% Net Auxiliary Enterprises 27,675,792 25,955,236 26,908,470 953,234 3.7% Other Operating Revenues 103,065,551 65,149,220 57,086,228 (8,062,992) ‐12.4%Total Operating Revenues 2,355,334,501 2,236,598,936 2,430,346,222 193,747,286 8.7%
Operating Expenses: Instruction 814,181,667 835,111,149 891,175,242 56,064,093 6.7% Academic Support 19,711,026 20,416,558 20,528,459 111,901 0.5% Research 364,507,770 372,818,896 387,326,229 14,507,333 3.9% Public Service 32,624,825 33,416,313 34,045,851 629,538 1.9% Hospitals and Clinics 1,006,297,000 930,086,518 1,013,936,224 83,849,706 9.0% Institutional Support 54,805,519 58,801,105 61,236,440 2,435,335 4.1% Student Services 3,539,724 3,644,144 3,931,357 287,213 7.9% Operations and Maintenance of Plant 57,142,671 67,351,291 60,805,078 (6,546,213) ‐9.7% Scholarships and Fellowships 1,419,003 1,458,173 1,472,617 14,444 1.0% Auxiliary Enterprises 27,050,665 27,724,560 27,772,687 48,127 0.2% Depreciation and Amortization 158,489,019 156,000,000 165,000,000 9,000,000 5.8%Total Operating Expenses 2,539,768,889 2,506,828,707 2,667,230,184 160,401,477 6.4%Operating Surplus/Deficit (184,434,388) (270,229,771) (236,883,962) 33,345,809 ‐12.3%
Budgeted Nonoperating Revenues (Expenses): State Appropriations 185,749,801 185,749,800 193,531,893 7,782,093 4.2% Federal Sponsored Programs (Nonoperating) ‐ ‐ ‐ ‐ ‐ State Sponsored Programs (Nonoperating) ‐ ‐ ‐ ‐ ‐ Gifts in Support of Operations 83,700,340 50,000,000 60,000,000 10,000,000 20.0% Net Investment Income 101,952,360 105,000,000 101,172,813 (3,827,187) ‐3.6%Other Non‐Operating Revenue ‐ ‐ ‐ ‐ ‐ Other Non‐Operating (Expenses) ‐ ‐ ‐ ‐ ‐ Net Non‐Operating Revenue/(Expenses) 371,402,501 340,749,800 354,704,706 13,954,906 4.1%
Transfers and Other: AUF Transfers Received for Operations ‐ ‐ ‐ ‐ ‐ AUF Transfers (Made) for Operations ‐ ‐ ‐ ‐ ‐ Transfers for Debt Service ‐ Interest (29,635,888) (32,494,033) (38,926,720) (6,432,687) 19.8%Total Transfers and Other (29,635,888) (32,494,033) (38,926,720) (6,432,687) 19.8%
Budget Margin (Deficit) 157,332,225 38,025,996 78,894,024 40,868,028 107.5%
Reconciliation to Change in Net Assets: Net Non‐Profit Health Corp Activity ‐ ‐ ‐ ‐ ‐ Net Inc./(Dec.) in Fair Value of Investments ‐ ‐ ‐ ‐ ‐ Interest Expense on Capital Asset Financings ‐ ‐ ‐ ‐ ‐ Capital Approp., Gifts and Sponsored Programs ‐ 6,000,000 6,000,000 ‐ 0.0% Additions to Permanent Endowments ‐ 10,000,000 10,000,000 ‐ 0.0% Transfers for Debt Service ‐ Principal (57,959,000) (58,884,966) (63,827,000) (4,942,034) 8.4% Reverse Transfers for Debt Service (System Only) ‐ ‐ ‐ ‐ ‐ Transfers and Other ‐ 71,000,000 212,690,000 141,690,000 199.6%SRECNA Change in Net Assets $ 99,373,225 66,141,030 243,757,024 177,615,994 268.5%
Total Revenues and AUF Transfers $ 2,726,737,002 2,577,348,736 2,785,050,928 207,702,192 8.1%Total Expenses (Including Transfers for Interest) (2,569,404,777) (2,539,322,740) (2,706,156,904) (166,834,164) 6.6%Budget Margin (Deficit) $ 157,332,225 38,025,996 78,894,024 40,868,028
Reconciliation to Use of Prior Year Balances Depreciation 156,000,000 165,000,000 Capital Outlay (45,000,000) (45,000,000) Transfers for Debt Service ‐ Principal (58,884,966) (63,827,000) Budgeted Transfers ‐ ‐ Net Additions to (Uses of) Prior Year Balances 90,141,030 135,067,024
Note: Operating Budget Highlights with a glossary of terms are included on Page 1.
U. T. System Office of the Controller 41
The University of Texas Medical Branch at Galveston
Operating Budget Highlights For the Year Ending August 31, 2017
Introduction ‐ Major Goals Addressed by FY 2017 Budget The FY 2017 operating budget of The University of Texas Medical Branch at Galveston ensures continued resource allocation to support the University’s mission to improve health for the people of Texas and around the world. The University’s institutional vision, “The Road Ahead,” provides a road map for achieving this important mission and identifies four essential strategic priorities: People, Value, Strategic Management and Growth, and Resources. The FY 2017 operating plan supports the “My Road Ahead” initiative that enables employees to develop and grow in their current jobs and positions them for future job growth. Advancing recruitment and succession plans is a key priority as a significant number of current employees become retirement eligible in the next five years. Continued investment in training programs to promote leadership development will help in retaining talented people who will support the University’s mission, both now and in the future. Providing market‐based and incentive‐based compensation programs for faculty and staff promotes and rewards outstanding performance. U. T. Medical Branch ‐ Galveston defines “Value” as delivering high‐quality outcomes that improve education, research and health care delivery. A key value initiative is the Patient‐centered Resource Optimization Program (PROP) which will reduce clinical costs and improve operational performance. PROP initiatives include reducing practice variation, improving length of stay, reducing readmissions and improving care coordination across the inpatient and outpatient continuum of care. Other value initiatives include reducing infections and preventable complications, streamlining the physician referral process and implementing an Enterprise Data Warehouse to ensure that analytical tools are in place to measure success and identify other opportunities to create value. Strategic Management and Growth has been advanced by expanding the University’s geographic footprint, growing the League City Campus and partnering with other provider organizations to reach new patient populations. The League City Campus Hospital opened on June 4, 2016, with a complement of 20 medical/surgical beds, 11 labor/delivery/post‐partum suites, 10 operating rooms and 10 emergency department bays. This added capacity will allow the University to serve more patients in a geographic region with high population growth, as well as partner with The University of Texas M. D. Anderson Cancer Center to expand oncology care and accommodate newborn deliveries previously performed by faculty at other hospitals in the area. The University has also expanded Correctional Managed Care (CMC) activity during FY 2016 by entering into contracts with Management Training Corporation, El Paso County Jail, and Burnet County Jail to provide patient care for approximately 5,000 covered lives. Expanding primary care hours, increasing the number of urgent care locations and improving access to specialty care clinics are several other strategies being implemented to support growth. The University must maximize financial resources to invest in educating the health care team of the future, advancing life‐saving research with a global reach and expanding access to quality patient care. To that end, the University continues to advance enterprise business intelligence data and analytics capabilities, to optimize existing financial management and forecasting infrastructure and to focus on successfully implementing margin improvement initiatives for FY 2017 and future years. The University’s FY 2017 operating budget reflects overall growth in revenue and expenses driven by the initiatives noted above and contemplates a $7.2 million margin deficit, a $5.5 million improvement over FY 2016. This improvement trend will continue as revenue streams catch up with facility activation expenses, significant interest and depreciation expense related to opening the Jennie Sealy and League City Campus Hospitals, and also as infrastructure damage caused by Hurricane Ike is addressed to mitigate the impact of future weather emergencies.
Revenue Total budgeted revenue for FY 2017 reflects a $141.4 million (7.3 percent) increase from the FY 2016 budget and is related to additional clinical volume from opening the League City Campus Hospital, faculty recruitment, revenue cycle improvement initiatives and growth in CMC contract revenue. General revenue increased by $14.3 million (4.0 percent) due to appropriations for the Health Education Center Tuition Revenue Bond and for the Bio‐Containment Critical Care Unit, as well as increased general revenue for staff benefits.
Expenses Total budgeted expenses for FY 2017 reflect a $135.9 million (7.0 percent) increase from the FY 2016 budget. The growth is directly related to increased clinical volumes, growth in CMC contract expense and other inflationary drivers. Interest expense increased by $10.2 million (61.1 percent) and depreciation expense by $12.3 million (8.3 percent) related to opening the Jennie Sealy and League City Campus Hospitals.
U. T. System Office of the Controller 42

The University of Texas Medical Branch at GalvestonOperating Budget
Fiscal Year Ending August 31, 2017
BudgetFY 2016 FY 2017 Increases (Decreases)
FY 2016 Adjusted Operating From 2016 to 2017 Projected Budget Budget Amount Percent
Operating Revenues: Tuition and Fees $ 35,241,762 37,860,390 37,514,040 (346,350) ‐0.9% Federal Sponsored Programs 115,717,046 114,063,398 117,869,532 3,806,134 3.3% State Sponsored Programs 4,911,521 4,904,883 5,034,009 129,126 2.6% Local and Private Sponsored Programs 61,560,079 61,344,344 62,705,176 1,360,832 2.2% Net Sales and Services of Educational Activities 27,891,425 27,715,122 28,390,560 675,438 2.4% Net Sales and Services of Hospital and Clinics 1,020,961,961 1,027,387,827 1,133,139,556 105,751,729 10.3% Net Professional Fees 178,988,519 184,259,082 193,924,145 9,665,063 5.2% Net Auxiliary Enterprises 11,986,640 11,460,423 12,672,775 1,212,352 10.6% Other Operating Revenues 56,885,269 58,532,102 60,141,901 1,609,799 2.8%Total Operating Revenues 1,514,144,222 1,527,527,571 1,651,391,694 123,864,123 8.1%
Operating Expenses: Instruction 306,507,127 318,518,760 324,043,612 5,524,852 1.7% Academic Support 33,703,061 32,834,127 35,631,346 2,797,219 8.5% Research 100,260,754 102,865,563 105,997,068 3,131,505 3.0% Public Service 13,046,651 12,156,861 13,793,102 1,636,241 13.5% Hospitals and Clinics 1,201,525,012 1,168,888,908 1,270,269,012 101,380,104 8.7% Institutional Support 64,103,947 66,317,755 67,771,587 1,453,832 2.2% Student Services 7,159,440 7,543,245 7,569,060 25,815 0.3% Operations and Maintenance of Plant 49,850,742 55,773,693 52,702,900 (3,070,793) ‐5.5% Scholarships and Fellowships 8,440,075 9,439,215 8,922,965 (516,250) ‐5.5% Auxiliary Enterprises 10,450,226 9,968,254 11,048,415 1,080,161 10.8% Depreciation and Amortization 132,451,320 147,567,131 159,819,549 12,252,418 8.3%Total Operating Expenses 1,927,498,355 1,931,873,512 2,057,568,616 125,695,104 6.5%Operating Surplus/Deficit (413,354,133) (404,345,941) (406,176,922) (1,830,981) 0.5%
Budgeted Nonoperating Revenues (Expenses): State Appropriations 364,349,587 359,444,042 373,733,210 14,289,168 4.0% Federal Sponsored Programs (Nonoperating) 980,000 980,000 984,002 4,002 0.4% State Sponsored Programs (Nonoperating) ‐ ‐ ‐ ‐ ‐ Gifts in Support of Operations 8,957,967 8,614,438 7,574,377 (1,040,061) ‐12.1% Net Investment Income 41,559,749 39,268,244 43,536,549 4,268,305 10.9%Other Non‐Operating Revenue ‐ ‐ ‐ ‐ ‐ Other Non‐Operating (Expenses) ‐ ‐ ‐ ‐ ‐ Net Non‐Operating Revenue/(Expenses) 415,847,303 408,306,724 425,828,138 17,521,414 4.3%
Transfers and Other: AUF Transfers Received for Operations ‐ ‐ ‐ ‐ ‐ AUF Transfers (Made) for Operations ‐ ‐ ‐ ‐ ‐ Transfers for Debt Service ‐ Interest (14,655,598) (16,653,440) (26,825,555) (10,172,115) 61.1%Total Transfers and Other (14,655,598) (16,653,440) (26,825,555) (10,172,115) 61.1%
Budget Margin (Deficit) (12,162,428) (12,692,657) (7,174,339) 5,518,318 ‐43.5%
Reconciliation to Change in Net Assets: Net Non‐Profit Health Corp Activity ‐ ‐ ‐ ‐ ‐ Net Inc./(Dec.) in Fair Value of Investments (28,092,956) ‐ ‐ ‐ ‐ Interest Expense on Capital Asset Financings ‐ ‐ ‐ ‐ ‐ Capital Approp., Gifts and Sponsored Programs 74,809,641 150,389,171 140,774,803 (9,614,368) ‐6.4% Additions to Permanent Endowments 5,904,000 3,797,301 2,300,000 (1,497,301) ‐39.4% Transfers for Debt Service ‐ Principal (49,421,479) (46,096,814) (58,518,145) (12,421,331) 26.9% Reverse Transfers for Debt Service (System Only) ‐ ‐ ‐ ‐ ‐ Transfers and Other 150,271,493 40,000,000 77,333,333 37,333,333 93.3%SRECNA Change in Net Assets $ 141,308,271 135,397,001 154,715,652 19,318,651 14.3%
Total Revenues and AUF Transfers $ 1,929,991,525 1,935,834,295 2,077,219,832 141,385,537 7.3%Total Expenses (Including Transfers for Interest) (1,942,153,953) (1,948,526,952) (2,084,394,171) (135,867,219) 7.0%Budget Margin (Deficit) $ (12,162,428) (12,692,657) (7,174,339) 5,518,318
Reconciliation to Use of Prior Year Balances Depreciation 147,567,131 159,819,549 Capital Outlay (100,000,000) (71,000,000) Transfers for Debt Service ‐ Principal (46,096,814) (58,518,145) Budgeted Transfers ‐ ‐ Net Additions to (Uses of) Prior Year Balances (11,222,340) 23,127,065
Note: Operating Budget Highlights with a glossary of terms are included on Page 1.
U. T. System Office of the Controller 43

The University of Texas Health Science Center at Houston Operating Budget Highlights
For the Year Ending August 31, 2017
Introduction ‐ Major Goals Addressed by FY 2017 Budget The University of Texas Health Science Center at Houston continues its strategy of clinical expansion as a means to enrich research and academic programs in FY 2017, as but to a lesser degree than in prior years. With the help of its health system partners, Memorial Hermann Health Systems and Harris Health System, as well as through innovative projects developed for the Network Access Improvement Program (NAIP) and Delivery System Reform Incentive Payment (DSRIP) program, U. T. Health Science Center ‐ Houston will further its world‐class programs in neurosciences, orthopaedics, and heart and vascular, and increase the availability of care across the Greater Houston area. Clinical activities provided primarily by the McGovern Medical School’s very large faculty physician group practice through its Medical Services, Research, and Development Plan (MSRDP) will provide the support necessary to retain promising research faculty and staff, as well as support the critical recruitment packages required to attract new, productive investigators. U. T. Health Science Center ‐ Houston filled the last of its school leadership vacancies this year with the hiring of deans for both the McGovern Medical School and the School of Public Health. Both are highly‐respected within the research community and are focused on developing new areas of emphasis (e.g., Precision Medicine), as well as building upon existing programs and expertise. The FY 2017 budget also includes additional research and educational support, primarily within the new office of the Executive Vice President, Chief Academic Officer that will be focusing on collaborative opportunities across the institution’s schools and within The University of Texas System.
Revenue The FY 2017 budget projects an overall increase in operating and non‐operating revenue of $117.9 million or 8.5 percent. Operating revenue increases are primarily driven by sponsored program revenue which includes both MSRDP’s health system contracts ($26.5 million increase), additional NAIP projects revenue ($18.8 million increase), and restricted grants and contracts for research and public service most notably due to increases in awards from the Cancer Prevention and Research Institute of Texas ($12.0 million increase). Additional physician professional fee revenues of approximately $36.8 million above FY 2016’s budget can be attributed to clinic expansion primarily funded by NAIP and DSRIP programs, increased productivity, and an improved physician revenue cycle process driven by in‐depth analysis and process re‐engineering. In addition to these revenues, U. T. Health Science Center ‐ Houston is projecting an increase of $15.0 million over the prior year’s Additions to Permanent Endowment budget, building upon its fundraising success in attaining the recent $75.0 million John P. McGovern Foundation gift and continuing its Game Changers initiative designed to leverage $50.0 million of existing operating cash surplus into $100.0 million or more of endowment to support research and educational activities.
Expenses The U. T. Health Science Center ‐ Houston expense budget also grows by 8.5 percent or $115.8 million in FY 2017, with the majority associated with the McGovern Medical School’s MSRDP activities. This increase, reflected primarily within Instruction and the Hospitals and Clinics line items, is driven by the expansion of NAIP and DSRIP clinical operations, including the addition of 46 clinical faculty and 390 staff positions in comparison to the prior year’s budget, and increased pharmacy operations. The 15.9 percent increase in Academic Support is mainly due to the budgeting of anticipated startup fund expenditures for the deans of the School of Public Health, School of Biomedical Informatics, School of Nursing, and the McGovern Medical School. These startup funds support the recruitment efforts occurring within each of the respective schools and will ultimately be recognized as instruction and research expense. U. T. Health Science Center ‐ Houston’s Institutional Support increase of $10.5 million (17.3 percent growth) is primarily associated with the investment in additional Information Technology, Human Resources, and Development activities necessary to support the growth of institutional operations. Although a greater increase on a percent basis than the overall operating expenses, it is anticipated the institution’s administrative cost ratio will remain below 5.0 percent.
U. T. System Office of the Controller 44

The University of Texas Health Science Center at HoustonOperating Budget
Fiscal Year Ending August 31, 2017
BudgetFY 2016 FY 2017 Increases (Decreases)
FY 2016 Adjusted Operating From 2016 to 2017 Projected Budget Budget Amount Percent
Operating Revenues: Tuition and Fees $ 49,519,464 45,743,744 49,452,189 3,708,445 8.1% Federal Sponsored Programs 150,741,998 168,414,801 157,278,574 (11,136,227) ‐6.6% State Sponsored Programs 31,577,976 16,665,832 38,150,844 21,485,012 128.9% Local and Private Sponsored Programs 426,385,286 398,541,336 444,558,255 46,016,919 11.5% Net Sales and Services of Educational Activities 31,906,467 22,646,662 24,497,021 1,850,359 8.2% Net Sales and Services of Hospital and Clinics 74,708,085 67,590,500 76,662,124 9,071,624 13.4% Net Professional Fees 334,491,047 307,920,670 344,702,557 36,781,887 11.9% Net Auxiliary Enterprises 24,955,086 27,384,503 30,999,819 3,615,316 13.2% Other Operating Revenues 54,148,146 59,112,236 58,316,596 (795,640) ‐1.3%Total Operating Revenues 1,178,433,555 1,114,020,284 1,224,617,979 110,597,695 9.9%
Operating Expenses: Instruction 624,253,678 617,285,821 658,342,893 41,057,072 6.7% Academic Support 49,957,081 53,538,904 62,053,735 8,514,831 15.9% Research 181,259,560 185,885,793 192,443,137 6,557,344 3.5% Public Service 34,433,163 34,664,403 37,306,807 2,642,404 7.6% Hospitals and Clinics 299,001,068 291,519,736 330,774,548 39,254,812 13.5% Institutional Support 69,097,778 61,095,518 71,648,709 10,553,191 17.3% Student Services 10,152,080 9,149,178 9,872,416 723,238 7.9% Operations and Maintenance of Plant 32,328,487 37,102,054 38,273,009 1,170,955 3.2% Scholarships and Fellowships 7,338,538 7,096,430 7,218,651 122,221 1.7% Auxiliary Enterprises 15,001,164 16,221,638 17,963,249 1,741,611 10.7% Depreciation and Amortization 58,251,732 55,042,032 58,519,423 3,477,391 6.3%Total Operating Expenses 1,381,074,329 1,368,601,507 1,484,416,577 115,815,070 8.5%Operating Surplus/Deficit (202,640,774) (254,581,223) (259,798,598) (5,217,375) 2.0%
Budgeted Nonoperating Revenues (Expenses): State Appropriations 206,755,260 206,765,123 214,955,014 8,189,891 4.0% Federal Sponsored Programs (Nonoperating) 452,149 600,000 600,000 ‐ 0.0% State Sponsored Programs (Nonoperating) ‐ ‐ ‐ ‐ ‐ Gifts in Support of Operations 22,343,065 29,284,312 27,087,003 (2,197,309) ‐7.5% Net Investment Income 35,929,316 32,071,032 33,416,101 1,345,069 4.2%Other Non‐Operating Revenue ‐ ‐ ‐ ‐ ‐ Other Non‐Operating (Expenses) ‐ ‐ ‐ ‐ ‐ Net Non‐Operating Revenue/(Expenses) 265,479,790 268,720,467 276,058,118 7,337,651 2.7%
Transfers and Other: AUF Transfers Received for Operations ‐ ‐ ‐ ‐ ‐ AUF Transfers (Made) for Operations ‐ ‐ ‐ ‐ ‐ Transfers for Debt Service ‐ Interest (10,889,434) (10,895,906) (14,308,326) (3,412,420) 31.3%Total Transfers and Other (10,889,434) (10,895,906) (14,308,326) (3,412,420) 31.3%
Budget Margin (Deficit) 51,949,582 3,243,338 1,951,194 (1,292,144) ‐39.8%
Reconciliation to Change in Net Assets: Net Non‐Profit Health Corp Activity 19,286,843 8,000,000 3,000,000 (5,000,000) ‐62.5% Net Inc./(Dec.) in Fair Value of Investments (22,554,892) ‐ ‐ ‐ ‐ Interest Expense on Capital Asset Financings ‐ ‐ ‐ ‐ ‐ Capital Approp., Gifts and Sponsored Programs ‐ ‐ ‐ ‐ ‐ Additions to Permanent Endowments 15,423,977 10,000,000 25,000,000 15,000,000 150.0% Transfers for Debt Service ‐ Principal (17,571,631) (17,571,631) (17,519,917) 51,714 ‐0.3% Reverse Transfers for Debt Service (System Only) ‐ ‐ ‐ ‐ ‐ Transfers and Other 8,628,497 22,000,000 35,000,000 13,000,000 59.1%SRECNA Change in Net Assets $ 55,162,376 25,671,707 47,431,277 21,759,570 84.8%
Total Revenues and AUF Transfers $ 1,443,913,345 1,382,740,751 1,500,676,097 117,935,346 8.5%Total Expenses (Including Transfers for Interest) (1,391,963,763) (1,379,497,413) (1,498,724,903) (119,227,490) 8.6%Budget Margin (Deficit) $ 51,949,582 3,243,338 1,951,194 (1,292,144)
Reconciliation to Use of Prior Year Balances Depreciation 55,042,032 58,519,423 Capital Outlay (23,077,362) (23,717,857) Transfers for Debt Service ‐ Principal (17,571,631) (17,519,917) Budgeted Transfers 606,000 612,000 Net Additions to (Uses of) Prior Year Balances 18,242,377 19,844,843
Note: Operating Budget Highlights with a glossary of terms are included on Page 1.
U. T. System Office of the Controller 45

The University of Texas Health Science Center at San Antonio Operating Budget Highlights
For the Year Ending August 31, 2017
Introduction ‐ Major Goals Addressed by FY 2017 Budget The FY 2017 Operating Budget for The University of Texas Health Science Center at San Antonio has been written to align resources in support of strategic planning efforts. The institution aspires to attain ranking in the top echelon of academic medical centers in the United States. To successfully achieve this goal, a thriving clinical enterprise and significant investments will be critical to invigorating research strengths and enhancing academic programs. The institution plans to execute two key strategic priorities during FY 2017. Transforming the clinical enterprise to compete in the future state of healthcare will be achieved through partnerships and facility expansions. Elements of this strategy include partnering with The University of Texas M. D. Anderson Cancer Center to bring global leading cancer prevention, patient care, and research to Central and South Texas that will integrate, employ, and recruit cancer specialists to enhance multidisciplinary care and further push the bounds of research. Other clinical service lines will be expanded in renovated and newly constructed facilities to establish a broader network of ambulatory sites, build a more integrated primary care network, and create highly visible and distinctive clinical programs that address medical issues unique to a diverse population. Administrative space on the 7th and 8th floors of the Medical Arts and Research Center (MARC) is being converted into clinical space, allowing for the relocation and growth of practices supported by an upgrade of radiologic capabilities. A new clinical facility, U. T. Hill Country, located along the Interstate Highway 10 corridor between San Antonio and Boerne is anticipated to be completed in the spring of 2017. The site will accommodate primary care providers who will anchor the facility, in addition to specialty providers in orthopedics, urology and physical therapy with full imaging capabilities to serve all partnering providers in this area. The institution will further seek to affiliate with existing primary care providers and groups to create Clinically Integrated Networks to address the primary care shortage, cultivate additional referral sources, facilitate the coordination of specialty care, and position for population health management. Finally, the institution is committed to creating clinical distinction that would be accelerated by a partner or set of partners who bring the expertise, depth, and resources to complement the faculty practice and could develop an integrated health system with overlapping missions, goals and desires. The institution is currently engaged in discussions with potential partners. Invigorating the research mission will be achieved by investing in key research assets and recruitments. Plans are underway to position the renowned Barshop Institute for Longevity and Aging Studies for long term success by relocating its scientists, animals, and laboratories from the Texas Research Park some 20 miles away to space on the main campus. By relocating the Barshop Institute, along with new recruiting, the Institute can grow to become a top 25 national aging science center. Targeted research recruitments are also planned in: medicine, Alzheimer and neurodegenerative diseases, dentistry (to include neurobiology and pain, oral cancer, stem cells, and tissue regeneration), epidemiology, biostatistics, psychiatry, molecular medicine, and cellular and structural biology. Necessary to executing these strategic priorities is the modernization of existing facilities to ensure the academic and research missions are competitively positioned for the future. With tremendous investments of Tuition Revenue Bonds approved by the State Legislature along with funding committed by The University of Texas System Board of Regents, the institution can deliver educational experiences with leading edge technology and state of the art equipment. A rebranding initiative is also underway in response to a comprehensive perception survey that reflects significant confusion and low market awareness for the institution’s missions, services, and entities, which impede the organization’s ability to compete in an increasingly crowded marketplace on all fronts. The institution will be in investment mode as it executes its strategic objectives, but expects to preserve its financial health with the attainment of a projected operating margin for FY 2017 of $2.3 million resulting largely from enhanced clinical activities and controlled operations. Achieving clinical revenue targets will be critically important in order to competitively retain and recruit productive faculty, to continue to subsidize the institution’s educational and research missions, and to fund infrastructure needs.
Revenue Total revenues for FY 2017 are projected to increase by a net of $4.8 million (0.6 percent) with changes predominately occurring in the physician practice plan as part of the institution’s clinical transformation plan generating enhanced revenue streams in the newly renovated MARC 7th and 8th floors and the newly constructed U. T. Hill Country facility ($21 million). Offsetting these increases are adjustments to externally sponsored research projections as strategies and investments were reevaluated from the prior budget.
Expenses Total expenses for FY 2017 are projected to increase by a net of $9.5 million (1.2 percent) from the prior budget with changes predominately occurring from the clinical expansion and targeted recruitment efforts discussed above ($21.1 million), in addition to a 2 percent merit salary increase for all non‐faculty employees ($4.0 million). Offsetting these increases are adjustments to externally sponsored research projections as strategies and investments were reevaluated from the prior budget.
U. T. System Office of the Controller 46
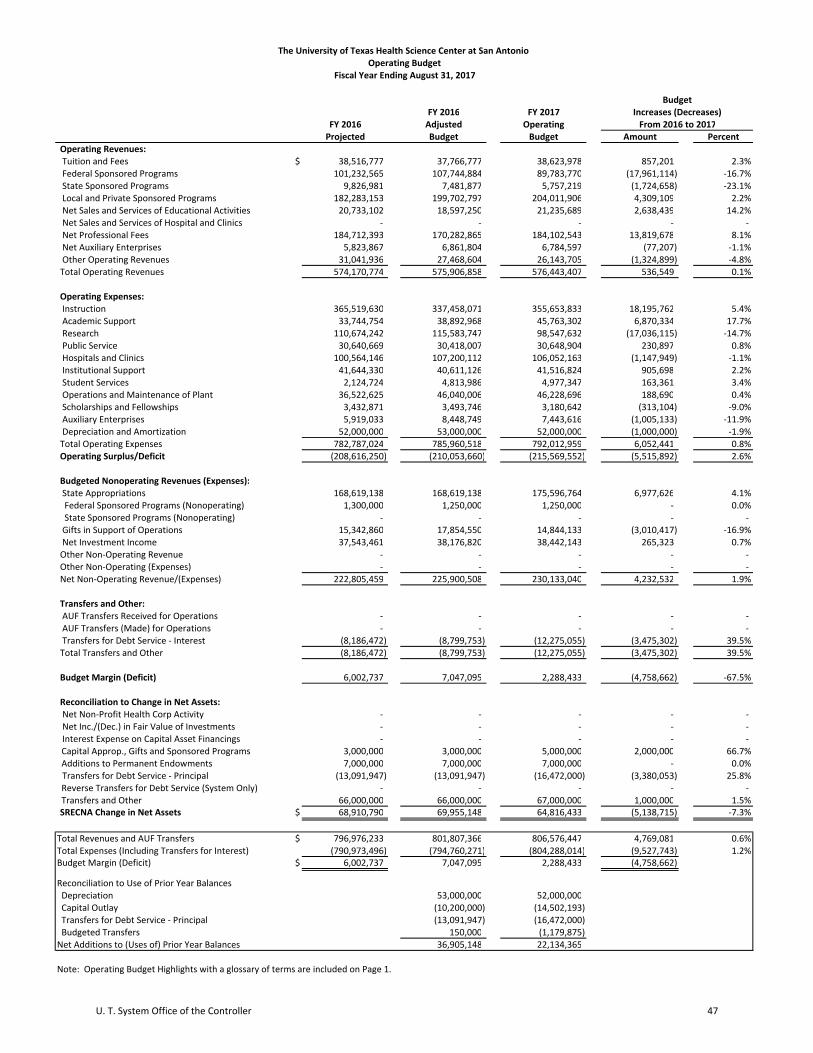
The University of Texas Health Science Center at San Antonio Operating Budget
Fiscal Year Ending August 31, 2017
BudgetFY 2016 FY 2017 Increases (Decreases)
FY 2016 Adjusted Operating From 2016 to 2017 Projected Budget Budget Amount Percent
Operating Revenues: Tuition and Fees $ 38,516,777 37,766,777 38,623,978 857,201 2.3% Federal Sponsored Programs 101,232,565 107,744,884 89,783,770 (17,961,114) ‐16.7% State Sponsored Programs 9,826,981 7,481,877 5,757,219 (1,724,658) ‐23.1% Local and Private Sponsored Programs 182,283,153 199,702,797 204,011,906 4,309,109 2.2% Net Sales and Services of Educational Activities 20,733,102 18,597,250 21,235,689 2,638,439 14.2% Net Sales and Services of Hospital and Clinics ‐ ‐ ‐ ‐ ‐ Net Professional Fees 184,712,393 170,282,865 184,102,543 13,819,678 8.1% Net Auxiliary Enterprises 5,823,867 6,861,804 6,784,597 (77,207) ‐1.1% Other Operating Revenues 31,041,936 27,468,604 26,143,705 (1,324,899) ‐4.8%Total Operating Revenues 574,170,774 575,906,858 576,443,407 536,549 0.1%
Operating Expenses: Instruction 365,519,630 337,458,071 355,653,833 18,195,762 5.4% Academic Support 33,744,754 38,892,968 45,763,302 6,870,334 17.7% Research 110,674,242 115,583,747 98,547,632 (17,036,115) ‐14.7% Public Service 30,640,669 30,418,007 30,648,904 230,897 0.8% Hospitals and Clinics 100,564,146 107,200,112 106,052,163 (1,147,949) ‐1.1% Institutional Support 41,644,330 40,611,126 41,516,824 905,698 2.2% Student Services 2,124,724 4,813,986 4,977,347 163,361 3.4% Operations and Maintenance of Plant 36,522,625 46,040,006 46,228,696 188,690 0.4% Scholarships and Fellowships 3,432,871 3,493,746 3,180,642 (313,104) ‐9.0% Auxiliary Enterprises 5,919,033 8,448,749 7,443,616 (1,005,133) ‐11.9% Depreciation and Amortization 52,000,000 53,000,000 52,000,000 (1,000,000) ‐1.9%Total Operating Expenses 782,787,024 785,960,518 792,012,959 6,052,441 0.8%Operating Surplus/Deficit (208,616,250) (210,053,660) (215,569,552) (5,515,892) 2.6%
Budgeted Nonoperating Revenues (Expenses): State Appropriations 168,619,138 168,619,138 175,596,764 6,977,626 4.1% Federal Sponsored Programs (Nonoperating) 1,300,000 1,250,000 1,250,000 ‐ 0.0% State Sponsored Programs (Nonoperating) ‐ ‐ ‐ ‐ ‐ Gifts in Support of Operations 15,342,860 17,854,550 14,844,133 (3,010,417) ‐16.9% Net Investment Income 37,543,461 38,176,820 38,442,143 265,323 0.7%Other Non‐Operating Revenue ‐ ‐ ‐ ‐ ‐ Other Non‐Operating (Expenses) ‐ ‐ ‐ ‐ ‐ Net Non‐Operating Revenue/(Expenses) 222,805,459 225,900,508 230,133,040 4,232,532 1.9%
Transfers and Other: AUF Transfers Received for Operations ‐ ‐ ‐ ‐ ‐ AUF Transfers (Made) for Operations ‐ ‐ ‐ ‐ ‐ Transfers for Debt Service ‐ Interest (8,186,472) (8,799,753) (12,275,055) (3,475,302) 39.5%Total Transfers and Other (8,186,472) (8,799,753) (12,275,055) (3,475,302) 39.5%
Budget Margin (Deficit) 6,002,737 7,047,095 2,288,433 (4,758,662) ‐67.5%
Reconciliation to Change in Net Assets: Net Non‐Profit Health Corp Activity ‐ ‐ ‐ ‐ ‐ Net Inc./(Dec.) in Fair Value of Investments ‐ ‐ ‐ ‐ ‐ Interest Expense on Capital Asset Financings ‐ ‐ ‐ ‐ ‐ Capital Approp., Gifts and Sponsored Programs 3,000,000 3,000,000 5,000,000 2,000,000 66.7% Additions to Permanent Endowments 7,000,000 7,000,000 7,000,000 ‐ 0.0% Transfers for Debt Service ‐ Principal (13,091,947) (13,091,947) (16,472,000) (3,380,053) 25.8% Reverse Transfers for Debt Service (System Only) ‐ ‐ ‐ ‐ ‐ Transfers and Other 66,000,000 66,000,000 67,000,000 1,000,000 1.5%SRECNA Change in Net Assets $ 68,910,790 69,955,148 64,816,433 (5,138,715) ‐7.3%
Total Revenues and AUF Transfers $ 796,976,233 801,807,366 806,576,447 4,769,081 0.6%Total Expenses (Including Transfers for Interest) (790,973,496) (794,760,271) (804,288,014) (9,527,743) 1.2%Budget Margin (Deficit) $ 6,002,737 7,047,095 2,288,433 (4,758,662)
Reconciliation to Use of Prior Year Balances Depreciation 53,000,000 52,000,000 Capital Outlay (10,200,000) (14,502,193) Transfers for Debt Service ‐ Principal (13,091,947) (16,472,000) Budgeted Transfers 150,000 (1,179,875) Net Additions to (Uses of) Prior Year Balances 36,905,148 22,134,365
Note: Operating Budget Highlights with a glossary of terms are included on Page 1.
U. T. System Office of the Controller 47
The University of Texas M. D. Anderson Cancer Center Operating Budget Highlights
For the Year Ending August 31, 2017
Introduction ‐ Major Goals Addressed by FY 2017 Budget The University of Texas M. D. Anderson Cancer Center’s strategic priorities are aligned along components that include “the People We Serve, the People Who serve, the Science that Enables, the Systems that Support and ensured Sustainability”. The Institution’s strategy is designed to prioritize the changes it has chosen to pursue and give it a structure to ensure action and accountability. During FY 2016, the Institution embarked on one of its largest clinical and business transformations: the Electronic Health Record (EHR) OneConnect effort. Some disruption in productivity was anticipated, however, project team leaders worked to ensure that workflows needed for EHR were integrated across all our strategic projects. This level of coordination minimized the strain on U. T. M. D. Anderson resources and afforded the opportunity for a digital health transformation providing patient‐centric, value driven care through a new technology‐enabled care delivery model. The optimization of the EHR in FY 2017 is anticipated to return the Institution to pre‐implementation productivity levels. This normalization will also allow a returned focus on next‐generation research and improved survival outcomes, as well as an expansion of the Institution’s global reach through scalable programs and platforms. In FY 2017 the EHR will be stabilized and optimized. Continued development and deployment of the digital platform will occur, including the Translational Research Accelerator and Network 2.0. To endure the tremendous change on a number of fronts, the Institution will expand its local and national impact and implement Institutional Advancement initiatives. Diversification and expansion of the revenue stream will be provided via newly configured Houston area locations, the Cancer Network, strategic industry ventures and employer products. As a precept for maintaining viability over the next five year horizon, the Institution will prepare for the impact of narrow networks, better analyze and control costs, and collaborate with other cancer centers on payment reform.
Revenue The FY 2017 total budgeted operating revenue is projected to increase almost 14% or $547 million over the level targeted for FY 2016. The drop in productivity from the EHR in FY 2016 will be mitigated and FY 2017 will stabilize at a clinical productivity per Faculty Full Time Equivalent equal to pre‐implementation levels. Hospital activities and billable units will increase materially as a result and will be impacted as well by newly completed or expanded facilities in the Pavilion and three new inpatient floors. Federal, State, Local, and Private sponsored programs are anticipated to increase almost 8% over FY 2016 budgeted levels. The anticipated moratorium on Cancer Prevention Research Institute of Texas awards during 2016 did not occur, and U. T. M. D. Anderson has continued to receive a material share of funding. The FY 2017 State Appropriations budget will increase approximately 3% due to additional Tuition Revenue Bond funding for the Zayed Building construction. Gifts in Support of Operations and Net Investment Income are projected to increase 6.5% and 10.5% respectively as focus and efforts become more normalized in FY 2017 following EHR transition.
Expenses The FY 2017 total budgeted operating expense is projected to increase 6.5% or $272 million over the level targeted for FY 2016. The rebound in activity from the FY 2016 EHR implementation, normal annual merit increases and incremental costs for newly completed or expanded facilities will generate a 5% or $132 million increase in Hospitals and Clinics. The depreciation of these new facilities along with a full year amortization of the EHR project costs will result in a 19% or $67 million increase in Depreciation and Amortization. Although the variance for budget over budget is 28% or $31 million, the allocation of Institutional Support costs in the FY 2016 budget has been readjusted and projected costs for FY 2017 are more reflective of the current actual expense. Increased costs for Academic Support (14% or $19 million increase) include an expansion in mission from supporting faculty to including trainees and students in their academic career development. Research expense will increase 3% or $17 million in FY 2017, and Operation and Maintenance of Plant costs will grow 2% or $3 million, both primarily as a result of normal annual merit increases.
U. T. System Office of the Controller 48

The University of Texas M. D. Anderson Cancer CenterOperating Budget
Fiscal Year Ending August 31, 2017
BudgetFY 2016 FY 2017 Increases (Decreases)
FY 2016 Adjusted Operating From 2016 to 2017 Projected Budget Budget Amount Percent
Operating Revenues: Tuition and Fees $ 1,473,538 1,909,589 1,415,025 (494,564) ‐25.9% Federal Sponsored Programs 164,114,915 145,860,000 156,453,861 10,593,861 7.3% State Sponsored Programs 33,556,202 28,600,000 35,026,443 6,426,443 22.5% Local and Private Sponsored Programs 118,014,085 111,540,000 116,731,823 5,191,823 4.7% Net Sales and Services of Educational Activities 2,141,452 2,315,000 1,755,830 (559,170) ‐24.2% Net Sales and Services of Hospital and Clinics 3,205,578,840 3,090,500,000 3,558,454,318 467,954,318 15.1% Net Professional Fees 400,093,907 391,697,851 445,820,485 54,122,634 13.8% Net Auxiliary Enterprises 42,421,946 46,310,187 48,675,048 2,364,861 5.1% Other Operating Revenues 100,945,885 103,056,541 104,756,623 1,700,082 1.6%Total Operating Revenues 4,068,340,770 3,921,789,168 4,469,089,456 547,300,288 14.0%
Operating Expenses: Instruction 79,111,720 75,089,250 81,623,799 6,534,549 8.7% Academic Support 148,856,612 134,961,749 153,480,500 18,518,751 13.7% Research 687,894,086 681,096,000 698,476,897 17,380,897 2.6% Public Service 11,014,834 14,850,000 12,520,751 (2,329,249) ‐15.7% Hospitals and Clinics 2,616,912,072 2,579,500,711 2,711,054,232 131,553,521 5.1% Institutional Support 139,401,008 110,822,656 141,753,046 30,930,390 27.9% Student Services 554,395 804,442 561,000 (243,442) ‐30.3% Operations and Maintenance of Plant 197,251,725 195,459,099 198,427,284 2,968,185 1.5% Scholarships and Fellowships 1,920,449 2,523,558 2,202,127 (321,431) ‐12.7% Auxiliary Enterprises 27,870,998 28,794,480 28,479,500 (314,980) ‐1.1% Depreciation and Amortization 366,121,762 347,894,112 415,067,451 67,173,339 19.3%Total Operating Expenses 4,276,909,661 4,171,796,057 4,443,646,587 271,850,530 6.5%Operating Surplus/Deficit (208,568,891) (250,006,889) 25,442,869 275,449,758 ‐110.2%
Budgeted Nonoperating Revenues (Expenses): State Appropriations 201,414,481 200,869,362 207,772,397 6,903,035 3.4% Federal Sponsored Programs (Nonoperating) 500,000 500,000 500,000 ‐ 0.0% State Sponsored Programs (Nonoperating) ‐ ‐ ‐ ‐ ‐ Gifts in Support of Operations 136,124,928 116,365,902 124,005,647 7,639,745 6.6% Net Investment Income 78,505,307 139,400,000 154,043,266 14,643,266 10.5%Other Non‐Operating Revenue ‐ ‐ ‐ ‐ ‐ Other Non‐Operating (Expenses) ‐ ‐ ‐ ‐ ‐ Net Non‐Operating Revenue/(Expenses) 416,544,716 457,135,264 486,321,310 29,186,046 6.4%
Transfers and Other: AUF Transfers Received for Operations ‐ ‐ ‐ ‐ ‐ AUF Transfers (Made) for Operations ‐ ‐ ‐ ‐ ‐ Transfers for Debt Service ‐ Interest (50,992,253) (35,909,524) (39,714,132) (3,804,608) 10.6%Total Transfers and Other (50,992,253) (35,909,524) (39,714,132) (3,804,608) 10.6%
Budget Margin (Deficit) 156,983,572 171,218,851 472,050,047 300,831,196 175.7%
Reconciliation to Change in Net Assets: Net Non‐Profit Health Corp Activity ‐ ‐ ‐ ‐ ‐ Net Inc./(Dec.) in Fair Value of Investments ‐ ‐ ‐ ‐ ‐ Interest Expense on Capital Asset Financings ‐ ‐ ‐ ‐ ‐ Capital Approp., Gifts and Sponsored Programs 10,000,000 10,000,000 5,000,000 (5,000,000) ‐50.0% Additions to Permanent Endowments 10,000,000 10,000,000 10,000,000 ‐ 0.0% Transfers for Debt Service ‐ Principal (64,970,000) (60,449,181) (73,529,361) (13,080,180) 21.6% Reverse Transfers for Debt Service (System Only) ‐ ‐ ‐ ‐ ‐ Transfers and Other 25,000,000 70,000,000 153,200,457 83,200,457 118.9%SRECNA Change in Net Assets $ 137,013,572 200,769,670 566,721,143 365,951,473 182.3%
Total Revenues and AUF Transfers $ 4,484,885,486 4,378,924,432 4,955,410,766 576,486,334 13.2%Total Expenses (Including Transfers for Interest) (4,327,901,914) (4,207,705,581) (4,483,360,719) (275,655,138) 6.6%Budget Margin (Deficit) $ 156,983,572 171,218,851 472,050,047 300,831,196
Reconciliation to Use of Prior Year Balances Depreciation 347,894,112 415,067,451 Capital Outlay (481,000,000) (770,000,000) Transfers for Debt Service ‐ Principal (60,449,181) (73,529,361) Budgeted Transfers ‐ ‐ Net Additions to (Uses of) Prior Year Balances (22,336,218) 43,588,137
Note: Operating Budget Highlights with a glossary of terms are included on Page 1.
U. T. System Office of the Controller 49

The University of Texas Health Science Center at Tyler Operating Budget Highlights
For the Year Ending August 31, 2017
Introduction ‐ Major Goals Addressed by FY 2017 Budget The Mission, Vision and Values of The University of Texas Health Science Center at Tyler are advanced by the FY 2017 operating budget through continued investments in information technology, infrastructure, workforce development, and innovative programs. Institutional leadership developed the FY 2017 operating budget with a focus on supporting the organization’s mission of serving Northeast Texas and beyond through excellent patient care and community health, comprehensive education, and innovative research. Specifically, U. T. Health Science Center – Tyler has budgeted resources to accomplish several of the institution’s highest strategic priorities, including goals to become the regional leader in community and population health, to grow the clinical practice, to expand graduate medical education programs, to grow the academic mission, and to enhance revenue and contain costs. New or expanded programs planned for FY 2017 include expansion of the School of Community and Rural Health, establishment of a new rural family medicine residency program, expansion of behavioral health workforce training programs, and establishment of a broader base of behavioral health outpatient services. During FY 2016 U. T. Health Science Center – Tyler completed an essential upgrade to its PeopleSoft application for financial accounting, which will be followed by a similarly important upgrade to the PeopleSoft application for human capital and payroll management in FY 2017. In general, FY 2017 will be characterized by a greater level of planned investments in information technology systems in order to enhance management’s ability to quickly identify and leverage changing dynamics in the operating environment. These investments are designed to increase quality, efficiency, effectiveness, productivity, and stakeholder access to information resources, as well as to improve the institution’s ability to collaborate and share information and resources across the U. T. System. The first phase of a major remodel and expansion of U. T. Health Science Center – Tyler’s vivarium facility was completed in FY 2016. The second phase of that project will continue into FY 2017. This state‐of‐the‐art facility supports research and academic programs by attracting and retaining the highest quality researchers and students. Additionally, a variety of renovations and building system upgrades are planned for FY 2017 to increase the efficiency of space and to provide a higher level of patient care. These strategic campus improvements will allow U. T. Health Science Center ‐ Tyler to expand its medical, educational, and research space. These renovations are consistent with a strategic master plan to increase efficiency, productivity, and the patient experience. These strategies and others serve the Mission, Vision, and Values of the U. T. Health Science Center – Tyler, enabling the organization to provide access to high quality patient care and education, and to recruit and retain world‐class faculty, students, staff, and administrators.
Revenue U. T. Health Science Center – Tyler’s budgeted total revenues and transfers for FY 2017 are approximately 11 percent higher than the FY 2016 operating budget. This increase is driven by additional sponsored programs, an anticipated increase in 1115 Medicaid Transformation Waiver benchmark and revenue achievements, considerable volume growth in patient care areas across the organization, improvements in revenue cycle operations, and growth of educational programs.
Expenses U. T. Health Science Center – Tyler’s budgeted total expenses and transfers for FY 2017 are approximately 11 percent higher over the FY 2016 budget. This increase is correlated with the organization’s revenue growth. These expenditures represent an ongoing investment to improve the quality of and access to healthcare, increase behavioral health clinical capacity and workforce training, expand educational and residency programs and opportunities, maintain and improve infrastructure, advance information technology systems and resources, and continue to invest in and develop the institution’s human capital.
U. T. System Office of the Controller 50

The University of Texas Health Science Center at TylerOperating Budget
Fiscal Year Ending August 31, 2017
BudgetFY 2016 FY 2017 Increases (Decreases)
FY 2016 Adjusted Operating From 2016 to 2017 Projected Budget Budget Amount Percent
Operating Revenues: Tuition and Fees $ 122,818 ‐ 192,783 192,783 ‐ Federal Sponsored Programs 7,725,346 9,500,000 6,653,231 (2,846,769) ‐30.0% State Sponsored Programs 11,518,153 10,903,000 13,502,717 2,599,717 23.8% Local and Private Sponsored Programs 6,876,955 1,900,000 2,964,159 1,064,159 56.0% Net Sales and Services of Educational Activities 2,063,806 1,400,000 1,525,992 125,992 9.0% Net Sales and Services of Hospital and Clinics 58,787,819 65,423,860 76,972,861 11,549,001 17.7% Net Professional Fees 16,726,141 16,374,193 18,835,427 2,461,234 15.0% Net Auxiliary Enterprises 227,603 192,000 245,647 53,647 27.9% Other Operating Revenues 32,651,735 18,861,331 22,879,972 4,018,641 21.3%Total Operating Revenues 136,700,376 124,554,384 143,772,789 19,218,405 15.4%
Operating Expenses: Instruction 10,493,298 12,241,568 12,418,174 176,606 1.4% Academic Support ‐ 1,115,062 1,256,804 141,742 12.7% Research 18,887,937 15,659,833 17,670,795 2,010,962 12.8% Public Service ‐ ‐ ‐ ‐ ‐ Hospitals and Clinics 130,096,818 110,557,764 130,617,400 20,059,636 18.1% Institutional Support 10,503,340 14,090,883 13,012,940 (1,077,943) ‐7.6% Student Services 582,403 ‐ ‐ ‐ ‐ Operations and Maintenance of Plant 10,754,376 15,664,110 13,811,874 (1,852,236) ‐11.8% Scholarships and Fellowships ‐ ‐ ‐ ‐ ‐ Auxiliary Enterprises 200,829 165,825 206,446 40,621 24.5% Depreciation and Amortization 11,306,655 11,950,000 11,800,000 (150,000) ‐1.3%Total Operating Expenses 192,825,656 181,445,045 200,794,433 19,349,388 10.7%Operating Surplus/Deficit (56,125,280) (56,890,661) (57,021,644) (130,983) 0.2%
Budgeted Nonoperating Revenues (Expenses): State Appropriations 53,906,030 56,050,347 56,277,046 226,699 0.4% Federal Sponsored Programs (Nonoperating) ‐ ‐ ‐ ‐ ‐ State Sponsored Programs (Nonoperating) ‐ ‐ ‐ ‐ ‐ Gifts in Support of Operations 525,755 1,500,000 1,500,000 ‐ 0.0% Net Investment Income 4,115,638 3,800,000 4,031,515 231,515 6.1%Other Non‐Operating Revenue ‐ ‐ ‐ ‐ ‐ Other Non‐Operating (Expenses) ‐ ‐ ‐ ‐ ‐ Net Non‐Operating Revenue/(Expenses) 58,547,423 61,350,347 61,808,561 458,214 0.7%
Transfers and Other: AUF Transfers Received for Operations ‐ ‐ ‐ ‐ ‐ AUF Transfers (Made) for Operations ‐ ‐ ‐ ‐ ‐ Transfers for Debt Service ‐ Interest (1,323,694) (1,576,643) (2,334,245) (757,602) 48.1%Total Transfers and Other (1,323,694) (1,576,643) (2,334,245) (757,602) 48.1%
Budget Margin (Deficit) 1,098,449 2,883,043 2,452,672 (430,371) ‐14.9%
Reconciliation to Change in Net Assets: Net Non‐Profit Health Corp Activity 6,000 ‐ ‐ ‐ ‐ Net Inc./(Dec.) in Fair Value of Investments (600,000) ‐ ‐ ‐ ‐ Interest Expense on Capital Asset Financings (1,323,694) ‐ ‐ ‐ ‐ Capital Approp., Gifts and Sponsored Programs 5,800 100,000 100,000 ‐ 0.0% Additions to Permanent Endowments ‐ 100,000 100,000 ‐ 0.0% Transfers for Debt Service ‐ Principal (4,192,550) (4,469,087) (4,883,000) (413,913) 9.3% Reverse Transfers for Debt Service (System Only) ‐ ‐ ‐ ‐ ‐ Transfers and Other 3,000,000 2,880,800 2,577,573 (303,227) ‐10.5%SRECNA Change in Net Assets $ (2,005,995) 1,494,756 347,245 (1,147,511) ‐76.8%
Total Revenues and AUF Transfers $ 195,247,799 185,904,731 205,581,350 19,676,619 10.6%Total Expenses (Including Transfers for Interest) (194,149,350) (183,021,688) (203,128,678) (20,106,990) 11.0%Budget Margin (Deficit) $ 1,098,449 2,883,043 2,452,672 (430,371)
Reconciliation to Use of Prior Year Balances Depreciation 11,950,000 11,800,000 Capital Outlay (8,500,000) (6,500,000) Transfers for Debt Service ‐ Principal (4,469,087) (4,883,000) Budgeted Transfers ‐ ‐ Net Additions to (Uses of) Prior Year Balances 1,863,956 2,869,672
Note: Operating Budget Highlights with a glossary of terms are included on Page 1.
U. T. System Office of the Controller 51

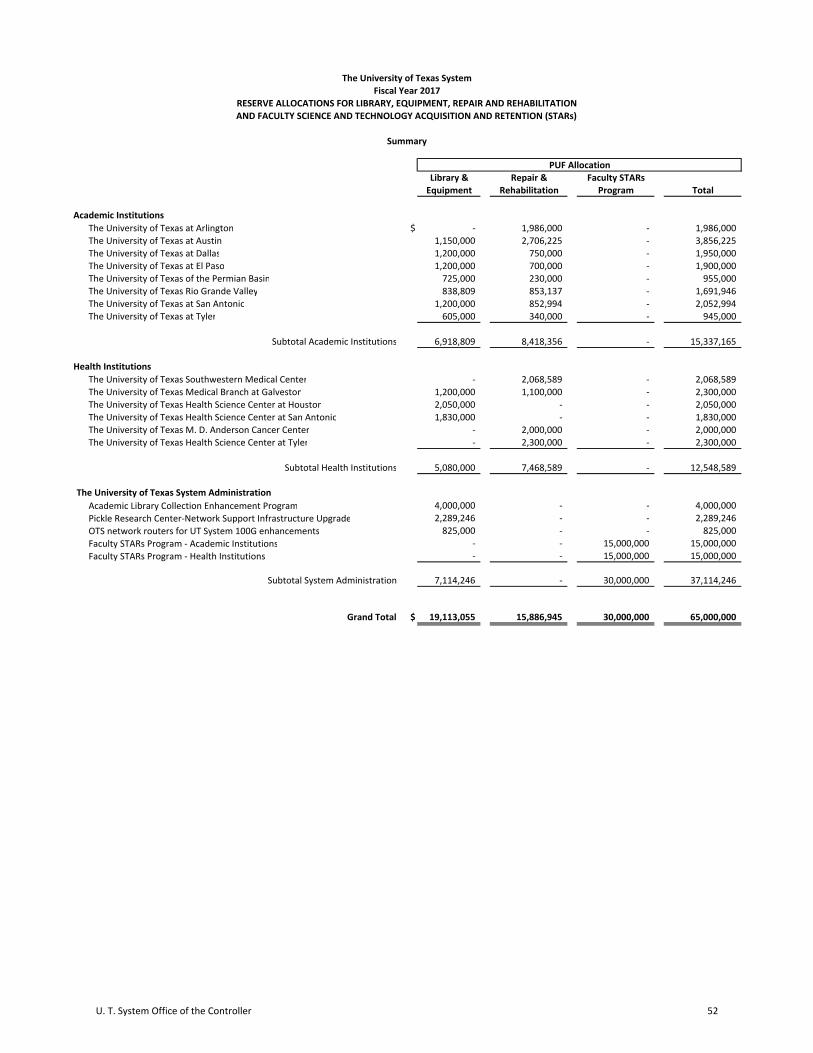
PUF Allocation
Library & Repair & Faculty STARs
Equipment Rehabilitation Program Total
The University of Texas at Arlington $ ‐ 1,986,000 ‐ 1,986,000
The University of Texas at Austin 1,150,000 2,706,225 ‐ 3,856,225
The University of Texas at Dallas 1,200,000 750,000 ‐ 1,950,000
The University of Texas at El Paso 1,200,000 700,000 ‐ 1,900,000
The University of Texas of the Permian Basin 725,000 230,000 ‐ 955,000
The University of Texas Rio Grande Valley 838,809 853,137 ‐ 1,691,946
The University of Texas at San Antonio 1,200,000 852,994 ‐ 2,052,994
The University of Texas at Tyler 605,000 340,000 ‐ 945,000
Subtotal Academic Institutions 6,918,809 8,418,356 ‐ 15,337,165
The University of Texas Southwestern Medical Center ‐ 2,068,589 ‐ 2,068,589
The University of Texas Medical Branch at Galveston 1,200,000 1,100,000 ‐ 2,300,000
The University of Texas Health Science Center at Houston 2,050,000 ‐ ‐ 2,050,000
The University of Texas Health Science Center at San Antonio 1,830,000 ‐ ‐ 1,830,000
The University of Texas M. D. Anderson Cancer Center ‐ 2,000,000 ‐ 2,000,000
The University of Texas Health Science Center at Tyler ‐ 2,300,000 ‐ 2,300,000
Subtotal Health Institutions 5,080,000 7,468,589 ‐ 12,548,589
Academic Library Collection Enhancement Program 4,000,000 ‐ ‐ 4,000,000
Pickle Research Center‐Network Support Infrastructure Upgrade 2,289,246 ‐ ‐ 2,289,246
OTS network routers for UT System 100G enhancements 825,000 ‐ ‐ 825,000
Faculty STARs Program ‐ Academic Institutions ‐ ‐ 15,000,000 15,000,000
Faculty STARs Program ‐ Health Institutions ‐ ‐ 15,000,000 15,000,000
Subtotal System Administration 7,114,246 ‐ 30,000,000 37,114,246
Grand Total $ 19,113,055 15,886,945 30,000,000 65,000,000
The University of Texas System Administration
Health Institutions
Academic Institutions
The University of Texas System
Fiscal Year 2017
RESERVE ALLOCATIONS FOR LIBRARY, EQUIPMENT, REPAIR AND REHABILITATION
Summary
AND FACULTY SCIENCE AND TECHNOLOGY ACQUISITION AND RETENTION (STARs)
U. T. System Office of the Controller 52

LIBRARY AND EQUIPMENT FACULTY
STARs TOTAL PUF TOTAL PUF PUF
INSTITUTION/NAME OF PROJECT PROJECT COST ALLOCATION PROJECT COST ALLOCATION ALLOCATION
ACADEMIC INSTITUTIONS
The University of Texas at Arlington
Life Science Building Infrastructure Replacement 1,500,000 1,500,000
Texas Hall Sound System Replacement 607,000 486,000
TOTAL $ ‐ ‐ 2,107,000 1,986,000 ‐
The University of Texas at Austin
Digital Libraries Infrastructure 900,000 900,000
Information Quest 300,000 250,000
Campuswide Safety and Security Improvements 2,476,225 2,256,225
Building Access Control System Facility Security Project Phase II 500,000 450,000
TOTAL $ 1,200,000 1,150,000 2,976,225 2,706,225 ‐
The University of Texas at Dallas
Academic Affairs Science and Engineering Laboratory Equipment 1,200,000 1,200,000
Roof Replacement Administrative Building 750,000 750,000
TOTAL $ 1,200,000 1,200,000 750,000 750,000 ‐
The University of Texas at El Paso
Safety Improvements‐Automated Material Handling System 200,000 200,000
Research and Technology Infrastructure Support for New Faculty 1,000,000 1,000,000
Fox Fine Arts Building Mechanical and Automation Systems 550,000 550,000
Rehabilitation of Campus Traction Elevators 150,000 150,000
TOTAL $ 1,200,000 1,200,000 700,000 700,000 ‐
The University of Texas of the Permian Basin
Kinesiology Department Equipment Upgrade and Replacements 200,000 200,000
Library Materials 225,000 225,000
Workstation Life Cycle Refresh 150,000 150,000
Full Wireless Coverage for Collaborative Spaces 50,000 50,000
Industrial Technology Building and Flood Control Improvements 230,000 230,000
Imaging and Workflow System 100,000 100,000
TOTAL $ 725,000 725,000 230,000 230,000 ‐
The University of Texas Rio Grande Valley
Chilled Water Line Cross‐connect Project 853,137 853,137
Smart Classroom/technology Enhanced Learning Space for Various Rooms (Phase I) 838,809 838,809
TOTAL $ 838,809 838,809 853,137 853,137 ‐
The University of Texas at San Antonio
North Thermal Energy Plant Boiler 1 Replacement 1,200,000 1,200,000
Campus Lecture Hall Rehabilitation and Modernization 1,100,000 852,994
TOTAL $ 1,200,000 1,200,000 1,100,000 852,994 ‐
The University of Texas at Tyler
Library Resources 135,000 135,000
Library Renovations 340,000 340,000
Information Technology Equipment 265,000 265,000
School of Communications Equipment 175,000 175,000
Department of Technology 30,000 30,000
TOTAL $ 605,000 605,000 340,000 340,000 ‐
SUBTOTAL ‐ ACADEMIC INSTITUTIONS $ 6,918,809 8,418,356 ‐
REPAIR AND REHABILITATION
The University of Texas System
Fiscal Year 2017
RESERVE ALLOCATIONS FOR LIBRARY, EQUIPMENT, REPAIR & REHABILITATION
AND FACULTY SCIENCE AND TECHNOLOGY ACQUISITION AND RETENTION (STARs)
U. T. System Office of the Controller 53

LIBRARY AND EQUIPMENT FACULTY
STARs TOTAL PUF TOTAL PUF PUF
INSTITUTION/NAME OF PROJECT PROJECT COST ALLOCATION PROJECT COST ALLOCATION ALLOCATION
REPAIR AND REHABILITATION
The University of Texas System
Fiscal Year 2017
RESERVE ALLOCATIONS FOR LIBRARY, EQUIPMENT, REPAIR & REHABILITATION
AND FACULTY SCIENCE AND TECHNOLOGY ACQUISITION AND RETENTION (STARs)
HEALTH INSTITUTIONS
The University of Texas Southwestern Medical Center
Renovation of Simmons Biomedical Research Building 4,000,000 2,068,589
TOTAL $ ‐ ‐ 4,000,000 2,068,589 ‐
The University of Texas Medical Branch at Galveston
Information and Educational Resources 2,427,200 1,200,000
Improve and Expand Accessible Pedestrian Routes 1,300,000 1,100,000
TOTAL $ 2,427,200 1,200,000 1,300,000 1,100,000 ‐
The University of Texas Health Science Center at Houston
Interactive Classroom Telepresence Upgrade Project 1,120,000 900,000
Internal Cloud Storage Software Replacement 250,000 250,000
Automated Testing Tools ‐ Enterprise Applications 400,000 400,000
McGovern Medical School Fiber Optic Replacement 250,000 250,000
Protection from Ransomware Attacks 250,000 250,000
TOTAL $ 2,270,000 2,050,000 ‐ ‐ ‐
The University of Texas Health Science Center at San Antonio
Digital Journals and Databases 600,000 600,000
Technology Refresh and Expansion 1,230,000 1,230,000
TOTAL $ 1,830,000 1,830,000 ‐ ‐ ‐
The University of Texas M. D. Anderson Cancer Center
Smithville Loop Road and Firewater Extension 1,653,000 1,200,000
Life Safety and Security Improvements for Alkek and Lutheran Patient Care Areas 1,500,000 800,000
TOTAL $ ‐ ‐ 3,153,000 2,000,000 ‐
The University of Texas Health Science Center at Tyler
Strategic Campus Improvements 2,300,000 2,300,000
TOTAL $ ‐ ‐ 2,300,000 2,300,000 ‐
SUBTOTAL ‐ HEALTH INSTITUTIONS $ 5,080,000 7,468,589 ‐
SYSTEM ADMINISTRATION
The University of Texas System Administration
Academic Library Collection Enhancement Program 4,000,000 4,000,000
Pickle Research Center‐Network Support Infrastructure Upgrade 2,289,246 2,289,246
Network Routers for UT System 100G Enhancements 825,000 825,000
Faculty STARs Program ‐ Academic Institutions 15,000,000
Faculty STARs Program ‐ Health Institutions 15,000,000
TOTAL $ 7,114,246 7,114,246 ‐ ‐ 30,000,000
SUBTOTAL ‐ U. T. SYSTEM ADMINISTRATION $ 7,114,246 ‐ 30,000,000
TOTAL ‐ U. T. SYSTEM $ 19,113,055 15,886,945 30,000,000
U. T. System Office of the Controller 54


Faculty Science and Technology Acquisition and Retention (STARs) Program In August 2004, the U. T. System Board of Regents approved an allocation of funds to be awarded to institutions to help attract and retain the best‐qualified faculty. Funded through Permanent University Fund (PUF) bond proceeds, this awards program, named Faculty STARs, provided funding to help purchase state‐of‐the‐art research equipment and make necessary laboratory renovations to encourage faculty members to perform their research at U. T. institutions. The Board has allocated STARs funds as follows.
STARs Allocation History
Academic Institutions
2005 Faculty STARs $ 32,450,000 2012 Faculty STARs $ 10,000,000
2006 Faculty STARs $ 15,000,000 2013 Faculty STARs $ 10,000,000
2007 Faculty STARs $ 20,000,000 2014 Faculty STARs $ 10,000,000
2008 Faculty STARs $ 10,000,000 2015 Faculty STARs $ 10,000,000
2009 Faculty STARs $ 10,000,000 2016 Faculty STARs $ 20,000,000
2010 Faculty STARs $ 15,000,000 2017 Faculty STARs $ 15,000,000
2011 Faculty STARs $ 10,000,000
Health Institutions
2005 Faculty STARs $ 26,550,000 2013 Faculty STARs $ 10,000,000
2009 Faculty STARs $ 10,000,000 2014 Faculty STARs $ 10,000,000
2010 Faculty STARs $ 15,000,000 2015 Faculty STARs $ 10,000,000
2011 Faculty STARs $ 10,000,000 2016 Faculty STARs $ 20,000,000
2011 Faculty STARs (2 years only) $ 15,000,000 2017 Faculty STARs $ 15,000,000
2012 Faculty STARs $ 10,000,000
With the exception of a portion of funding distributed non‐competitively to academic institutions in fiscal year 2005, recipients of the STARs awards are selected through a competitive process. The program is centrally administered by U. T. System to provide start‐up or retention packages for tenured faculty of proven quality that are recommended from the institutions by a faculty group at the nominating university. A peer review committee chaired by the appropriate Executive Vice Chancellor examines the STARs award nominees at the U. T. System Administration level and makes final recommendations. The funds are available only for laboratory renovation and equipment purchases. Consistent with other PUF bond funded programs, the STARs awards may not be spent on operations. The program is making a significant contribution toward accomplishing the goal of developing and further strengthening the research capacity of the institutions within U. T. System. The competitive program has helped U. T. institutions recruit and retain some of the best researchers in the nation, recognized nationally and internationally for their scholarly achievements. Since the program's inception, these individuals have made a significant impact to U. T. System institutions through research grants, collaborations made with outside entities, and pending and issued patents as well as by encouraging future research and excellence.
U. T. System Office of the Controller 55


THE UNIVERSITY OF TEXAS SYSTEM
BUDGET RULES AND PROCEDURES
For Fiscal Year Ending August 31, 2017
A. INITIAL BUDGET
1. Any transfers subsequent to the approval of the initial budget shall be made only after careful consideration of the allocations, transfer limitations, and general provisions of the current general appropriations act. (See B: Budget Amendments)
2. All appointments are subject to the provisions of the U. T. System Board of Regents' Rules and Regulations
(“Regents’ Rules”) for the governance of The University of Texas System.
3. The established merit policy will be observed in determining salary rates.
4. All academic salary rates in the instructional departments of the academic institutions are nine‐month
rates (September 1 ‐ May 31) unless otherwise specified. In the health‐related institutions, all salary rates are twelve‐month rates unless otherwise specified.
5. All appointments of classified personnel are based on twelve‐month rates and are made within appropriate
salary ranges as defined by the classified personnel Pay Plan approved by the president or Chancellor. All appointments of administrative and professional personnel are based on twelve‐month rates.
6. Compensation for continuing personnel services (for a period longer than one month), though paid for on an
hourly basis, is not to be paid out of maintenance and equipment, or like appropriations, except upon specific approval of the president of the institution or the Chancellor.
7. All maintenance and operation, equipment, and travel appropriations are for twelve months (September 1 ‐
August 31) and should be budgeted and expended accordingly.
B. BUDGET AMENDMENTS
1. Items requiring approval of the U. T. System Administration and subsequent approval by the U. T. System
Board of Regents through the Consent Agenda
a. New appointments of tenured faculty (Regents’ Rule 31007).
b. Award of tenure to any faculty member (Regents’ Rule 31007).
c. New appointments as Regental Professor, Dean Emeritus, Chair Emeritus, or Professor Emeritus (Regents’ Rule 31001). Titles set forth in Regents' Rule 20301 including Chancellor Emeritus, President Emeritus and similar honorary designations are conferred by the U. T. System Board of Regents through the full agenda.
U. T. System Office of the Controller 56

d. Appointments, promotions, and salary increases involving the president (Regents’ Rules 20201, 20202,
20203). e. New contracts or contract changes involving athletic directors or head coaches whose total annual
compensation, or total contractual compensation, equals or exceeds the amounts specified by Regents’ Rule 10501 Section 2.2.12.
f. Compensation changes for employees whose total annual compensation is $1,000,000 or above
(Regents’ Rule 20204).
g. Compensation changes for Key Executives as defined by Regents’ Rule 20203.
h. Increases in budgeted amounts from income or unappropriated balances for Educational and General, Auxiliary Enterprises, Designated Funds, Service Departments, Revolving Funds, and Plant Funds, subject to the thresholds established in B.5 below.
i. Increases to Plant Funds which result from transfers from Educational and General Funds,
Auxiliary Enterprises, Designated Funds, Service Departments, and Revolving Funds, subject to the thresholds established in B.5 below.
2. Items requiring approval of U. T. System Administration (no Consent Agenda approval required)
a. Reappropriation of prior year Educational and General Fund balances, subject to the thresholds
established in B.5 below.
b. Increases in budgeted amounts from income or unappropriated balances for Educational and General,
Auxiliary Enterprises, Designated Funds, Service Departments, Revolving Funds, and Plant Funds, subject to the thresholds established in B.5 below.
c. Increases to Plant Funds which result from transfers from Educational and General Funds, Auxiliary
Enterprises, Designated Funds, Service Departments, and Revolving Funds, subject to the thresholds established in B.5 below.
d. Compensation changes for employees whose total annual compensation is $500,000 or more but less
than $1,000,000 (Regents’ Rule 20204).
e. Compensation increases involving tenured faculty of $10,000 or more at academic institutions and
$25,000 or more at health‐related institutions. This includes one‐time merit payments.
f. Appointments and promotions involving administrative and professional personnel reporting directly
to the president.
g. Compensation increases of $10,000 or more involving administrative and professional personnel
reporting directly to the president. This includes one‐time merit payments.
U. T. System Office of the Controller 57

3. Items requiring approval of the president only Chancellor for U. T. System Administration)
a. All interdepartmental transfers.
b. All budget transfers between line‐item appropriations within a department.
c. Increases in budgeted amounts from income or unappropriated balances for Educational and
General Funds, Auxiliary Enterprises, Designated Funds, Service Departments, and Revolving Funds, subject to the thresholds established in B.5 below.
d. Reallocation of unallocated Faculty Salaries. All unfilled and uncommitted line‐item faculty
salary positions will lapse to the institutional "Unallocated Faculty Salaries" account.
e. Reappropriation of Prior Year Educational and General Fund Balances, subject to the
thresholds established in B.5 below. f. Promotions involving tenured faculty. g. Transactions involving all other personnel except those specified in B.1b, B.1c, B.1d, B.1e, B.1f, B.1g,
B.1h, B.2d, B.2e, B.2f, and B.2g as defined above.
h. Changes in sources of funds, changes in time assignments, and other changes in status for personnel categorized in Item B.1, provided no change in the individual's salary rate is involved. In the case of Medical Faculty, this provision applies to "Total Compensation."
i. Summer Session Budgets.
j. Clinical faculty appointments or changes, including medical or hospital staff, without salary.
4. Effective date of appointments and compensation increases
a. Any increase in approved compensation for the current fiscal year without a change in classification or position is not to be effective prior to the first day of the month in which the required final approval of the rate change is obtained.
b. A compensation increase resulting from an appointment to another classification or to a position
involving new and different duties may be made effective to the time of the first performance of duties under the new appointment.
c. The effective date of an appointment is the date on which the individual is first to perform
service for the institution under that appointment. d. The original appointment during a fiscal year of a person not in a budget for that year or not under
an existing appointment for that year may relate back to the first performance of duties during the fiscal year although such person may have been employed in a previous fiscal year and although increased compensation for the same classification or position is involved.
U. T. System Office of the Controller 58

5. Budget amendment criteria
a. Institutions other than U. T. System Administration with budgeted revenue, including transfers from the Available University Fund, of $1 billion or more will have a threshold of: i. For B.1h and B.1i – Equal to or greater than $5,000,000 (budget increase approval on Consent
Agenda) ii. For B.2a – Equal to or greater than $2,000,000 (reappropriation of E&G balances approval by
U. T. System Administration) iii. For B.2b and B.2c – Equal to or greater than $2,000,000 and less than $5,000,000 (budget
increase approval by U. T. System Administration) iv. For B.3c and B.3e – Less than $2,000,000 (approval by president)
b. Institutions other than U. T. System Administration with budgeted revenue, including transfers from the Available University Fund, between $250 million and $1 billion will have a threshold of:
i. For B.1h and B.1i – Equal to or greater than $2,500,000 (budget increase approval on Consent Agenda)
ii. For B.2a – Equal to or greater than $1,000,000 (reappropriation of E&G balances approval by U. T. System Administration)
iii. For B.2b and B.2c – Equal to or greater than $1,000,000 and less than $2,500,000 (budget increase approval by U. T. System Administration)
iv. For B.3c and B.3e – Less than $1,000,000 (approval by president)
c. Institutions other than U. T. System Administration with budgeted revenue, including transfers from the Available University Fund, less than $250 million will have a threshold of:
i. For B.1h and B.1i – Equal to or greater than $1,000,000 (budget increase approval on Consent Agenda)
ii. For B.2a – Equal to or greater than $250,000 (reappropriation of E&G balances approval by U. T. System Administration)
iii. For B.2b and B.2c – Equal to or greater than $250,000 and less than $1,000,000 (budget increase
approval by U. T. System Administration) iv. For B.3c and B.3e – Less than $250,000 (approval by president)
d. U. T. System Administration will have a threshold of:
i. For B.1h and B.1i – Equal to or greater than $1,000,000 (budget increase approval on Consent Agenda)
ii. For B.2a and B.3e – All amounts may be approved by the Chancellor (reappropriation of E&G balances)
iii. For B.2b, B.2c, and B.3c – All amounts less than $1,000,000 may be approved by the Chancellor (budget increase approval)
iv. Notwithstanding i., ii., and iii and after consultation with the Chairman of the U. T. System Board of Regents, the Chancellor may authorize any budget amendment not to exceed $10,000,000 for U. T. System Administration without additional approvals from the U. T. System Board of Regents. This provision does not apply to Available University Fund balances not previously appropriated.
v. Notwithstanding i., ii., and iii., the Chancellor may authorize any budget amendment in the U. T. System revolving insurance funds without limitation.
U. T. System Office of the Controller 59

C. OTHER CONSIDERATIONS
1. All appropriations not actually expended or encumbered by August 31 will automatically lapse to the Unappropriated Balance Account except for those reallocated pursuant to Item B.2a and Item B.3e.
2. Compensation indicated as "MSRDP Funds," "DSRDP Funds," "PRS Funds," “FSRDP Funds, “Allied
Health Faculty Services Plan” or “Nursing Clinical Enterprise Health Services, Research and Development Plan” is contingent upon its being earned or available in accordance with the regulations applicable to the appropriate Medical Service Research and Development Plan, Dental Service Research and Development Plan, Physicians Referral Service Plan, Faculty Services Research and Development Plan, Allied Health Faculty Services Plan, or Nursing Clinical Enterprise Health Services Research and Development Plan.
3. Budgeted expenditures authorized from sources of funds other than Educational and General Funds are
contingent upon receipt of such funds. Appointments from such fund sources will not become an obligation of the institution in the event the supplemental or grant funds are not realized.
4. Leaves of Absence may be granted only in accordance with provisions contained in Regents' Rule 30201. 5. In these Rules, Compensation means total annual compensation as defined by Regents’ Rule 20204 or
total compensation under a multiyear contract.
6. Appropriations of the Available University Fund are subject to the appropriation limitations and notice requirements found in the General Appropriations Act.
U. T. System Office of the Controller 60
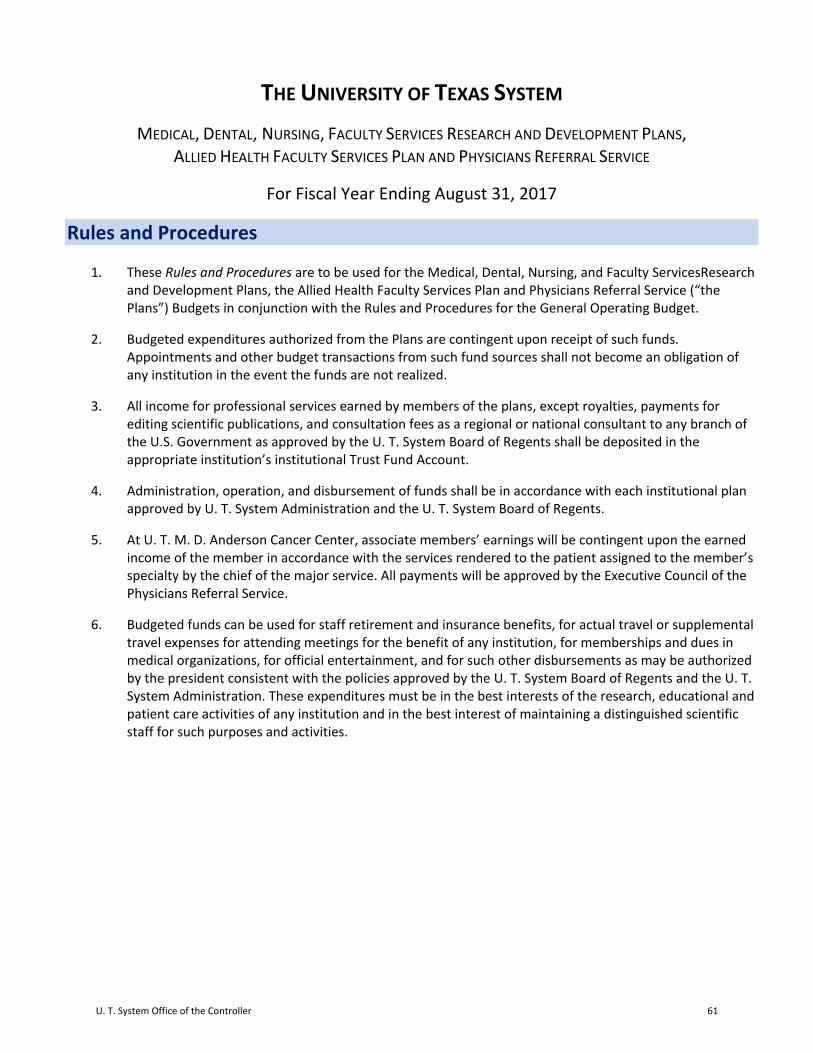
THE UNIVERSITY OF TEXAS SYSTEM
MEDICAL, DENTAL, NURSING, FACULTY SERVICES RESEARCH AND DEVELOPMENT PLANS, ALLIED HEALTH FACULTY SERVICES PLAN AND PHYSICIANS REFERRAL SERVICE
For Fiscal Year Ending August 31, 2017
Rules and Procedures
1. These Rules and Procedures are to be used for the Medical, Dental, Nursing, and Faculty ServicesResearch and Development Plans, the Allied Health Faculty Services Plan and Physicians Referral Service (“the Plans”) Budgets in conjunction with the Rules and Procedures for the General Operating Budget.
2. Budgeted expenditures authorized from the Plans are contingent upon receipt of such funds. Appointments and other budget transactions from such fund sources shall not become an obligation of any institution in the event the funds are not realized.
3. All income for professional services earned by members of the plans, except royalties, payments for editing scientific publications, and consultation fees as a regional or national consultant to any branch of the U.S. Government as approved by the U. T. System Board of Regents shall be deposited in the appropriate institution’s institutional Trust Fund Account.
4. Administration, operation, and disbursement of funds shall be in accordance with each institutional plan approved by U. T. System Administration and the U. T. System Board of Regents.
5. At U. T. M. D. Anderson Cancer Center, associate members’ earnings will be contingent upon the earned income of the member in accordance with the services rendered to the patient assigned to the member’s specialty by the chief of the major service. All payments will be approved by the Executive Council of the Physicians Referral Service.
6. Budgeted funds can be used for staff retirement and insurance benefits, for actual travel or supplemental travel expenses for attending meetings for the benefit of any institution, for memberships and dues in medical organizations, for official entertainment, and for such other disbursements as may be authorized by the president consistent with the policies approved by the U. T. System Board of Regents and the U. T. System Administration. These expenditures must be in the best interests of the research, educational and patient care activities of any institution and in the best interest of maintaining a distinguished scientific staff for such purposes and activities.
U. T. System Office of the Controller 61

THE UNIVERSITY OF TEXAS SYSTEM
ACADEMIC WORKLOAD REQUIREMENTS FOR ACADEMIC INSTITUTIONS
For Fiscal Year Ending August 31, 2017
Academic Workload Requirements for General Academic Institutions
Academic workload requirements for U. T. System general academic institutions are set forth in Regents' Rules 31006.
No two institutions in the U. T. System (and, indeed, no two teaching units within a particular institution) are alike in the workload required of individual faculty to meet student needs within the funds appropriated by the Legislature. It is the responsibility of each institutional head to require teaching in excess of the minimum where such teaching is necessary to meet the institution's obligations to its students. Each institution will establish additional standards as necessary in accordance with its role and scope, so long as it satisfies the minimum given herein, to meet the instructional obligations of the institution to the students and to operate effectively within the faculty salary resources available. Faculty members not actively involved in a program of research and publication or in equivalent academic service should typically carry a teaching load greater than the minimum.
U. T. System Office of the Controller 62

THE UNIVERSITY OF TEXAS SYSTEM
PERMANENT UNIVERSITY FUND (PUF) BOND PROCEEDS FOR LIBRARY, EQUIPMENT, REPAIR AND REHABILITATION (LERR)
AND FACULTY SCIENCE AND TECHNOLOGY ACQUISITION AND RETENTION (STARS) AND SIMILAR FUNDED PROGRAMS BUDGET RULES AND PROCEDURES
For Fiscal Year Ending August 31, 2017
A. INITIAL BUDGET
1. U. T. System institutions are authorized to purchase approved Library and Equipment items and to contract for Repair and Rehabilitation projects following standard purchasing and contracting procedures within approved dollar limits as outlined in UTS 168 Capital Expenditure Policy. This includes expenditures for Faculty STARs or similar funded programs.
2. Transfers by the U. T. System Administration of allocated funds to institutional control or to vendors will
coincide with vendor payment requirements.
3. Final approval of specific Repair and Rehabilitation projects will be in accordance with U. T. System Board of Regents established procedures for construction projects.
4. All expenditures are subject to the provisions of the Constitution of the State of Texas and the U. T. System Board of Regents' Rules and Regulations for the governance of The University of Texas System.
B. BUDGET AMENDMENTS
1. Items requiring approval of the U. T. System Administration and subsequent approval by the U. T. System Board of Regents through the Consent Agenda
a. Substitute Library and Equipment purchases in excess of $1 million that are not on the approved list.
b. Funding for new Repair and Rehabilitation projects in excess of $1 million that are not on the approved list.
2. Items requiring approval of U. T. System Administration (no Consent Agenda approval required)
a. Substitute Library and Equipment purchases of $1 million or less that are not on the approved list. b. Funding for new Repair and Rehabilitation projects of $1 million or less that are not on the
approved list. c. Transfers of appropriated funds between approved Library and Equipment items.
d. Transfers of appropriated funds between Repair and Rehabilitation items.
U. T. System Office of the Controller 63

e. Transfers of funds for approved Library and Equipment purchases to fund approved Repair and Rehabilitation projects and vice versa.
f. All transfers of funds are subject to the requirements of the Capital Expenditure Policy (UTS 168).
C. OTHER CONSIDERATIONS
1. All Library and Equipment or Repair and Rehabilitation appropriations must be expended within 36 months from the date of the award or the appropriation will lapse and be made available for future Systemwide reallocation.
2. All Faculty STARs or similar program appropriations must be expended within 36 months from the time the faculty member arrives on campus or the appropriation will lapse and be made available for future Systemwide reallocation.
3. Notwithstanding the limitations adopted at the time LERR, Faculty STARs, or other similar funding was authorized, these Budget Rules and Procedures apply to all previously authorized LERR, Faculty STARs and similar funding.
U. T. System Office of the Controller 64

THE UNIVERSITY OF TEXAS SYSTEM
EXPENDITURE GUIDELINES – PERMANENT UNIVERSITY FUND (PUF) BOND PROCEEDS FOR LIBRARY, EQUIPMENT, REPAIR AND REHABILITATION (LERR)
AND FACULTY SCIENCE AND TECHNOLOGY ACQUISITION AND RETENTION (STARS) AND SIMILAR FUNDED PROGRAMS
For Fiscal Year Ending August 31, 2017
A. AUTHORIZATION OF PUF BOND PROCEEDS FOR LERR, STARs, OR SIMILAR FUNDED PROGRAMS Article VII, Section 18 (b) of the Texas Constitution authorizes the U. T. System Board of Regents to issue bonds and notes secured by the U. T. System’s interest in the Permanent University Fund for the purpose of:
acquiring land, with or without permanent improvements;
constructing and equipping buildings or other permanent improvements;
major repair and rehabilitation of buildings and other permanent improvements;
acquiring capital equipment; and
acquiring library books and library materials. It is for the last three purposes noted above that the U. T. System Board of Regents has established the LERR, Faculty STARs, and similar funded programs.
B. RETENTION OF RECORDS The Internal Revenue Service requires that invoice documentation supporting capital expenditures, including LERR, Faculty STARs and similar programs funded with proceeds of tax‐exempt bonds, be maintained for a period ending three (3) years after the complete extinguishment of the bonds. Pursuant to the Texas Constitution, PUF bonds may be structured with a maximum maturity of 30 years. In order to comply with the IRS requirement and UTS 181 Policy for Post Bond Issuance Federal Tax Compliance, U. T. institutions shall maintain invoice documentation for 35 years for any capital expenditures funded with tax‐exempt proceeds.
C. ELIGIBILITY FOR PROGRAM FUNDS Eligibility for LERR, STARs, or other similar funded programs is the same as eligibility for PUF bond proceeds as set forth in the Constitution. Eligible entities include U. T. System Administration, all U. T. academic institutions except for U. T. Brownsville, and all U. T. health institutions.
U. T. System Office of the Controller 65

D. GENERAL GUIDELINES FOR USE OF PROGRAM FUNDS In addition to meeting the constitutional requirements outlined above, the general guideline to determine whether an item is eligible for LERR, Faculty STARs, or similar funded programs, is that it must have a useful life of at least one year. The following sections are provided to assist with that determination. These guidelines are not intended to be exhaustive and any questions regarding LERR, Faculty STARs, or similar funded program eligibility should be directed to the U. T. System Administration Office of the Controller. Repair and Rehabilitation of Buildings or Other Permanent Improvements Major repairs or rehabilitation of buildings or other permanent improvements include, but are not limited to, repairs, renovations, replacements, or betterments that are normally expected to extend the useful life, improve operating efficiency, eliminate health and safety hazards, correct structural or mechanical defects, upgrade the quality of existing facilities, or convert these assets to more useful functions, but that are not considered routine maintenance. The cost of major repairs or rehabilitation of buildings or other improvements can include the contract price or cost of construction and other costs that would be applicable to make the building or improvement suitable for its intended use. Acquisition of Capital Equipment Capital equipment is generally regarded as nonexpendable, tangible personal property having a useful life of more than one year. The acquisition cost for equipment includes the net invoice price, including any modifications, attachments, accessories, or auxiliary apparatus necessary to make it usable for the purpose for which it is acquired. In addition, taxes, duty, in‐transit insurance, freight, and installation charges are also included as part of the acquisition cost. Capital equipment, including software, that will be used systemwide, or between and among U. T. institutions and System Administration, is eligible for LERR, Faculty STARs, or similar program funds. Warranties and Similar Service Features
The cost of warranties and similar service features related to a purchase of capital equipment (such as maintenance agreements and loaner programs) are not eligible for LERR, Faculty STARs, or similar program funds as these are considered operating expenses. This ineligibility also applies to warranty and similar service feature costs separately identified during original purchase. For example, a warranty agreement charge that is separately identified on a Laptop purchase is not allowed. Software
Any capitalized costs associated with the development or implementation of software, including personnel costs (salaries), are eligible for LERR, Faculty STARs, or similar funded programs if they are incurred in the Application Development Stage. This principle applies whether the salaries are paid to employees of the institution or to outside parties. See UTS 142.13 Accounting and Financial Reporting for Intangible Assets at http://www.utsystem.edu/bor/procedures/policy/policies/uts142_13.html. Training costs related to software usage are discussed below. The purchase of bundled software included as part of the initial acquisition of computer hardware is capitalizable regardless of threshold and therefore eligible for LERR, Faculty STARs, or similar program funds.
U. T. System Office of the Controller 66
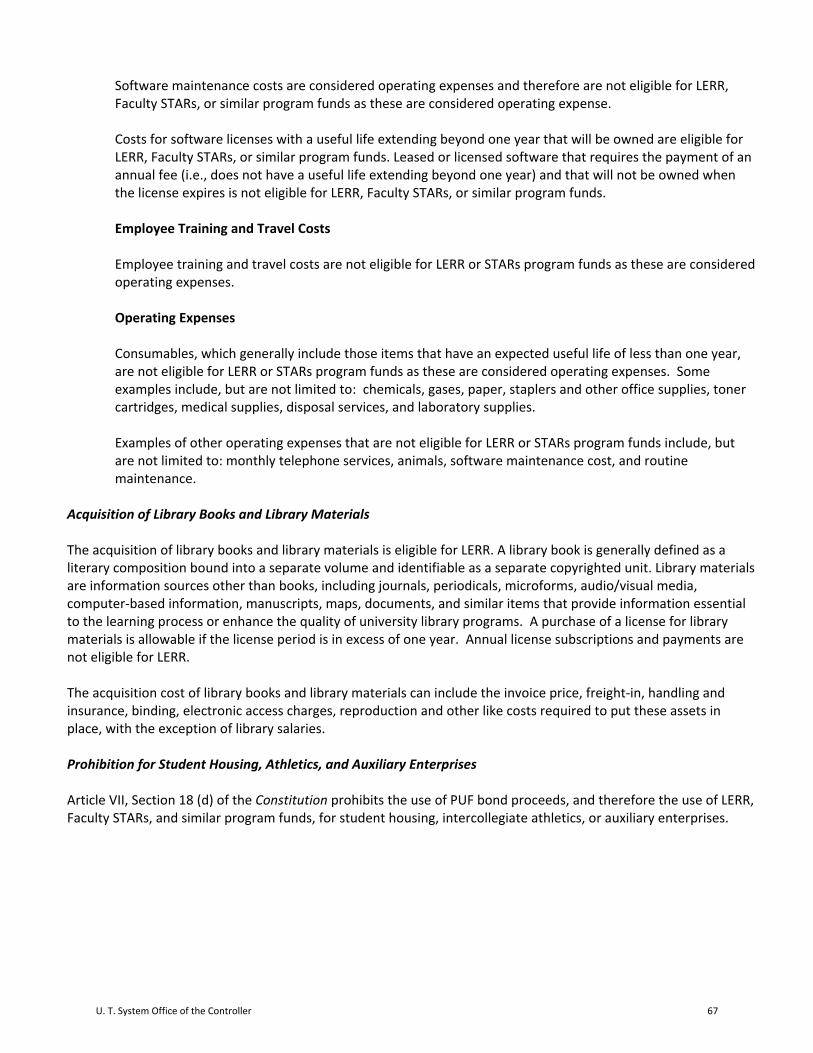
Software maintenance costs are considered operating expenses and therefore are not eligible for LERR, Faculty STARs, or similar program funds as these are considered operating expense. Costs for software licenses with a useful life extending beyond one year that will be owned are eligible for LERR, Faculty STARs, or similar program funds. Leased or licensed software that requires the payment of an annual fee (i.e., does not have a useful life extending beyond one year) and that will not be owned when the license expires is not eligible for LERR, Faculty STARs, or similar program funds.
Employee Training and Travel Costs Employee training and travel costs are not eligible for LERR or STARs program funds as these are considered operating expenses. Operating Expenses Consumables, which generally include those items that have an expected useful life of less than one year, are not eligible for LERR or STARs program funds as these are considered operating expenses. Some examples include, but are not limited to: chemicals, gases, paper, staplers and other office supplies, toner cartridges, medical supplies, disposal services, and laboratory supplies. Examples of other operating expenses that are not eligible for LERR or STARs program funds include, but are not limited to: monthly telephone services, animals, software maintenance cost, and routine maintenance.
Acquisition of Library Books and Library Materials The acquisition of library books and library materials is eligible for LERR. A library book is generally defined as a literary composition bound into a separate volume and identifiable as a separate copyrighted unit. Library materials are information sources other than books, including journals, periodicals, microforms, audio/visual media, computer‐based information, manuscripts, maps, documents, and similar items that provide information essential to the learning process or enhance the quality of university library programs. A purchase of a license for library materials is allowable if the license period is in excess of one year. Annual license subscriptions and payments are not eligible for LERR. The acquisition cost of library books and library materials can include the invoice price, freight‐in, handling and insurance, binding, electronic access charges, reproduction and other like costs required to put these assets in place, with the exception of library salaries. Prohibition for Student Housing, Athletics, and Auxiliary Enterprises Article VII, Section 18 (d) of the Constitution prohibits the use of PUF bond proceeds, and therefore the use of LERR, Faculty STARs, and similar program funds, for student housing, intercollegiate athletics, or auxiliary enterprises.
U. T. System Office of the Controller 67
E. SPECIAL PROGRAM FUNDING Faculty STARs Program The Faculty STARs program funded by PUF bond proceeds supports the recruitment and retention of the best‐qualified faculty at both academic and health institutions by providing additional resources to build and enhance research infrastructure. Because the STARs program is funded in the same manner as LERR, the same guidelines apply and each item must have a useful life of more than one year. STARs funds are available for laboratory renovation and equipment purchases; however, faculty and other staff salaries cannot be paid from STARs funds. There are three related program goals that form the basis of the STARs program:
recruit senior faculty with national prominence; and
improve the quality of new faculty and research capacity of the institutions by augmenting the start‐up packages for tenure and tenure‐track faculty; and
retain high quality faculty who have had offers from another research institution or have the potential to leave because of limited access to quality equipment or laboratories.
U. T. System Office of the Controller 68