Embed Size (px)
Citation preview

Research, Development, and TechnologyTurner-Fairbank Highway Research Center6300 Georgetown PikeMcLean, VA 22101-2296
Operating Characteristics of theSegwayTM Human Transporter
PubliCaTiOn nO. FHWa-HRT-10-025 june 2010

FOREWORD
The objective of this research was to examine the operating characteristics of the SegwayTM Human Transporter (HT). This final report provides empirical data on SegwayTM HT acceleration and stopping distance (both planned and unplanned stops) as well as riders’ approach speed and clearance distance when navigating around obstacles. Such information can support a rational approach to the incorporation of SegwayTM HT traffic into regulating, planning, designing, and controlling shared-use paths and roadways. The results of the research described here will provide practitioners and policy makers with data to make informed decisions related to the use of SegwayTM HTs on shared-use facilities.
Monique R. Evans Director, Office of Safety Research and Development
Notice This document is disseminated under the sponsorship of the U.S. Department of Transportation in the interest of information exchange. The U.S. Government assumes no liability for the use of the information contained in this document. The U.S. Government does not endorse products or manufacturers. Trademarks or manufacturers’ names appear in this report only because they are considered essential to the objective of the document.
Quality Assurance Statement The Federal Highway Administration (FHWA) provides high-quality information to serve Government, industry, and the public in a manner that promotes public understanding. Standards and policies are used to ensure and maximize the quality, objectivity, utility, and integrity of its information. FHWA periodically reviews quality issues and adjusts its programs and processes to ensure continuous quality improvement.

TECHNICAL REPORT DOCUMENTATION PAGE 1. Report No. FHWA-HRT-10-025
2. Government Accession No.
3. Recipient’s Catalog No.
4. Title and Subtitle Operating Characteristics of the SegwayTM Human Transporter
5. Report Date June 2010 6. Performing Organization Code:
7. Author(s) Sheryl Miller, Jason Kennedy, John Molino, Amanda Emo, Gabriel Rousseau, Carol Tan, and Ann Do
8. Performing Organization Report No.
9. Performing Organization Name and Address SAIC 8301 Greensboro Drive M/S E-12-3 McLean, VA 22102
10. Work Unit No. 11. Contract or Grant No. DTFH61-08-C-00006
12. Sponsoring Agency Name and Address Turner-Fairbank Highway Research Center Federal Highway Administration 6300 Georgetown Pike McLean, VA 22101-2296
13. Type of Report and Period Covered Final Report, 2003–2009 14. Sponsoring Agency Code HRDS-07
15. Supplementary Notes The FHWA Contracting Officer’s Technical Representative (COTR) was Christopher Monk. 16. Abstract The SegwayTM Human Transporter (HT) is one of several low-speed transportation devices (e.g., bikes, scooters, wheelchairs) that, under certain circumstances, travels on sidewalks, roadways, and other shared-use paths. The objective of this research was to examine the primary operating characteristics of the SegwayTM HT. Research was conducted at the Federal Highway Administration’s Turner-Fairbank Highway Research Center on a closed sidewalk course. Speed and stopping distance were examined for experienced riders, and speed and clearance distance in the presence of obstacles were examined for experienced and novice riders. Overall, both experienced and novice riders were able to navigate the sidewalk course without difficulties. The results provided empirical data regarding the operating characteristics of the SegwayTM HT in relation to acceleration and stopping distance (for both planned and unplanned stops) as well as approach speed and clearance distance when navigating around obstacles. Such information is needed to develop a rational approach to incorporate SegwayTM HT traffic into regulating, planning, designing, and controlling shared-use paths and roadways. The SegwayTM HT represents just one of many unconventional transportation modes that may share these facilities in the future. The methodologies described may prove useful in determining the operating characteristics of these other modes, as well. 17. Key Words SegwayTM HT, Travel speed, Approach speed, Stopping distance, Clearance distance, Operating characteristics, Sidewalks, Shared-use paths
18. Distribution Statement No restrictions. This document is available through the National Technical Information Service, Springfield, VA 22161.
19. Security Classif. (of this report) Unclassified
20. Security Classif. (of this page) Unclassified
21. No. of Pages 64
22. Price
Form DOT F 1700.7 (8-72) Reproduction of completed page authorized

ii
SI* (MODERN METRIC) CONVERSION FACTORS APPROXIMATE CONVERSIONS TO SI UNITS
Symbol When You Know Multiply By To Find Symbol LENGTH
in inches 25.4 millimeters mm ft feet 0.305 meters m yd yards 0.914 meters m mi miles 1.61 kilometers km
AREA in2 square inches 645.2 square millimeters mm2
ft2 square feet 0.093 square meters m2
yd2 square yard 0.836 square meters m2
ac acres 0.405 hectares ha mi2 square miles 2.59 square kilometers km2
VOLUME fl oz fluid ounces 29.57 milliliters mL gal gallons 3.785 liters L ft3 cubic feet 0.028 cubic meters m3
yd3 cubic yards 0.765 cubic meters m3
NOTE: volumes greater than 1000 L shall be shown in m3
MASS oz ounces 28.35 grams glb pounds 0.454 kilograms kgT short tons (2000 lb) 0.907 megagrams (or "metric ton") Mg (or "t")
TEMPERATURE (exact degrees) oF Fahrenheit 5 (F-32)/9 Celsius oC
or (F-32)/1.8 ILLUMINATION
fc foot-candles 10.76 lux lx fl foot-Lamberts 3.426 candela/m2 cd/m2
FORCE and PRESSURE or STRESS lbf poundforce 4.45 newtons N lbf/in2 poundforce per square inch 6.89 kilopascals kPa
APPROXIMATE CONVERSIONS FROM SI UNITS Symbol When You Know Multiply By To Find Symbol
LENGTHmm millimeters 0.039 inches in m meters 3.28 feet ft m meters 1.09 yards yd km kilometers 0.621 miles mi
AREA mm2 square millimeters 0.0016 square inches in2
m2 square meters 10.764 square feet ft2
m2 square meters 1.195 square yards yd2
ha hectares 2.47 acres ac km2 square kilometers 0.386 square miles mi2
VOLUME mL milliliters 0.034 fluid ounces fl oz L liters 0.264 gallons gal m3 cubic meters 35.314 cubic feet ft3
m3 cubic meters 1.307 cubic yards yd3
MASS g grams 0.035 ounces ozkg kilograms 2.202 pounds lbMg (or "t") megagrams (or "metric ton") 1.103 short tons (2000 lb) T
TEMPERATURE (exact degrees) oC Celsius 1.8C+32 Fahrenheit oF
ILLUMINATION lx lux 0.0929 foot-candles fc cd/m2 candela/m2 0.2919 foot-Lamberts fl
FORCE and PRESSURE or STRESS N newtons 0.225 poundforce lbf kPa kilopascals 0.145 poundforce per square inch lbf/in2
*SI is the symbol for th International System of Units. Appropriate rounding should be made to comply with Section 4 of ASTM E380. e(Revised March 2003)

iii
TABLE OF CONTENTS
CHAPTER 1. INTRODUCTION AND BACKGROUND ........................................................ 1 STATEMENT OF PROBLEM .............................................................................................. 1 RESEARCH GOALS ............................................................................................................. 1 BACKGROUND ..................................................................................................................... 2 RESEARCH QUESTIONS .................................................................................................... 4
CHAPTER 2. METHODOLOGY ............................................................................................... 7 INTRODUCTION................................................................................................................... 7 PHASE I ................................................................................................................................... 7
Experimental Design ........................................................................................................... 7 Participants .......................................................................................................................... 7 Equipment and Environment .............................................................................................. 8 Procedure ............................................................................................................................ 9 Data Analysis .................................................................................................................... 10 Variables Analyzed ........................................................................................................... 11
PHASE II ............................................................................................................................... 12 Experimental Design ......................................................................................................... 12 Participants ........................................................................................................................ 13 Equipment and Environment ............................................................................................ 13 Procedure .......................................................................................................................... 15 Data Analysis .................................................................................................................... 18
CHAPTER 3. RESULTS ............................................................................................................ 19 SPEED .................................................................................................................................... 19
Travel Speed ..................................................................................................................... 19 Approach Speed ................................................................................................................ 19 Acceleration ...................................................................................................................... 24
DISTANCE ............................................................................................................................ 25 Stopping Distance ............................................................................................................. 25 Clearance Distance............................................................................................................ 28
CHAPTER 4. DISCUSSION AND RECOMMENDATIONS ................................................ 33 DISCUSSION ........................................................................................................................ 33 RECOMMENDATIONS ...................................................................................................... 35
APPENDIX: PARTICIPANT FORMS AND INSTRUCTIONS ........................................... 37
ACKNOWLEDGEMENTS ....................................................................................................... 55
REFERENCES ............................................................................................................................ 57

iv
LIST OF FIGURES
Figure 1. Photo. A rider on a SegwayTM HT ................................................................................... 1 Figure 2. Illustration. Stopping distance course .............................................................................. 9 Figure 3. Illustration. Unplanned and planned stops .................................................................... 11 Figure 4. Illustration. Narrow and wide sections of the experimental sidewalk........................... 14 Figure 5. Photo. Wide section of the experimental sidewalk (without tape) ................................ 16 Figure 6. Photo. Narrow section of the experimental sidewalk (without tape) ............................ 17 Figure 7. Graph. Mean speed during the return trip as a function of distance traveled in each speed key .......................................................................................................................... 24

v
LIST OF TABLES
Table 1. Specifications of the SegwayTM HT i Series ..................................................................... 2 Table 2. SegwayTM HT rider characteristics observed by Landis et al ........................................... 4 Table 3. Number of trials by experimental condition per participant ............................................. 7 Table 4. Number of trials performed by each participant ............................................................. 13 Table 5. Mean observed travel speeds for the three speed keys ................................................... 19 Table 6. Results of ANOVAs for approach speed ........................................................................ 20 Table 7. Mean approach speed comparing obstacle conditions .................................................... 21 Table 8. Mean approach speed comparing experimental sidewalk sections ................................ 21 Table 9. Mean approach speed comparing trial effect .................................................................. 22 Table 10. Mean approach speed for obstacles on a wide sidewalk .............................................. 22 Table 11. Mean approach speed for obstacles on a narrow sidewalk ........................................... 23 Table 12. Mean approach speed overall ....................................................................................... 23 Table 13. Mean braking time and mean braking distance for planned stops ................................ 25 Table 14. Mean response time and mean response distance for unplanned stops ........................ 26 Table 15. Mean braking time and mean braking distance for unplanned stops ............................ 26 Table 16. Mean total stopping time and mean total stopping distance for unplanned stops ........ 27 Table 17. Comparisons of performance for planned and unplanned stops ................................... 27 Table 18. Results of ANOVAs for clearance distance ................................................................. 28 Table 19. Mean clearance distance comparing baseline versus all obstacle conditions ............... 29 Table 20. Mean clearance distance comparing experimental sidewalk sections .......................... 30 Table 21. Mean clearance distance comparing trial effect ........................................................... 30 Table 22. Mean clearance distance of obstacles on the wide sidewalk ........................................ 31 Table 23. Mean clearance distance of obstacles on the narrow sidewalk ..................................... 31 Table 24. Mean clearance distance overall ................................................................................... 32


1
CHAPTER 1. INTRODUCTION AND BACKGROUND
STATEMENT OF PROBLEM
The SegwayTM Human Transporter (HT), shown in figure 1, is one of several low-speed transportation devices (e.g., bikes, scooters, and wheelchairs) that, under certain circumstances, travels on sidewalks, roadways, and other shared-use paths. The SegwayTM HT is a motorized device that can achieve a top speed of 12.5 mi/h (20.1 km/h). Riders operate the device in a standing position, which allows the SegwayTM HT to have a relatively small footprint. It is necessary to study riders’ behavior under naturalistic sidewalk travel conditions to accommodate SegwayTM HT traffic. However, there is little prior research describing the operating characteristics of SegwayTM HTs under these conditions, and therefore, there is little empirical data to guide traffic engineers, planners, and policy makers.
Figure 1. Photo. A rider on a SegwayTM HT.
RESEARCH GOALS
A SegwayTM HT rider has to manage speed, maneuver the device, pass a variety of objects, and stop in response to environmental stimuli including people, traffic signals, curbs, and obstructions such as light poles and park benches. The available empirical research on the SegwayTM HT is limited. Current literature offers some insight into several performance characteristics, including travel speeds, perception-reaction time, and braking distances. The goal of this research was to answer the following questions:

2
• What are typical travel speeds in each of the three speed limiting controls (operation keys)?
• How fast do riders approach obstacles?
• How do riders accelerate?
• How long does it take riders to stop the device?
• How close do riders come to obstacles?
• Do emergency stops differ from anticipated stops?
• Do novice riders operate the SegwayTM HT differently from experienced riders?
BACKGROUND
The SegwayTM HT made its debut among a small group of users in 2001, and manufacturers began selling it to the general public in early 2003. It is marketed as a self-balancing transportation machine that runs on battery power and uses a combination of gyroscopes, tilt sensors, and computer processors to maintain balance. Table 1 lists the specifications of the i Series SegwayTM HT.
Table 1. Specifications of the SegwayTM HT i Series.(1)
Weight Payload Footprint Platform Height
Speed Limiting Control (Operation Keys)*
Turning Radius
83 lb
Rider
Rider and Optional
Cargo
19 by 25 inches 8.3 inches
Beginner (Black)
Sidewalk (Yellow)
Open Environment
0 degrees 100–
250 lb 260 lb 6 mi/h 8 mi/h 12.5 mi/h 1 mi = 1.61 km 1 lb = 0.454 kg * Indicates that the speed limiting control keys act as a governor to limit the top speed of the SegwayTM HT.
SegwayTM HT regulations such as minimum age requirements; helmet use; and road, sidewalk, and trail use vary by State and community with some jurisdictions having no current regulations. According to the Governors Highway Safety Association, as of November 2008, 43 States and Washington, DC, have enacted legislation allowing the use of SegwayTM HTs, 5 States have no legislation, and 2 States have no statewide prohibitions.(2)
In 2006, the Consumer Products Safety Commission indicated that approximately 23,000 SegwayTM HTs were in operation.(3) Although the actual number of SegwayTM HT riders is unknown, there is still a need to ensure safety. However, there is little available literature on the evaluation of SegwayTM HT usage or safety. Instead, a small number of papers have reported comparison evaluations of the SegwayTM HT among a larger class of personal transportation devices such as motorized scooters, wheelchairs, and bicycles. One

3
issue that needs to be studied is how SegwayTM HT riders interact with other non-SegwayTM HT users on shared-use paths and roadways.
Some non-Federal Highway Administration (FHWA) literature has described the SegwayTM HT in the context of benefits and costs to individual riders and society. Liu and Parthasarathy provided an overview of the potential benefits of riding SegwayTM HTs (e.g., pollution reduction) and potential challenges (e.g., the cost of the device).(4) Litman and Blair suggest features for characterizing different personal mobility devices, including the SegwayTM HT.(5) They characterized the SegwayTM HT as having medium societal value, medium congestion impacts, and medium risk to others when compared to other nonmotorized devices such as individual walkers (high societal value), human-powered bicycles (medium to high risk to others), and equestrians (low societal value). They also suggest what is needed to manage nonmotorized facilities (where SegwayTM HT riders and other users mix), including determining regulations for mixed use, prioritizing users in terms of speed restrictions and yielding hierarchies, and developing education and enforcement policies. While their publication provides an overview of the potential problems associated with SegwayTM HTs in mixed-use settings, it is solely analytical and offers no empirical evidence for the values, impacts, and risks associated with SegwayTM HT use.
Other publications propose empirical research on devices including the SegwayTM HT. Shaheen et al. and Rodier et al. introduced the concept of the SegwayTM HT as a transportation connectivity device.(6,7) They conducted a feasibility analysis and presented a plan for introducing low-speed modes of travel to users of California’s Bay Area Rapid Transit (BART) system. They outlined the typical locations and types of crashes that occur for bicycles, scooters, skateboards, and wheelchairs. The authors concluded that, in general, 63 to 80 percent of low-speed crashes involve low-speed devices, and the highest rate of injury is among skateboarders at 2.15 injuries per 10,000 days of use. They concluded that among all of the modes studied, the risk of injury in low-speed travel is slight. While the SegwayTM HT is part of the proposed BART pilot program, no crash or injury statistics from its use were included in the analysis. This is understandable, given the novelty of the device, but it again confirms the need for empirical evaluation.
In an FHWA-sponsored study, Landis and his colleagues provided one of the few empirical analysis research efforts about SegwayTM HT usage.(8,9) They conducted an experimental field study on trail users, including bicycle riders, in-line skaters, people pushing strollers, wheelchair users, SegwayTM HT riders, and others who were videotaped as they rode through a defined course. The researchers reported a comparative outline of pertinent operating statistics such as physical dimensions of the device, turning radius, speed, braking distance, etc. The results of the SegwayTM HT user performance are presented in table 2. Speed was defined as the normal cruising speed of users on a flat, smooth section of a shared-use facility. The perception-reaction time was defined as the duration between the researcher’s commencement of the stop signal until the initiation of the braking action by the user. Unfortunately, these findings did not include speed key, which indicates the maximum speed that the SegwayTM HT can achieve. For the i Series, the black key is 6 mi/h (9.7 km/h), the yellow key is 8 mi/h (12.8 km/h), and the red key is 12.5 mi/h (20.1 km/h). Thus, it is unclear what speed keys participants used, making it difficult to assess the braking distance and speed data. However, the overall mean speed would indicate that a large percentage of the riders in the Landis et al. study employed the red key, which was

4
the fastest speed. In addition, navigation around obstacles was not evaluated, and the study did not involve novice users.
Table 2. SegwayTM HT rider characteristics observed by Landis et al.(8,9) Characteristics Mean 85th Percentile
Length (inches) 22.00* 22.00 Width (inches) 25.00 25.00 Sweep width (ft) 3.44 3.49 Three-point turn (inches) 38.70 39.40 Eye height (inches) 73.90 70.60 Speed (mi/h) 9.46 10.29 Response time (seconds) 1.06 1.52 Braking distance (ft) 8.80 10.20
1 ft = 0.305 m 1 inch = 25.4 mm * Different than specified by SegwayTM LLC as shown in table 1.
RESEARCH QUESTIONS
The available empirical research on the SegwayTM HT offers a glimpse into several performance characteristics such as travel speed, turning radius, and braking distance. What is not as understood are the situations that riders frequently face in the real world and how they deal with those situations. To determine the most typical situations encountered by SegwayTM HT riders, a naturalistic review was conducted as a part of the present study. This review looked at the following sources of information:
• SegwayTM HT riders.
• Personal experience.
• Policy makers.
• Tour group operations.
The review was used to identify the most typical problems encountered in real sidewalk use by SegwayTM HTs. Real sidewalk conditions can be quite complex, and this complexity needs to be reflected in studies of rider performance to determine how the SegwayTM HT maneuvers in naturalistic settings. The present study investigates the behavior of SegwayTM HT riders and their performance in different operational situations.
The research questions addressed in the present study are as follows:
1. How fast do riders travel?
2. What speed do SegwayTM HT riders use when approaching obstacles?
3. How does speed affect braking distance and time?

5
4. How much time and distance does it take to complete a “planned” stop at a specified location?
5. How much time and distance does it take SegwayTM HT riders to respond to a signal when making an “unplanned” stop at the signal? How much time and distance does it take to complete the stop?
6. How much space (clearance distance) do SegwayTM HT riders use to navigate around obstacles?
7. How do SegwayTM HT riders pass pedestrians?
8. How does sidewalk width affect performance?
9. Does the performance of experienced SegwayTM HT riders differ from that of novice riders?


7
CHAPTER 2. METHODOLOGY
INTRODUCTION
This report investigates various operating characteristics of the SegwayTM HT. The research was conducted in two phases. Phase I evaluated the travel speed and stopping distance of experienced SegwayTM HT users under planned and unplanned stopping conditions, and phase II evaluated the approach speed and clearance distance of the SegwayTM HT around obstacles using novice and experienced riders.
PHASE I
In phase I, experienced SegwayTM HT riders performed a series of tasks while traveling forward on a straight sidewalk closed course for various distances. Riders were asked to ride as fast as they felt comfortable for each speed key. They were instructed to stop at various locations (planned stops) or in response to a signal indicating that they needed to make an immediate stop (unplanned stops).
Experimental Design
The experiment examined the interaction of speed and two types of stops—planned and unplanned stops. The study design is represented in table 3. Planned stops were precision stops that involved riding to a marked location and stopping as close to the marker as possible. Unplanned stops simulated emergency stops where participants were given a signal at a random time and had to stop as quickly as possible. Stops were grouped by type such that participants first made all of the 24 planned or 36 unplanned stops. Participants were randomly assigned to perform either planned or unplanned stops first. Within each stop condition, participants started in the black key, progressed to the yellow key, and then finished in the red key, which was the fastest.
Table 3. Number of trials by experimental condition per participant.
Stop Type
Speed Key Black
(6 mi/h) Yellow (8 mi/h)
Red (12.5 mi/h)
Planned 8 8 8 Unplanned 12 12 12
1 mi = 1.61 km
Participants
Seven experienced SegwayTM HT riders (one woman and six men) ranging from 30 to 64 years old (the mean age was 41.9 years) volunteered to participate in the experiment. Experienced riders were characterized as those who owned the device or had received training from SegwayTM LLC. They were all recruited through the Washington, DC, SegwayTM HT group.(10) The riders participated individually using their own personal devices and received payment of $30 per hour. Each experimental session lasted between 2 and 3 hours.

8
Participants were asked to fill out a demographic questionnaire prior to beginning the experimental sessions (see appendix). According to their responses, participants had owned their SegwayTM HTs for 9 to 19 months (the mean was 13.1 months with a standard deviation (SD) of 3.1 months). They reported traveling with the SegwayTM HT between 2.5 and 50 mi (4.0 to 80.5 km) a week (the mean was 13.9 mi (22.4 km) with an SD of 16.2 mi (26.1 km)). However, six of the participants reported traveling 10 mi (16 km) or less per week. The reason for the disparity in mileage between participants is the different tasks for which they used the SegwayTM
HT. Six reported using the SegwayTM HT for grocery shopping and errands, five reported using it for tourist purposes, and two reported using it for work or to commute. One of the business users reported a weekly travel of 50 mi (80.5 km).
Equipment and Environment
The safety equipment used in this study included helmets, reflective vests, knee pads, elbow pads, and gloves. Participants were also weighed to ensure that they were within the personal body weight range that SegwayTM HT recommends, which is between 100 and 250 lb (45.5 and 114 kg). All other materials, which included a demographic questionnaire, a set of task instructions, an environmental safety checklist, and a follow-up questionnaire, were presented to the participants (see appendix).
The SegwayTM HT used by all of the participants was an i180 model, weighing approximately 83 lb (38 kg) with a maximum speed of 12.5 mi/h (20.1 km/h). This type of SegwayTM HT has a footprint of 19 inches (483 mm) in length by 25 inches (635 mm) in width, and it is steered by twisting the left hand grip.
All data were collected at FHWA’s Turner-Fairbank Highway Research Center (TFHRC) in McLean, VA. A section of sidewalk composed of concrete pavement approximately 375 ft (114 m) long and 10.2 ft (3.1 m) wide was used for field tests. Wide grass lots bordered the sidewalk on two sides. The sidewalk had a curb toward the northeastern driveway, and the sidewalk leveled into a parking lot on the southwest side. A short sidewalk intersected the main walkway, but it was not used in this part of the study.
Figure 2 (not to scale) depicts the sidewalk course used in the experiment. The experimental and training sidewalks formed a closed course and were blocked to normal pedestrian traffic during testing.

9
1 ft = 0.305 m
Figure 2. Illustration. Stopping distance course.
Three cameras were mounted to a mast on the side of the course and elevated approximately 20 ft (6.1 m). These cameras captured approximately 140 ft (42.7 m) of the course. For each trial, participants traveled approximately 150 ft (45.8 m) before they entered camera view. Each session was video recorded.
For the portion of the course within camera range, 1-ft (0.3-m) increments were marked on the sidewalk using durable black tape. Eight stop locations along the course were marked using signs with eight numbers in a random order 10 ft (3.1 m) apart from each other (see figure 2).
The unplanned stops involved a signal light that consisted of a red halogen bulb mounted approximately 4 ft (1 m) above the ground at the end of the course. Researchers used a switch to turn the light on to indicate to participants to stop. The location of the planned stops and the timing of the signal for unplanned stops varied between 40 and 110 ft (12 and 33.6 m) from the start of the video recorded course. Two sets of these locations were randomly ordered and presented to participants who were randomly assigned to receive one or the other presentation order.
Procedure
Upon arrival, each participant was greeted at the security desk and escorted to the participant preparation area. They read an informed consent form and had the opportunity to ask questions. Each participant was then weighed and given a demographic questionnaire to obtain information

10
about rider characteristics and travel experience (see appendix). Finally, the researcher presented a session outline to the participants and described the experiment.
The researcher and participant inspected the SegwayTM HT and the testing environment to identify any hazards. This inspection was guided by a checklist developed during pilot testing and with the assistance of a certified safety professional. This checklist included items such as examining the sidewalk for leaves, branches, and water (see appendix).
Participants had to demonstrate that they could use the SegwayTM HT independently and that they could safely travel 300 ft (91.5 m) at each of the three speeds. The researchers evaluated the participants’ proficiency by monitoring their stability while standing on, mounting, and dismounting the SegwayTM as well as their ability to smoothly accelerate, control the direction of travel, perform stops, and comply with safety procedures.
Following a brief rest period, each participant performed a combined total of 60 unplanned and planned stop trials (see table 3), with 20 trials for each of the three speed keys. The participants began from the start line and rode forward on a straight course along the sidewalk. They were asked to ride as fast as they felt it was safe in each key.
Planned Stops
At the beginning of each trial for the planned stops, participants were told to come to a complete stop at a particular location, which was marked alongside the sidewalk.
Unplanned Stops
For unplanned stops, participants were told to safely stop as quickly as possible when the red signal light at the end of the course was displayed.
General Procedure
At the end of each trial, participants were asked to rate how comfortable and controlled the ride was. These data were not analyzed and are not presented in this report. After completing all trials, the participants and the researcher discussed the SegwayTM HT’s characteristics and their use of the SegwayTM HT during the study. Then, each participant was debriefed and received a brief explanation of how the results of the study would be used to evaluate SegwayTM HT rider performance. Each participant was then paid $30 per hour for participating.
Data Analysis
Data collection included approximately 18 hours of video data showing participants riding and stopping along 140 ft (42.7 m) of the sidewalk course. The data were reduced by visual inspection and coding by the researchers. Below is a description of the variables that were measured. Note that stopping time and distance were measured in slightly different ways for planned and unplanned stops. Unplanned stops, which involved a signal simulating an emergency braking situation, contained a response component. They were measured in response time and distance as well as in braking time and distance. These trials were measured from the signal activation to the completion of braking (see figure 3, which is not to scale). Planned stops

11
at a specified location marker were measured from initiation to completion of braking. Specifically, they were measured in braking time and distance (see figure 3).
CourseStart
CourseEnd
StopSignal“On”
Response Braking
Total Stopping
CourseStart
CourseEnd
StopSignal“Off”
Braking
a) Unplanned Stops
b) Planned Stops
Location Marker # 1
Location Marker # 1
CourseStart
CourseEnd
StopSignal“On”
Response Braking
Total Stopping
CourseStart
CourseEnd
StopSignal“Off”
Braking
a) Unplanned Stops
b) Planned Stops
Location Marker # 1
Location Marker # 1
Figure 3. Illustration. Unplanned and planned stops.
Variables Analyzed
Travel Speed
Travel speed was measured as the average speed traveled over the first 30 ft (9.2 m) of the course that was in camera range. To determine this, speed was measured over three 10-ft (3.1-m) increments and averaged. Speed was determined by counting the number of video frames per 1-ft (0.305-m) increments traveled to calculate the duration (15 frames/s). Participants traveled for approximately 150 ft (45.6 m) before entering camera range, allowing them to reach their desired travel speed. At the end of the experiment, 416 of a possible 420 trials were completed with adequate data. Of the 416 completed trials, 240 of them (57 percent) were based on measurement across all 30 ft (9.2 m). Because some course markers were not visible due to camera angle and/or glare, some measurements were based on a smaller distance. A total of 103 out of 416 trials (25 percent) were based on speed across 20 ft (6.1 m), and 73 out of 416 trials (18 percent) were based on speed across less than 20 ft (6.1 m).
Response Time
Response time was measured as the time between the activation of the red signal light and the observation that the participant initiated a stop. Stop initiation was a subjective judgment made

12
by the experimenter, observing whether the participant had made a motion or a postural change to slow the device. Such judgments were possible because riders stopped the device by leaning backwards. Prior to coding the data, the researchers were trained on the observed rider behaviors that indicate the initiation of a stop.
Response Distance
Response distance was the distance traveled by the participants during the time between the activation of the signal light and the observation that the participants initiated a stop.
Braking Time
Braking time was the time after initiation of a stop that it took for participants to come to a complete stop as observed by the experimenters. A complete stop was indicated by a cessation of forward motion. The researchers were trained on the observed rider posture that indicated a completed stop.
Braking Distance
Braking distance was the distance traveled by the participants during the time between the observed initiation and the completion of a stop.
Acceleration
Acceleration profiles were determined through observing participants’ “return trip.” Following each stopping trial, participants had to turn around and return to the start line. Researchers recorded speed and travel time over approximately 100 ft (30.5 m) of this return trip (speed was measured over 10-ft (3.1-m) increments) to determine the acceleration profile of participants.
PHASE II
Phase II of the experiment investigated navigation around obstacles. Previous research provided only basic performance information such as rider speed and stopping behavior in controlled environments where no sidewalk obstacles were present. Real sidewalk conditions can be complex. They include a variety of travel modes (pedestrians, wheelchairs, bicyclists, skaters, etc.) and static objects (light posts, trash cans, benches, trees, etc.) often compressed into a small area and sometimes requiring rapid and tight navigation maneuvers. In phase II, experienced and novice SegwayTM riders rode on a closed sidewalk course with obstacles to provide information on rider behavior related to approach speed and clearance distance in the presence of obstacles.
Experimental Design
Phase II examined the speed and passing behavior of novice and experienced riders on two different sections of sidewalk. The study design is represented in table 4. The first sidewalk section was wide and involved riding past pedestrians and inanimate objects. The second sidewalk section was narrow and involved riding past inanimate objects only. Trials were grouped by sidewalk and obstacle type. Participants started each trial from a random starting

13
point and used the yellow speed key during the entire experiment because the novice participants were not trained in the highest speed key (red).
Table 4. Number of trials performed by each participant.
Sidewalk Type
Obstacle Type No
Obstacles (Baseline)
Pedestrian Towards
Pedestrian Same
Direction
Barrel and
Cone Barrel
Barrel and Channel Barriers
Channel Barriers
Wide 3 3 3 3 N/A N/A N/A Narrow 3 N/A N/A N/A 3 3 3
Note: N/A indicates that the condition was not run.
Participants
The research participants consisted of 10 novice and 10 experienced SegwayTM HT riders. To be classified as experienced, participants had to have used a SegwayTM HT for a minimum of 6 months and had to have ridden a SegwayTM HT a minimum of once per week during that period. To qualify as a novice rider, the participants had to have had no SegwayTM HT experience or to have ridden a SegwayTM HT for less than 10 minutes. All participants met the following criteria:
• Were capable of operating the steering control with the left hand.
• Were at least 18 years of age.
• Were physically and medically qualified for participation.
• Were capable of stepping on and off the 8.3-inch (210-mm)-high SegwayTM HT platform.
• Weighed at least 100 lb (45.5 kg) and no more than 250 lb (114 kg).
• Were not pregnant.
Potential participants were administered a prescreening questionnaire to ensure their eligibility for participation. Participants were paid $30 per hour. Experienced riders completed the experiment in about 2 hours, and the novice participants took about 3 hours to complete the experiment because of the extra training required for them to become accustomed to riding the SegwayTM HT. The novice participants consisted of six men and four women who ranged from 22 to 77 years old (the mean age was 46.9 years). Of the seven experienced riders from phase I, four returned to participate in phase II. The experienced participants consisted of all men and ranged from 35 to 68 years old (the mean age was 52.2 years). There were no experienced female SegwayTM HT riders available to select as participants.
Equipment and Environment
FHWA provided the SegwayTM HT used in phase II. The SegwayTM HT (i180 model) was equipped with a downward-facing camera mounted on the front of the control shaft. A digital media recorder was placed in an onboard travel pack that was attached to the handle bar to

14
record the video of the downward-facing camera. Animate obstacles consisted of staged pedestrians (experimenters wearing orange safety vests) who walked along one side of the sidewalk. Inanimate obstacles included standard rubber or plastic devices employed for temporary traffic control. These consisted of a traffic cone, a barrel, and channel barriers. The cone had a diameter at the base of 10.8 inches (274.3 mm) and a height of 17 inches (431 mm). The barrel had a diameter of 22 inches (559 mm) and a height of 39.9 inches (1,013.5 mm). Each barrier section had a height of 36.1 inches (916.9 mm) and a length of 34.1 inches (866.1 mm). Four such barrier sections were employed—two on each side of the sidewalk. All of these traffic control devices were orange, and the obstacles were employed on different portions of the sidewalk under various conditions. Obstacles were used separately under most conditions with the exception of two. The barrel and cone were combined in one condition on the wide sidewalk, and the barrier and barrel were combined in another condition on the narrow sidewalk. Figure 4 shows a diagram of all of the obstacles on the narrow and wide sections of the experimental sidewalk (not to scale).
Figure 4. Illustration. Narrow and wide sections of the experimental sidewalk.
As in phase I, the experimental course in phase II consisted of portions of concrete sidewalk on the grounds of FHWA’s TFHRC. The wide section of experimental sidewalk was 10.2 ft (3.1 m) wide and consisted of two parts in an L-shaped configuration. The initial part of this section was 32.3 ft (9.9 m) long, and the subsequent perpendicular part was about 15 ft (4.6 m) long. The narrow section of experimental sidewalk was also 10.2 ft (3.1 m) wide, but it was restricted by white tape to 4.4 ft (1.3 m) wide. This width was selected because it fell between the minimum sidewalk widths recommended by the Americans with Disabilities Act Accessibility Guidelines for Buildings and Facilities (ADAAG) and the American Association of State Highway and Transportation Officials (AASHTO).(11,12) AASHTO recommends a 4-ft (1.2-m) minimum clear sidewalk width.(12) However, AASHTO also recommends that sidewalks less than 5 ft (1.5 m) should have passing space of at least 5 ft (1.5 m) at reasonable intervals.(13) ADAAG states that 4 ft (1.2 m) is the minimum width for a wheelchair and one ambulatory person to pass each other.(11) For this narrow sidewalk section, participants were instructed not to ride outside the white tape demarcation. This narrow section was about 30 ft (9.1 m) long. Both the wide and the narrow sections were marked with transverse strips of black tape for measuring speed by means of the downward-facing camera mounted on the SegwayTM HT. The major transverse markings were
Legend
= Cone = Barrel = Pedestrian = Channel Barrier
Wide Sidewalk Narrow Sidewalk

15
5 ft (1.5 m) apart, and they had a distance scale painted on them for measuring lateral distance by means of the same camera. Tests were conducted on a dry concrete sidewalk in the absence of any rain, snow, or ice. The experiment took place in November 2005, with an average ambient temperature of about 58 °F (14 °C). The experimental and training sidewalks represented a closed course and were blocked to normal pedestrian traffic during testing.
Procedure
Before data collection began, participants read a brief study overview explaining the purpose of the experiment, read and signed an informed consent form, and were weighed (see appendix). Participants also watched a safety video on the proper use of the SegwayTM HT. Upon completion of this video, participants were outfitted with protective gear including a reflective vest, helmet, knee pads, elbow pads, and gloves.
Novice participants received additional training for about 30–45 minutes to learn how to ride the SegwayTM HT as well as basic operations such as how to start, stop, ride forward, move backward, turn, avoid objects, and ride forward at various speeds (black and yellow speed keys). The training was devised from materials provided by the manufacturer and by tour companies who regularly train large numbers of SegwayTM HT riders. Part of this training was conducted on the same sections of sidewalk that were used in the experimental trials. The researchers used a standard procedure and checklist to confirm that novice participants were all trained to the same criteria prior to beginning their experimental trials (see appendix). During the experiment, participants always operated the SegwayTM HT in the yellow speed key, allowing a maximum speed of 8 mi/h (12.8 km/h). Before each session of trials, an environmental safety checklist was used to check the course and clear any objects or debris which might have affected SegwayTM HT operation (see appendix).
Participants were instructed to proceed forward along the first part of the L-configuration sidewalk, make a right turn onto the second part of the L-configuration, proceed forward, make a U-turn, retrace their route back to the beginning, and stop. Such a drive constituted one wide sidewalk path trial under one condition. There were three different starting positions along the lateral dimension of the sidewalk so that the participants sometimes approached the first obstacle from a somewhat different angle on the first portion of each drive. Figure 5 shows one of the conditions on the wide section of the experimental sidewalk (without tape).

16
Figure 5. Photo. Wide section of the experimental sidewalk (without tape).
Each participant started at each of these lateral positions once for each of the three trials, with the position being assigned in a random order for each experimental condition. Participants were asked to rate how comfortable and controlled the ride was at the end of each trial. These data were not analyzed and therefore are not presented in this report.
The second, narrow section of the course was demarcated by white tape on a nearby stretch of sidewalk. Participants were instructed to proceed forward, stay within the bounds of the white tape markings, exit the narrow section, make a U-turn, retrace their route back to the beginning, and stop. The drive constituted one narrow path trial under one condition. Each participant completed three such trials under each experimental condition. There were three different starting positions along the lateral dimension of the sidewalk so the participants sometimes approached the first obstacle from a somewhat different angle on the first portion of each drive. Figure 6 shows one of the conditions on the narrow section of the experimental sidewalk (without tape).

17
Figure 6. Photo. Narrow section of the experimental sidewalk (without tape).
Conditions were defined by the presence or absence of an obstacle on the sidewalk. The eight conditions for the phase II experiment were as follows:
• Wide sidewalk with no obstacles (baseline).
• Wide sidewalk with a pedestrian walking towards the participant.
• Wide sidewalk with a pedestrian walking in same direction as the participant.
• Wide sidewalk with a barrel in the straightaway and a cone in the turn (obstacles analyzed separately).
• Narrow sidewalk with no obstacles (baseline).
• Narrow sidewalk with a barrel tangent to one edge of sidewalk.
• Narrow sidewalk with the same barrel and channel barriers on either side of the sidewalk.
• Narrow sidewalk with only channel barriers on either side of sidewalk.
Since three trials were completed for each condition, each participant made 24 experimental drives; however, the barrel and cone were treated as two conditions and were analyzed separately. Therefore, the total number of condition trials was 27. Upon completion of all the trials on the course, participants removed their protective gear and returned indoors. They then viewed several prerecorded videos involving the SegwayTM HT on a sidewalk and were asked to rate the scenes based on several criteria. These data were not analyzed and therefore are not

18
included in this report. Participants were then debriefed, offered an opportunity to ask questions, paid for their participation, and released.
Data Analysis
Video files from the downward-facing camera on the SegwayTM HT were analyzed to compute the approach speed and clearance distance relative to different obstacles on the sidewalk. For straight sections of sidewalk, two measurement locations were selected for each type of obstacle: (1) the transverse black tape marking directly under the center of the obstacle and (2) the transverse black tape marking 5 ft (1.5 m) before that marking. For curved sections of sidewalk, the marking before the obstacle was at a varying distance depending on the radius of the travel path.
Measurements were taken from the video files of lateral position and time of passage at each of these markings. The markings under the center of the obstacle were used to compute lateral passing distance (from the obstacle edge), and both markings were used to compute speed when approaching the obstacle. In the case of extended obstacles (walking pedestrians and longitudinal barriers), the transverse black tape marking on the sidewalk where the center of the barrel was normally placed (barrel absent) was selected as the longitudinal reference measurement location. This location represented the approximate longitudinal center of the particular test section of the straight sidewalk (wide or narrow). This location was also used to determine the baseline lateral position in the sidewalk when there were no obstacles present. In the case of the wide sidewalk section with the L-configuration, the transverse black tape marking on the sidewalk where the center of the cone was normally placed (cone absent) was selected as the longitudinal reference measurement location for the baseline condition.
For the wide sidewalk condition trials, only the outbound passage of each obstacle was measured after the participants had left the starting position for that trial and before they had completed the U-turn to return back to the starting position. The wider sidewalk offered more freedom for lateral movement, and only the first passage started in a controlled manner and was less influenced by immediately preceding driving behavior. For the narrow sidewalk condition, both the first passage and the return passage were measured for each obstacle since there was less space, and clearance differences were smaller.
For all obstacles, clearance distances were computed from the nearest edge of the obstacle to the nearest edge (wheel) of the SegwayTM HT. For moving obstacles (walking pedestrians), the clearance distance was computed from the estimated inside shoulder edge of the passing pedestrian to the nearest wheel of the SegwayTM HT. The travel speeds of the pedestrian and the SegwayTM HT were not synchronized at the single point of measurement. Thus, at the instant of measurement, sometimes the pedestrian was somewhat ahead of the SegwayTM, somewhat behind the SegwayTM HT, or directly adjacent to the SegwayTM HT. Consequently, for the pedestrian conditions on the wide sidewalk, passing clearance distance had to be estimated from a separately measured average inside shoulder position of 33.5 inches (850.9 mm) from the edge of the sidewalk. The pedestrian was either walking in the opposite or same direction as the moving SegwayTM HT.
19
CHAPTER 3. RESULTS
The results related to travel speed, approach speed, acceleration, stopping distance (planned and unplanned stops), and clearance distance are presented in the following sections.
SPEED
Travel Speed
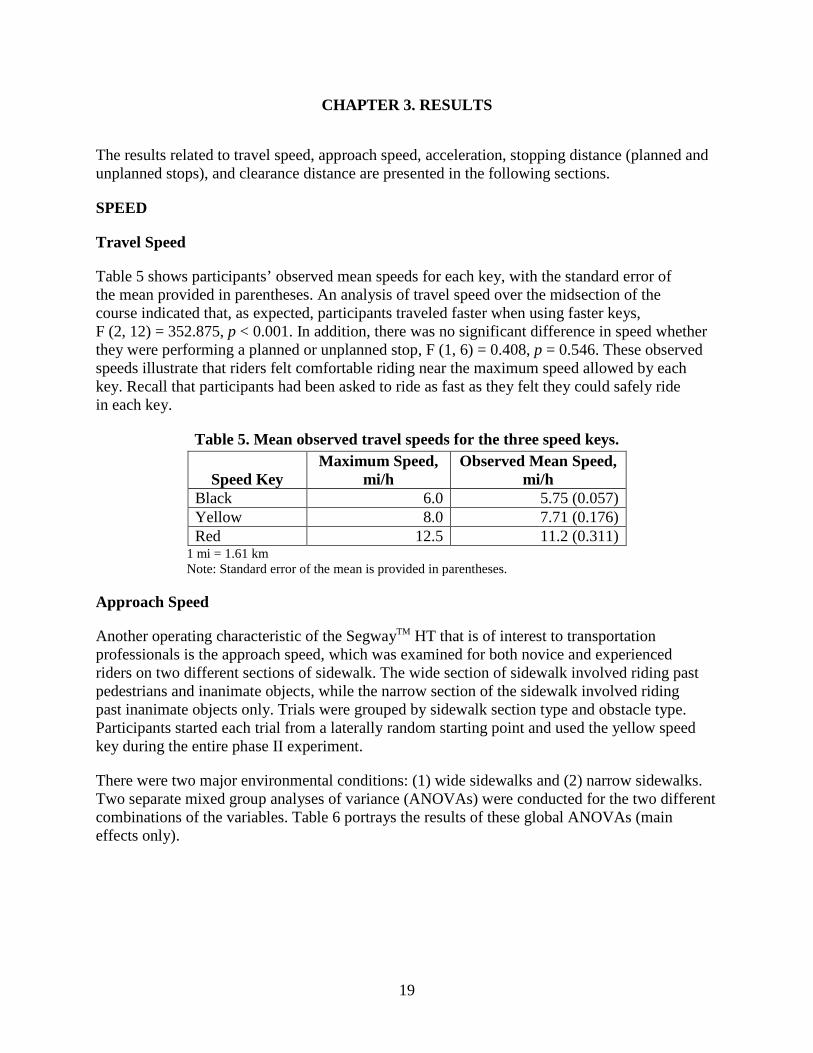
Table 5 shows participants’ observed mean speeds for each key, with the standard error of the mean provided in parentheses. An analysis of travel speed over the midsection of the course indicated that, as expected, participants traveled faster when using faster keys, F (2, 12) = 352.875, p < 0.001. In addition, there was no significant difference in speed whether they were performing a planned or unplanned stop, F (1, 6) = 0.408, p = 0.546. These observed speeds illustrate that riders felt comfortable riding near the maximum speed allowed by each key. Recall that participants had been asked to ride as fast as they felt they could safely ride in each key.
Table 5. Mean observed travel speeds for the three speed keys.
Speed Key Maximum Speed,
mi/h Observed Mean Speed,
mi/h Black 6.0 5.75 (0.057) Yellow 8.0 7.71 (0.176) Red 12.5 11.2 (0.311)
1 mi = 1.61 km Note: Standard error of the mean is provided in parentheses.
Approach Speed
Another operating characteristic of the SegwayTM HT that is of interest to transportation professionals is the approach speed, which was examined for both novice and experienced riders on two different sections of sidewalk. The wide section of sidewalk involved riding past pedestrians and inanimate objects, while the narrow section of the sidewalk involved riding past inanimate objects only. Trials were grouped by sidewalk section type and obstacle type. Participants started each trial from a laterally random starting point and used the yellow speed key during the entire phase II experiment.
There were two major environmental conditions: (1) wide sidewalks and (2) narrow sidewalks. Two separate mixed group analyses of variance (ANOVAs) were conducted for the two different combinations of the variables. Table 6 portrays the results of these global ANOVAs (main effects only).

20
Table 6. Results of ANOVAs for approach speed. Metric Approach Speed
Statistic F-Value Degrees of Freedom p-Value
Wide Sidewalk E 42.71 (1, 18) < 0.001 T 10.26 (2, 17) 0.001 O 3.64 (4, 15) 0.029
Narrow Sidewalk E 28.56 (1, 18) < 0.001 T 15.00 (2, 108) < 0.001 O 46.45 (3, 108) < 0.001
E = Experience. T = Trial. O = Obstacle.
As can be seen in table 6, three effects were evaluated: (1) the experience of the SegwayTM HT rider, (2) the trial number (an indicator of practice or learning), and (3) the different obstacles in the path. With regard to approach speed on the wide sidewalk, all three independent variables had a statistically significant effect. Only one interaction was statistically significant, which was obstacles by trials (O × T), F (8, 11) = 4.15, p = 0.016, indicating that the nature of the obstacle and trial effects on approach speed may be somewhat different.
In the case of the narrow sidewalk, the outcome was the same as for the wide sidewalk. With regard to approach speed, all three independent variables had a statistically significant effect. Only one interaction was statistically significant, which was the obstacles by experience (O × E), F (3, 108) = 4.88, p = 0.004, indicating that the nature of the obstacle and experience effects on approach speed may be somewhat different.
In summary, the outcomes of the global ANOVAs indicated that the different obstacles in the path had a significant effect on the approach speed of SegwayTM HT riders on both the wide and narrow sidewalk sections. On both types of sidewalk, the experience of the rider and the trial number had a significant effect on the speed with which the rider approached an obstacle.
Obstacle Effect
As can be seen in table 7, for the conditions containing obstacles in the path, the mean overall approach speed was 4.5 mi/h (7.3 km/h) for all participants. In the table, standard errors are shown in parentheses. Across all participants, the mean baseline speed was 1.0 mi/h (1.6 km/h) faster than the mean speed approaching obstacles. This difference in mean approach speed was statistically significant, t (19) = -5.687, p < 0.001. Such a speed differential might be expected between an open pathway with no obstacles and one with obstacles present.

21
Table 7. Mean approach speed comparing obstacle conditions.
Obstacle Condition
Mean Approach Speed of Participants, mi/h
All Novice Experienced Baseline 5.5 (0.35) 4.3 (0.28) 6.6 (0.34) All obstacle conditions 4.5 (0.27) 3.6 (0.24) 5.5 (0.20)
1 mi = 1.61 km Note: Standard errors are provided in parentheses.
Table 7 also reveals that the novice participants approached the obstacles slower than the experienced participants by 1.9 mi/h (3.1 km/h) on average. This difference in mean approach speed was statistically significant, t (18) = -5.993, p < 0.001.
As can be seen in the table, across all participants, the baseline condition revealed a mean speed of 5.5 mi/h (8.8 km/h). In the yellow key mode (medium speed setting), the SegwayTM HT had a maximum speed of 8 mi/h (12.9 km/h). The somewhat lower mean baseline speed was likely a result of the relatively short total length of the sidewalk test sections, which did not allow the participants to accelerate to a maximum travel speed. In phase I, where there was a much longer sidewalk for acceleration, the mean travel speed was 7.7 mi/h (12.4 km/h). Therefore, the results may be more representative of crowded urban conditions than open suburban conditions.
Sidewalk Effect
Table 8 shows the effect of the width of the allowed sidewalk path for all conditions with obstacles present. In the table, standard errors are given in parentheses. For all participants and all obstacles on the wide sidewalk, the mean overall approach speed was 4.8 mi/h (7.8 km/h). On the narrow sidewalk, the participants approached the obstacles slower than on the wide sidewalk by 0.5 mi/h (0.8 km/h) on average, traveling at a mean approach speed of 4.3 mi/h (6.9 km/h). This difference in mean approach speed was statistically significant, t (19) = -2.877, p < 0.001. The slower speed on the narrow sidewalk was probably the result of the constrained navigation space under this condition.
Table 8. Mean approach speed comparing experimental sidewalk sections.
Sidewalk Section
Mean Approach Speed of Participants, mi/h
All Novice Experienced Wide sidewalk 4.8 (0.28) 3.8 (0.20) 5.9 (0.25) Narrow sidewalk 4.3 (0.28) 3.4 (0.30) 5.2 (0.26)
1 mi = 1.61 km Note: Standard errors are provided in parentheses.

22
Trial Effect
Table 9 shows the effect of the three trials that were used to compute each mean when obstacles were present in the travel path. Standard errors are shown in parentheses. The table reveals the extent of any practice or learning that may have occurred on repeated drives past the same obstacle. For all participants, in general, the mean approach speed increased by 0.3 mi/h (0.6 km/h) over the three trials, indicating that some practice or learning may have taken place. This general increase in mean approach speed was statistically significant, F (2, 38) = 23.597, p < 0.001. The observed increase in approach speed may reflect increased confidence on the part of both groups of participants as a result of repeated practice passing the same obstacle on the sidewalk.
Table 9. Mean approach speed comparing trial effect.
Trial
Mean Approach Speed of Participants, mi/h
All Novice Experienced Trial 1 4.4 (0.27) 3.4 (0.23) 5.3 (0.20) Trial 2 4.5 (0.26) 3.5 (0.23) 5.4 (0.22) Trial 3 4.7 (0.28) 3.8 (0.28) 5.7 (0.21)
1 mi = 1.61 km Note: Standard errors are provided in parentheses.
Obstacle and Sidewalk Type Comparisons
As can be seen in table 10, for all participants with regard to speed, the baseline condition resulted in the highest mean speeds, passing the cone resulted in the slowest mean speeds, and passing a pedestrian resulted in intermediate mean speeds. In the table, standard errors are given in parentheses. The pedestrian walking toward and pedestrian walking with conditions represent a pedestrian moving toward the participant and a pedestrian moving in the same direction as the participant, respectively. In general, the moving pedestrians were passed by the SegwayTM HT rider at an average speed of 5 mi/h (8.1 km/h). These values were greater than the average approach speed of 4.7 mi/h (7.5 km/h) for inanimate traffic control devices. The differences in speed were statistically significant, F (3, 57) = 5.716, p = 0.002. The 0.3 mi/h (0.5 km/h) faster speed for passing pedestrians as opposed to inanimate objects is such a small speed differential that it is not likely to be of practical consequence.
Table 10. Mean approach speed for obstacles on a wide sidewalk.
Obstacle
Mean Approach Speed of Participants, mi/h
All Novice Experienced Baseline 5.3 (0.32) 4.2 (0.25) 6.4 (0.33) Pedestrian walking toward 5.1 (0.30) 4.0 (0.22) 6.2 (0.29) Pedestrian walking with 4.9 (0.34) 3.8 (0.36) 5.9 (0.34) Barrel 5.1 (0.29) 4.1 (0.24) 6.0 (0.29) Cone 4.3 (0.32) 3.3 (0.29) 5.3 (0.34)
1 mi = 1.61 km Note: Standard errors are provided in parentheses.

23
As can be seen in table 11, with regard to approach speed, for all participants, the baseline and the barrier alone mean approach speeds were approximately the same for the narrow sidewalk. This outcome might be expected, given that the actual sidewalk width was the same throughout for both conditions, though the barrier alone condition had traffic control barriers on either side of the sidewalk approximately 36 inches (914 mm) high. Both barrel conditions resulted in lower mean approach speeds, with the barrel and barrier condition having the lowest mean speed out of all of the obstacle conditions. This outcome might also be expected, given that the most physically constraining condition in the entire experiment was the combined barrel and barrier obstacle on the narrow sidewalk. The standard errors are shown in parentheses.
Table 11. Mean approach speed for obstacles on a narrow sidewalk.
Obstacle
Mean Approach Speed of Participants, mi/h
All Novice Experienced Baseline 5.5 (0.36) 4.3 (0.31) 6.8 (0.36) Barrel alone 3.9 (0.27) 3.3 (0.33) 4.6 (0.33) Barrel and barrier 3.5 (0.28) 2.8 (0.23) 4.3 (0.37) Barrier alone 5.5 (0.37) 4.2 (0.36) 6.8 (0.25)
1 mi = 1.61 km Note: Standard errors are provided in parentheses.
Overall Comparisons
Table 12 shows the overall results of the experiment for mean approach speed. Standard errors are given in parentheses. The table reveals the mean approach speed for all of the research participants regarded as a single group as well as for the novice and the experienced participants regarded separately.
Table 12. Mean approach speed overall.
Condition
Mean Approach Speed of Participants, mi/h
All Novice Experienced Baseline Versus Obstacles
Baseline 5.5 (0.35) 4.3 (0.28) 6.6 (0.34) All obstacle conditions 4.5 (0.27) 3.6 (0.24) 5.5 (0.20)
Wide Versus Narrow Sidewalk Wide sidewalk 4.8 (0.28) 3.8 (0.20) 5.9 (0.25) Narrow sidewalk 4.3 (0.28) 3.4 (0.30) 5.2 (0.26)
Effect of Trials Trial 1 4.4 (0.27) 3.4 (0.23) 5.3 (0.20) Trial 2 4.5 (0.26) 3.5 (0.23) 5.4 (0.22) Trial 3 4.7 (0.28) 3.8 (0.28) 5.7 (0.21)
1 mi = 1.61 km Note: Standard errors are provided in parentheses.

24
Acceleration
Because of the design of the course in phase I, it was possible to gather performance data in both directions—first for the stopping trials and second for the return trip back to the beginning of the course. This second set of data was used to further understand how riders adjust their speed. Following each stop, participants rode to the end of the course and turned around, beginning their return trip back to the start of the course. Their speed was measured over the marked areas of the course to determine acceleration behavior.
Figure 7 shows the mean speed profile for riders over an approximately 100-ft (30.5-m) length of course. Minimum and maximum speeds are also plotted for each speed key.
0
2
4
6
8
10
12
14
16
10 20 30 40 50 60 70 80 90 100
Speed Measurement Segment from Finish to Start of Course (feet)
Mea
n Sp
eed
(mi/h
)
Black
Yellow
Red
Black Max
Black Min
Yellow Max
Yellow Min
Red Max
Red Min
1 mi = 1.61 km 1 ft = 0.305 m
Figure 7. Graph. Mean speed during the return trip as a function of distance traveled in each speed key.
Participants took more distance to reach a relatively constant speed when they were using a faster speed key. Note that the wider range between minimum and maximum speeds in the red key compared to the yellow and black keys. These data indicate that all riders felt comfortable enough to ride near the top of the speed range for the black and yellow keys, but some riders did not feel as comfortable riding in the maximum speed range associated with the red key. Several maximum speed values measured for the black, yellow, and red keys were above their respective speed limits of 6 mi/h (9.7 km/h), 8 mi/h (12.8 km/h), and 12.5 mi/h (20.1 km/h). These values may be the result of the SegwayTM HT being able to temporarily exceed the speed limit as well as the result of errors in the speed estimation procedure.

25
DISTANCE
Stopping Distance
A benefit of having participants travel as fast as possible in a given speed key is that such a procedure allowed for the evaluation of stopping while traveling at high speeds (which should hypothetically result in the longest stops). Stopping performance was analyzed based on the time and distance traveled between the initiation of a stop and the completion of a stop. Both planned stops and unplanned stops were evaluated.
Planned Stops
Braking time and distance are shown in table 13, which shows when the researchers observed that a rider initiated a stop until the stop was complete. Standard errors are shown in parentheses.
Table 13. Mean braking time and mean braking distance for planned stops.
Speed Key Maximum
Speed, mi/h
Mean Braking Time, s
Mean Braking
Distance, ft Black 6 2.40 (0.20) 6.36 (1.02) Yellow 8 2.21 (0.23) 9.11 (1.50) Red 12.5 2.64 (0.25) 15.2 (1.91) Total mean 2.42 (0.22) 10.2 (1.44)
1 mi = 1.61 km 1 ft = 0.305 m Note: Standard errors are provided in parentheses.
As participants approached the predetermined stop location, they made a decision to initiate the stop. Once the researcher observed that they had initiated a stop, it took on average almost 2.5 s and over 10 ft (3.1 m) to complete a planned stop.
Unplanned stops
In addition to braking time and distance, unplanned stops included a measurable response component (see table 14). Response time is the time between the activation of the signal light and the observation that the participant initiated a stop. Response distance is the distance traveled during this time. Standard errors are shown in parentheses.

26
Table 14. Mean response time and mean response distance for unplanned stops.
Speed Key Maximum
Speed, mi/h
Mean Response Time, s
Mean Response
Distance, ft Black 6 0.41 (0.03) 3.79 (0.36) Yellow 8 0.37 (0.04) 4.88 (0.69) Red 12.5 0.83 (0.52) 7.61 (2.10) Total mean 0.52 (0.18) 5.36 (0.95)
1 mi = 1.61 km 1 ft = 0.305 m Note: Standard errors are provided in parentheses.
The mean response time was approximately 0.5 s, and the mean response distance was approximately 5.4 ft (1.6 m). Differences in response time, F (2, 12) = 0.820, p = 0.400, and response distance, F (2, 12) = 3.977, p = 0.089, as a function of mode (key) were not statistically significant. Before riders initiated a stop in the unplanned condition, they had already traveled over 5 ft (1.5 m) and used 0.5 s on average with an SD of 0.2 s. This may be a conservative estimate of real-world performance. For unplanned stops, the participants always expected to see a signal, but they were not sure exactly when it would occur. Response time and distance might be longer under real-world conditions if a rider is operating at a lower level of vigilance and at a higher level of uncertainty as to the type and location of stimuli which might require a stop. Using a different methodology, Landis et al. observed a mean perception-reaction time of 1.1 s with an SD of 0.6 s.(8,9)
Braking time and distance for unplanned stops, which is the time and distance traveled between the initiation of braking until the completion of the stop, are shown in table 15. Standard errors are shown in parentheses.
Table 15. Mean braking time and mean braking distance for unplanned stops.
Speed Key Maximum
Speed, mi/h
Mean Braking Time, s
Mean Braking
Distance, ft Black 6 1.47 (0.09) 4.86 (0.43) Yellow 8 1.89 (0.14) 8.34 (0.64) Red 12.5 1.97 (0.41) 14.2 (0.85) Total mean 1.79 (0.14) 9.10 (0.56)
1 mi = 1.61 km 1 ft = 0.305 m Note: Standard errors are provided in parentheses.
After the participants began to stop, it took them, on average, almost 2 s and over 9 ft (2.7 m) to complete an unplanned stop. To understand the totality of unplanned stopping behavior, it is important to look at the combination of the response component with completing the stop itself (i.e., total stopping time = response time + braking time). Table 16 shows the mean total stopping time and stopping distance for unplanned stops. Standard errors are shown in parentheses.

27
Table 16. Mean total stopping time and mean total stopping distance for unplanned stops.
Speed Key Maximum
Speed, mi/h Mean Total
Time, s Mean Total Distance, ft
Black 6 1.88 (0.09) 8.65 (0.62) Yellow 8 2.26 (0.17) 13.2 (1.20) Red 12.5 2.80 (0.20) 21.8 (2.14) Total mean 2.31 (0.14) 14.5 (1.24)
1 mi = 1.61 km 1 ft = 0.305 m Note: Standard errors are provided in parentheses.
On average, unplanned stops took over 2 s and about 14.5 ft (4.42 m) when considering both the response and braking components of the trial.
Comparing Planned and Unplanned Stops
Planned and unplanned stops are intrinsically different because the unplanned condition includes a measurable response component. Table 17 merges the results described above and shows a comparison of performance for these two types of stops. Standard errors are shown in parentheses.
Table 17. Comparisons of performance for planned and unplanned stops. Planned Stops Unplanned Stops
Speed Key
Maximum Speed, mi/h
Mean Braking Time, s
Mean Braking Distance,
ft
Mean Response Time, s
Mean Braking Time, s
Mean Total
Stopping Time, s
Mean Response Distance,
ft
Mean Braking Distance,
ft
Mean Total
Stopping Distance,
ft
Black 6 2.40
(0.20) 6.36
(1.02) 0.41
(0.03) 1.47
(0.09) 1.88
(0.09) 3.79
(0.36) 4.86
(0.43) 8.65
(0.62)
Yellow 8 2.21
(0.23) 9.11
(1.50) 0.37
(0.04) 1.89
(0.14) 2.26
(0.17) 4.88
(0.69) 8.34
(0.64) 13.2
(1.20)
Red 12.5 2.64
(0.25) 15.2
(1.91) 0.83
(0.52) 1.97
(0.41) 2.80
(0.20) 7.61
(2.10) 14.2
(0.85) 21.8
(2.14)
Total mean 2.42
(0.22) 10.2
(1.44) 0.52
(0.18) 1.79
(0.14) 2.31
(0.14) 5.36
(0.95) 9.10
(0.56) 14.5
(1.24) 1 mi = 1.61 km 1 ft = 0.305 m Note: Standard errors are provided in parentheses.
Overall, speed mode had a significant effect on braking distance, F (2, 12) = 219.703, p < 0.001, but not braking time, F (2, 12) = 2.307, p = 0.168. Faster speeds required longer distances to stop regardless of the type of stop being made. Contrasts indicated that mean braking distances differed significantly among all speed keys: black (mean = 5.5 ft (1.7 m), SD = 0.6 ft (0.18 m)), yellow (mean = 8.7 ft (2.6 m), SD = 0.88 ft (0.27 m)), and red (mean = 14.7 ft (4.48), SD = 0.94 ft (0.28 m)). Thus, participants traversed longer distances in approximately the same

28
length of time. There were no other observed significant effects of speed mode (key), stop type (planned versus unplanned), or any interactions.
Clearance Distance
As previously noted, phase II of the experiment investigated the passing behavior of novice and experienced riders on two different sections of sidewalk. The trial conditions were identical to those described in the approach speed section. For clearance distance, two separate mixed group ANOVAs were conducted for the two different combinations of the variables. Table 18 shows the results of these global ANOVAs (main effects only).
Table 18. Results of ANOVAs for clearance distance. Metric Clearance Distance
Statistic F-Value Degrees of Freedom p-Value
Wide Sidewalk E 3.71 (1, 18) NS T 3.24 (2, 144) NS O 100.10 (4, 144) < 0.001
Narrow Sidewalk E 0.02 (1, 18) N.S. T 2.14 (2, 108) N.S. O 301.93 (3, 108) < 0.001
NS = Not significant. E = Experience. T = Trial. O = Obstacle.
As can be seen in the table, three effects were evaluated: (1) the experience of the SegwayTM HT rider, (2) the trial number (an indicator of practice or learning), and (3) the different obstacles in the path. With regard to clearance distance on the wide sidewalk, only the different obstacles in the path had an observed statistically significant effect. In this instance, two interactions were statistically significant: (1) obstacles by trials (O × T), F (8, 144) = 2.89, p = 0.005 and (2) trials by experience (T × E), F (2, 144) = 3.48, p = 0.042. These interactions indicate that the particular effects that obstacles, trials, and experience have on clearance distance may be somewhat different.
In the case of the narrow sidewalk, the outcome was the same as for the wide sidewalk. With regard to clearance distance on the narrow sidewalk, only the different obstacles in the path had a statistically significant effect. In this instance, only one interaction was statistically significant: pass (P) by experience (P × E), F (1, 108) = 6.81, p = 0.018, indicating that the nature of the pass and experience effects on clearance distance may be somewhat different. The independent variable P refers to the outgoing or return pass of the object and is only relevant for the narrow sidewalk where each trial consisted of two determinations. The effect of P was not statistically significant for clearance distance, so it does not appear in the table.

29
In summary, the outcomes of the global ANOVAs indicated that the different obstacles in the path had a significant effect on the clearance distance of SegwayTM HT riders on both the wide and narrow sidewalk sections. On both types of sidewalk, the experience of the SegwayTM HT rider and the trial number did not have a significant effect on the clearance distance around that obstacle.
Obstacle Effect
As can be seen in table 19 below, across all participants, the baseline condition revealed a mean bias of 0.2 inches (5.1 mm) to the left of the sidewalk center (positive deviations represent the right side of the SegwayTM HT). Without being given instructions to ride on any particular portion of the sidewalk, participants showed a mean travel path almost exactly down the center of the sidewalk, showing only a slight bias toward the left. It should be noted in this regard that baseline distance measurements are relative to the center of the SegwayTM HT. By contrast, obstacle clearance distance measurements are relative to the outboard edge of the nearest wheel of the SegwayTM HT. Since the SegwayTM HT was 25 inches (635 mm) wide, the difference is 12.5 inches (317.5 mm). Standard errors are shown in parentheses.
Table 19. Mean clearance distance comparing baseline versus all obstacle conditions.
Condition
Mean Clearance Distance of Participants, inches
All Novice Experienced Baseline -0.2 (0.80) -0.6 (1.47) 0.1 (0.72) All obstacle conditions 14.5 (0.38) 13.7 (0.49) 15.3 (0.48)
1 inch = 25.4 mm Note: Standard errors are provided in parentheses.
As can also be seen in the table, across all conditions containing obstacles in the path, for all participants, the mean overall clearance distance was 14.5 inches (368.3 mm). The experienced participants did not pass the obstacles farther than the novice participants. The difference in mean clearance distance of 1.6 inches (40.6 mm) on average was not statistically significant.
Sidewalk Width Effect
Table 20 shows the effect of the width of the allowed sidewalk path for all conditions with obstacles present. For all participants and all obstacles on the wide sidewalk, the mean overall clearance distance was 25.1 inches (637.5 mm). On the narrow sidewalk, the participants passed the obstacles closer than on the wide sidewalk by 17.7 inches (449.6 mm) on average. This difference in mean clearance distance was statistically significant, t (19) = 17.78, p < 0.001. The closer passing clearance distance on the narrow sidewalk was likely the result of the constrained navigation space under this condition. Standard errors are shown in parentheses.

30
Table 20. Mean clearance distance comparing experimental sidewalk sections.
Condition
Mean Clearance Distance of Participants, inches
All Novice Experienced Wide sidewalk 25.1 (0.96) 22.8 (1.22) 27.3 (1.12) Narrow sidewalk 7.4 (0.16) 7.6 (0.26) 7.3 (0.21)
1 inch = 25.4 mm Note: Standard errors are provided in parentheses.
Trial Effect
Table 21 shows the effect of the three trials that were used to compute each mean when obstacles were present in the travel path. The table reveals the extent of any practice or learning that may have occurred on repeated drives past the same obstacle. For all participants, in general, the mean clearance distance did not decrease over the three trials. The apparent general decrease in mean clearance distance of about 0.3 inches (7.6 mm) was not statistically significant. Standard errors are shown in parentheses.
Table 21. Mean clearance distance comparing trial effect.
Trial
Mean Clearance Distance of Participants, inches
All Novice Experienced Trial 1 14.6 (0.40) 14.3 (0.63) 15.1 (0.49) Trial 2 14.5 (0.49) 13.5 (0.65) 15.4 (0.62) Trial 3 14.3 (0.43) 13.3 (0.49) 15.4 (0.55)
1 inch = 25.4 mm Note: Standard errors are provided in parentheses.
Obstacle and Sidewalk Type Comparisons
As can be seen in table 22, with regard to clearance distance, for all participants, passing a pedestrian walking in the same direction resulted in the greatest mean clearance, and passing the barrel resulted in the lowest mean clearance. There was a difference of 26.1 inches (662.9 mm) between these two mean clearances on the wide sidewalk. In general, the moving pedestrians were passed at an average clearance of 35.9 inches (911.9 mm). The average passing clearance distance for inanimate traffic control devices was 14.2 inches (360.7 mm). Therefore, on average, the extra clearance distance the SegwayTM HT riders afforded to pedestrians was 21.7 inches (551.2 mm). This difference in clearance distance was statistically significant, F (3, 57) = 74.46, p < 0.001. Standard errors are shown in parentheses.

31
Table 22. Mean clearance distance of obstacles on the wide sidewalk.
Obstacle
Mean Clearance Distance of Participants, inches
All Novice Experienced Baseline -1.1 (2.39) -1.5 (4.27) -0.7 (2.41) Pedestrian toward 33. 6 (2.00) 30.4 (2.51) 36.7 (2.90) Pedestrian with 38.3 (2.32) 33.5 (2.39) 43.2 (3.43) Barrel 12.2 (0.63) 12.2 (0.90) 12.2 (0.92) Cone 16.2 (0.70) 15.2 (0.79) 17.2 (1.12)
1 inch = 25.4 mm Note: Standard errors are provided in parentheses.
As can be seen in table 23 below, with regard to clearance distance, for all participants on the narrow sidewalk, the barrel alone and barrel and barrier conditions resulted in the shortest clearance distances, with the barrel and barrier being the shortest out of all of the conditions. This outcome may be taken as evidence of the relative physical constraints of the narrow sidewalk condition. For all participants, the barrier alone condition resulted in a much higher clearance distance relative to the right wheel of the SegwayTM HT, placing the SegwayTM HT on a path close to the middle of the narrow sidewalk path. Standard errors are shown in parentheses.
Table 23. Mean clearance distance of obstacles on the narrow sidewalk.
Obstacle
Mean Clearance Distance of Participants, inches
All Novice Experienced Baseline 0.2 (0.31) -0.1 (0.42) 0.5 (0.46) Barrel alone 5.2 (0.39) 5.4 (0.69) 5.0 (0.40) Barrel and barrier 3.5 (0.23) 3.3 (0.28) 3.6 (0.37) Barrier alone 13.6 (0.33) 13.9 (0.61) 13.3 (0.26)
1 inch = 25.4 mm Note: Standard errors are provided in parentheses.
Overall Comparisons
Table 24 shows the overall results of the experiment for mean clearance distance. It reveals the mean clearance distance in inches for all of the research participants regarded as a single group as well as for the novice and the experienced participants regarded separately. Standard errors are shown in parentheses.

32
Table 24. Mean clearance distance overall.
Metric Mean Clearance Distance,
inches Participant All Novice Experienced
Baseline Versus Obstacles Baseline -0.2 (0.80) -0.6 (1.47) 0.1 (0.72) All obstacle conditions 14.5 (0.38) 13.7 (0.49) 15.3 (0.48)
Wide Versus Narrow Sidewalk Wide sidewalk 25.1 (0.96) 22.8 (1.22) 27.3 (1.12) Narrow sidewalk 7.4 (0.16) 7.6 (0.26) 7.3 (0.21)
Effect of Trials Trial 1 14.6 (0.40) 14.3 (0.63) 15.1 (0.49) Trial 2 14.5 (0.49) 13.5 (0.65) 15.4 (0.62) Trial 3 14.3 (0.43) 13.3 (0.49) 15.4 (0.55)
1 inch = 25.4 mm Note: Standard errors are provided in parentheses

33
CHAPTER 4. DISCUSSION AND RECOMMENDATIONS
The objective of this study was to conduct an empirical assessment of several operating characteristics of the SegwayTM HT. Specifically, the operating characteristics of interest were as follows:
• Travel speed of experienced SegwayTM HT riders.
• Approach speed of experienced and novice SegwayTM HT riders in the presence of obstacles.
• Acceleration of experienced SegwayTM HT riders.
• Stopping distance of experienced SegwayTM HT riders.
• Clearance distance of experienced and novice SegwayTM HT riders in the presence of obstacles.
DISCUSSION
Participants comfortably traveled near the top speed allowed by each speed key (i.e., black, yellow, or red). Also, as would be expected, speed was the dominant factor in determining the distance it took for participants to stop. The faster the riders were traveling, the more distance it took them to initiate and complete a stop. When stops were unplanned, riders’ response times were approximately 0.5 s with an SD of 0.2 s. Using a different data collection methodology, Landis et al. observed a mean perception-reaction time of 1.1 s with an SD of 0.6 s.(8,9) In the Landis study, a stop sign was used, and the participants were told that a stop might occur. In this study, a stop signal was used, and participants were told that a stop would occur. Although participants did not initially know when to stop in the unplanned trials, they were aware that a stop would be required at some time during the trial. Some braking distances were long; unplanned stops while traveling near top speed in the red key required on average 21 ft (6.4 m).
This study was designed to answer the nine basic questions concerning characteristics of SegwayTM HT riding behavior posed in the introduction. For the given experimental procedures and test course, the results of the study revealed the following:
1. Experienced SegwayTM HT riders traveled at a mean speed of about 5.75 mi/h (9.26 km/h) in the black key, 7.71 mi/h (12.4 km/h) in the yellow key, and 11.2 mi/h (18.0 km/h) in the red key.
2. Novice and experienced SegwayTM HT riders approached obstacles at a mean speed of about 4.5 mi/h (7.2 km/h) with a range from 2.7 mi/h (4.3 km/h) to 6.8 mi/h (10.9 km/h).
3. Experienced SegwayTM HT riders passed obstacles faster than novice riders by about 1.9 mi/h (3.1 km/h) on average.

34
4. Novice and experienced SegwayTM HT riders passed moving pedestrians at an average speed of about 5 mi/h (8.1 km/h) and with an average clearance of 35.9 inches (911.9 mm).
5. Novice and experienced SegwayTM HT riders passed obstacles slower by about 0.5 mi/h (0.8 km/h) on average and at closer distances by about 17.6 inches (447.0 mm) on average on a narrow sidewalk as opposed to a wide sidewalk.
6. Experienced SegwayTM HT riders made planned stops in a mean time of about 2.42 s with a range from 2.21 s to 2.64 s and at a mean distance of about 10.2 ft (3.1 m) with a range from 6.36 to 15.2 ft (1.94 to 4.64 m).
7. Experienced SegwayTM HT riders’ response times for unplanned stops took a mean time of about 0.52 s while traveling a mean distance of about 5.36 ft (1.63 m). Riders completed the braking portion of the unplanned stops in a mean time of about 1.79 s while traveling a mean distance of about 9.10 ft (2.78 m). The total mean stopping time took 2.31 s while traveling a total mean distance of about 14.5 ft (4.42 m).
8. Experienced SegwayTM HT riders stopped while operating the SegwayTM HT in the black key at a mean distance of about 5.5 ft (1.7 m) with a range between 3.7 and 8.2 ft (1.1 and 2.5 m), in the yellow key at a mean distance of 8.7 ft (2.7 m) with a range between 7.1 and 13.2 ft (2.2 and 4.0 m), and in the red key at a mean distance of 14.7 ft (4.48 m) with a range between 12.5 and 18.8 ft (3.8 and 5.7 m).
9. Novice and experienced SegwayTM HT riders passed obstacles with a mean clearance of about 14.5 inches (368.3 mm) with a range from 3.3 to 43.2 inches (83.8 to 1,097.3 mm).
The findings reported herein are some of the first efforts to examine the performance of SegwayTM HT riders with respect to speed, braking, and maneuverability. However, this study is not without its limitations. Participants were not operating in a fully natural environment. They were making repeated trips on a relatively straight sidewalk under fair weather conditions with either no obstacles or a limited number of relatively forgiving obstacles. For ethical reasons, all obstacles minimized risk for the SegwayTM HT riders. The obstacles were all made of standard temporary traffic control hardware, which moves easily in a collision. These cones, barrels, and barriers did not pose as strong a collision threat as a fixed object like a tree or concrete barrier. For similar safety reasons, the walking pedestrian obstacles were experimenters aware of the SegwayTM HT presence and trained in how to avoid a collision. These staged pedestrian/ experimenters would not be likely to exhibit startled reactions or other possible naturalistic behaviors as might be observed with the general public, especially if a SegwayTM HT approaches from behind. For similar safety reasons, these staged pedestrians were allowed only on the wide sidewalk and not on the narrow sidewalk.
Participants did not have to move backwards or frequently adjust their speed during the experimental trials. They were observed continuously, and some of their behavior could have been shaped by researcher expectations. Finally, the sample group of SegwayTM HT riders was relatively homogeneous, composed of experienced and enthusiastic SegwayTM HT users and novice riders chosen from the Washington, DC, area. Since novice riders were being tested, the

35
Institutional Review Board required special safety considerations such as one-on-one training for novice riders. Additionally, minors under the age of 18 were not permitted to participate.
There were other limitations in the experiment as well. There were no convenient narrow sidewalks of sufficient length at the testing site, so the narrow sidewalk condition had to be produced by applying white tape boundary markings to a separate section of the wide sidewalk. This represented a somewhat forgiving width restriction, possibly contributing to faster speeds. In addition, the wide and narrow sidewalk test sections were not long enough for some riders to achieve maximum travel speed, even in the yellow speed key. Therefore, the speed values may be somewhat underestimated. To the degree that clearance distances are correlated with travel speed, the observed clearance distances may not be representative of what might be obtained under different conditions. Moreover, the wide and narrow sidewalk test sections were relatively short and close to each other. In addition, some of the obstacles were placed in relatively close proximity to each other, creating a rather constrained overall sidewalk environment. For example, on the wide sidewalk, the barrel had a higher approach speed than the cone, which is an unintuitive result. This outcome may have been the result of the barrel being placed in a straight section of the sidewalk and the cone in a curved section of the sidewalk path. In general, rider behavior for one obstacle may have been affected by the preceding or subsequent obstacle or path. Somewhat different results might be obtained in a more open and expansive sidewalk environment where isolated obstacles were few and far between. Lastly, this study provides no information about individual characteristics that influence SegwayTM HT performance such as age, fatigue, etc. Future work should investigate SegwayTM HT travel in a more naturalistic setting where participants have more freedom to control the pace and route that the SegwayTM HT travels.
RECOMMENDATIONS
As previously indicated, the widths of the narrow and wide sidewalk test sections were 4.4 ft (1.3 m) and 10.2 ft (3.1 m), respectively. AASHTO recommends a 4-ft (1.2-m) minimum clear sidewalk width.(12) However, AASHTO also recommends that sidewalks less than 5 ft (1.5 m) should have passing space of at least 5 ft (1.5 m) at reasonable intervals.(13) ADAAG states that 4 ft (1.2 m) is the minimum width for a wheelchair and one ambulatory person to pass each other.(11) The narrow sidewalk width employed in the present experiment was between these two values.
Novice and experienced SegwayTM HT riders encountered pedestrians only on the wide sidewalk. The SegwayTM HT riders passed one pedestrian per experimental trial for a total of six trials. Three trials involved a pedestrian walking towards the SegwayTM HT (opposite direction), and three trials involved a pedestrian walking with the rider (same direction). Across the 20 novice and experienced participants, these 6 trials resulted in a mean lateral passing clearance distance of about 3 ft (0.9 m). This clearance distance was considerably larger than the mean lateral clearance (1.2 ft (0.4 m)) for the inanimate stationary obstacles used in this study. If the width of the SegwayTM HT (2.1 ft (0.6 m)) and the width of the pedestrian (about 2.0 ft (0.6 m)) are taken into consideration, the average passing event involving the SegwayTM HT rider and the pedestrian required a minimum total distance of approximately 7.0 ft (2.1 m). If similar results occurred on a real sidewalk in the field, SegwayTM riders and pedestrians could face potential problems passing each other on city or suburban sidewalks that were built to the minimum AASHTO or ADAAG recommendations. AASHTO suggests that widths of 8 ft (2.4 m) or

36
greater may be necessary in certain commercial areas.(12) Based on the results of this study, widths of 8 ft (2.4 m) or greater should adequately accommodate SegwayTM HT and pedestrian passing events. It is not certain how a pedestrian and a SegwayTM HT rider would negotiate for passing space on a narrower sidewalk or how a SegwayTM HT would interact with wheelchairs, bicycles, or other novel transport devices.
Overall, the results of this study indicate that experienced SegwayTM HT riders were capable of stopping for both planned and unplanned stops. Both novice and experienced SegwayTM riders were capable of traversing past the various obstacles on the two test sidewalks without major difficulties. The controlled test courses attempted to simulate several typical conditions that a SegwayTM HT rider might commonly encounter in the real world. The testing environment was somewhat artificial (e.g., limited pedestrian activity, clean and smooth riding surface, etc.) compared with what might typically exist in the real world. Nevertheless, the study produced results that might serve as an empirical foundation for additional field research which could subsequently be conducted under more varied and realistic conditions. The results provided needed empirical data regarding the operating characteristics of the SegwayTM HT as related to acceleration and stopping distance (both planned and unplanned) as well as approach speed and clearance distance when navigating around obstacles. Such information could be useful for developing a rational approach to incorporate SegwayTM HT traffic into the regulation, planning, designing, and controlling of shared-use paths and roadways. The SegwayTM HT represents just one of many novel, unconventional transportation modes that may share these facilities in the future. The methodologies described herein may prove useful in determining the operating characteristics of these other novel modes, as well.

37
APPENDIX: PARTICIPANT FORMS AND INSTRUCTIONS
The appendix consists of the following sections:
• Demographic Questionnaire—Phase I.
• Pre-Briefing Instructions—Phase I.
• Environment Checklist—Phase I.
• Instructions—Phase I.
• Follow-Up Questionnaire—Phase I.
• Demographic Questionnaire—Phase II.
• Pre-Briefing Instructions—Phase II.
• Environment Checklist—Phase II.
• Training Procedure Checklist—Phase II.

38
DEMOGRAPHIC QUESTIONNAIRE—Phase I
Participant ID: _________
Sex (please circle): Female Male
Age (in years): _______ years
Height (in feet, inches): ________ feet
_______ inches
Weight (in pounds): _______ pounds
I speak and understand English. (Please circle Yes or No):
Yes No
Vision (please check one statement):
_______ I do not need glasses or contacts.
_______ I am
nearsighted, and I wear glasses or
contact lenses.
_______ I am
farsighted, and I wear glasses or
contact lenses.
_______ I wear bifocal
glasses or contact lenses.
Colorblindness (please check one statement):
_______ I am
colorblind.
_______ I am not
colorblind.
Educational Background (please check one statement):
_______ I did not
complete high school.
_______ I have my
high school diploma or
GED.
_______ I have some
college education.
_______ I have a
Bachelor’s Degree.
_______ I have a
graduate degree.

39
Driving Experience (please check one statement):
_______ I do not drive, and I have never had a
license.
_______ I do not drive,
but I have had a
license.
_______ I drive daily.
_______ I drive
several times per
week.
_______ I drive
several times per month.
_______ I rarely drive.
If applicable, annual mileage driven:
_________ miles
If applicable, age at which first driver’s license was obtained:
_______ years
Walking and Running Experience I (please check all that apply):
_______ I have
difficulty walking or running.
_______ I prefer not to walk or run if it can be avoided.
_______ I walk/run to complete
chores, like shopping.
_______ I walk/run for
exercise.
_______ I walk/run
for pleasure.
Walking and Running Experience II (please check all that apply):
_______ I walk/run all year.
_______ I walk/run
seasonally (e.g., only when it is
warm).
If applicable, when I run or walk (please check one statement):
_______ I rarely/never walk or run.
_______ I walk/run 1–2 miles per week.
_______ I walk/run 3–5 miles per week.
_______ I walk/run
6–10 miles per week.
_______ I walk/run more than 10 miles per week.
Bicycling Experience I (please check all that apply):
_______ I have
difficulty bicycling.
_______ I prefer not to bicycle if it
can be avoided.
_______ I bicycle to complete
chores like shopping.
_______ I bicycle for exercise.
_______ I bicycle for pleasure.
Bicycling Experience II (please check all that apply):
_______ I bicycle all
year.
_______ I bicycle
seasonally (e.g., only when it is
warm).
If applicable, when I bicycle (please check one statement):
_______ I rarely/never
bicycle.
_______ I bicycle
1–2 miles per week.
_______ I bicycle
3–5 miles per week.
_______ I bicycle
6–10 miles per week.
_______ I bicycle
more than 10 miles per week.

40
I have owned a SegwayTM since:
__________ (month)
__________ (year)
How did you come to own the SegwayTM?
I use the SegwayTM approximately:
________ miles per
week
For what activities do you use the SegwayTM (please check all that apply)?
______ grocery
shopping
_________ local errands
______ being a tourist
______ commuting
to work
______ other
If other, please specify:

41
PRE-BRIEFING—Phase I Welcome and thank you for your participation. Today, you are participating in a program of research on the needs and requirements of emerging road and sidewalk users, such as SegwayTM riders.
The purpose of this research study is to investigate several SegwayTM performance characteristics, such as acceleration and braking under different circumstances. The study will last approximately 2 to 3 hours. If at any time you feel that you need to take a break, please tell the researcher.
First, we will review some safety procedures, including a review of the course for safety hazards. (You are an experienced SegwayTM user, but if at any time you wish to review the SegwayTM reference manual or safety video, please let the researcher know.) Then, you will have a short warm-up session. Please feel free to ask any questions during this time. It is important that you feel safe and comfortable during the study.
Next, you will be asked ride to different marked locations on the sidewalk course. Sometimes you will monitor a signal that indicates you should stop immediately. This means that you should stop as quickly and as safely as possible. At various times, the researcher will ask questions about how easy it was to come to a stop.
Finally, you will be asked some questions about how often and where you ride the SegwayTM. Please be thoughtful and honest in answering—there are no right or wrong answers. Your participation is greatly appreciated and will be very useful to transportation researchers and engineers who want to ensure your safety on our roads and sidewalks.

42
ENVIRONMENT CHECKLIST—Phase I Please read the following document. Then we will walk the course together to look for any potential hazards while you are riding the SegwayTM.
There are several potential hazards in the environment (such as curbs, pedestrians, birds, lights, etc.). We have tried to minimize hazards through use of protective equipment (e.g., helmet) and barriers (e.g., cones and tape) and by using multiple researchers. If there is any other measure you feel we should take or any hazard with which you are uncomfortable, please notify me immediately. We will start by examining the SegwayTM to assess its operating condition. Then we will review the course.
SegwayTM
Determine whether the SegwayTM is operationally ready in terms of o Overall condition. o Function of controls. o Condition of tires and platform.
Adjust height of handles as needed. Surface Conditions
Is the surface even? Are there pitting, potholes, or rough surfaces? Are there seams in the surface?
Are they detectable underfoot? Are they flush or are they uneven in height or width?
Is the surface generally dry? Is there any water collected on the surface? Are there drains or grating on the surface? Are the edges of the sidewalk curbs, seams, or other? Note the height or width of
these transitions. Within approximately 20 feet, what surrounds the sidewalk on all edges, at ground,
waist and head level? o Grass, pebbles, stones, pavement dirt, concrete, water, etc. o Bushes, trees, tree roots, flowerbeds, rocks, etc. o Light fixtures, fencing, etc. o Benches, signage, bike racks, parked cars, etc. o Tree branches, signage, light fixtures, etc.
Obstructions
Note the location of decorative features, plantings, landscaping, signs, light fixtures, or street furniture on or near the sidewalk.
Note the possible presence of birds or animals on the sidewalk. Note the width and length of the sidewalk. Note (and remove) any debris present.

43
Researcher Materials
Note the presence of markings, signs, or equipment being used by the researchers (e.g., cameras, flags, tape, etc.).
Note barriers or “no ride” zones created by the researchers. Note the presence of two or three researchers acting as “spotters.” Note the use of personal protective equipment.
Traffic
Note the location of parked and driving vehicles. Note the probable location of pedestrian traffic and how it will be redirected.

44
INSTRUCTIONS—Phase I (The following instructions do not include comfort and control ratings.)
(Researcher may paraphrase or expand as necessary).
Please ask questions anytime as we go through the session today.
The safety rules are as follows:
• No tricks or stunts. • Do not step off the SegwayTM when the SegwayTM is in motion. • During each trial, please stay on the sidewalk and within the orange cones. Do not ride in
the road or the parking lot as vehicle and pedestrian traffic may be present. • You must be wearing your helmet and other protective equipment before you step on the
SegwayTM. • If the researcher asks you to dismount, please do so immediately. • If the researcher is on a SegwayTM, you must stay out of its path.
Questions? We are glad to have an experienced SegwayTM rider such as you working with us. However, before moving on to the main part of the study, I would like you to demonstrate for me you can safely use the SegwayTM and let you get a feel for the sidewalk testing course.
I am interested in whether you are comfortable using the device here. For example, does he/she: • Appear stable and balanced standing on the SegwayTM. • Easily and comfortably mount and dismount the SegwayTM. • Accelerate smoothly and in a controlled manner. • Control the direction of travel. • Appear steady when performing stops. • Comply with all the instructions and safety rules given. Questions? You may have noticed the various markings on the sidewalk (signs and markings). You may also have noticed this signal. During the study, you will be asked to ride to these different markings or stop in response to the signal changing from green to red.
The first marking to notice is this one (the START LINE). Every time we ask you to ride on the sidewalk, you need to start from a complete stop here.
A very important marking is this other one that I will call the END LINE (taped line 65 feet from the end). If you ever reach this spot without receiving an indication to stop, please begin to stop

45
anyway. For your safety, you may not ride beyond the end of the sidewalk, and thus this is the ideal location for you to begin braking.
The other locations are of interest to you are marked with numbers and tape (color?).
Questions? Now we will start the warm-up, and I will ask you to ride to some of these locations.
Please stop on the START LINE. Please start in the beginner mode/black key. Please ride down to the END LINE I just indicated (the -65 failsafe line). Stop as close to the line as you can.
Once you come to a complete stop, we would like you to go to the end line. Please stop at the end line, turn around, and then ride back here when told to do so by the other experimenter.
Now, please ride to the same location. However, I want you to stop immediately (quickly, but safely) as soon as the signal changes to red.
(Repeat in each speed key.) Questions? Thank you for your patience and safe behavior during the warm-up. And thank you for answering my questions. Now we are going to move on to the main part of the study.
(In the event that a participant is behaving in an unsafe or irresponsible manner, he or she will be asked to leave. In such cases, great effort will be taken to avoid making the participant feel badly about the study. For instance: “We have sufficient information about the device today. Your feedback about these issues has been invaluable.”)

46
FOLLOW-UP QUESTIONNAIRE—Phase I Participant Number _______ Please rate your overall experience in the study, on a scale of 1 (negative) to 10 (positive). _______ Why?_________________________________________________________________________ _____________________________________________________________________________ _____________________________________________________________________________ _____________________________________________________________________________ For each speed mode, on average, how fast do you think you were traveling? black: ____________ miles per hour yellow:____________ miles per hour red: ____________ miles per hour For each speed mode, on average, how far in advance of the stop location did you attempt to slow down? black: ____________ feet yellow:____________ feet red: ____________ feet

47
At the following locations, what speed mode (black, yellow, or red) would you feel most comfortable using the SegwayTM? Of course, if you would never feel comfortable riding the SegwayTM in a certain location, please tell me that.
Facility Location Other Examples
I would not use the
SegwayTM
If not, why and preferred
mode of travel (drive, walk, bike, other) black yellow red
Sidewalk Small city Bethesda, Arlington
Road Residential neighborhood
Speed limit of 25 mph
Sidewalk Large city
Washington, DC, New York, Baltimore
Road Rural community
Speed limit of 25 mph
Sidewalk Residential neighborhood
Road Rural community
Speed limit of 45 mph
Road Small city
Speed limit of 25 mph
Walking and bike path Suburban area
Comments: _____________________________________________________________________________ _____________________________________________________________________________ _____________________________________________________________________________ _____________________________________________________________________________ _____________________________________________________________________________

48
What concerns do you have about injury (yours or others) when you are using the SegwayTM? _____________________________________________________________________________ _____________________________________________________________________________ _____________________________________________________________________________ _____________________________________________________________________________ _______________________________________________________________________________________________________________________________________________________________________________________________________________________________________ What would you suggest to improve your SegwayTM experience and that of other users in the future? _____________________________________________________________________________ _____________________________________________________________________________ _____________________________________________________________________________ _____________________________________________________________________________ _______________________________________________________________________________________________________________________________________________________________________________________________________________________________________ Comments, questions? __________________________________________________________________________________________________________________________________________________________ _____________________________________________________________________________ _____________________________________________________________________________ _____________________________________________________________________________

49
DEMOGRAPHIC QUESTIONNAIRE—Phase II
Participant Number _______ 1. Age ______ years
2. Gender (select one) Female _____ Male ______
3. Height ____ feet ____inches
4. Have you had any alcohol or drugs in the past 24 hours? If so, how much and what
kinds? Please list: ___________________________________
5. How many hours of sleep have you had in the past 24 hours? ______________
6. How many hours ago did you wake up from a sleep lasting longer than 4 hours? ___________
7. How would you characterize your overall health (check one)?
Excellent _____ Very Good _____ Good _____ Fair _____ Poor _____
8. Highest educational level (check one)
Some high school _____ Some college _____ College degree _____ Graduate degree _____
9. Age when you received your driver’s license? ______ years
10. Approximately how many miles you drive each year? ___________ miles
11. How much do you walk or jog in an average week? (check all that apply)
For pleasure/recreation _____ distance _______ miles For exercise _____ distance _______ miles To commute _____ distance _______ miles For errands _____ distance _______ miles
12. How much do you ride a bicycle in an average week? (check all that apply)
For pleasure/recreation _____ distance _______ miles For exercise _____ distance _______ miles

50
To commute ______ distance _______ miles For errands ______ distance _______ miles
13. Do you own a SegwayTM? ____yes ____ no If yes, for how long? ____ years ____ months What model? _____________________ How much do you ride the SegwayTM in an average week? (check all that apply)
For pleasure/recreation ______ distance _______ miles To commute ______ distance _______ miles For errands ______ distance _______ miles

51
PREBRIEFING—Phase II The Segway™ was unveiled in December 2001. The SegwayTM company’s project name prior to its release was “Ginger” or “It.” The company that makes the SegwayTM has said it is “the world’s first electric, self-balancing transportation device” that uses “solid-state gyroscopes, tilt sensors, high-speed microprocessors, and powerful electric motors to keep it balanced. Working in concert, these extensively tested, redundant systems sense your center of gravity, instantaneously assess the information, and make minute adjustments one hundred times a second.” The company says that the SegwayTM “was designed to respond to rider’s movements—lean forward, go forward; lean back, go back—so that it could easily become an extension of one’s own body.” Many people hope that SegwayTM travel will replace short vehicle trips, resulting in reduced household expenses, increased vehicle longevity, lower healthcare costs due to reduced pollution-related illness, and reduced congestion. Currently, there are hundreds of people who own SegwaysTM. Additionally, there are a lot of companies that allow you to rent SegwaysTM or take group tours while riding a SegwayTM. For example, there are three such companies in Washington, DC.
The purpose of this research study is to investigate how people use the SegwayTM on sidewalks. The study will be in two parts—you will ride through an obstacle course and review a series of sidewalk videos. The study will last approximately 2 to 3 hours. If at any time you feel that you need to take a break, please tell the researcher at any time.
First, you will be taught how to use the SegwayTM safely in our testing environment. This will involve a short training session. Please feel free to ask any questions during this time. It is important that you feel safe and comfortable while you are using the SegwayTM on our course.
Next, you will be asked to use the SegwayTM along an obstacle course. You will have sufficient opportunity to study the obstacle course prior to beginning. The situations in the obstacle course are very similar to those you might see on a sidewalk in the real world. You will be asked to ride on a flat open sidewalk and through narrower portions with obstacles. Finally you will be asked to ride through a curb cut (or wheelchair ramp) on a short sidewalk. Sometimes, one of the researchers will be walking along the sidewalk while you go through the obstacle course. He/she is pretending to be a pedestrian, and you should treat him/her as such.
If at any time you feel that you are being asked to do something you feel is beyond your skill level or is unsafe, please let the researcher know immediately.
After you finish the obstacle course, a researcher will ask you some questions about riding the SegwayTM. Please be thoughtful and honest in answering—there are no right or wrong answers.
When the study is complete, please feel free to ask any questions you have. Your participation is greatly appreciated and will be very useful to traffic researchers and engineers who want to improve the safety of our roads and sidewalks.
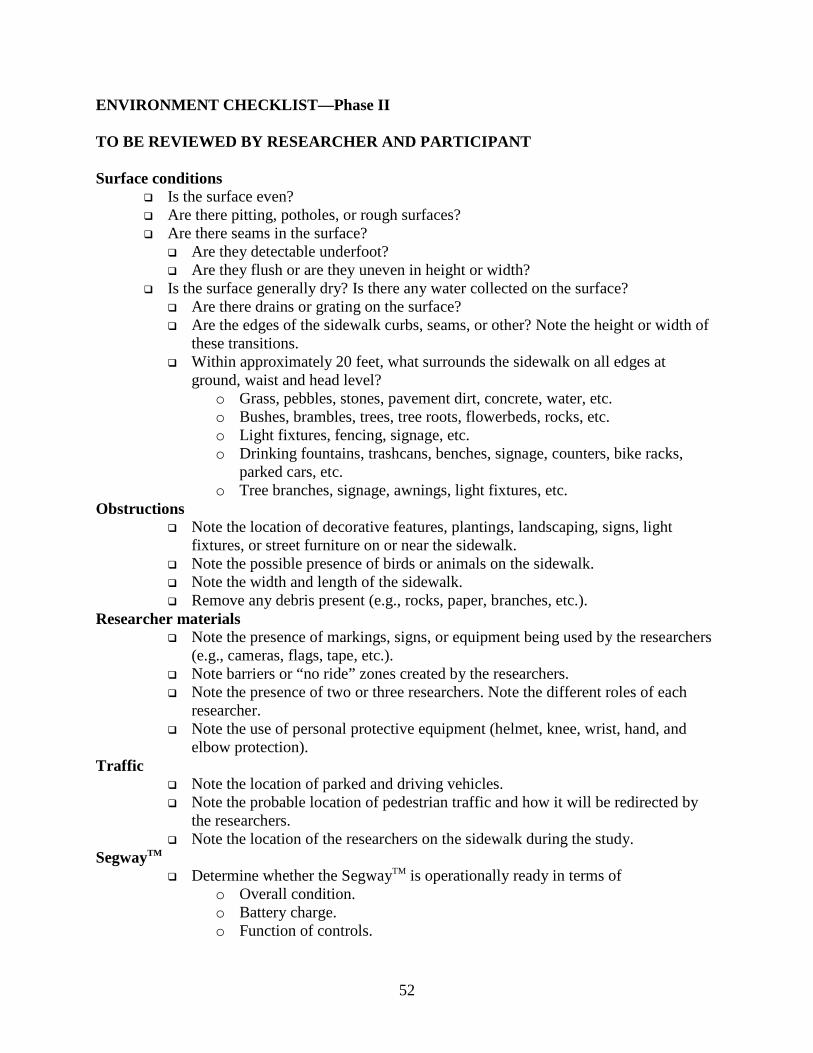
52
ENVIRONMENT CHECKLIST—Phase II TO BE REVIEWED BY RESEARCHER AND PARTICIPANT Surface conditions
Is the surface even? Are there pitting, potholes, or rough surfaces? Are there seams in the surface?
Are they detectable underfoot? Are they flush or are they uneven in height or width?
Is the surface generally dry? Is there any water collected on the surface? Are there drains or grating on the surface? Are the edges of the sidewalk curbs, seams, or other? Note the height or width of
these transitions. Within approximately 20 feet, what surrounds the sidewalk on all edges at
ground, waist and head level? o Grass, pebbles, stones, pavement dirt, concrete, water, etc. o Bushes, brambles, trees, tree roots, flowerbeds, rocks, etc. o Light fixtures, fencing, signage, etc. o Drinking fountains, trashcans, benches, signage, counters, bike racks,
parked cars, etc. o Tree branches, signage, awnings, light fixtures, etc.
Obstructions Note the location of decorative features, plantings, landscaping, signs, light
fixtures, or street furniture on or near the sidewalk. Note the possible presence of birds or animals on the sidewalk. Note the width and length of the sidewalk. Remove any debris present (e.g., rocks, paper, branches, etc.).
Researcher materials Note the presence of markings, signs, or equipment being used by the researchers
(e.g., cameras, flags, tape, etc.). Note barriers or “no ride” zones created by the researchers. Note the presence of two or three researchers. Note the different roles of each
researcher. Note the use of personal protective equipment (helmet, knee, wrist, hand, and
elbow protection). Traffic
Note the location of parked and driving vehicles. Note the probable location of pedestrian traffic and how it will be redirected by
the researchers. Note the location of the researchers on the sidewalk during the study.
SegwayTM Determine whether the SegwayTM is operationally ready in terms of
o Overall condition. o Battery charge. o Function of controls.

53
o Condition of tires and platform. Adjust height of handles as needed.
Course Note the location of obstacles, barriers, cones, etc. Note presence of sidewalk ramp. Note presence of a pedestrian (researcher) on the sidewalk.

54
TRAINING PROCECURE CHECKLIST—Phase II
SegwayTM Novice Rider Training Procedure Checklist Date ____________ Start Time ____________ Participant # ____________
Step Task Accomplished
1 Watch SegwayTM Safety Video
2 Inform participant to please not perform and movement until first instructed for safety purposes
3 Put on protective equipment (instructor and participant)
4 Controls and displays
5 Speed and keys
6 Mounting and dismounting
7 Balancing and standing still
8 Moving short distance and stopping Black Key Yellow
Key
9 Moving forward—long distances
10 Stopping—squat technique
11 Moving backward—short distance
12 Turning in place
13 Navigating traffic cones—“S” curves
14 Sidewalk ramp
15 Additional training—if necessary (see comments) Comments:
End Time _____________

55
ACKNOWLEDGEMENTS
The FHWA sponsored this work. This research could not have been completed without the assistance of Brian Kerr, Dana Duke, Lindsey Clark, Bryan Katz, David Uniman, Blair Stocks, Vernese Edghill, Wanda Parham, Tiana Petit, and numerous anonymous reviewers. Tom Granda and Christopher Monk (FHWA) and Steve Fleger and Bill Perez provided management of the contract.


57
REFERENCES
1. “Segway Inc. Introduces 2005 Product Line with More Power, More Attitude and More Options,” Segway Inc., Bedford, NH. (2005). Obtained from: http://www.segway.com/ about-segway/media-center/press_releases/pr_030105c.php. Site last accessed April 13, 2009.
2. Segway Laws, Governors Highway Safety Association, Washington, DC. (2008). Obtained from: http://www.ghsa.org/html/stateinfo/laws/segway_laws.html. Site last accessed April 13, 2009.
3. Consumer Products Safety Commission. “Segway Inc. Announces a Recall to Repair Segway Personal Transporters,” Consumer Products Safety Commission. (2006). Obtained from: http://www.cpsc.gov/cpscpub/prerel/prhtml06/06258.html. Site last accessed April 13, 2009.
4. Liu, R. and Parthasarathy, R. “Segway Human Transporter (HT): Potential Opportunities and Challenges for Transportation Systems,” Presented at the 82nd Annual Meeting of the Transportation Research Board, Washington, DC. (2003).
5. Litman, T. and Blair, R. “Managing Personal Mobility Devices (PMDs) in Nonmotorized Facilities,” Presented at the 83rd Annual Meeting of the Transportation Research Board, Washington, DC. (2004).
6. Shaheen, S.A. and Finson, R. “Bridging the Last Mile: A Study of the Behavioral, Institutional, and Economic Potential of the Segway Human Transporter,” Presented at the 82nd Annual Meeting of the Transportation Research Board, Washington, DC. (2003).
7. Rodier, C., Shaheen, S.A., and Chung, S. “Unsafe At Any Speed?: What the Literature Says About Low-Speed Modes,” Presented at the 83rd Annual Meeting of the Transportation Research Board, Washington, DC. (2004).
8. Landis, B.W., Petritsch, T.A., and Huang, H.F. Characteristics of Emerging Trail Users and Their Safety, FHWA-HRT-04-103, Federal Highway Administration, U.S. Department of Transportation, Washington, DC. (2004).
9. Landis, B.W., Petritsch, T.A., Huang, H.F., and Do, A. “Characteristics of Emerging Trail Users and Their Safety,” Presented at the 83rd Annual Meeting of the Transportation Research Board, Washington, DC. (2004).
10. Segway Group. Washington, DC. Obtained from: http://groups.yahoo.com/group/dc-Segways/. Site last accessed March 3, 2004.
11. United States Access Board. ADA Accessibility Guidelines for Buildings and Facilities (ADAAG), Washington, DC. (2004). Obtained from http://www.access-board.gov/ adaag/html/adaag.htm. Site last accessed April 13, 2009.
12. American Association of State Highway and Transportation Officials. A Policy on Geometric Design of Highways and Streets, 5th ed., Washington, DC. (2004).

58
13. American Association of State Highway and Transportation Officials. Guide for the Planning, Design, and Operation of Pedestrian Facilities, Washington, DC. (2004).


HRDS-07/06-10(WEB)E