Embed Size (px)
Citation preview
Operating Room Sharp Injuries in a Teaching Hospital
Poonam Kutre
MPH 2015

What is sharp injury
A sharp injury is a penetrating stab wound from a needle, scalpel, or other sharp object that may result in exposure to blood or other body fluids.(CDC)
Sharp injury rates in surgical settings have increased 6.5 % compared to a 31.6 % decrease in injury rates in non-surgical settings (Jagger et al.2010)
Each year, 30% of estimated needle sticks and other sharps-related injuries occur in the operating room (Epinet )
Source:http://www.cdc.gov/niosh/stopsticks/sharps
injuries.html

Factors Influencing Exposure
Type of medical procedure
Characteristics of the device & equipment used
Nature of work
Space and visibility within operative fields
Level of staffing
Frequency of emergency patient care situations
Pace of work
Source: http://nursingcrib.com/perioperativenursing/operating-room-team-sterile-members

Aims
To describe the distribution of sharp injuries reported to the hospital safety office by operating room staff at an urban academic-based hospital
Identify predictors of repeated sharp injury over a 3 year period
Evaluate and describe work place hazards associated with sharp injuries through onsite work place observation
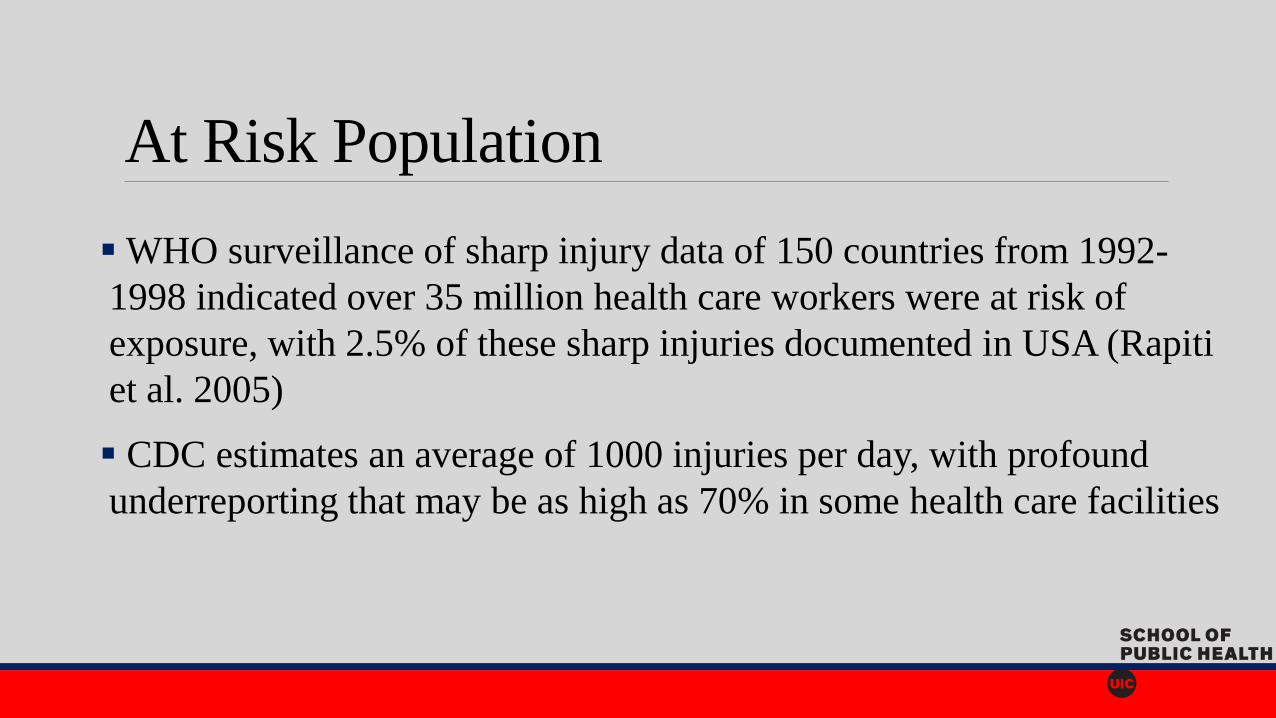
At Risk Population
WHO surveillance of sharp injury data of 150 countries from 1992-
1998 indicated over 35 million health care workers were at risk of
exposure, with 2.5% of these sharp injuries documented in USA (Rapiti
et al. 2005)
CDC estimates an average of 1000 injuries per day, with profound
underreporting that may be as high as 70% in some health care facilities

Who?
Nurses (42%) followed by physicians (30%),
technicians/maintenance (14%), and students (4%)
Where?
Sharp injuries most commonly occurred in the inpatient units
(36%), operating rooms (29%), and patient rooms (9%)
What?
Hollow-bore needles: 55%
Solid Sharp: 41%
When?
During use of a device : 70%
After use/before disposal:15%
During and after disposal:3%
Other 5%
http://www.cdc.gov/nhsn/PDFs/NaSH/NaSH-Report-6-2011.pdf
Patterns of Sharp Injuries
Types of Devices Involved in Percutaneous Injuries
(n=25, 324)
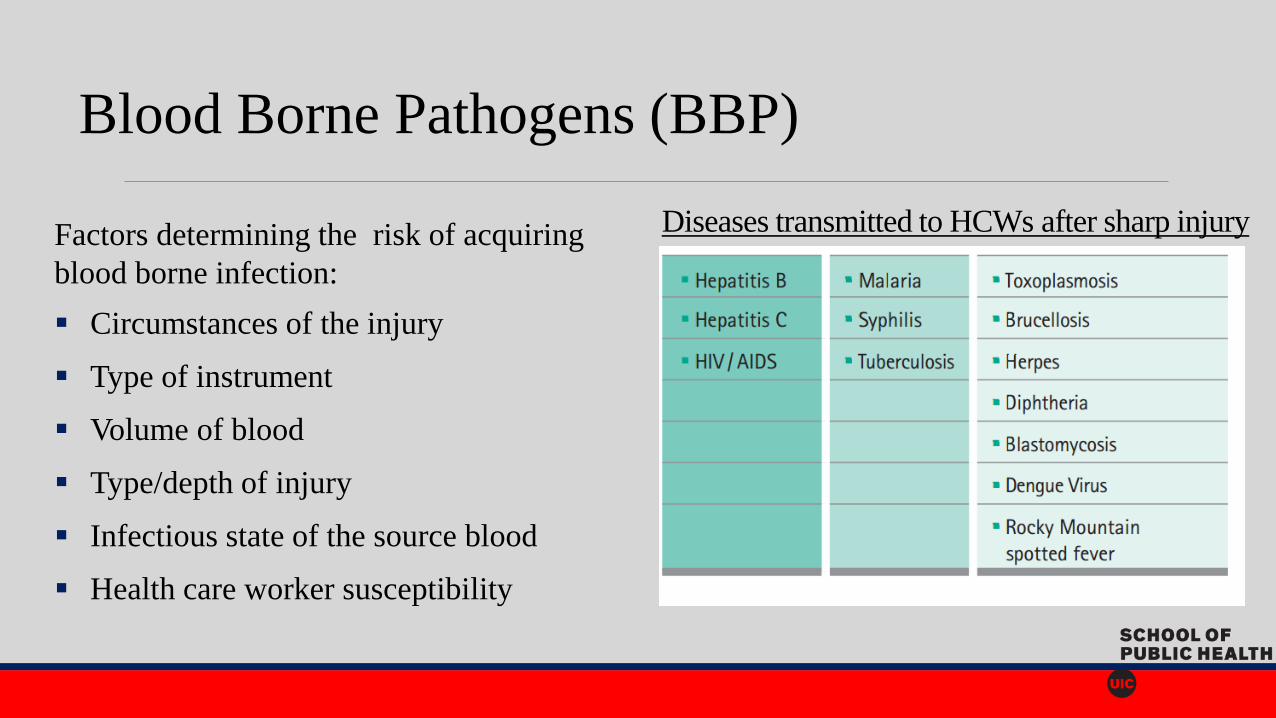
Diseases transmitted to HCWs after sharp injury Factors determining the risk of acquiring
blood borne infection:
Circumstances of the injury
Type of instrument
Volume of blood
Type/depth of injury
Infectious state of the source blood
Health care worker susceptibility
Blood Borne Pathogens (BBP)
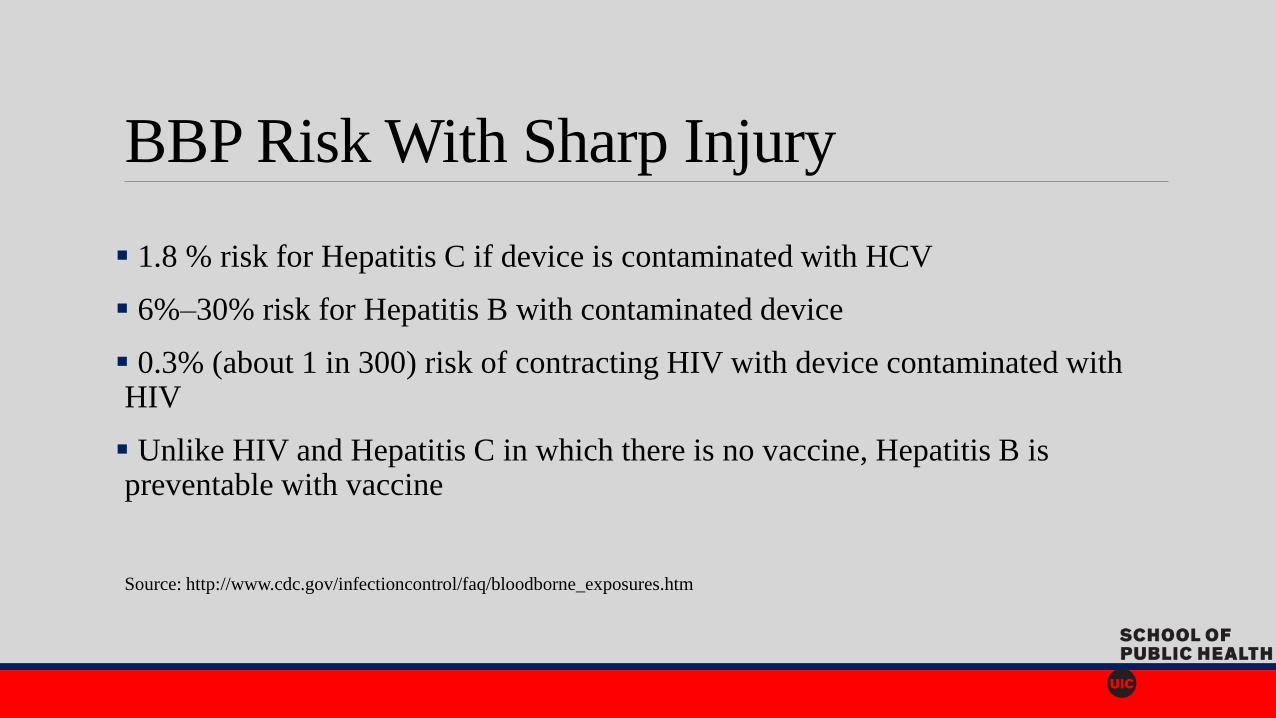
BBP Risk With Sharp Injury
1.8 % risk for Hepatitis C if device is contaminated with HCV
6%–30% risk for Hepatitis B with contaminated device
0.3% (about 1 in 300) risk of contracting HIV with device contaminated with HIV
Unlike HIV and Hepatitis C in which there is no vaccine, Hepatitis B is preventable with vaccine
Source: http://www.cdc.gov/infectioncontrol/faq/bloodborne_exposures.htm

BBP Statistics 2005 WHO report on global BBP infections among an estimated 35 to 100 million health care workers:
65,000 Hepatitis B Virus infections (HBV)
16,400 Hepatitis C Virus infections (HCV)
1000 HIV infections
CDC confirmed 44 health care associated outbreaks of Hepatitis B virus (HBV) and Hepatitis C virus from 2008-2014
175 cases –HBV
239 cases-HCV
1981-2010 occupationally acquired HIV/AIDS surveillance data: 57 health personnel in U.S. have been documented to seroconvert to HIV following occupational exposures

Needle stick injuries are underreported by health care workers and the number of exposures could potentially be much higher (Hamory, 1983)
Factors influencing reporting rates;
Incident reporting process (Makary et al. 2007)
Lack of time
Employer response
Concern about source infectious status
Underreporting

Consequences of Sharp Injury
Direct Cost Indirect Cost
Laboratory testing costs
vaccinations, health care visits
Loss of work days and loss of wages
Post exposure prophylaxis (PEP) Lost productivity, time lost due to anxiety
& distress
Follow-up blood test and long-term
treatment
Higher insurance premiums
Costs associated with prevention and PEP
side effects
Societal costs (social stigma)
Emotional and psychological stress and fear
of unknown consequences
Side effects of prophylaxis and treatment

Methods
Data on sharp injuries collected over a 3 year period from January 1st, 2012 through December 31st, 2014 through a sharp injury log reported to the hospital health services
Repeat injuries among workers were identified by cross matching the cases by date of birth and hire date.
Multivariable logistic regression model was built to describe the association of sharp injuries and job class, as well as age, years of experience, and type of sharps
Conducted a 5 week (March-April 2015) observational study at operating room observing behavior, environment, and safe work practices such as double gloving, verbal communication, and use of neutral zone for sharp instrument transfer
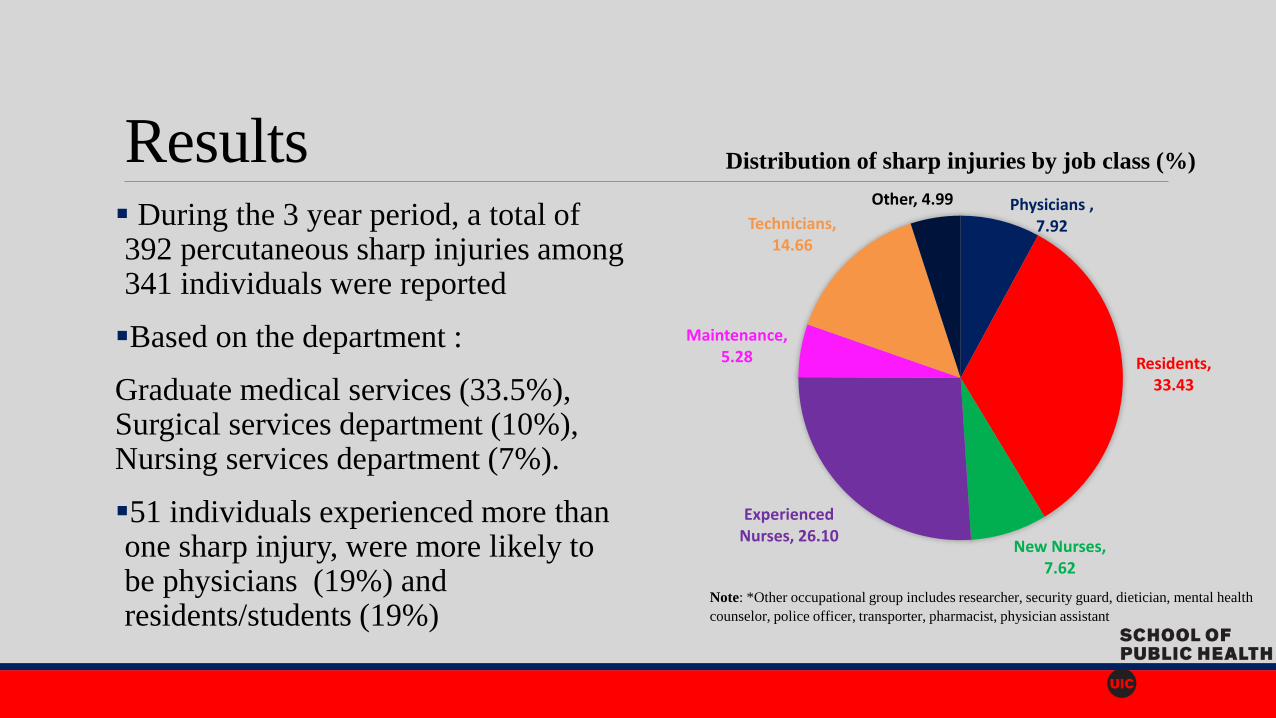
Results During the 3 year period, a total of 392 percutaneous sharp injuries among 341 individuals were reported
Based on the department :
Graduate medical services (33.5%), Surgical services department (10%), Nursing services department (7%).
51 individuals experienced more than one sharp injury, were more likely to be physicians (19%) and residents/students (19%)
Physicians , 7.92
Residents, 33.43
New Nurses, 7.62
Experienced Nurses, 26.10
Maintenance, 5.28
Technicians, 14.66
Other, 4.99
Distribution of sharp injuries by job class (%)
Note: *Other occupational group includes researcher, security guard, dietician, mental health
counselor, police officer, transporter, pharmacist, physician assistant

Comparison of Sharp Injuries by Job Class and Device Type
Among Operating Room Staff at a University Hospital, 2012-2014
Note: *Other occupational group includes researcher, security guard, dietician,
mental health counselor, police officer, transporter, pharmacist, physician assistant.
*Hollow sharps include-Hollow needle, stylet, butterfly needle,spinal Needle and
huber needle
**Solid sharps include - solid blade, scalpel blade, other surgical instrument,
suture and non-suture needles, solid glass
Missing: 98
• Residents/students: 51% injuries during the
use of solid sharps, mainly by suture needles
and scalpel blades, with high risk work
activities including suturing (30%), injection
(10%), and other related procedures (16%)
• Experienced nurses: 42% of sharp injuries
attributed to the use of hollow sharps, with
24% of injuries occurring during the disposal
of sharp in red box followed by injection
related activities
• Maintenance workers and technicians
sustained most injuries during handling and
disposal of hollow sharps
Job Class *Hollow Sharps **Solid Sharps
Physicians 8 (6.7%) 12(9.8%)
Students/Residents 19 (16%) 63 (51.2%)
New Nurses 17(14.2%) 5 (4%)
Experienced nurses 50 (42%) 18 (14.6%)
Maintenance 9 (7.5%) 6 (5%)
Technicians 16 (13%) 12 (9.8%)
*Other 1 (0.008%) 7 (5.7%)
Results

Results •Monthly distribution of sharp injuries was relatively constant over several years
•Fewer injuries were reported on the weekends
Injury Weekday Frequency
Count
Percent of Total
Frequency
Thursday 78 19.90
Monday 72 18.37
Tuesday 66 16.84
Wednesday 65 16.58
Friday 64 16.33
Saturday 25 6.38
Sunday 22 5.61
Table 2: Distribution of Sharp Injuries by weekday

Multivariable model Table 3: Multivariate Logistic regression analysis of risk factors
associated with repeat sharp injuries Job class was not associated with repeat injuries
Compared to hollow needle sharps, exposure to
solid sharps (e.g. suture needle, scalpel blade,
surgical instruments) were associated with repeated
sharp injuries
Age and years of experience was included in the
regression model
Continued to observe no differences between job
classes
Job Class Adjusted
Odds Ratio
95% Confidence
Interval
p-value
Physicians (reference) 1.00
Residents/Students 1.20 0.42,3.42 0.738
Nurses 0.57 0.18,1.79 0.381
Maintenance 0.38 0.04,3.53 0.394
*Other and
Technicians
0.43 0.11,1.68 0.224
Age (years) 1.01 0.97,1.05 0.463
Solid Sharps 2.84 1.41,5.7 0.003

Observation study results Observation of 21 ophthalmic(eye) cases:
Use of double gloving was not practiced
Verbal communication during the transfer of sharps was observed only in 6 out of 21 cases
There was hand to hand passing of sharp instruments between the scrub and the surgeon with no use of neutral zone
There were 2 observations of improper disposal of needles by scrubs

Discussion Analysis of sharp injuries by job class and device revealed residents are more likely to injure themselves with solid sharps such as suture needles, scalpel blades and other surgical instruments
Implications:
Relative inexperience in performing procedures and handling sharps devices
Residents may be at higher risk of exposure to bloodborne pathogens
Low adaptation of safer work practices

Discussion
Since 2001, there are very few studies which assessed sharp injuries among US residents, majority of which were survey studies and others were based on sharp exposure log
Sharp injury survey of 699 residents enrolled in 17 US surgery residency programs showed that 67% sustained injury in the operating room with more than half injuries unreported (Markary et al.2007)

Limitations
The data lacked critical denominator information to calculate the rates:
Total number of resident trainees in each department
Total number of hours worked
Descriptive data of each event for a root cause analysis
Some of the data on the type of device causing injury was missing
Underreporting of sharps injuries
Short period of observation study which involved only ophthalmology department

Summary This study analysis can be considered as a baseline profile of sharps injuries in the operating room and can be used by the institution to:
Create a sharps safety educational training which focuses on improving handling of solid sharp instruments and to enhance the resident’s surgical skills
Encourage health care professionals in surgical settings to use blunt-tip suture needle when it is clinically appropriate technique (CDC, 2008)
Multidisciplinary approach, which includes representatives of front line workers of both non managerial (nurses, practitioners ,technicians, educators) and managerial (risk managers and directors) positions

Summary Recommended safety culture work practices: Competent education, accountability of health care staff, monthly institutional reminders, easy and accessible incident reporting, active multidisciplinary approach, and a goal of zero sharp exposures (Grimmond and Good, 2014)
Use of neutral zone (Hands free technique) defined as a “zone which is a previously agreed location on the sterile field where sharps are placed from which physicians or scrub can retrieve them.” This method eliminates the hand to hand passing of sharps (Stringer 2002)
Encourage the use of double gloving, which reduces blood exposure to 87% (Berguer, 2004)

• Berguer, Heller. 2004. 'Preventing Sharps Injuries in the Operating Room'. Journal of the American College of Surgeons 199 (3): 462-467. doi:10.1016/j.jamcollsurg.2004.04.018.
• Cdc.gov, 2013. 'CDC - Stop Sticks: Sharps Injuries - NIOSH'. http://www.cdc.gov/niosh/stopsticks/sharpsinjuries.html.
• Centers for Disease Control and Prevention, 2011. Summary Report For Blood And Body Fluid Exposure Data Collected From Participating Healthcare Facilities (June 1995 Through December 2007). The National Surveillance System for Healthcare Workers (Nash.). http://www.cdc.gov/nhsn/PDFs/NaSH/NaSH-Report-6-2011.pdf.
• Centers for Disease Control and Prevention, 2015. Workbook for Designing, Implementing & Evaluating a Sharps Injury Prevention Program. http://www.cdc.gov/sharpssafety/pdf/sharpsworkbook_2008.pdf.
• Jagger, Janine, Melanie Bentley, and Patricia Tereskerz. 1998. 'A Study of Patterns and Prevention of Blood Exposures in OR Personnel'. AORN Journal 67 (5): 979-996. doi:10.1016/s0001-2092(06)62623-9.
• Jagger J, Berguer R, Phillips EK, Parker G, Gomaa AE. Increase in sharps injuries in surgical settings versus nonsurgical settings after passage of national needlestick legislation. J Am Coll Surg. 2010;210(4):496-502.
• Makary, M.A., A. Al-Attar, and C.G. Holzmueller. 2007. 'Needle-Stick Injuries among Surgeons in Training'. Journal of Vascular Surgery 46 (3): 609. doi:10.1016/j.jvs.2007.07.015.
• National Institute for Occupational Safety and Health, 2008. Use of Blunt-Tip Suture Needles to Decrease Percutaneous Injuries to Surgical Personnel. Safety and Health Information Bulletin. Occupational Safety and Health Administration. http://www.cdc.gov/niosh/docs/2008-101/pdfs/2008-101.pdf.
• Spratt, Deborah. 2013. 'Sharps Safety in the Operating Room'. Association of Perioperative Registered Nurses. https://www.aorn.org/uploadedFiles/OSHA-AORN%20Sharps%20Injury%20Prevention%20Program%20May%202009.pdf.
• U.S. EPINet, 2011. Sharps Injury, Blood and Body Fluid Exposure Surveillance Research Group. Sharps Injury Data Report. http://www.healthsystem.virginia.edu/pub/epinet/EPINet2011-NeedlestickRpt.pdf.
References

Thank you for Listening!
Any Questions ?


![Sharp injuries and needle stick post exposure prophylaxis [compatibility mode]](https://img.pdfslide.net/doc/110x75/545c9b1fb0af9f12318b497f/sharp-injuries-and-needle-stick-post-exposure-prophylaxis-compatibility-mode.jpg)


![Sharp Injuries Prevention[compatibility mode]](https://img.pdfslide.net/doc/110x75/545c9af8b0af9fb32c8b49fe/sharp-injuries-preventioncompatibility-mode.jpg)