Embed Size (px)
Citation preview

Wayne State UniversityDigitalCommons@WayneState
Wayne State University Dissertations
1-1-2012
Operating room utilization and turnover behavioralstudyJihan WangWayne State University,
Follow this and additional works at: http://digitalcommons.wayne.edu/oa_dissertations
This Open Access Dissertation is brought to you for free and open access by DigitalCommons@WayneState. It has been accepted for inclusion inWayne State University Dissertations by an authorized administrator of DigitalCommons@WayneState.
Recommended CitationWang, Jihan, "Operating room utilization and turnover behavioral study" (2012). Wayne State University Dissertations. Paper 559.

OPERATING ROOM UTILIZATION AND TURNOVER BEHAVIORAL STUDY
by
JIHAN WANG
DISSERTATION
Submitted to the Graduate School
of Wayne State University,
Detroit, Michigan
in partial fulfillment of the requirements
of the degree of
DOCTOR OF PHILOSOPHY
2012
MAJOR: INDUSTRIAL ENGINEERING
Approved by:
Advisor Date

© COPYRIGHT BY
JIHAN WANG
2012
All Rights Reserve

ii
DEDICATION
I dedicate my dissertation to my beloved mother, Liping Xu, whose continuous support and words of encouragement, and whose positive life attitude and unbelievable strength inspire me to work to my best abilities.

iii
ACKNOWLEDGEMENTS
This dissertation would not have been possible to complete without the support and
assistance from my advisor, the committee members, colleagues, and staff in the industrial and
systems engineering department. I would like to take this opportunity to express my gratitude
towards everyone.
I owe my most sincere and earnest thankfulness to my academic supervisor, Professor
Kai Yang. Ever since I started my Master’s program, his enthusiasm and curiousness to explore
new domains for industrial engineering knowledge application have broadened my vision and
introduced me into healthcare. Throughout my study, he provided me with countless good
advice and ideas to topic selection and resolve the barriers in my research. His constructive
feedback and valuable guidance have been the greatest support in my doctoral study. In
addition, his hard working attitude has always been the greatest inspiration for me and other
team members to strive towards the perfection of our work.
I would like to thank Dr. Alper Murat, Dr. Darin Ellis, and Dr. Salwen for serving on my
committee. They have provided me with valuable guidance from both academic and practice
perspectives, especially, Dr. Murat who has been a great mentor on my simulation model
building by offering ideas and overseeing all the detailed steps during the whole process.
Without their help, my study would not be able to progress as it has been.
I am heartily thankful to Dr. Franklin Dexter for his tremendous assistance in my study of
OR staff behavior. He made many good suggestions on the approach to conducting the study
and was so generous to spend time helping me out with the analysis out his tight schedule. He
shared his rich experience in OR management and gave me detailed comments on my work
that gave me many insights and different research perspectives.

iv
I would also like to express my gratitude to Ms. Susan Yu in John D. Dingell VA medical
center. She has been such a great resources when I started my research in operating room
management. Her knowledge in the operations of healthcare helped me to understand the
system and guided me in identifying the focus of my research. Based on her prior work, I was
able to collect high-quality data for analysis.
I am obliged to my colleagues for creating friendly and fun working environment,
especially my team mates Xiaoyu Ma, Yanli Zhao, Satish Tyagi as well as graduates from the
team, Xianming Cai, Lin Ben, and Adel Alaeddini for their help. I thank all my work colleagues
working in veteran engineering resource center who have been giving me huge support doing
the projects.
Special thanks go to me my friends Ying Zhang, Wenjing Zhang, Xun Zhang, and Wenjia
He. Although we are separated by big oceans, you have always been there for me whenever I
need a hand. Your kindness has been the strongest support to me during difficult life moments.
You trust in me make such a big different that encourages me to continue my pursuit of dreams.
There is no words that is enough to express how much thankful I am to my dear mother,
who has sacrificed so much to raise me and taught me to be a decent person. Her love has
always been the most precious treasure of my life since my childhood. She is the role model of
kindness, tolerance, and courage. She demonstrates to me that a strong mind will not be taken
down by the environment. Without her, there would not be me, and I would not have been
where I am now. I love you mom.

v
TABLE OF CONTENTS
Dedication ................................................................................................................................... ii
Acknowledgements .................................................................................................................... iii
List of Tables ........................................................................................................................... viii
List of Figures ............................................................................................................................. x
CHAPTER 1 INTRODUCTION ............................................................................................... 1
1.1 Introduction .................................................................................................................. 1
1.2 Background.................................................................................................................. 2
1.3 Research Motivations and Objectives .......................................................................... 6
1.4 Organization of Dissertation ......................................................................................... 8
CHAPTER 2 FACTORS INFLUENCING OR UTILIZATION ..................................................10
2.1 Introduction and Literature Review ..............................................................................10
2.2 Method ........................................................................................................................12
2.2.1 Data .....................................................................................................................12
2.2.2 Stepwise Regression ...........................................................................................15
2.2.3 Best Subset .........................................................................................................16
2.2.4 Model Performance Evaluation ............................................................................16
2.2.5 Model Validation ..................................................................................................16
2.2.6 Simulation ............................................................................................................17
2.3 Results ........................................................................................................................20
2.3.1 Statistical Analysis ...............................................................................................20
2.3.2 Simulation ............................................................................................................25
2.4 Discussion ..................................................................................................................33
2.5. Conclusion ......................................................................................................................39
vi
CHAPTER 3 PROBABILITIES OF UNDER- AND OVER-RUN OF SURGERY LISTS CONSISTING OF MULTIPLE CASES ...............................................................41
3.1 Introduction and Literature Review ..............................................................................41
3.2 Methods ......................................................................................................................44
3.2.1 Log-normality Tests of Individual Case Duration Distributions ..............................45
3.2.2 Distribution of Duration of Surgery Lists with Multiple Cases ................................45
3.3 Results ........................................................................................................................50
3.4 Discussion ..................................................................................................................56
3.5 Conclusion ..................................................................................................................58
CHAPTER 4 PROACTIVE MANAGEMENT OF OPERATING ROOM RESOURCES THROUGH OPERATIONAL SIMULATION ........................................................60
4.1 Introduction and Literature Review ..............................................................................60
4.2 Method ........................................................................................................................64
4.2.1 OR Simulation Model Scope ................................................................................64
4.2.2 Description of Simulation Model ...........................................................................66
4.2.3 Proactive Management of Operating Room Resources (POM-ORS) ...................66
4.2.4 Delay Risk Estimation and Prioritization ...............................................................68
4.2.5 Debottlenecking Delay Reasons ..........................................................................70
4.3 Case Study Application ...............................................................................................72
4.3.1 POM-ORS Results ...............................................................................................74
4.3.2 Discussion ...........................................................................................................78
4.4 Conclusion ..................................................................................................................82
CHAPTER 5 BEHAVIORAL STUDY OF MEAN TURNOVER TIMES AND FIRST CASE START TARDINESS ..........................................................................................84
5.1 Introduction and Literature Review ..............................................................................84
5.2 Methods ......................................................................................................................86

vii
5.2.1 Allocated OR Time ...............................................................................................87
5.2.2 Behavior of the OR Staff ......................................................................................88
5.3 Results ........................................................................................................................94
5.4 Discussion ..................................................................................................................97
5.5 Conclusion ................................................................................................................ 101
CHAPTER 6 CONCLUSIONS ............................................................................................. 102
6.1 Conclusions .............................................................................................................. 102
6.2 Future Research ....................................................................................................... 103
Appendix A: Actual Utilization and Predicted Utilization from Stepwise Regression and Best Subset Models ................................................................................................. 105
Appendix B: Statistics of OR Utilization of Four Case Duration Distributions from Simulations . ....................................................................................................................... 110
Appendix C: Statistics of OR Inefficiency of Four Case Duration Distributions from Simulations ....................................................................................................................... 112
Appendix D: Statistics of Mean Patient Wait Time of Four Case Duration Distributions from Simulations ...................................................................................................... 114
Appendix E: POM-OR Performance for Each Simulation Run on Over-utilized OR Time ... 116
Appendix F: POM-OR Performance for Each Simulation Run on Cancellation ................... 117
Appendix G: Sequence of Tardiness Elimination from POM-OR ......................................... 118
Appendix H: Percentile Values of the Distribution of the Duration of Surgery Lists with 10 Historical Cases ............................................................................................... 121
References ............................................................................................................................. 170
Abstract................................................................................................................................... 183
Autobiographical Statement .................................................................................................... 185

viii
LIST OF TABLES
Table 1: Stepwise Regression and Best Subset Model Statistics .................................................... 21
Table 2: Summary of Model Performance............................................................................................ 21
Table 3: Top Factors from Stepwise Regression Model Result ........................................................ 23
Table 4: Top Factors from Best-subset Model Results ...................................................................... 24
Table 5: First-case On-time Start Performance ................................................................................... 35
Table 7: Percentages of Lists below Calculated Percentiles for Proposed Method and T-distribution .................................................................................................................................. 52
Table 8: Percentages of Lists below Calculated Percentiles for Proposed Method and Monte Carlo Simulation ........................................................................................................................ 53
Table 9: Absolute Differences between Percentiles Identified by Pearson Distribution and Monte Carlo Simulation ........................................................................................................................ 54
Table 10: Example of Delay Outputs .................................................................................................... 71
Table 11: OR Case Schedule ................................................................................................................. 74
Table 12: (a) Effects of POOM-ORS on Over-utilized OR time and Case Cancellation; (b) Effect of Debottlenecking Multiple Delay Reasons at a Time on Percentage of Days with Over-utilized OR time ............................................................................................................ 76
Table 13: Percentiles for Defined Variables in the Behavioral Study ............................................... 90
Table 14: Difference in the Inefficiency of Use of Operating Room (OR) Time between Actual and Optimum Allocation of OR Time ................................................................................... 95
Table 15: Outputs of Primary Structural Equation Modeling ............................................................. 96
Table 16: Key Outputs of the Sensitivity Analyses of the Structural Equation Modeling .............. 97
Table 17: Actual Utilization and Predicted Utilization from Models for May .................................. 105
Table 18: Actual Utilization and Predicted Utilization from Models for June ................................. 106
Table 19: Actual Utilization and Predicted Utilization from Models for July .................................. 107
Table 20: Actual Utilization and Predicted Utilization from Models for August ............................. 108

ix
Table 21: Actual Utilization and Predicted Utilization from Models for September ...................... 109
Table 22: Simulated Utilization for Case Duration Type 1 ............................................................... 110
Table 23: Simulated Utilization for Case Duration Type 2 ............................................................... 110
Table 24: Simulated Utilization for Case Duration Type 3 ............................................................... 111
Table 25: Simulated Utilization for Case Duration Type 4 ............................................................... 111
Table 26: Simulated Inefficiency of Use of OR Time for Case Duration Type 1 .......................... 112
Table 27: Simulated Inefficiency of Use of OR Time for Case Duration Type 2 .......................... 112
Table 28: Simulated Inefficiency of Use of OR Time for Case Duration Type 3 .......................... 113
Table 29: Simulated Inefficiency of Use of OR Time for Case Duration Type 4 .......................... 113
Table 31: Case Average Wait Time for Case Duration Type 2 ....................................................... 114
Table 30: Case Average Wait Time for Case Duration Type 21..................................................... 114
Table 32: Case Average Wait Time for Case Duration Type 3 ....................................................... 115
Table 33: Case Average Wait Time for Case Duration Type 4 ....................................................... 115
Table 34: Mean Over-utilized OR Time from Simulation ................................................................. 116
Table 35: Number of Cancellations from Simulation ........................................................................ 117
Table 36: Ranks of Delay Reasons for Baseline Model and POM-ORS for OR1 ........................ 118
Table 37: Ranks of Delay Reasons for Baseline Model and POM-ORS for OR2 ........................ 119
Table 38: Ranks of Delay Reasons for Baseline Model and POM-ORS for OR3 ........................ 120
Table 39: Percentile Values of the Distribution of the Duration of Surgery Lists from Type IV Pearson Distribution ............................................................................................................. 121
Table 40: Percentile Values of the Distribution of the Duration of Surgery Lists from T-distribution ............................................................................................................................. 137
Table 41: Empirical Percentile Values of the Distribution of the Duration of Surgery Lists from Monte Carlo Simulation ....................................................................................................... 153

x
LIST OF FIGURES
Figure 1: A hierarchy for operating unit production planning and control .......................................... 3
Figure 2: Data structure of our study ..................................................................................................... 13
Figure 3: Distributions of Four Types of Case Duration for Simulation ........................................... 18
Figure 4: First Case Start Tardiness Parameters ................................................................................ 19
Figure 5: Scheduling Strategy for Simulation ...................................................................................... 19
Figure 6: Utilization for Case Duration Type 1 and 2 .......................................................................... 26
Figure 7: Utilization for Case Duration Type 3 and 4 .......................................................................... 27
Figure 8: Cost Inefficiency for Case Duration Type 1 and 2 .............................................................. 28
Figure 9: Cost Inefficiency for Case Duration Type 3 and 4 .............................................................. 29
Figure 10: Pt. Wait Time for Case Duration Type 1 and 2 ................................................................. 31
Figure 11: Pt. Wait Time for Case Duration Type 3 and 4 ................................................................. 32
Figure 12: Gaps Analysis for Case Duration Type 1 .......................................................................... 36
Figure 13: Gaps Analysis for Case Duration Type 4 .......................................................................... 37
Figure 14: Histogram of Percentiles of Scheduled Duration of Surgery Lists of Type IV Pearson Distribution ............................................................................................................................. 55
Figure 15: Histogram of Percentiles of Sum of Mean Case Duration of Historical Cases of Type IV Pearson Distribution ......................................................................................................... 56
Figure 16: Peri-operative Workflow ....................................................................................................... 65
Figure 17: POM-ORS Process Flow Chart .......................................................................................... 68
Figure 18: Illustration of Effective Tardiness ........................................................................................ 69
Figure 19: Path Diagram of the Structural Equation Modeling .......................................................... 91
Figure 20: Percentage of Days with Simultaneous Turnovers Greater than 2 and Daily Mean Wait Time from the Turnovers ........................................................................................... 100

1
CHAPTER 1 INTRODUCTION
1.1 Introduction
The United States national health expenditures (NHE) consumed a large portion of gross
domestic product (GDP). In 2009, the NHE grew to $2.5 trillion and accounted for 17.6% of
GDP. This number has been projected to reach 4.6 trillion and 19.8% of GDP in 2020 (CMS
2010). The expensive health care costs impose high pressure on the economy and limit the
access, fairness, and quality of care. The striking numbers raise the need to improve the
efficiency of health care. For any health care systems, the key area to focus in order to maintain
the costs level is operating room (OR). According to some study, the operating rooms represent
more than 40% of a hospital’s total revenue (HFMA 2005). In addition, Macario et al. (1995)
pointed out that 33% of inpatients costs was from OR. Thus, operating room represents both the
highest revenue and highest costs care unit.
To keep track of OR’s performance, there have been several defined measures,
including staffing costs, daily OR start-time tardiness, case cancellation rate, turnover time,
utilization and so on (Macario 2006). Many healthcare organizations run under a fixed budget
(e.g. VA system and healthcare systems in Europe). For such organizations, utilization of care
resources needs to be maximized to maintain good cost efficiency. The majority of OR costs are
fixed costs, such as buildings, equipment, and labors (Macario 2010). To optimize the cost
efficiency of OR, the OR management needs to focus on increasing the usage of the fixed-cost
related resources. For example, when OR is staffed for 8 hrs, OR management would like to
schedule cases to fully utilize OR staff without incurring too much sunk costs due to the un-
utilized OR time. Or, for another example, when there are 30 ORs available for surgery, OR
management wants to use as many rooms to meet the patients’ surgery demand instead of
having many unused ORs. The OR utilization can potentially be impacted by many different

2
factors, such as OR availability and cases scheduling policies. An identification of the key
factors that influence the OR utilization assists the OR management to focus on the most
influential factors for utilization improvement, from where OR management and analysts can
develop efficient interventions to improve the performances.
1.2 Background
The operating room management, based on the timeline of planning, can be divided into
three stages, i.e. strategic, tactical, and operational. Based on the framework set by Vissers et
al. framework for planning of healthcare organizations (Vissers et al. 2001), a hierarchy for
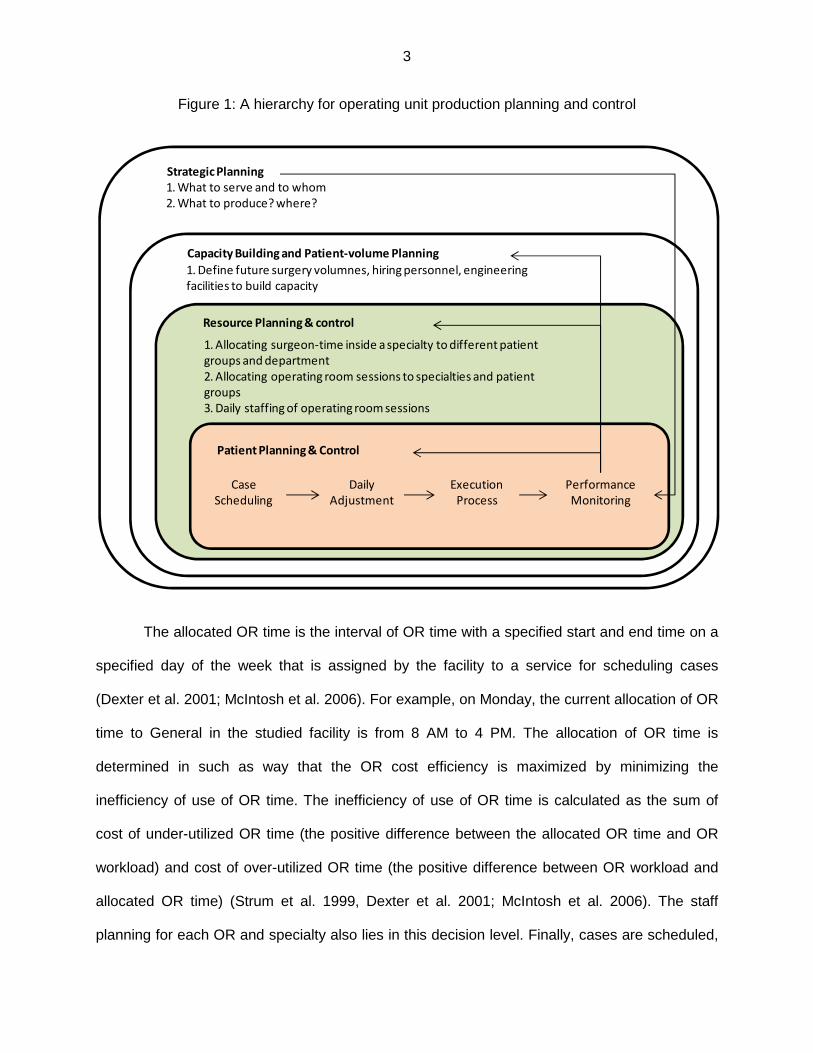
operating room planning was developed (Peltokorpi et al. 2009). As shown in Figure 1
((Peltokorpi et al.(2009)), the first level in the hierarchy is for strategic planning. During this
phase, the management decides on what type of surgeries to be done and what kind of patients
to be treated in house vs. sending to other facilities. The typical decisions include the surgical
specialties, surgeon expertise to be included in the facility, etc. For example, the management
decides to open a new surgery center for orthopedic patients or set a budget level for each
specialty. This type of decision is effective for years, and is not changed on a regular basis.
Once the strategic decisions have been made, the planning proceeds to the next level, where
the management estimates the demand of surgery from the patients, and determine how the
OR capacity meets the demand. The decisions at this level can be the number of ORs to open
or the additional block hours to be allocated to surgeons/specialties. Such decisions are made
on a yearly basis. At the third level, the available OR capacity is separated to each specialty
based on the demand and cost efficiency. The allocation of OR time usually takes place every
2-3 months in U.S. healthcare systems to adjust to the dynamics of demand.
3
Figure 1: A hierarchy for operating unit production planning and control
The allocated OR time is the interval of OR time with a specified start and end time on a
specified day of the week that is assigned by the facility to a service for scheduling cases
(Dexter et al. 2001; McIntosh et al. 2006). For example, on Monday, the current allocation of OR
time to General in the studied facility is from 8 AM to 4 PM. The allocation of OR time is
determined in such as way that the OR cost efficiency is maximized by minimizing the
inefficiency of use of OR time. The inefficiency of use of OR time is calculated as the sum of
cost of under-utilized OR time (the positive difference between the allocated OR time and OR
workload) and cost of over-utilized OR time (the positive difference between OR workload and
allocated OR time) (Strum et al. 1999, Dexter et al. 2001; McIntosh et al. 2006). The staff
planning for each OR and specialty also lies in this decision level. Finally, cases are scheduled,
Strategic Planning
1. What to serve and to whom
2. What to produce? where?
Capacity Building and Patient-volume Planning
1. Define future surgery volumnes, hiring personnel, engineering
facilities to build capacity
Resource Planning & control
1. Allocating surgeon-time inside a specialty to different patient
groups and department
2. Allocating operating room sessions to specialties and patient
groups
3. Daily staffing of operating room sessions
Patient Planning & Control
Case
Scheduling
Daily
Adjustment
Execution
Process
Performance
Monitoring

4
rearranged or adjusted, and performed (Figure 1). Once the cases are completed, OR
management can track the performances, which in turn, feed back to the planning of OR.
All levels of decisions have impacts on the performances of ORs. To investigate the
impacts of management decisions on OR, Peltokorpi tested 11 hypothesis that related strategic
and operational decisions to the productivity of OR (Peltokorpi 2011). They collected data from
15 hospitals in Finland, German, and USA. It was concluded that the case mix, representing the
complexity level of case and proportion of urgent cases, production strategy, which included the
size of OR and number of specialties, multi-skilled and flexible nurses and parallel processes
were key factors that affected the raw OR utilization. Wachtel and Dexter (Wachtel and Dexter
2008) studied the OR utilization problem from the tactical decision level and pointed out that the
expansion of OR capacity should not be based on utilization performance of subspecialties but
the contribution margin per OR hour, the potential for growth and need for limited resources. In
addition, the complexity of the OR suite and whether the surgery lists overran were the identified
strong predictor of OR utilization (Faiz et al. 2008).
Traditionally, the OR utilization was defined as the ratio of how many hours the OR was
in use and the allocated OR time, regardless of if the use of OR was outside of allocated OR
time. Later, people decided the OR utilization should only consider the usage of OR within the
allocated OR time and any over-utilized OR time is not counted towards the numerator. Thus, if
the last case ends one hour beyond the allocated OR time, the one-hour over-utilized OR time
is not included in the numerator of the utilization calcualtion formula. The problem with the
traditional definition is that from cost perspective that 10 hours used in allocated OR time is not
the same as 10 hours used outside of allocated OR hours. On observation of this, Strum et al.
brought up the concept of under-utilized OR time and over-utilized OR time (Strum et al. 1999).
In the cost model developed in the paper, the optimum allocated OR time depends on the
relative costs of under- and over-utilized OR time. The optimum OR allocation was the one that
ensures the OR workload can be completed within the allocated OR time with a probability that

5
equals the ratio of the unit cost of over-utilized OR time and sum of the unit cost of under- and
over-utilized OR time. Based on this pioneer work, Dexter et al. (Dexter et al. 2001) explored the
cost savings that can be achieved by re-allocating OR time. They compared the inefficiency of
use of OR time of different combinations of number of ORs and allocated OR time. They
concluded that their studied facility could have been saved 3% to 43% of the costs by pursuing
optimum OR allocation.
Compared to the operational decisions, the strategic and tactical decisions are relatively
static. The OR management generally do not change such decisions on a frequent basis. Thus,
operational decisions provide the management with more flexibility to achieve a desirable
performance level where management can adjust factors such as case schedules or turnover
activities in a short time frame. With respect to operational decisions, researchers came up with
solutions on how to schedule cases (Dexter et al. 1999; Dexter et al. 2002),how to release
allocated OR time (Dexter et al. 2003, Dexter and Macario 2004), and how to make decisions
on the day of surgery (Dexter and Traub 2000; Dexter et al. 2004) to maximize OR cost
efficiency. In the review paper (McIntosh et al. 2006), several interventions were studied with
respect to their impacts on the efficiency of use of OR time, including turnovers and first-case
delays. It was concluded that interventions to reduce either of them will only result in small
reduction in OR labor costs, but the degree of reduction is highly related with allocated OR time.
Dexter and Epstein (Dexter and Epstein 2009) used the same methods to propose a screening
mechanism to quantify the potential savings from the reduction of tardiness at the beginning of
the workday for ORs with workload greater than 8 hours (i.e. with over-utilized OR Time). By
using this methods, the OR team can evaluate the economic impacts of improving on-time
performance of first case and determine if focusing on starting workday on-time is the right
decision economically or to practice other interventions. According to the restuls, the first-case
delays were not a strong indicator to the performance on OR cost efficiency.

6
Many current research in OR management at operational level focuses on the efficiency
of use of OR time and OR utilization. However, the efficiency of use of OR time is not equivalent
to OR utilization performance. For example, given the cost ratio of under-utilized OR time to
over-utilized OR time is 1 to 2, then for an OR allocated with 8 hours (e.g. 8 AM to 4PM), a day
closes at 2PM (i.e. two under-utilized OR hours) is equivalent to a day close at 5PM (i.e. one
over-utilized OR hour). The utilization of the first OR would be likely to be smaller than it of the
second OR. Because the second OR has over-utilized OR time, it could be that the OR worload
within the allocated OR time for the second OR is more than the OR workload in the first OR.
From the perspective of utilization, OR manager would prefer the second OR given no
compromise in the efficiency of use of OR time and quality of care. For another example, if there
is a one-hour tardiness of the first case in the room closing at 2PM, then it does not impact the
overall utilization as the delay postpones the OR closing at 3PM but still all cases can be done
within the allocated OR time. On the other hand, if the tardiness is observed for the second OR,
then it matters as the tardiness may cause some OR workload that could have otherwise been
completed within the allocated OR time become over-utilized OR time; thus, decreasing both
the utilization and efficiency of use of OR time. It ususally is the goal of the OR management to
have effective plans to balance the performance between the OR utilizaiton and the efficiency of
use of OR time.
1.3 Research Motivations and Objectives
In current OR management studies, one of the key assumptions is that surgeons have
open access to the OR and the allocated OR time can be adjusted on a regular basis to achieve
an optimum efficiency of use of OR time. While this assumption is held for many healthcare
systems, such flexibility does not always present in healthcare systems, especially those in
Europe. Thus, for those OR facilities, given a fixed allocated OR time, to achieve a good OR
utilization level while control the over-utilized OR time is important.

7
Many factors could potentially influence the OR utilization, such as staffing, scheduling,
or turnover times; however, all the factors do not exhibit the same level of influences on the
utilizations. For more efficient OR operations, the identification of the key factors that influence
the OR utilization assists the OR management to focus on the most influential factors for
utilization improvement, from where OR management and analysts can develop efficient
interventions to improve the performances. Thus, in the first phase of our study, we intended to
distinguish the most important factors from the rest.
Once the key factors that impact the OR utilization have been filtered out, approaches
that target on the most important factors need to be designed to provide OR management with
decision-making tools that the OR manager can use to evaluate the rationality of current OR
practice and policies. As a sequence, the second goal of our study was to develop effective
interventions that OR managers can use to tackle the problems with the key factors.
Tardiness of case start time is frequently observed in OR, especially towards the end of
the workday. The tardiness makes patients unsatisfactory and prevents OR achieving better
efficiency of use of OR time by causing over-utilized OR time and cancellations. There are
multiple reasons for such tardiness, some of the reasons are more critical to others with respect
to performance in over-utilized OR time and cancellations. If the prioritization of these critical
reasons can be accomplished, then the OR manager can take proactive approach in advance to
prevent them from causing undesirable outcomes. We proposed an approach to facilitate the
identification of critical reasons for tardiness of case start.
One of the main differences between healthcare systems and manufacturing systems is
that human factor plays critical part in routine activities rather than machines. The complexity of
human behaviors and psychological conceptions impact the way care givers provide care to
patients (Reason 1995, Institute of Medicin 1999). The success of implementation of tools new
policies or new processes is subject to people’s response to the new regulations. If there is
psychological bias in OR staff’s behavior, tools and policies need to be implemented in order to

8
prevent bias from causing suboptimal performance level of OR. As a result, we explored the OR
staff’s behavior pattern during turnover times to obtain insights into how they perform work given
different workload and made recommendations regarding how to correct the bias of OR staff.
In summary the primary objectives of our dissertations are:
• Identify the most influential factors on OR utilization
• Develop approach to assist OR managers making decisions on identified key
factors
• Develop methodology to prioritize reasons for tardiness of case start in order to
reduce over-utilized OR time and cancellations
• Explore the OR staff’s behavior due to their psychological bias, if any.
1.4 Organization of Dissertation
In Chapter 2, we focus on identifying the most important factors that affect the OR
utilization. We first review current studies relate to OR utilization, then a few factors are
identified as candidates that highly correlate to OR utilization. We used the data collected from a
government healthcare organization to demonstrate the methods for filtering out from all the
identified factors the most influential ones that impact the OR utilization. Results from different
approaches were compared to each other and the best model was identified.
Based on the results from Chapter 2, we propose a new methodology in Chapter 3 for
surgical case scheduling where the goal is to meet the OR utilizatin and the over-utilized OR
time targets set by OR management. A background and literature review section is given at the
beginning of the chapter to provide readers with introduction of this topic and identify the gaps in
the literature. In next subsection, we adopt and discuss a new parametric distribution to
estimate the percentiles of the distribution of the duration of surgery lists with multiple cases.
One-year of surgery lists are used to compare the accuracy between our approach with
currently used student t-distribution in identify different percentile values. Based on the reliable

9
percentiles estimates, OR management can make changes to the schedule to control the risks
associated with both under- and over-utilized OR time.
Chapter 4 discusses about a simulation approach that the OR management can use to
tackle tardiness at the beginning of each case. The tardiness at the beginning of cases increase
the amount of both under- and over-utilized OR time. Such tardiness causes wastes in allocated
OR capacity. We propose an approach that has the ability to iteratively prioritize the delay risks
associated with each delay reason for each case. A case study is presented at the end to
illustrate the use of the simulation model as well as its limitations and benefits. Given such
information, the OR management has the ability to identify key tardiness for any given schedule
and take proactive approach to prevent adverse outcomes from the delays.
In Chapter 5, we tested the hypothesis if OR staff work faster on days with more OR
workload is expected than days with fewer OR workload by constructing a structural equation
model that consider the interactions and correlations among different schedule variables. This
analysis complements current studies in phychological bias of OR staff, proves the
commonness of defined bias, which the OR management can accomendate in new policy and
decision making.
In the last chapter, we summarizes the contributions and findings of our research. We
also suggest scope of future research for OR management.

10
CHAPTER 2 FACTORS INFLUENCING OR UTILIZATION
2.1 Introduction and Literature Review
In the previous chapter, we described the background of OR management and
emphasized the importance of OR utilization. The OR management prefers a high OR utilization
as it generally is an indicator that the expensive OR resources are providing patient care. There
are two ways to calculate the OR utilization. One is the raw utilization, and the other one is the
adjusted utilization. The raw utilization equals the total actual case duration of the OR divided by
its allocated OR time. The adjusted utilization equals the sum of total case duration of the OR
and turnover times (i.e. OR workload) divided by its allocated OR time (Abouleish et al. 2003,
Dexter et al. 2003). The adjusted utilization gives credits to OR staff for housekeeping and room
set ups (turnovers). Although turnover times are non-value added, they are necessary
preparation for surgeries during which OR staff fulfill their job duties. Thus, the adjusted
utilization accounts for all the time that OR staff work in OR. Peltokorpi (Peltokorpi 2011) looked
at the utilization problem from a rather high-level angle, such as the complexity level of cases,
the size of OR and the number of specialties. These factors usually do not/cannot vary on a
regular basis for a given facility. For example, the number of ORs or the number of specialties
cannot be changed randomly. It requires a lot of planning in advance, like the extra space for
the new OR, the capacity planning of the new specialties and the hiring of new surgeons and
staff. Besides, the good performance of OR is not the only goal of strategic planning of OR. It
also emphasizes on providing values to the community and to the needs of patients. Some
hospitals, especially no-profit hospitals in the U.S. perform surgeries that are of small or even
negative contribution margins to cure patients of particular needs (OR Manager 2000, Moody’s
Investor Services 2000). Thus, given preceding relatively static strategic and tactical decisions,
the OR management should optimize the OR utilization by making good operational decisions.

11
With respect to the OR utilization study, there are several preceeding literature that
studied the problem at operational level. There is a significant amount of papers on how to
schedule cases to meet performance targets. Arnaout and Kulbashian (Arnaout and Kulbashian
2008) tested the impacts of three heuristic algorithms (LEP, SEP, and LEPST) of sequencing of
case on the OR utilization. The inclusion and exclusion of turnover time in scheduling impacts
the optimum sequence. Jebali et al. (Jebali et al. 2006) established a optimization model to
assign operations to different rooms and sequence cases based on two strategies. The model
minimizes costs of patient waiting and overtime. Lamiri et al. (Lamiri et al. 2008) used column
generation approach to minimize the costs associated with underutilized and overutilized costs.
Ozkarahan (Ozkarahan 2000) used this approach to assign cases to make sure that any
specialty that with allocated OR time has privilege to its own block hours, each OR is used to
optimum level. By using a hierarchical goal programming to solve the surgical operations
scheduling problem in case of multiple operating rooms, multiple surgeon groups, and
conflicting goals in an acceptable solution time, Ogulata and Erol (Ogulate and Erol 2003)
optimized OR performance in three phases, aiming at balancing patients selection from different
categories to increase utilization, balancing distribution of operations among surgeon groups
while taking into account of priority and arrival time. There are other research on the OR
utilization using simulation and statistical analysis. For example, Tyler et al. (Tyler et al. 2003)
examined the mean case duration, the case duration variability, and turnover times on achieving
optimum utilization by using simulation. A higher variability of case duration results in a lower
utilization. Turnover times do not affect utilization but number of cases can be done. Dexter et
al. (Dexter et al. 1999) identified factors influencing variability of day-to-day utilization. Structural
equation modeling was using to establish relation among the statistics and related random
effects, after which Monte Carlo simulation were applied to analyze the impacts of the
elimination of the random terms, combination of terms and allocated OR time. The results from
the analysis indicated that selecting the days to perform procedure is important in the reduction

12
of variability. By using simulation, Steins et al. (Steins et al. 2010) evaluated different planning
and scheduling techniques to improve the OR utilization in a Sweden hospital. Through the
experiments, the OR utilization was improved through re-allocation of OR resources to fit
demand, redesign workflow of inpatients and outpatients, and different staff scheduling.
In NHS, OR utilization has been the principle measure of their OR performance
(Cranfield and Soljak 1989, The Modernisation Agency 2002, Faiz et al. 2008), as it reflects the
surgical volumne successfully admitted and operated on surgery lists of elective cases. For
facilities that have an unsatisfactory OR utilization level, the importance of OR utilization usually
coincides with the efficiency of use of OR time as the inefficiency is primarily caused by the
wasted unused OR capacity rather than over-utilized OR time and the improvement in utilization
always results in a better OR cost efficiency for such facilities. The prior studies focused on the
impacts of process redesign or specific factors on the utilization and evaluated the effectiveness
of interventions. There are multiple operational factors on the day of surgery that potentially can
influence the OR utilization. The impact level of each factor is different. Some factors are more
important than the other. Thus, the interventions targeting the most important factors are more
effective than resolving the problems with less important factors. In this chapter, we ranked the
importance of identified operational factors. Based on the conclusions from this chapter, the
following chapters study particular aspects that are important to the OR utilization performance.
2.2 Method
2.2.1 Data
Two data sources were used to retrieve the data we needed. One was from the surgical
package within the VISTA information system in the John D. Dingell VA Medical Center. The
other was the CPRS, which we used to gather the duration of cancelled cases. The data we
collected was from May 1, 2009 to September 30, 2009 (exclude weekends, May 25, 2009 for
the Memorial Day, July 3, 2009 for the Independence Day, and September 7, 2009 for the Labor

13
day). On August 26, 2009, the OR suites were closed due to water leakage. There were two
working days did not have complete schedule information (July 1, 2009 and July 2, 2009), so we
also excluded these two days. Thus, in total, we had 103-day data for analysis. We captured the
following data fields for each case: surgery date, OR, specialty, the time the patient entered the
OR, the time patient left the OR, scheduled case start and end time, cancellation status, and
case type (i.e. elective, emergent, add-on, and urgent). From the raw data, we calculated 12
variables for each day as shown in Figure 2:
Figure 2: Data structure of our study
1. Day of week. The block schedule of each day of week was different, and the OR
utilizations of different specialties were not necessarily the same (Wachtel and Dexter 2008).
Thus, for each day of week, the actual OR utilization was expected to be different.
2. Scheduled OR utilization. It was the baseline utilization. If the scheduled OR
utilization was high, then the actual OR utilization was expected to be high as well. The
Information System
Day of Week
No. of Completed
Cases
Scheduled OR Utilization
Actual OR Utilization
Total First Case Start Tardiness
Total Hrs of Cancellation
No. of Cancellations
No. of Turnovers
Total Turnover Times
Difference between actual and estimated
duration of cases
Total Duration of Add-on
Cases
No. of Add-on Cases

14
scheduled OR utilization equals the scheduled OR workload within the allocated OR time
divided by the allocated OR time.
3. Total first case start tardiness. If the day started late, then there was un-utilized
OR time in the allocated OR time at the beginning of workday, which would reduce the
actual OR utilization. This term equals the time difference between the time the patient
entered the OR of the first cases of the day and the scheduled case start time. If patient
entered the OR before the scheduled case start time, then the term was considered zero
(Dexter and Wachtel 2009, Wachtel and Dexter 2009).
4. Total hours of cancellation and number of cancellations: these two factors acted
negatively on the schedule by reducing the scheduled OR utilization.
5. Total hours of add-on cases and number of add-on cases: They were the
opposite of cancellations. If we added more cases, then the allocated OR time was more
likely to be filled up.
6. Differences between actual and estimated duration of cases: If the actual
duration of cases was less than the estimated duration, then there was unfilled space in
allocated OR time, causing OR utilization to decrease. On the opposite, if the actual duration
was greater than the estimated duration, then the close time of OR would be delayed to
increase the OR workload within the allocated OR time and the actual OR utilization.
7. Number of turnovers and total turnover times: as we calculated the adjusted
utilization in our study, if we had more turnovers or the turnovers take long time, then the
adjusted utilization was expected to increase. From this point on, if we did not specify, then
we used utilization to simplify adjusted utilization. Whenever the turnover times were greater
than 90 minutes, we rounded down the turnover times to 90 minutes. Longer turnovers
might due to gaps in schedule (i.e. non-sequential cases) (Dexter et al. 2005).
8. Number of completed cases. The more cases were scheduled, the more the
allocated OR time was filled. When we had more cases, the case duration of each case was

15
less, meaning the complexity of procedures was not high; thus, the prediction of case
duration would be more accurate. Consequently, it was more likely to fill up the allocated OR
time by scheduling many short cases.
9. Actual OR utilization. This is the dependent variable of our model. It depended on
the above 11 independent variables. It equals the actual OR workload within the allocated
OR time divided by the allocated OR time.
After the identification of factors that correlate with OR utilization, the most important
factors needed to be selected from the set of factors. We applied feature selection approaches
to achieve this objective. The following two subsections discuss the methods we used.
2.2.2 Stepwise Regression
Stepwise regression is one of the widely used methods to identify important factors
(Montgomery et al. 2001, Myers 1990) relate to the response variable. This method first fits all
possible one-variable models (i.e. the regression model with only one factor variable). The
factor with the largest t-statistics is selected as the best one-variable predictor of the response.
Then, the two-variable models are fitted by keeping the original selected factor and select the
second factor that has the largest t-statistics among the rest factors. At this point, the model re-
checks the significance of the first factor to see if it remains to be significant. If not, then the first
factor is removed, and another factor with the greatest absolute t-statistics in the presence of
the second factor will be included in the model. This process continues, and more and more
factors enter into the predictor set by adding one at a time. The process stops when there is no
more factors yielding significant t-statistics at a given � level (Type I error) (Mendnhall and
Sincich 2003, and Weisberg 1985). In their book, Mendenall and Sincich (Mendenall and Sincich
2003) mentioned that the stepwise regression is vulnerary to Type I / Type II errors due to the
large amount of t-tests; thus, they proposed another approach to supplement stepwise

16
regression, which was the all-possible-regressions selection procedure that is commonly
referred as best subset method.
2.2.3 Best Subset
In this approach, models with all possible combinations of factors are examined. For
each number of included factors, the model with highest R-square value is selected. Based on
the results, we selected the model with relatively small mean square error (MSE), good adjusted
R-square value, and a small Mallow’s Cp value close to the number of factors included in the
model (Mendnhall and Sincich 2003). Mallow’ Cp value measures the ratio of total mean square
error for the subset regression model with the variance of the random error for the true model. A
small Cp value approximating the number of prediction variables is an indicator of good model
performance.
2.2.4 Model Performance Evaluation
There are many criteria to select regression models (Montgomery et al. 2001, Myers
1990), such as R-square and adjusted R-square. For stepwise regression, we used the default
Minitab alpha value (0.15) to select the most important factors. Cp value was used to select
models of best subset method. To evaluate the model performance, we calculated several
prediction error evaluation terms, including prediction sum of squares or PRESS (Miller 1974),
mean absolute deviation (MAD), mean absolute percent error (MAPE), and root mean squared
errors (RMSE) (Chopra and Meindl 2006). The model whose prediction had the least deviations
from the observations was selected as the best one.
2.2.5 Model Validation
We applied the cross-validation method to validate our factor selection from stepwise
regression and best subset methods. Data set was split into two groups: training set and testing
set. The former set was used to establish the model. We checked if the model generated
17
accurate enough predictions against observations by substituting the testing set data into the
model concluded from the training set. We had five-month data. If data was collected
sequentially in time, we could select a time point to divide the data (Snee 1977). By using a
four-year data set, Cady and Allen (Cady and Allen 1972) developed a corn yield prediction
model. They used the first three years to build the model and tested on the last year. Feng et al.
(Feng et al. 2005) used best subset combined with cross-validation to set a predictive model of
honing surface roughness. By the same story, we divided our data by month. Each month’s
predicted values from the model derived from the rest four-month data were tested against the
observed values. Model validation was conducted on Microsoft Excel 2007 (Microsoft
Corporation, Redmond, WA) for preliminary data processing and Minitab 15 (Minitab Inc., State
College, PA) for model building.
2.2.6 Simulation
Some of the factors defined were not in full control of OR management, such as
cancellations or add-on cases from emergency department. The most controllable decision of
OR management was the scheduling of cases. Majority of papers on OR case scheduling
assumed a deterministic duration of the OR and solved an optimization problem. In order to
have a better understanding on the schedule’s impacts on the performance of OR provided
there is variability in surgery duration, we built a discrete-event simulation model. In our model,
a single OR’s performance was analyzed, and it was assumed that the OR repeatedly did one
type of procedures. Although in real scenario, the situation is more complex as the procedures
are usually different for the cases scheduled in the same OR, it is infeasible to simulate by using
real case data as the realization of cases in each OR on each day is different. For example, on
May 1, 2009, OR3 had three General cases, 1 Plastic Case and 1 Vascular Case, and on May
11, 2009, it only had 3 General cases. However, the conclusions from such a simplified model

18
could be generalized to other facilities by varying input parameters to generate different
scenarios that represent different OR conditions.
The scenarios were generated by varying parameters with respect to: case duration
distributions, first case start tardiness distributions and scheduled OR utilization (as shown in
the results that the case duration distribution and scheduled OR utilization are the most
important factors to influence OR utilization). In total, we had 72 scenarios. We selected an eye
cataract surgery for a particular surgeon in the studied facility during 2009 to have enough
sample size. Then, we used Arena 13 student version (Rockwell Automation, Wexford, PA) to fit
distributions to the case duration data set. We hypothetically generated other three types of
case duration by changing the coefficient of variation and mean case duration.
Figure 3: Distributions of Four Types of Case Duration for Simulation
Figure 3 illustrates the four case duration statistics we used in the simulation analysis.
The resulted distributions captured a large variety of case durations. In 2009, the facility
assigned 1 hr to this type of surgery; thus, the scheduled case duration for case type 1 and case
type 2 surgeries was 1 hour. As the mean case duration for case type 3 and case type 4 was
twice as many as those for case type 1 and case type 2. We assigned 2 hrs to the scheduled
case duration for the latter two types of case duration distribution.
D1:
Current
Distributions
D2:
Current Mean &
COV = 1
D3:
2* Current Mean & Current
COV
D4:
2* Current Mean &
COV = 1
Durations
Mean = 56
SD = 18
Mean = 112
SD = 36
Mean = 56
SD = 56
Mean = 112
SD = 112

We assumed two different distributions for
the first cases started on time or 10% of the first cases started on time. If there was tardiness,
then the duration followed a uniform distribution
minutes (Figure 4).
Figure 4
We also adjusted the number of cases on the final schedule (including cancellations and
add-on cases). A half-scheduled day was the baseline, and then we added case one by one
until the OR was approximately 100%
Figure
The turnover times we used for our analysis was a constant 15 minutes
was used in the studied facility.
relatively small compared to that of the
turnover times for this type of surgery were shorter than this number
50% On
Time
Case 1 Case 2 Case 3
Scenario 1
19
We assumed two different distributions for the first case start tardiness. Either 50% of
the first cases started on time or 10% of the first cases started on time. If there was tardiness,
then the duration followed a uniform distribution either from 1 to 30 minutes
4: First Case Start Tardiness Parameters
We also adjusted the number of cases on the final schedule (including cancellations and
scheduled day was the baseline, and then we added case one by one
until the OR was approximately 100% scheduled (Figure 5).
Figure 5: Scheduling Strategy for Simulation
The turnover times we used for our analysis was a constant 15 minutes
facility. There was variability in turnover times, but the amount was
that of the case distribution. Based on the data of 2009,
turnover times for this type of surgery were shorter than this number; thus a 15
UNIF(1,30)
UNIF(1,60)
UNIF(1,30)
UNIF(1,60)
10% On
Time
Case 5
Scenario 2
Case 3 Case 4
Scenario 1
Case 6
Scenario 3
Case 7
Scenario 4
Scenario 5
first case start tardiness. Either 50% of
the first cases started on time or 10% of the first cases started on time. If there was tardiness,
minutes or from 1 to 60
We also adjusted the number of cases on the final schedule (including cancellations and
scheduled day was the baseline, and then we added case one by one
The turnover times we used for our analysis was a constant 15 minutes as it was what
There was variability in turnover times, but the amount was
case distribution. Based on the data of 2009, 52% of the
15-minute turnover
Case8
Scenario 5

20
time was approximately the mean turnover time. In addition, both our statistical analysis (see
Results) and some previous research (Tyler et al. 2003, Abouleish et al. 2003) had excluded it
as a key factor in determining the OR utilization. For simplicity purpose, we used a constant
instead of a distribution to represent the turnover times. Each OR was scheduled to open from
8AM to 4PM. If any portion of the case duration laid beyond 4PM, then the duration was
considered as over-utilized OR time. We also assumed that the patients were ready for
surgeries 30 minutes ahead of the scheduled case start time. We ran the model for each
scenario with 5000 replications. We compared the identified scenarios based on their
performances in the OR utilization, the efficiency of use of OR time, and patients’ wait time on
the day of surgery. The inefficiency of use of OR time was calculated as under-utilized OR time
plus 1.75 times the over-utilized OR time (Dexter et al. 2001, Epstein and Dexter, 2002,
McIntosh et al. 2006). The patients’ wait time equaled the difference between the time the
patient entered the OR and the scheduled case start time. When the patient entered the OR
earlier than the scheduled case start time, the wait time was considered as zero.
2.3 Results
2.3.1 Statistical Analysis
Table 1 summarizes the model fitting statistics of the two feature selection methods.
Type I models were fitted by stepwise regression, and Type II models were from the analysis of
best subset. The month before the Greek number was the testing data set. For example, May I
refers to the model that was developed by data from June to September (training data) by
stepwise regression, and the data of May (testing data) was tested against the observed OR
utilization. September II is the model developed by using data from May to August by Best
Subset, and the data of September was used to validate the model. The adjusted R-square
values do not differ significantly among all the different models. So no model dominates the

21
others. The R-square values are around 0.8, indicating that our models explain a good portion
of the variability of the data set, and thus, the model is representative of the system we studied.
Table 1: Stepwise Regression and Best Subset Model Statistics
Model S R-Sq R-Sq(adj) PRESS R-Sq (Pred)
May I 0.06490 82.04 80.62 0.42229 76.31
May II 0.06432 82.60 81.00 0.40255 77.42
June I 0.07010 81.31 80.07 0.46902 76.25
June II 0.07014 81.30 80.10 0.46902 76.25
July I 0.06920 79.35 78.00 0.48873 72.59
July II 0.06916 79.30 78.00 0.48873 72.59
August I 0.05690 85.35 84.19 0.28746 82.89
August II 0.05691 85.40 84.20 0.28746 82.89
September I 0.06650 79.76 78.71 0.41205 75.53
September II 0.06623 80.50 78.90 0.41313 75.47
Table 2: Summary of Model Performance
Model MAD MAPE RMSE
May I 5.91% ± 1.10% 7.08 ± 1.23 0.07
May II 6.32% ± 1.14% 7.71 ± 1.28 0.08
June I 4.29% ± 0.69% 6.01 ± 1.01 0.05
June II 4.29% ± 0.69% 6.01 ± 1.05 0.05
July I 4.74% ± 0.77% 5.96 ± 0.92 0.06
July II 4.74% ± 0.77% 5.96 ± 0.92 0.06
August I 8.99% ± 1.37% 14.20 ± 1.96 0.11
August II 8.98% ± 1.37% 14.10 ± 1.96 0.11

22
September I 6.76% ± 0.95% 9.74 ± 1.34 0.08
September II 7.32% ± 0.86% 10.74 ± 1.28 0.08
Table 2 contains information of the prediction performance of each model. The MAD,
MAPE and RMSE do not differ dramatically among the models (Details on the prediction of each
model is in Appendix A).
Table 3 summarizes the most significant factors identified by stepwise regression and
Table 4 includes those identified by best subset. The most significant factors identified by
stepwise regression include the scheduled OR utilization, the difference between actual and
estimated duration of cases, total hours of cancellation (except for August), and total hours of
add-on cases (except for September). The factors identified by best subset method are the
scheduled utilization, the difference between actual and estimated duration of cases, total hours
of cancellation (except for August), and total hours of add-on cases (except for September). The
total first case start tardiness, however, is not a significant factor for most of Type I and II
models. There were some other factors identified to be significant but not at P=0.05 level. These
factors include the day of week, number of cancellations, total turnover times and number of
completed cases. Apparently, how the schedule looked like at 2PM on the previous day
(scheduled OR utilization), the accuracy of case duration prediction, how to manage
cancellations and how to add cases on to fill up the schedule are important for OR management
to optimize the OR utilization.

23
Table 3: Top Factors from Stepwise Regression Model Result
Model Factors Coefficient P
May I
Sche Util1 0.698 0.000
Diff (Actual - Estimated) 2 0.018 0.000
Cancel Hrs 3 -0.015 0.000
Add-on Hrs 4 0.017 0.001
First Case Dly 5 -0.008 0.049
June I
Sche Util 0.836 0.000
Diff (Actual - Estimated) 0.017 0.000
Cancel Hrs -0.016 0.000
Add-on Hrs 0.020 0.001
First Case Dly -0.008 0.047
July I
Sche Util 0.082 0.000
Diff (Actual - Estimated) 0.018 0.000
Cancel Hrs -0.015 0.000
Add-on Hrs 0.018 0.005
First Case Dly -0.009 0.056
Augusut I
Sche Util 0.818 0.000
Diff (Actual - Estimated) 0.020 0.000
Cancel Hrs -0.009 0.101
Add-on Hrs 0.026 0.000
First Case Dly -0.018 0.007
Cancel Case 6 -0.009 0.083
September I
Sche Util 0.720 0.000
Diff (Actual - Estimated) 0.018 0.000
Cancel Hrs -0.013 0.000
Complete Cases 7 0.006 0.104
1 Scheduled utilization
2 Difference between the actual and estimated duration of cases
3 Total hours of cancellations
4 Total hours of add-on cases
5 Total first case start tardiness
6 Number of cancellations
7 Number of completed cases

24
Table 4: Top Factors from Best-subset Model Results
Model Factors Coefficient P
May II
Sche Util 0.775 0.000
Diff (Actual - Estimated) 0.018 0.000
Cancel Hrs -0.016 0.000
Add-on Hrs 0.024 0.000
TOT Number 8 0.009 0.016
First Case Dly -0.008 0.076
WD9 -0.012 0.059
June II
Sche Util 0.836 0.000
Diff (Actual - Estimated) 0.017 0.000
Cancel Hrs -0.016 0.000
Add-on Hrs 0.020 0.003
First Case Dly -0.008 0.088
July II
Sche Util 0.818 0.000
Diff (Actual - Estimated) 0.018 0.000
Cancel Hrs -0.015 0.000
Add-on Hrs 0.018 0.005
First Case Dly -0.009 0.056
August II
Sche Util 0.818 0.000
Diff (Actual - Estimated) 0.020 0.000
Add-on Hrs 0.026 0.000
First Case Dly -0.018 0.007
Cancel Case -0.018 0.083
Cancel Hrs -0.009 0.101
September II
Sche Util 0.703 0.000
Diff (Actual - Estimated) 0.019 0.000
Cancel Hrs -0.013 0.000
TOT Time -0.004 0.118
Complete Cases 0.006 0.166
8 Number of turnovers
9 Day of week

25
2.3.2 Simulation
When we fitted the case duration distribution using Arena 13 Input Analyzer, it was
concluded that the best distribution was a three-parameter lognormal distribution with a mean
duration of 56 minutes and a variance of 16.4 minutes. We present the simulation results here
as pair-wise comparison. Case type 1 and case type 2 make up a pair, while case type 3 and
case type 4 make up another pair. The members in each pair have the same mean case
duration but of different case duration variance.
2.3.2.1 OR Utilization
Figure 6 and 7 plot the actual utilization vs. scheduled OR utilization for the pair of case
type 1 and case type 2 and the pair of case type 3 and case type 4 based on different first case
start tardiness distributions. For both pairs, the utilization increases as more and more cases
were scheduled, but the higher the case duration variability, the lower the actual OR utilization
on the average given the same scheduled utilization. Also, the increase in actual utilization
slows down as more and more cases were scheduled, which is depicted by the flattered slope
of the line segments towards the upper right. The first case start tardiness do not affect the
actual utilization when there are fewer scheduled cases. This is because that even though there
is tardiness at the beginning of the work day, all the cases could be done within the allocated
OR time. When the day is fully scheduled, the OR workload that would have been within the
allocated OR time if no tardiness happens lays outside of the allocated OR time and is
considered over-utilized OR time. Thus, the actual OR utilization of the delayed OR is lower
compared to the OR with the same scheduled OR utilization but less first case start tardiness.
However, the differences in OR utilization of different first case start tardiness distribution are
not significant (0% to 2% given the same scheduled utilization). The statistics on the OR
utilization performance of all types of case duration distribution are summarized in Appendix B.

26
Figure 6: Utilization for Case Duration Type 1 and 2
(a) Utilization for case Duration Type 1
(b) Utilization for Case Duration Type 2
50%
55%
60%
65%
70%
75%
80%
85%
90%
95%
100%
50% 63% 75% 88% 100%
Mean Actual OR Utilizations
50% 1st Delay 1 50% 1st Delay 2 90% 1st Delay 1 90% 1st Delay 2
50%
55%
60%
65%
70%
75%
80%
85%
90%
95%
100%
50% 63% 75% 88% 100%
Mean Actual OR Utilizations
50% 1st Delay 1 50% 1st Delay 2 90% 1st Delay 1 90% 1st Delay 2

27
Figure 7: Utilization for Case Duration Type 3 and 4
(a) Utilization for Case Duration Type 3
(b) Utilization for Case Duration Type 4
40%
50%
60%
70%
80%
90%
100%
50% 75% 100% 125%
Mean Actual OR Utilizations
50% 1st Delay 1 50% 1st Delay 2 90% 1st Delay 1 90% 1st Delay 2
40%
50%
60%
70%
80%
90%
100%
50% 75% 100% 125%
Mean Actual OR Utilizations
50% 1st Delay 1 50% 1st Delay 2 90% 1st Delay 1 90% 1st Delay 2

28
2.3.2.2 Efficiency of Use of OR Time
The X-axis of Figure 8 and Figure 9 are for the scheduled OR utilization. The Y-axis are
for the inefficiency of use of OR time (in minutes). The inefficiency decreases as more and more
cases are scheduled until beyond the optimum point. The explanation is that when fewer cases
are scheduled, the inefficiency of use of OR time is mainly due to the much under-utilized OR
time. As more cases are scheduled, less and less under-utilized OR time is expected, so the
inefficiency went decreases. However, the byproduct of more scheduled cases is the over-
utilized OR time. The over-utilized OR time is more expensive than the under-utilized OR time.
After a certain point, the over-utilized OR time becomes dominant, making the inefficiency
higher. Similar to the OR utilization, the first case start tardiness does not impact the inefficiency
until the day was more fully scheduled. For a 100% scheduled utilization, the differences in OR
inefficiency for different first case start tardiness are from 15 to 30 minutes on average. The
statistics on the inefficiency of use of OR time are summarized in Appendix C.
Figure 8: Cost Inefficiency for Case Duration Type 1 and 2
(a) Cost Inefficiency for Case Duration Type 1
45
65
85
105
125
145
165
185
205
225
50% 63% 75% 88% 100%
Mean OR Inefficiency
50% 1st Delay 1 50% 1st Delay 2
90% 1st Delay 1 90% 1st Delay 2

29
(b) Cost Inefficiency for Case Duration Type 2
Figure 9: Cost Inefficiency for Case Duration Type 3 and 4
(a) Cost Inefficiency for Case Duration Type 3
120
140
160
180
200
220
240
1 2 3 4 5
Mean OR Inefficiency
50% 1st Delay 1 50% 1st Delay 2 90% 1st Delay 1 90% 1st Delay 2
50
100
150
200
250
300
50% 75% 100% 125%
Mean OR Inefficiency
50% 1st Delay 1 50% 1st Delay 2 90% 1st Delay 1 90% 1st Delay 2

30
(b) Cost Inefficiency for Case Duration Type 4
2.3.2.3 Patient Wait Time on the Day of Surgery
The mean wait time increases towards the end of the day, as the variability and
uncertainty of total duration of previous cases compounds (Figure 10 and Figure 11). This
observation matches the previous study by Wachtel and Dexter (Wachtel and Dexter 2009) that
the wait time of case increased with the cumulative duration from previous cases. However, as
we simplified our scenarios and did not consider the moving of cases towards the end of the
day, the actual wait time for last cases was over-estimated. For the same first case start
tardiness probability, the higher the variability of the delay distribution, the more waiting is
expected. We also see the behavior of the second case for case type 1 and case type 2 is
different from the rest of the cases. The reason lies in the first case start tardiness distribution.
For the 2nd first case start tardiness distribution, we assumed that if the first case was delayed,
then the duration was uniformly distributed between 1 to 60 minutes. When the first case was
delayed for more than 30 minutes, the second patient entered the OR before the 1st case as
150
200
250
300
350
50% 75% 100% 125%
Mean OR Inefficiency
50% 1st Delay 1 50% 1st Delay 2 90% 1st Delay 1 90% 1st Delay 2

31
he/she was ready for the surgery 30 minutes ahead of scheduled case start time, making the
wait time less. However, this did not work for the patients with case duration type 3 and case
duration type 4. For these two case duration distributions, the scheduled case durations were 2
hours, even if the first patient delayed for one hour, the 2nd patient was not be ready until 30
minutes later, and so the wait time behavior for the patients with case type 3 and case type 4
were consistent. The statistics on patient wait time for each case are summarized in Appendix
D.
Figure 10: Pt. Wait Time for Case Duration Type 1 and 2
(a) Patient Wait Time for Case Duration Type 1
0
10
20
30
40
50
60
70
80
90
100
50% Delay 1 50% Delay 2 90% Delay 1 90% Delay 2
Mean Wait Time
Case 2
Case 3
Case 4
Case 5
Case 6
Case 7
Case 8

32
(b) Patient Wait Time for Case Duration Type 2
Figure 11: Pt. Wait Time for Case Duration Type 3 and 4
(a) Patient Wait Time for Case Duration Type 3
0
20
40
60
80
100
50% Delay 1 50% Delay 2 90% Delay 1 90% Delay 2
Mean Wait Time
Case 2
Case 3
Case 4
Case 5
Case 6
Case 7
Case 8
5
10
15
20
25
30
35
40
45
50
55
50% Delay 1 50% Delay 2 90% Delay 1 90% Delay 2
Mean Wait Time
Case 2
Case 3
Case 4
Case 5

33
(b) Patient Wait Time for Case Duration Type 4
2.4 Discussion
In this study, we identified the most significant factors influencing the OR utilization on
the day of surgery. There are a couple of things worthy to be mentioned here. First, the positive
sign in the stepwise and best subset models before the scheduled OR utilization is just an
indication that a higher scheduled utilization resulted in a higher actual OR utilization. We do not
want to over-emphasize that OR suite should schedule as many cases as possible. The OR
would face a lot of over-utilized OR time when there are too many cases scheduled, which is not
cost efficient. Then, the positive sign before the difference between the actual and estimated
duration of cases does not imply that we want to have all surgeries run longer than expected.
The tardiness from the under-estimation has the following patients wait in pre-op area and
sacrifices customers’ satisfaction for a higher utilization. The high ranking of this factor further
confirms the previous study in the studied facility that the case duration predictions were not
very accurate. In the studied facility, surgeons had a tendency to under-estimate the case
10
20
30
40
50
60
70
80
50% Delay 1 50% Delay 2 90% Delay 1 90% Delay 2
Mean Wait Time
Case 2
Case 3
Case 4
Case 5

34
durations, resulting in the actual OR utilization usually was higher than the scheduled OR
utilization from the performed cases (the mean difference between the scheduled and actual OR
utilization was 14% ± 1%). The increase in the OR utilization from the increased under-
estimation was because when the previous case overran, the OR did not need to wait for the
patient since most of the time the patient was ready for the surgery and waiting for the OR.
In our analysis, the turnover times did not significantly influence the utilization, which
matched previous research conclusions (Tyler et al. 2003, Dexter et al. 2003). Although the OR
utilization would not be significantly impacted by any shortened turnover times, short turnover
times would make OR suites to have less over-utilized OR or need fewer allocated OR time
(Dexter et al. 2003), so the efficiency of use of OR time would increase.
The importance of cancellation and add-on case is an indication that strategy is needed
to deal with cancellations and add-on cases. If a cancellation is avoidable in advance, the
management should identify it early enough, so the utilization can be managed by finding a
substitute case to replace the cancellation. If a cancellation is due to unpredictable reasons, it
will not adversely impact the utilization as long as OR can find a case to fill the cancelled hours.
It is thus important to establish an effective and efficient way to look for cases on the waiting list
and manage the cancellation. Dexter et al. (Dexter et al. 1999) studied the scheduling approach
of add-on cases. They found out that the off-line best-fit descending algorithm generated the
best efficiency of use of OR time. Usually, there is either one or zero add-on case for each OR.
When there is an add-on case, the OR manager could use the mean case duration of historical
cases to plan the scheduled case duration and assign the case to the OR.
The first case start tardiness did not have significant impact on the OR utilization. When
we looked at the first case start tardiness statistics, we figured out that for the studied facility,
the first case on-time start performance was not bad during the studied time range (Table 5). On
average, during May, 2009 and September, 2009, there were 469 first cases and 63% of them
started on time. The mean first case start tardiness was 13 minutes (Max = 62 minutes, Min =0).

35
The tardiness thus played no critical role in the utilization numbers. By simulation, we artificially
generated two different distributions of first case start tardiness. The results confirmed the
conclusions of the statistical analysis. Although there were some differences in OR utilization
when the ORs were almost fully scheduled given different first case start tardiness, the
differences were small and within 3% (Appendix B).
Table 5: First-case On-time Start Performance
Date Range No. of
1st Case
% On-time Start of
1st Cases
Mean Delay
5/1/2009 5/31/2009 94 65% 8
6/1/2009 6/30/2009 95 64% 9
7/1/2009 7/31/2009 103 60% 15
8/1/2009 8/31/2009 85 67% 17
9/1/2009 9/30/2009 92 58% 17
Total 469 63% 13
For the simulation model, we assumed that patients were ready 30 minutes ahead of
scheduled case start time. We did a gap analysis for between the time the previous patient left
OR and the scheduled case start time of next patient. By taking the extreme condition, we
considered the 2nd and the last case for case type 1 and case type 4 (i.e. cases with the
smallest mean and smallest variability and cases with the largest mean and largest variability).
Figure 12 are for the gaps of the cases of case type 1, and the charts in Figure 13 are for cases
of case type 4. Towards the end of the day, the uncertainty in patient wait time increased as
displayed by the wider range of gaps. While cases are expected to be delayed for longer time
towards the end of the day, they are also possible to start much earlier than the scheduled case
start time. For example, the maximum wait time for the 4th case of case type 4 could be as much

36
as 470 minutes, whereas it could start 100 minute ahead of the scheduled case start time. On
the other hand, the maximum wait time for the 2nd case of the same case type is 330 minutes,
and the patient could enter OR 60 minutes ahead of time. As shown, there is also probability of
OR staff being idle because the patient was not ready. As a result, another way to increase the
utilization by reducing the un-utilized OR time due to not-ready patients is to have patients ready
early for their procedures. However, we do not want to have patients wait for 3 or 4 hours also
hurt the quality of service and we may face constraints in pre-op beds. As for when to have
patients ready, a balance needs to be found between patients’ wait and room unoccupied
(Dexter and Traub 2000).
Figure 12: Gaps Analysis for Case Duration Type 1
(a) Gaps for the 2nd Case of Case Duration Type 1
0
200
400
600
800
1000
1200
Case 2

37
(b) Gap for the 7th Case of Case Duration Type 1
Figure 13: Gaps Analysis for Case Duration Type 4
(a) Gap for the 2nd Case of Case Duration Type 4
0100200300400500600700
Case 7
0
100
200
300
400
500
600
700
800
Case 2
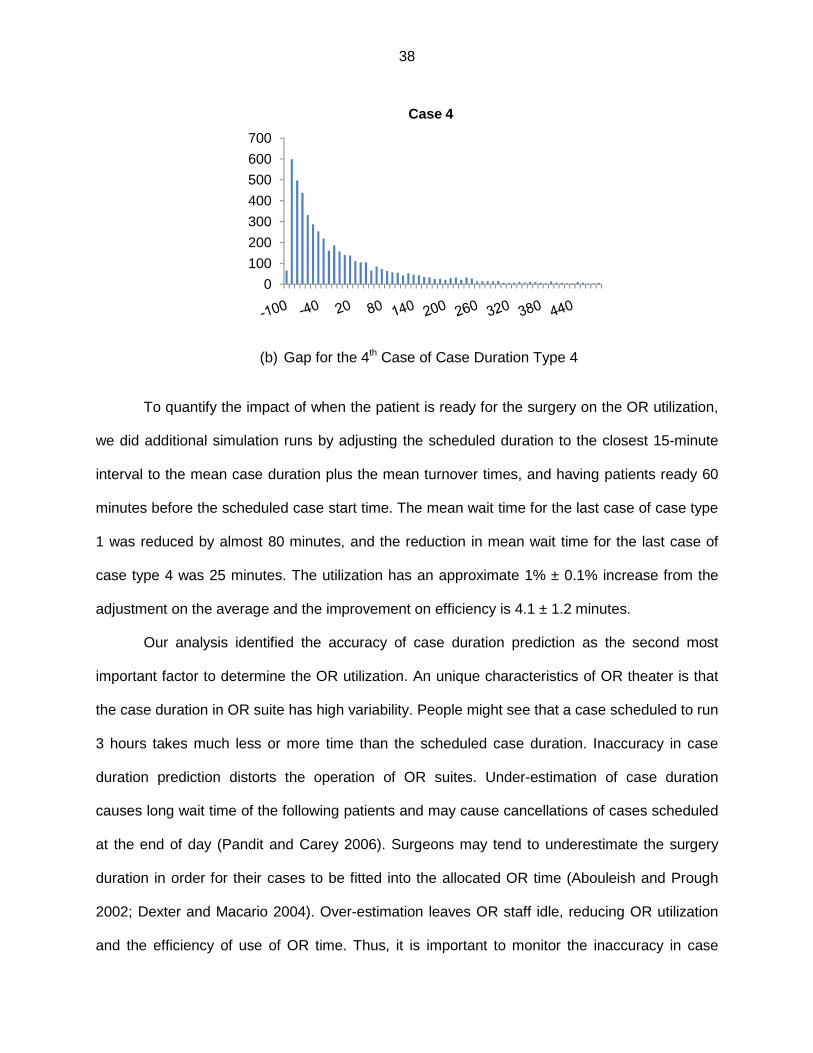
38
(b) Gap for the 4th Case of Case Duration Type 4
To quantify the impact of when the patient is ready for the surgery on the OR utilization,
we did additional simulation runs by adjusting the scheduled duration to the closest 15-minute
interval to the mean case duration plus the mean turnover times, and having patients ready 60
minutes before the scheduled case start time. The mean wait time for the last case of case type
1 was reduced by almost 80 minutes, and the reduction in mean wait time for the last case of
case type 4 was 25 minutes. The utilization has an approximate 1% ± 0.1% increase from the
adjustment on the average and the improvement on efficiency is 4.1 ± 1.2 minutes.
Our analysis identified the accuracy of case duration prediction as the second most
important factor to determine the OR utilization. An unique characteristics of OR theater is that
the case duration in OR suite has high variability. People might see that a case scheduled to run
3 hours takes much less or more time than the scheduled case duration. Inaccuracy in case
duration prediction distorts the operation of OR suites. Under-estimation of case duration
causes long wait time of the following patients and may cause cancellations of cases scheduled
at the end of day (Pandit and Carey 2006). Surgeons may tend to underestimate the surgery
duration in order for their cases to be fitted into the allocated OR time (Abouleish and Prough
2002; Dexter and Macario 2004). Over-estimation leaves OR staff idle, reducing OR utilization
and the efficiency of use of OR time. Thus, it is important to monitor the inaccuracy in case
0
100
200
300
400
500
600
700
Case 4

39
duration prediction. Dexter et al.(Dexter et al. 2005) developed a method to assist the measure
of bias in scheduled case durations. In their paper, the number of minutes of under-estimated
case duration per eight hours of OR time was calculated for four-week time intervals. The lower
95% lower confidence bound for the average bias in scheduled case duration could be
calcuated by using Student’s t-distribution to identify the bias.
The most important factor for OR utilization was the scheduled OR utilization. Simulation
results show that when the total estimated duration of cases on the schedule was close to the
full capacity, the OR utilization and efficiency of use of OR time reached their optimum values.
OR schedulers can refer to the mean duration of historical cases to schedule OR cases. The
results from simulation demonstrated and confirmed the influence of case duration variability
and case duration prediction on OR utilization, the efficiency of use of OR time, and patient’s
wait time on the day of surgery. But the problem with OR case duration lies in its high variability.
For example, case type 1 and case type 2 were of the same mean case duration; however, the
performances differed between these two types of cases. Unlike manufacturing processes,
where the process variability is negligible compared to the mean, the OR duration variability is
very high. Thus, an effective way to manage the OR utilization and the efficiency of use of OR
time is to control the variability of duration of surgery lists besides the mean total scheduled
duration of cases. The control of the variability of the duration of surgery lists can be done
through surgery lists management that allows the OR scheduler to select cases such that even
with their variability, performance of OR can still meet the set targets. We will talk about the
surgery lists management in the next chapter.
2.5. Conclusion
In this chapter, we applied stepwise regression and best subset to identify the most
influential factors that impact the OR utilization. Simulation models were built to validate the
results and provided us with more insights into OR utilization management. Based on the

40
results, to increase OR utilization, the OR management should focus on the scheduling of
cases, including the scheduling of add-on cases and management of cancellations. The
prediction of the duration of surgery lists is also important in the determination of the utilization
as both under- or over-predicted case duration make the actual OR utilization deviate from it
scheduled value. For individual case duration prediction, the OR management can refer to the
mean case duration of historical cases to assign scheduled case duration as previous indicated
this approach provides a simple but useful estimate (Dexter et al.1999, Alvarez et al. 2010).
To manage the OR utilization, it is more important to control the uncertainties brought
into the system by the variability of case durations. As illustrated by the simulation study, given
the same mean case duration, a higher variability of case duration brings into the system more
uncertainty in the patients’ wait time and reduced the optimum utilization and the efficiency of
use of OR time. After a certain point, an increase in the OR utilization results in a decrease in
the OR cost efficiency; thus 100% utilization should not be the goal of management but how to
balance between the under- and over-utilized OR time, which requires an approach that would
provide the OR managers with accurate estimates of the probability of under- and over
utilization, which is the topic of our next chapter.

41
CHAPTER 3 PROBABILITIES OF UNDER- AND OVER-RUN OF SURGERY LISTS CONSISTING OF MULTIPLE CASES
3.1 Introduction and Literature Review
Operating room (OR) is one of the most expensive units for any hospitals (Macario et al.
1995, Denton et al. 2007). In order to control the costs, it is important for the OR management
to ensure that the allocated OR time is utilized as much as possible with little over-utilized OR
time, i.e. maximizing the efficiency of use of OR time (Strum et al. 1997, Dexter et al. 2001,
Dexter and Traub 2002, McIntosh et al. 2006). When the duration of surgery lists is longer than
the allocated OR time, over-utilized OR time is observed. On the other hand, when the duration
is shorter than the allocated OR time, under-utilized OR time is seen and some OR capacity is
wasted. In previous chapter, we concluded that the scheduling and the accuracy of case
duration prediction are the most important factors that affect OR utilization. And the simulation
results suggested that scheduling case use the mean case duration of historical cases and
having scheduled OR utilization approximately equal the allocated OR time would generate the
optimum OR utilization and efficiency of use of OR time. The simulation also show the
importance of control the case duration variability as the higher the variability, the lower the OR
utilization and efficiency. Thus, it is important for the OR management to have a reliable tool to
evaluate and manage the variability of case duration. When surgeons are allowed to schedule
elective cases on any workdays they choose, the maximum efficiency of use of OR time can be
achieved by predicting the future OR workload (Dexter et al. 1999) and determining the
optimum OR allocation (Dexter et al. 2001, McIntosh et al. 2006). If the costs of over-utilized OR
time is 1.75 times the costs of under-utilized OR time, then 2/3 of the ORs’ should be closed
within the allocated OR time (McIntosh et al. 2006). In most U.S. OR suites, the decisions on
OR allocation can be made every 2-3 months. For these system, the case duration prediction
accuracy is less a problem as the decisions on OR allocation take into consideration of the case

42
duration prediction inaccuracy as they use the actual workload for calculation (Dexter et al.
2001, McIntosh et al. 2006). With more than two historical cases of the same combination of
surgeon and procedure(s), the reduction in over-utilized OR time is negligible from a more
accurate prediction in case duration model instead of the mean case duration of historical
cases. People work late because of the workload rather than underestimation in case durations
(Dexter et al. 2004).
However, the OR allocation optimization approach does not apply any more to European
OR theaters. In these facilities, the demand for surgery is so high that patients have to enter
waiting list and might need to wait months before their surgeries are scheduled. In addition, the
allocated OR time is static. The ORs in Europe do not usually change the OR allocation (Pandit
and Tavare 2011). The way to maximize the efficiency of use of OR time is to avoid both under-
and over-utilized OR time through scheduling versus OR allocation decisions. A method to
accurately estimate the duration of surgery lists is needed for this type of system.
Much research has been done in predicting the case duration of single cases (Zhou and
Dexter 1998, Strum et al. 2000, Strum et al. 2003, Ejkemans et al. 2010, Li et al. 2010).
However, even with very complicated models, the improvements in case duration accuracy
were not enough to significantly reduce the tardiness of case starts (Zhou et al. 1999, Wachtel
and Dexter 2009) or were better than simpler methods (Strum et al. 2000, Macario and Dexter
1999). More accurate models only improved the prediction on the central tendency (Zhou and
Dexter 1999). As there is high variability associated with case duration (Macario 2009), such
improvements only would have limited impacts in practice. Especially when there are multiple
cases along with turnover times, the cumulative effects of the high variability make it even more
difficult to predict the duration of surgery lists accurately.
The expected duration of surgery lists can be derived using the mean case duration of
historical cases. However, the high variability of case durations makes the expected close time
of OR not a reliable estimate. It is not uncommon to see the surgery lists under- or over-run by
43
more than an hour. To have a good efficiency of use of OR time, it is more practical for OR
managers to estimate how reliable that the surgery lists can be done within a pre-defined range
with some tolerances in both under-utilized and over-utilized OR time. For example, the
allocated OR time is 8 hrs, and the OR manager wants to know what the probability is that the
scheduled surgery list can be finished between 7 hrs and 8.5 hrs. If the probability is high, such
as 85%, then the list can be finalized as it will not generate huge amount of under- or over-
utilized OR time. Otherwise, the OR manager can rearrange the cases on the surgery list until
an acceptable probability is obtained. This problem has been barely studied in OR setting.
Dexter et al. (Dexter et al. 1999) built an optimization model and concluded that using mean
case duration of historical cases to schedule the surgery lists actually generates the optimum
efficiency of use of OR time. But their problem is different from ours as it assumed that
surgeons had open access to OR and the allocated OR time had been optimized to maximize
the efficiency of use of OR time which is not applicable to European systems. Alvarez et al.
(Alvarez et al. 2010) explored if the second tertile cut-off point was better than sum of mean
case duration in predicting over-utilization. They reached the same conclusion as Dexter et al.
(Dexter et al. 1999). However, they only studied the cardiovascular surgeries, and the results
could not be generalized to other specialties. In 2011, Pandit and Tavare (Pandit and Tavare
2011) proposed a scheduling algorithm with the concept of planning surgery lists based on the
probability that the duration of surgery lists would not exceed the defined limits for under- and
over-utilization. In their work, the duration of surgery lists was assumed to followed t-
distributions with a mean equaling the sum of mean case durations of each case on the surgery
list plus the turnover times and a standard deviation equaling the pooled standard deviation
from cases scheduled. They proved that this approach was much better than the ad-hoc
scheduling approach in their facility. Although their approach generated promising results, the
assumption that the duration of surgery lists followed t-distributions is not a good representation
of the duration of surgery lists as indicated by previous research that individual surgery case

44
duration followed log-normal distributions (Strum et al. 2000, Strum et al. 2003). The sum of log-
normally distributed case durations does not follow a Gaussian distribution. The probabilities
calculated from t-distribution would deviate significantly from the true values.
In this study, we proposed a new way to approximate the real distribution of the duration
of surgery lists. First, we tested the hypothesis that the individual case duration was log-
normally distributed. Then, the new distribution was introduced to approximate the true
distribution of duration of surgery lists. We checked the accuracy of the proposed method by
testing the distribution percentiles generated from the proposed distribution against real data
from one-year surgery lists with multiple cases (Zhou and Dexter 1998, Dexter et al. 2001,
Dexter and Ledolter 2005). If the percentiles were accurate, then the proposed distribution
should be close to the real distribution. We compared the results from the proposed distribution
with the results generated by t-distribution (Pandit and Tavare 2011). After this, we identified the
optimum number of previous cases for the combinations of surgeon and procedure(s) to derive
reliable parameters of case duration distribution to facilitate the implementation of the proposed
method in practice.
3.2 Methods
Data was collected for all surgeries performed from January 1, 2005 to December 31,
2011 in John D. Dingell VA Medical Center located in Detroit, MI. Among the surgeons who
worked in 2011, some surgeons had worked for the studied facility since 2005. Thus, in order to
include complete information, we extracted data from back to 2005. Data from January 1, 2005
to December 31, 2010 was used to estimate the parameters of case duration distribution. Data
from January 1, 2011 to December 31, 2011 was the testing data set to evaluate the
performance of the proposed method.
The analysis was done in two phases. As our proposed method was based upon the fact
that individual case duration in a surgery list followed a log-normal distribution, thus in the first

45
phase, we checked the validity of this log-normal assumption of individual case duration. Then,
we introduced a new distribution to approximate the duration of surgery lists for the OR
managers to evaluate the rationality of the scheduled surgery list and make decisions.
3.2.1 Log-normality Tests of Individual Case Durati on Distributions
From January 1, 2005 to December 31, 2010, there were 15646 cases, 0.8% (121 of
15646) of which had incomplete information on case duration. We excluded these cases from
analysis. There were 2994 different combinations of surgeon and procedure(s). Studies had
shown that type of anesthesia was also an important factor impacting the case duration (Strum
et al. 2000); however, when surgeons scheduled cases, they did not consult anesthesiologists
and not always know the type of anesthesia to be used, making this information incomplete and
unreliable. Thus, we did not consider the type of anesthesia in our studies. There were 127
combinations of surgeon and procedure(s) (7496 cases) with moderate to large sample sizes
(n≥20). We used case durations of these combinations to test whether case durations were log-
normally distributed. We calculated the natural logarithms of case durations for each
combination. Then, Shapiro-Wilk tests were conducted for the log-transferred data sets. If the P-
value for the test was greater than 0.05, then we failed to reject that the case durations of the
combination of surgeon and procedure(s) followed a log-normal distribution. The analysis was
done using R 2.15.0.
3.2.2 Distribution of Duration of Surgery Lists wit h Multiple Cases
In 2011, there were 1463 surgery lists. A list consisted of cases taking places in the
same OR on the same day. When a case was moved to another OR or was cancelled, the
captured data was not able to identify. Thus, we only relied on the actual surgery lists that
recorded the actual location and times of finished cases versus the lists on the original
schedules. This did not affect the analysis as the method to estimate probability does not
change with number of cases on the surgery lists or location of cases. Each surgery list included
46
one up to seven cases, i.e. one to 13 cases and turnovers. As the methods to calculate
percentiles of single case duration distribution had been examined (Zhou and Dexter
1998,Dexter and Ledolter 2005) and the focus of our study was on the duration of surgery lists
of multiple cases, we excluded 37% (547 of 1463) of the surgery lists containing only one case.
Among the remaining lists, 44% (401 of 916) consisted of at least one case with no or only one
historical case. It made the estimation of case duration variance infeasible. We excluded these
lists as well, leaving 515 lists for analysis.
The sum of log-normal variables has been studied in electronic engineering field to
analyze the performance of wireless communication systems (Fenton 1960, Schwartz and Yeh
1982, Wu et al. 2005). The research assumed that the sum of lognormal variables followed a
new lognormal distribution. However, this assumption has been proved to be false (Beauliu and
xie 2004, Nie and Chen 2007). In order to overcome this shortcoming, Nie and Chen (Nie and
Chen 2007) proposed a new model where they used Type IV Pearson distribution to model the
sum of log-normal variables. In the model, the distribution of sum of log-normal variables was
approximated by matching the mean, variance, skewness and kurtosis of a Type IV Pearson
distribution with those of the sum of the log-normal variables. The model was quite accurate in a
wide probability range. The following paragraphs describe in details how the approximation
works.
Assume there are � independent log-normally distributed variables ��, ��, ��, … , �� .
The density function of each variable can be written as:
�� � � �√������ � � �� ��������� !��
���"#
Where $% and &% are the parameters of log-normal distributions in dB.
We introduce another constant ' � �()10�/10. Then, the sum of the N independent
variables equals:
-� � ∑ /0�%1�%2� � ∑ 3%45%�%2� Where 3% � exp�'$%� and 5% � exp �'�&%��

47
The variance of the sum is given by:
9� � : /0��% � /0�%1��1 � : 3%�5%�5% � 1��
%2�
�
%2�;
The third order central moment of the sum is given by:
<� � : /0��% � /0�%1��1 � : 3%�5%� �⁄ �5% � 1���5% > 2�;�
%2�
�
%2�
And the forth order central moment of the sum can be written as:
@� � : /0��% � /0�%1�A1�
%2�
� : 3%A5%��5% � 1��B5%A > 25%� > 35%� � 3D > 6 : : 3%�5%�5% � 1�3F�5F�5F � 1��
F2%G�
� �
%2�.
�
%2�
Based on the moments calculated per the above equation, the skewness and kurtosis of
the sum are derived as follows:
<I� � <�9�
� �J ,
KL� � @�9��
.
Many distributions were exploited to evaluate their accuracy in approximating the sum of
log-normal variables (Kwan and Leung 2006). They found that Type IV Pearson distribution had
the ability to provide accurate approximation in wide probability range. The probability density
function of Type IV Pearson distribution approximation to the sum of log-normal variables is:
M� � � N O1 > �� !P!Q ��R !� S exp O�$� arctan YZ !P
!Q [R, where
$� � �\ > 2� 2,⁄

48
$� � �\�\ � 2�<I�416�\ � 1� � <I�� �\ � 2��,
$� � ]9̂ 0\ � 1 � <I�� �\ � 2�� 16⁄ 1,
$A � -� � �\ � 2�<I� 49� 4⁄ ,
\ � 6�K$� � <I�� � 1�2K$� � 3<I�� � 6 .
Given the parameters of each log-normal variable, the corresponding parameters of
Type IV Pearson distribution can be obtained by using the above formulas. The percentile
values for each sum; thus, can be derived by using the inverse function of the cumulative
probability.
We adopted this method and evaluated its accuracy in defining the distribution of
duration of surgery lists. For each surgery list, we calculated the actual workload (i.e. the total
actual case duration of the surgery list plus the total turnover times). Whenever a turnover time
was longer than 90 minutes, we rounded the turnover time down to 90 minutes. We used 90
minutes as the maximum because 90 minutes was the 90th percentile of the turnover time in
2010 (McIntosh et al. 2006). Longer turnover times might be due to gaps in the OR schedule
(e.g. non-sequential cases) (Dexter et al. 2005). We did not consider using turnover times
before 2010 because the further the data was away from the studied date range, the higher the
risk that the distribution of turnover times had shifted (Dexter 1996, Zhou and Dexter 1998). We
compared the actual workload to the percentiles calculated from the Type IV Pearson
distribution for the duration of surgery list. If the actual workload was smaller than a percentile
value, then the counter for that percentile increased by one. This process was repeated for each
percentile value from 10th up to 90th percentile (Zhou and Dexter 1998, Dexter and Ledolter
2005). At the end, we were able to obtain the proportion of surgery lists whose actual workload
fell below each percentile.
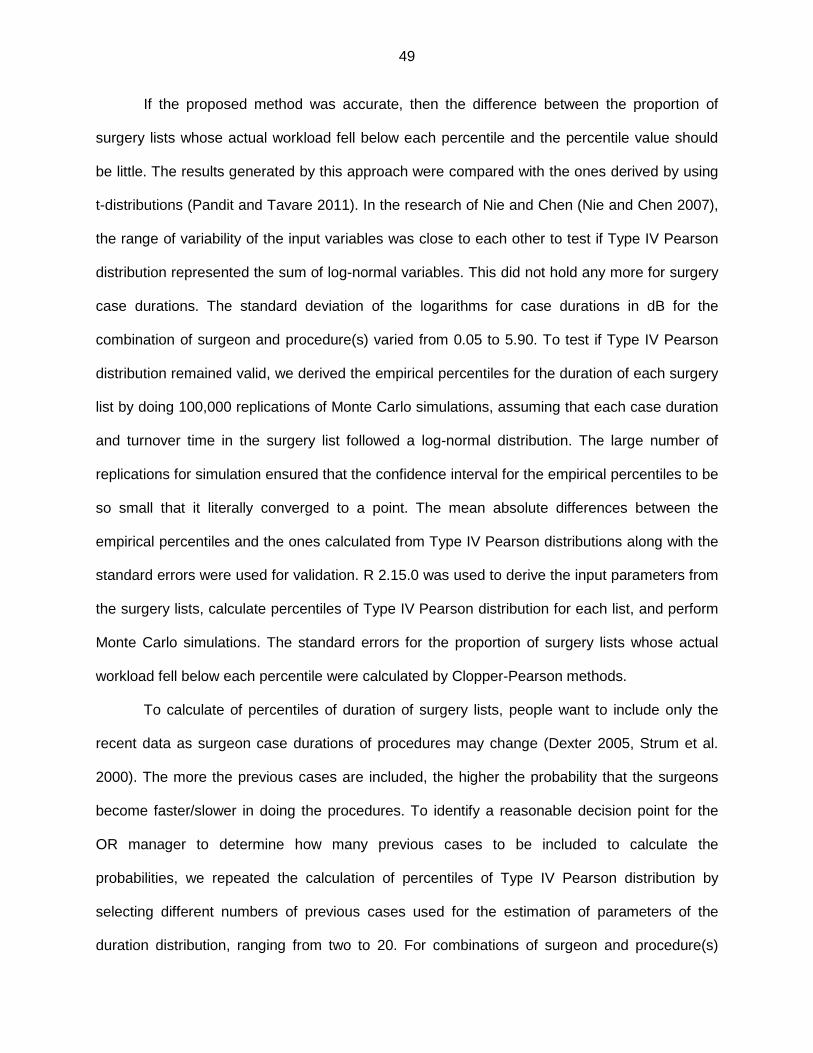
49
If the proposed method was accurate, then the difference between the proportion of
surgery lists whose actual workload fell below each percentile and the percentile value should
be little. The results generated by this approach were compared with the ones derived by using
t-distributions (Pandit and Tavare 2011). In the research of Nie and Chen (Nie and Chen 2007),
the range of variability of the input variables was close to each other to test if Type IV Pearson
distribution represented the sum of log-normal variables. This did not hold any more for surgery
case durations. The standard deviation of the logarithms for case durations in dB for the
combination of surgeon and procedure(s) varied from 0.05 to 5.90. To test if Type IV Pearson
distribution remained valid, we derived the empirical percentiles for the duration of each surgery
list by doing 100,000 replications of Monte Carlo simulations, assuming that each case duration
and turnover time in the surgery list followed a log-normal distribution. The large number of
replications for simulation ensured that the confidence interval for the empirical percentiles to be
so small that it literally converged to a point. The mean absolute differences between the
empirical percentiles and the ones calculated from Type IV Pearson distributions along with the
standard errors were used for validation. R 2.15.0 was used to derive the input parameters from
the surgery lists, calculate percentiles of Type IV Pearson distribution for each list, and perform
Monte Carlo simulations. The standard errors for the proportion of surgery lists whose actual
workload fell below each percentile were calculated by Clopper-Pearson methods.
To calculate of percentiles of duration of surgery lists, people want to include only the
recent data as surgeon case durations of procedures may change (Dexter 2005, Strum et al.
2000). The more the previous cases are included, the higher the probability that the surgeons
become faster/slower in doing the procedures. To identify a reasonable decision point for the
OR manager to determine how many previous cases to be included to calculate the
probabilities, we repeated the calculation of percentiles of Type IV Pearson distribution by
selecting different numbers of previous cases used for the estimation of parameters of the
duration distribution, ranging from two to 20. For combinations of surgeon and procedure(s)

50
whose numbers of previous cases were smaller than the selected sample size, all the historical
data was used for parameter estimation. After this was done, we investigated the problems in
current scheduling practice of the studied facility. We identified percentiles of the scheduled
duration of the surgery lists with respect to the Type IV Pearson distribution from the scheduled
procedures in the surgery lists.
3.3 Results
Among the 127 combinations of surgeon-procedure(s) with moderate to large sample sizes
to test whether case durations of combinations of surgeon and procedure(s) followed log-normal
distributions, the P-values of Shapiro-Wilk tests on the natural logarithms of case durations of
88 combinations (69%) were greater than 0.05. The majority of the case durations were log-
normally distributed, matching the findings of previous research (Strum et al. 2000, Strum et al.
2003). As a result, it is reasonable for us to proceed to the next step to define the distribution of
surgery lists with multiple cases assuming log-normal distributions.
The proportions of surgery lists whose actual workload fell below the distribution percentiles
defined by Type IV Pearson distribution and by t-distribution were close to each other towards
the center of distributions from 40th to 70th percentiles (Table 7). Between 20th and 80th
percentiles, the proportions were close to corresponding percentiles of Type IV Pearson
distribution when we used 10 or more previous cases with the same combination of surgeon
and procedure(s) for parameter estimation. T-distribution was not robust for as a wide range. It
was only good for between 40th and 70th percentiles. It performed significantly poor at identifying
tail probabilities at both ends. The absolute differences in proportions were 20% ± 2% (mean ±
SE) and 19% ± 2% for 10th and 90th percentiles calculated by t-distribution, while the differences
were 5% ± 2% at these two percentiles for Type IV Pearson distribution. Overall, the absolute
differences in proportions were 3% ± 1% for Type IV Pearson distribution and 11% ± 2% for t-
distribution. Table 7 gives the proportions of surgery lists below the defined percentiles from

51
both Type IV Pearson distribution and t-distribution based on different number of previous cases
used for distribution percentiles estimation. The accuracy of the empirical percentiles generated
by Monte Carlo simulation matched those calculated by Type IV Pearson distribution (Table 8),
The absolute difference between the percentile values from simulations and Type IV Pearson
distribution for each percentile varied from 0.20 ± 0.01 minutes to 0.43 ± 0.03 minutes (Table 9),
validating that Type IV Pearson distribution provided a very accurate approximation to sum of
log-normal variables regardless of the ranges in mean and variances (A sample of the
percentile values from Monte Carlo simulation, Type IV Pearson distribution and t-distribution
with 10 historical cases are documented in Appendix H).
As indicated by the Figure 14, the scheduled duration of surgery lists were very inaccurate
in 2011. Based on the calculation of the percentile values of the scheduled duration of surgery
lists with respect to associated Type IV Pearson distributions, we saw significant under- and
over-estimations (from less than 10% to more than 90%). The mean difference between the
scheduled durations of surgery lists based on surgeons’ estimates and the actual duration of
surgery lists was 5.9 ± 4.5 minutes with an absolute mean difference of 75 ± 3 minutes,
whereas the mean difference was 1.0 ± 3.4 minutes with an absolute mean difference of 54 ± 2
minutes if the surgery lists were scheduled per the sum of mean case duration of historical
cases with the same combination of surgeon and procedure(s) (Figure 15).
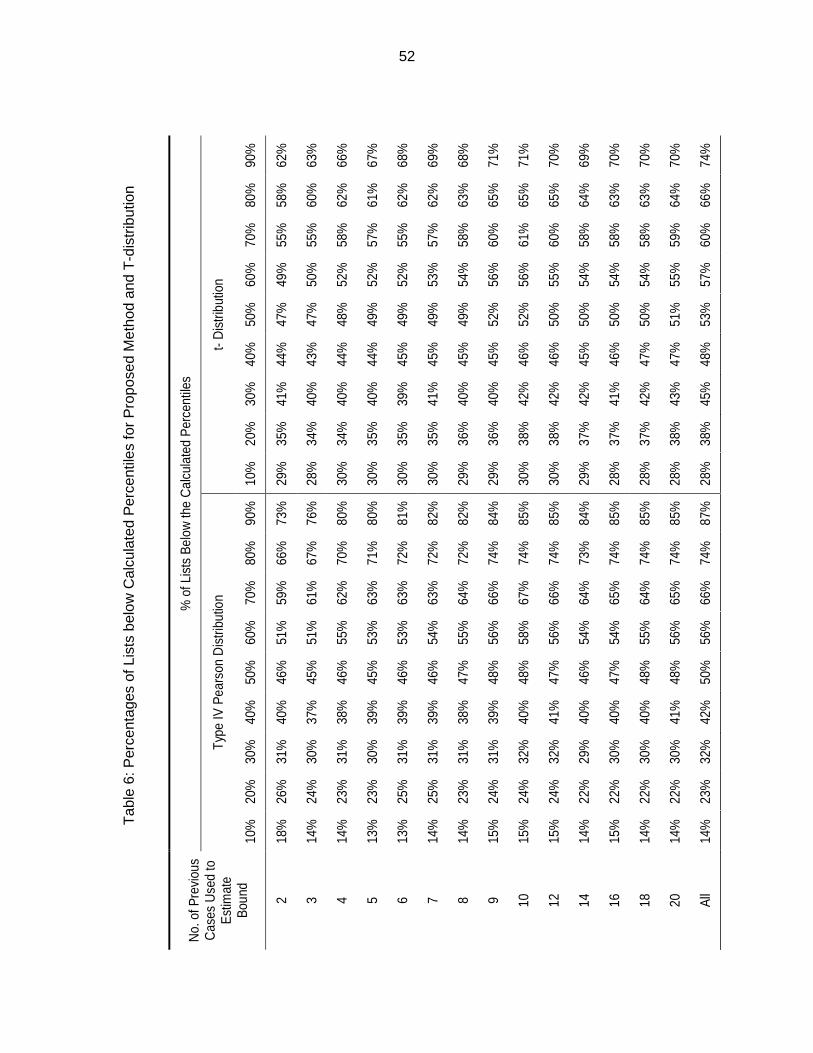
52
Tab
le 6
: Per
cent
ages
of L
ists
bel
ow C
alcu
late
d P
erce
ntile
s fo
r P
ropo
sed
Met
hod
and
T-d
istr
ibut
ion
No.
of P
revi
ous
Cas
es U
sed
to
Est
imat
e Bo
und
% o
f Lis
ts B
elow
the
Cal
cula
ted
Per
cent
iles
Type
IV P
ears
on D
istri
butio
n t-
Dis
tribu
tion
10%
20
%
30%
40
%
50%
60
%
70%
80
%
90%
10
%
20%
30
%
40%
50
%
60%
70
%
80%
90
%
2 18
%
26%
31
%
40%
46
%
51%
59
%
66%
73
%
29%
35
%
41%
44
%
47%
49
%
55%
58
%
62%
3 14
%
24%
30
%
37%
45
%
51%
61
%
67%
76
%
28%
34
%
40%
43
%
47%
50
%
55%
60
%
63%
4 14
%
23%
31
%
38%
46
%
55%
62
%
70%
80
%
30%
34
%
40%
44
%
48%
52
%
58%
62
%
66%
5 13
%
23%
30
%
39%
45
%
53%
63
%
71%
80
%
30%
35
%
40%
44
%
49%
52
%
57%
61
%
67%
6 13
%
25%
31
%
39%
46
%
53%
63
%
72%
81
%
30%
35
%
39%
45
%
49%
52
%
55%
62
%
68%
7 14
%
25%
31
%
39%
46
%
54%
63
%
72%
82
%
30%
35
%
41%
45
%
49%
53
%
57%
62
%
69%
8 14
%
23%
31
%
38%
47
%
55%
64
%
72%
82
%
29%
36
%
40%
45
%
49%
54
%
58%
63
%
68%
9 15
%
24%
31
%
39%
48
%
56%
66
%
74%
84
%
29%
36
%
40%
45
%
52%
56
%
60%
65
%
71%
10
15%
24
%
32%
40
%
48%
58
%
67%
74
%
85%
30
%
38%
42
%
46%
52
%
56%
61
%
65%
71
%
12
15%
24
%
32%
41
%
47%
56
%
66%
74
%
85%
30
%
38%
42
%
46%
50
%
55%
60
%
65%
70
%
14
14%
22
%
29%
40
%
46%
54
%
64%
73
%
84%
29
%
37%
42
%
45%
50
%
54%
58
%
64%
69
%
16
15%
22
%
30%
40
%
47%
54
%
65%
74
%
85%
28
%
37%
41
%
46%
50
%
54%
58
%
63%
70
%
18
14%
22
%
30%
40
%
48%
55
%
64%
74
%
85%
28
%
37%
42
%
47%
50
%
54%
58
%
63%
70
%
20
14%
22
%
30%
41
%
48%
56
%
65%
74
%
85%
28
%
38%
43
%
47%
51
%
55%
59
%
64%
70
%
All
14%
23
%
32%
42
%
50%
56
%
66%
74
%
87%
28
%
38%
45
%
48%
53
%
57%
60
%
66%
74
%

53
No.
of
Prev
ious
C
ases
U
sed
to
Estim
ate
Boun
d
% o
f Lis
ts B
elow
the
Cal
cula
ted
Perc
entil
es
Type
IV P
ears
on D
istri
butio
n Em
piric
al D
ata
from
Mon
te C
arlo
Sim
ulat
ion
10%
20
%
30%
40
%
50%
60
%
70%
80
%
90%
10
%
20%
30
%
40%
50
%
60%
70
%
80%
90
%
2 18
%
26%
31
%
40%
46
%
51%
59
%
66%
73
%
18%
26
%
31%
40
%
46%
52
%
59%
66
%
73%
3 14
%
24%
30
%
37%
45
%
51%
61
%
67%
76
%
14%
24
%
29%
37
%
45%
51
%
61%
67
%
76%
4 14
%
23%
31
%
38%
46
%
55%
62
%
70%
80
%
14%
23
%
31%
38
%
46%
55
%
62%
70
%
80%
5 13
%
23%
30
%
39%
45
%
53%
63
%
71%
80
%
12%
23
%
30%
39
%
45%
53
%
63%
71
%
80%
6 13
%
25%
31
%
39%
46
%
53%
63
%
72%
81
%
13%
24
%
31%
39
%
46%
53
%
63%
72
%
81%
7 14
%
25%
31
%
39%
46
%
54%
63
%
72%
82
%
14%
25
%
31%
39
%
46%
54
%
63%
72
%
82%
8 14
%
23%
31
%
38%
47
%
55%
64
%
72%
82
%
14%
23
%
31%
38
%
47%
55
%
64%
72
%
82%
9 15
%
24%
31
%
39%
48
%
56%
66
%
74%
84
%
15%
23
%
31%
39
%
48%
56
%
66%
74
%
84%
10
15%
24
%
32%
40
%
48%
58
%
67%
74
%
85%
15
%
24%
31
%
40%
48
%
58%
67
%
74%
84
%
12
15%
24
%
32%
41
%
47%
56
%
66%
74
%
85%
15
%
24%
32
%
40%
47
%
56%
66
%
74%
84
%
14
14%
22
%
29%
40
%
46%
54
%
64%
73
%
84%
14
%
22%
29
%
40%
46
%
55%
64
%
74%
84
%
16
15%
22
%
30%
40
%
47%
54
%
65%
74
%
85%
15
%
22%
30
%
40%
47
%
54%
65
%
74%
85
%
18
14%
22
%
30%
40
%
48%
55
%
64%
74
%
85%
14
%
22%
30
%
40%
48
%
55%
65
%
74%
85
%
20
14%
22
%
30%
41
%
48%
56
%
65%
74
%
85%
14
%
22%
30
%
41%
48
%
56%
65
%
74%
86
%
All
14%
23
%
32%
42
%
50%
56
%
66%
74
%
87%
14
%
23%
32
%
42%
50
%
56%
66
%
74%
87
%
Tab
le 7
: Per
cent
ages
of L
ists
bel
ow C
alcu
late
d P
erce
ntile
s fo
r P
ropo
sed
Met
hod
and
Mon
te C
arlo
Sim
ulat
ion

54
10%
20%
30%
40%
50%
60%
70%
80%
90%
20.
30 ±
0.0
30.
28 ±
0.0
20.
26 ±
0.0
20.
24 ±
0.0
20.
23 ±
0.0
20.
26 ±
0.0
30.
30 ±
0.0
20.
32 ±
0.0
20.
43 ±
0.0
3
30.
30 ±
0.0
10.
32 ±
0.0
20.
28 ±
0.0
20.
22 ±
0.0
10.
20 ±
0.0
10.
22 ±
0.0
10.
27 ±
0.0
10.
34 ±
0.0
20.
38 ±
0.0
2
40.
33 ±
0.0
20.
31 ±
0.0
10.
26 ±
0.0
10.
22 ±
0.0
10.
21 ±
0.0
10.
23 ±
0.0
10.
27 ±
0.0
10.
32 ±
0.0
10.
41 ±
0.0
2
50.
33 ±
0.0
20.
33 ±
0.0
20.
27 ±
0.0
10.
23 ±
0.0
10.
20 ±
0.0
10.
22 ±
0.0
10.
28 ±
0.0
10.
34 ±
0.0
20.
39 ±
0.0
2
60.
35 ±
0.0
20.
38 ±
0.0
20.
23 ±
0.0
20.
24 ±
0.0
20.
22 ±
0.0
20.
25 ±
0.0
20.
29 ±
0.0
20.
33 ±
0.0
20.
38 ±
0.0
2
70.
36 ±
0.0
20.
34 ±
0.0
20.
28 ±
0.0
10.
23 ±
0.0
10.
22 ±
0.0
10.
26 ±
0.0
10.
30 ±
0.0
10.
35 ±
0.0
20.
39 ±
0.0
2
80.
35 ±
0.0
20.
33 ±
0.0
20.
26 ±
0.0
20.
21 ±
0.0
10.
22 ±
0.0
10.
26 ±
0.0
10.
31 ±
0.0
10.
37 ±
0.0
20.
42 ±
0.0
2
90.
35 ±
0.0
10.
34 ±
0.0
10.
27 ±
0.0
10.
22 ±
0.0
10.
21 ±
0.0
10.
26 ±
0.0
10.
31 ±
0.0
10.
36 ±
0.0
10.
43 ±
0.0
2
100.
34 ±
0.0
10.
32 ±
0.0
10.
26 ±
0.0
10.
22 ±
0.0
10.
22 ±
0.0
10.
26 ±
0.0
10.
31 ±
0.0
10.
35 ±
0.0
20.
39 ±
0.0
2
120.
35 ±
0.0
10.
32 ±
0.0
10.
26 ±
0.0
10.
21 ±
0.0
10.
21 ±
0.0
10.
26 ±
0.0
10.
33 ±
0.0
10.
37 ±
0.0
10.
38 ±
0.0
2
140.
37 ±
0.0
10.
36 ±
0.0
20.
29 ±
0.0
10.
23 ±
0.0
10.
23 ±
0.0
10.
27 ±
0.0
10.
33 ±
0.0
10.
38 ±
0.0
20.
40 ±
0.0
2
160.
38 ±
0.0
20.
37 ±
0.0
10.
29 ±
0.0
10.
22 ±
0.0
10.
22 ±
0.0
10.
26 ±
0.0
10.
32 ±
0.0
10.
36 ±
0.0
20.
41 ±
0.0
2
180.
36 ±
0.0
20.
35 ±
0.0
10.
28 ±
0.0
10.
22 ±
0.0
10.
23 ±
0.0
10.
27 ±
0.0
10.
32 ±
0.0
10.
37 ±
0.0
10.
41 ±
0.0
2
200.
34 ±
0.0
20.
33 ±
0.0
10.
26 ±
0.0
10.
21 ±
0.0
10.
22 ±
0.0
10.
28 ±
0.0
10.
33 ±
0.0
10.
37 ±
0.0
10.
37 ±
0.0
2
All
0.40
± 0
.02
0.39
± 0
.02
0.31
± 0
.01
0.23
± 0
.01
0.22
± 0
.01
0.30
± 0
.01
0.37
± 0
.02
0.42
± 0
.02
0.41
± 0
.02
Abs
olut
e D
iffer
ence
s B
etw
een
the
Per
cent
iles
of T
ype
IV P
ears
on D
istr
ibut
ion
and
Mon
te C
arlo
Sim
ulat
ion
No.
of
Pre
viou
s C
ases
Use
d to
Est
imat
e B
ound
Tab
le 8
: Abs
olut
e D
iffer
ence
s be
twee
n P
erce
ntile
s Id
entif
ied
by P
ears
on D
istr
ibut
ion
and
Mon
te C
arlo
Sim
ulat
ion

55
Figure 14: Histogram of Percentiles of Scheduled Duration of Surgery Lists of Type IV Pearson Distribution
Percentiles
Fre
quen
cy
0.0 0.2 0.4 0.6 0.8 1.0
020
4060
80

56
Figure 15: Histogram of Percentiles of Sum of Mean Case Duration of Historical Cases of Type IV Pearson Distribution
3.4 Discussion
Surgery case durations exhibit with high variability (Macario 2009). When multiple cases
make up a surgery list where the variability cumulates, the prediction of close time of ORs is
more difficult. In order to ensure a good utilization of OR hours and low over-utilized OR time,
the planning of surgery lists needs to consider risks at both low and high ends of the distribution
of the duration of surgery lists with multiple cases. The accurate identification of the distribution
of duration of surgery lists assists the OR schedulers and managers in planning the surgery lists
Percentiles
Fre
quen
cy
0.50 0.52 0.54 0.56 0.58 0.60
020
4060
8010
012
0

57
by examining if the current surgery lists have low probability falling outside of the pre-defined
limits for under- and over-utilized OR time. The proposed method of using Type IV Pearson
distribution to approximate the distribution of total duration of surgery lists is significantly better
than assuming a t-distribution of the duration in current studies (van Houdenhoven et al. 2007,
Pandit and Tavare 2011), especially towards the tails of the distribution, which are of primary
concern for management.
The same case scheduling algorithm proposed by Pandit and Tavare still applies (Pandit
and Tavare 2011). However, instead of calculating the probabilities of surgery lists exceeding
the defined lower and upper limits by using one-sided t-distributions, probabilities calculated
from Type VI Pearson distributions should be used to get more accurate estimates. From Table
7 we also saw that with more than 10 previous cases of same combination of surgeon and
procedure(s), the improvements in the identification of percentiles were flattened. Thus, OR
management can limit data collection to most recent 10 previous case durations to calculate the
probabilities for under- and over-runs. This number matched previous work as well (Zhou and
Dexter 1998).
In the studied facility, the scheduled case durations were purely based on surgeons’
estimates. Although surgeons’ estimates were strong predictor for case durations (Ejkemans et
al. 2010, Dexter and Ledolter 2005), the estimates were subject to consistent biases (Dexter et
al. 2005). From the results, we saw that significant under- and over-estimations were associated
with surgeons’ estimates. It was demonstrated that mean case duration of historical cases
provided better estimates as they scattered more close to the center of the distribution and less
subject to the bias of surgeons’ estimates. The absolute difference between the scheduled
duration of surgery lists and the actual duration could have been reduced by 20 minutes if sum
of mean case duration of historical cases were used compared to using surgeons’ estimates
alone; however, there was still an absolute difference of approximately one hour.

58
There were two major limitations in the proposed method. First, we assumed that each
case duration and turnover time in the surgery lists follows a log-normal distribution. Although
majority of the case durations for combinations of surgeon and procedure(s) were proved to be
log-normally distributed, approximately 30% of the cases in the surgery lists were not, which
caused mismatches of percentile values at tails of distributions. Then, to use the approach, we
had to have at least two previous cases with the same combination of surgeon and procedure(s)
to estimate parameters for Type IV Pearson distribution. As have been pointed out, there are
many cases with no for very little historical case duration information (Zhou and Dexter 1998,
Dexter and Macario 2000, Dexter et al. 2002). These infrequent cases are what cause huge
uncertainty in OR decision making. Dexter et al. studied such problem (Macario and Dexter
1999, Dexter and Ledolter 2005) and show that it is appropriate to use the mean case durations
of the same procedure(s) by other surgeons to schedule cases (Macario and Dexter 1999).
Bayesian model was employed to calculate the prediction bounds for individual case duration
(Dexter and Ledolter 2005).Error! Bookmark not defined. However, for surgery lists with multiple cases,
there are no such models to overcome this challenge. Our proposed method could not apply to
surgery lists with cases of less than two historical cases since the estimation of parameters of
Type IV Pearson distribution would be infeasible.
3.5 Conclusion
In this study, we brought up and validated a new method to approximate the distribution
of the duration of surgery lists. It provides OR management with important information on what
they would expect from the planned surgery lists. For a facility whose operations goals does not
only include the efficiency of use of OR time but also utilization like the studied facility, after
higher and lower limits on scheduled list time have been set, OR managers can rearrange the
surgery lists as needed to ensure that the probabilities of the duration of the surgery lists to fall
beyond the limits to be low. Despite of some limitations, our approach performs much better

59
than the current proposed methods that assume t-distributions (Pandit and Tavare 2011),
especially at tails of distributions, which are of major concerns for OR management. We did not
consider tardiness at the beginning of workday. The tardiness of first cases can be easily
incorporated in analysis by considering it as an increase in turnover times (McIntosh et al.
2006). Due to incomplete information of the raw data set, we did not include the type of
anesthesia, which has been defined as one of the major sources of case duration variability
(Strum et al. 2000). For analysts who have access to detailed information on anesthesia and
patient’s conditions, they can further divide the data into finer segments. Although this would
potentially generate more accurate probabilities, it requires larger sample sizes which would
limit its application (Zhou and Dexter 1998, Dexter and Macario 2000, Dexter et al. 2002).

60
CHAPTER 4 PROACTIVE MANAGEMENT OF OPERATING ROOM RESOURCES THROUGH OPERATIONAL SIMULATION
4.1 Introduction and Literature Review
Operating rooms (OR) are one of the most critical units in hospitals. Their importance
lies in the fact that surgical procedures not only generate a significant portion of the revenues
but also incur significant costs. Recent statistics indicate that ORs account for more than 40% of
the hospitals’ revenue (HFMA 2005). Macario et al. (1999) estimate that 33% of the hospital
inpatient care cost is due to the surgical services. Along with the increase in healthcare
expenses and aging population, this percentage has been on the rise over the past decade.
Therefore, effective management of the operating room efficiency and costs is critical to
lowering the cost of healthcare systems.
The efficient utilization of OR resources depends on multiple factors such as long-term
planning (e.g. block time allocations), medium-term planning (e.g., surgery scheduling),
uncontrollable operational uncertainty (e.g. surgery durations), and controllable operational
uncertainty (e.g., delays in pre- and peri-operative as well as turnover processes). There are
many other factors such as case cancellations before/ on the day of surgery, case mix and
volume uncertainty, etc. In this study, we consider a single surgical day and the operational
factors effecting the utilization of OR resources. The primary cost factors of OR are direct OR
staff resources (surgical technician, anesthesiologist, surgeon, circulating nurse, etc.),
equipment and facilities, and consumable inventory (implants, sutures, gauzes, etc.). Inefficient
utilization of the OR staff, equipment and facility resources leads to lower productivity (i.e.,
surgery throughput), increased over-utilized OR time and case cancellations, reduced quality of
care and lower staff morale. These metrics are not independent. For instance, given the same
number of completed surgical cases, an inefficient OR management would lead to more over-
utilized OR time and hence lower staff morale. Similarly, under same amount of over-utilized OR

61
time, inefficiencies would lead to increased case cancellations and reduced throughput. Lastly,
the over-utilized OR time and case cancellations are correlated since some of the case
cancellations are attributable to the excessive tardiness buildup causing later cases to be
cancelled. In this study, we consider two metrics, over-utilized OR time and case cancellations.
The objective is to minimize the over-utilized OR time in order to maximize the efficiency of use
of OR time and reduce the case cancellations (Dexter et al. 2004). For over-utilized OR time, we
consider both the expected over-utilized OR time duration and the frequency of over-utilized OR
time.
There are a multitude of operational delay reasons effecting the efficient utilization of OR
resources. For example, if the surgeon is not available, the patient cannot be brought into the
OR and the room will be idle until the surgeon arrives. Similarly, if the patient arrives late, then
the surgery cannot start until the pre-op processes are complete and patient is ready. Since the
majority of OR processes are executed in series, the lost time in the OR hours propagate
throughout the day and cause the tardiness of start for the subsequent cases.10 This tardiness
propagation is analogous to those in the manufacturing environments such as in the assembly
line systems. An analogous assembly line system for a multi-OR system is where there are
parallel machines (representing each OR) which receive inflow of units from a single machine
(pre-op) and send to a single machine (post-op). The flow units in this system are the surgical
cases which are routed to different ORs (machines) according to the given schedule. The
processing time of each surgical case in each OR is uncertain and includes all the surgery
process durations as well as tardiness. The queuing discipline is priority-based where the
priorities are determined according to the scheduled order of surgical cases.
In manufacturing settings, the throughput and machine utilizations are commonly
increased by identifying and eliminating bottlenecks through preventive (opportunistic)
maintenance. Preventive maintenance, different from the corrective maintenance, is carried out 10
There are some OR processes that are sometimes performed in parallel, such as anesthesia induction and setup.

62
at the opportunity windows where the production is unaffected by the preventive maintenance
action (Iravani and Duenyas, 2002; Zequeira et al., 2008; Chang et al., 2007a; Kenne et al.,
2007). Given scarce maintenance resources, the prioritization of the maintenance tasks is
essential (Dekker and Smeitink 1994; Dekker 1995; Khanlari et al. 2008). A popular strategy is
the bottleneck-based maintenance prioritization (e.g., Langer et al., 2010; Li et al., 2009; Chang
et al., 2007b). This strategy prioritizes maintenance tasks in accordance with the historical
bottlenecks ordering using the most recent data. While, this approach is suitable for most
manufacturing systems with stable dynamics (e.g., product mix), it is not applicable in systems
where the interaction between the machines varies with the production mix. In such cases, the
historical data on bottleneck machines is not reliable and requires forward looking bottleneck
prediction (anticipatory) through simulation. The simulation approach is frequently used in the
manufacturing settings, with the goal of determining the ideal design of the manufacturing
system considering the average performance across multiple scenarios (e.g., product mix and
sequence). The use of simulation for operational performance prediction, identification of
dynamic bottlenecks and maintenance prioritization is not considered.
The prior work using simulation approaches in ORs focused on evaluating different OR
policies, staffing and case scheduling algorithms on patient flow, making OR suite usage and
capacity decisions. Sobolev and Kuramoto (2005) used simulation approach to evaluate the
length of surgical patients’ waiting list for various intervention policies in order to improve patient
flow. They considered intervening 14 peri-operative activities ranging from outpatient clinic
appointment, anesthesiology consultation to post-op care activities. Cipriano et al. (2007)
developed a simulation model to predict the wait time of patients for total joint replacement
surgery and made recommendations for supply and surgical allocation to meet the target
demand levels as well as to manage wait time performance. Vasilakis et al. (2007) compared
patients from pooled list versus surgeon linked patients and used simulation to evaluate the
impact on the time between the appointment and the day of surgery. Denton and Nelson (2006)

63
used Monte-Carlo simulation approach to evaluate the impact of different surgical suite staffing
scenarios on multiple competing criteria (i.e. patient wait time and over-utilized OR time of OR
suite). Murat and Nepal (2010) used simulation to study the effect of case sequence on the
overtime performance. They considered different surgery start time policies and resource
coupling levels. Dexter et al. (1999) used simulation and scheduling algorithms to explore the
relation between the patients’ wait time and the utilization of OR block time. Ballard and Kuhl
(2006) employed the simulation methodology to determine the maximum capacity of OR suite
by continuously adding patients into the system. They compared resource usage such as OR
staff and room utilization as well as patient’s satisfaction. In summary, the prior simulation-
based research in ORs is focused on long-term decision making rather than what can be done
in the short-term, i.e., days before the surgery or on the day of the surgery.
In this study, we develop a simulation based approach, called proactive operational
management of OR resources (POM-ORS), for OR managers to anticipate, prioritize and
eliminate operational delays to optimize OR performance. This approach is similar to the
debottlenecking in manufacturing systems. The main difference is the use of simulation for
operational performance prediction and prioritization of delays for elimination. The POM-ORS
predicts the impact of tardiness in over-utilized OR time and case cancellations, and then
prioritizes the tardiness for debottlenecking. This approach helps OR managers’ in anticipating
and preventing tardiness and improving over-utilized OR time and case cancellations. The
remainder of the chapter is organized as follows. In subsection 2, we present the simulation
model scope and describe the proposed POM-ORS approach in details. subsection 3 presents
the results of a case study application and discusses the limitations and extensions of POM-
ORS. Subsection 4 provides conclusions and future research directions.

64
4.2 Method
4.2.1 OR Simulation Model Scope
The surgical cases are first generated in clinics where surgeons, upon examining the
patients and medical records, decide the need for surgery. Following the patients’ agreement,
the surgical case requests are put into the surgery information system. Next, the patients
undergo several tests before the day of surgery to ensure that the patients’ health status are
suitable for the surgery. On the day of surgery, patients are admitted to the pre-op area. Pre-op
nurses measure the vitals and carry out final lab tests to ensure the surgeries can be performed
on patients without medical concerns. Concurrently, the OR nurses and surgical technicians set
up and prepare the ORs for the surgery. Once all the preparations are completed, the patients
are wheeled into the ORs. Next, the anesthesia is induced by anesthesia team and surgery is
performed by the surgical team. Following the anesthesia resuscitation, the patients are
wheeled out to the PACU / ICU for recovery and then either admitted to regular in-patient
wards/ICU or discharged to home.
The scope of the simulation model includes all the processes extending from patients’
arrival at the pre-op area to wheeling out to the PACU/SICU, i.e. the processes included in the
frame in Figure 16. The purpose of our simulation model is to support operational decision-
making. Therefore, we limit the simulation to a single day of surgery and assume that the
schedule is determined a prior. We do not consider the downstream steps such as bed
management, ICU performance or long-term patient health condition tracking. We measure the
performance based on over-utilized OR time and case cancellation rate.

65
Fig
ure
16: P
eri-o
pera
tive
Wor
kflo
w

66
4.2.2 Description of Simulation Model
We used a single day OR schedule as the input to the simulation model, including
scheduled start and end time of each case, OR assignment of cases, PACU type, scheduled
procedure defined by principle CPT code. The model read the information for each case before
running. For each case, the whole process flow started from the arrival of patients. The
sequential processes were executed according to the durations generated from their fitted
distributions following the steps in Figure 16. The distributions of the arrival pattern of patients to
the pre-op area (how early the patient arrives in the pre-op area before the scheduled case start
time), the actual case duration, the cleanup and setup time, the length of stay in PACU, and the
transfer times such as the time to bring a patient from pre-op are to OR or from OR to PACU
were analyzed using historical data. As mentioned in the previous section, tardiness is observed
in each process on the day of surgery. If the scheduled duration of the case is 2 hours, but due
to some complexity during the operation, the case actually takes 4 hours to complete. As the
tackling of tardiness in surgery processes involves medical knowledge, and a reduction of such
tardiness might result in undesirable outcomes such as patient safety issues, it is not our
intention to create medical issues. The tardiness we focused on was only related to non-
operative processes (i.e. pre-op processes and turnover times). To model the tardiness, we built
a sub-model for pre-op and turnover time processes where tardiness was assigned according to
the probability of occurrence and realized duration distributions from historical data. In a
simulation run, when a patient entered into the OR after the scheduled case start time, the
tardiness was calculated and attributed to the associated delay reasons. After each simulation
run, the statistics were output for analysis.
4.2.3 Proactive Management of Operating Room Resour ces (POM-ORS)
The POM-ORS is a concept similar to the debottlenecking in manufacturing systems
where bottleneck machines are improved through preventive maintenance actions. We adopted

67
this concept to the management of OR with some differences. The process flow map of the
POM-ORS framework is presented in Figure 17. This approach begins with simulation model
building, where a representation of the workflow on the day of surgery is constructed through
process mapping and converted into modules. Data collection is conducted and corresponding
distributions are fitted. Then, a single day’s schedule is input into the model and baseline
performance is established by running the model. If the baseline performance meets the target,
then there is no need for the OR management to focus on particular tardiness; otherwise, based
on the delay risks which we are going to describe in next subsection, the OR management
eliminates the most important tardiness and reruns the model. The new performance data is
then collected for the new model without the most important tardiness, and the results are
compared with targets again to see if the performance is satisfactory. The process repeats until
an acceptable performance level is achieved by continuously removing the most important
tardiness from the process. The first difference between this approach and previous simulation
studies is the operational nature of the simulation model where a given day’s surgical schedule
is simulated. Second, we consider the tardiness as the source of bottlenecks and identify which
delay reasons are more important than the rest through delay risk prioritization. Thirdly, we use
a novel debottlenecking approach that considers multiple delay reasons at a time. In the next
two subsections, we describe the delay risk estimation and prioritization, and debottlenecking
procedures in detail.

68
Figure 17: POM-ORS Process Flow Chart
4.2.4 Delay Risk Estimation and Prioritization
We define a case tardiness as the difference between the time the patient entered the
OR and the scheduled case start time. For instance, given a scheduled case start time at 10 AM
and the patient enters the OR at 10:20 AM, then there will be a 20-minute tardiness. When a
patient is wheeled into the room on or before the scheduled case start time, then there is no
tardiness. These delay reasons vary in terms of their probability of occurrence as well as their
effective duration. We define the delay risk as follows,
`�(3a bcdI � /�efcg� @3hic)�dd S jhk535c(cfa k leeLh�)e�.

69
Some of these delay reasons occur simultaneously. For instance, when the patient’s
consent form is missing and the anesthesia setup does not start on time, then they overlap. As
a result, the effective impact of the delay duration of each delay reason could be different than
the realized delay duration. Furthermore, some tardiness can have no effect on the realized
schedule as a result of propagated delays of the previous cases. At the end of each simulation
replication, we consider the occurrence of each delay reason separately and account for only
those portions of the tardiness that is affecting start of the next case. This is illustrated below in
Figure 18, where the previous case (i) is delayed and the turnover is completed for case (i+1)
later than the scheduled end time. The two delay reasons for case (i+1) are realized as shown.
We consider the effective tardiness of delays 1 and 2 as the portions d1 and d2 of their
respective realized durations. Note that these are truncated durations of the realized tardiness.
The effective tardiness of the previous case overrun is then the difference between scheduled
and actualized completion times. If the effective tardiness for a delay reason is positive, then we
record it as an occurrence for calculating probabilities.
Figure 18: Illustration of Effective Tardiness
The delay probability of occurrence and distributions for each delay reason were
available from the historical data (e.g., input in the simulation model). However, the simulation
Scheduled
Completion
d1
Delay Reason 2 for Case i+1
Realized Setup Completion of Case i+1
d2
Actualized
Completion
Delay Reason 1 for Case i+1
70
results for the tardiness and probability of occurrence were different than the input distributions.
This is because of the difference between realized and effective tardiness. Furthermore, the
majority of the effective tardiness for later cases were “previous case overruns” which was
attributable to the propagation of tardiness. Lastly, since there was no historical distribution for
the previous case overruns, they were estimated directly from the results of the simulation run.
A sample of the delay risk calculation based on effective tardiness and occurrence frequency is
illustrated in Table 10. This sample case is delayed for 35 reasons plus the “previous case
overrun” reason. We note that the majority of the tardiness occurrences (about 73%) are due to
previous case overrun.
4.2.5 Debottlenecking Delay Reasons
Once the delay risks are estimated, we first select the bottlenecks (i.e. delay reasons
with highest delay risks) and then debottlenecked them using proactive management strategies
(Figure 17). The first simulation run of a given day’s schedule evaluates the baseline scenario
where none of the delay reasons has been debottlenecked. The number of tardiness to be
managed can be determined by available resources for proactive management as well as
whether the tardiness are controllable or not, e.g. ensuring surgeons are present whenever the
rooms are ready or setups start without tardiness following cleanup. Other tardiness such as
previous case overruns or patient being late are not controllable thus are not considered for
debottlenecking.
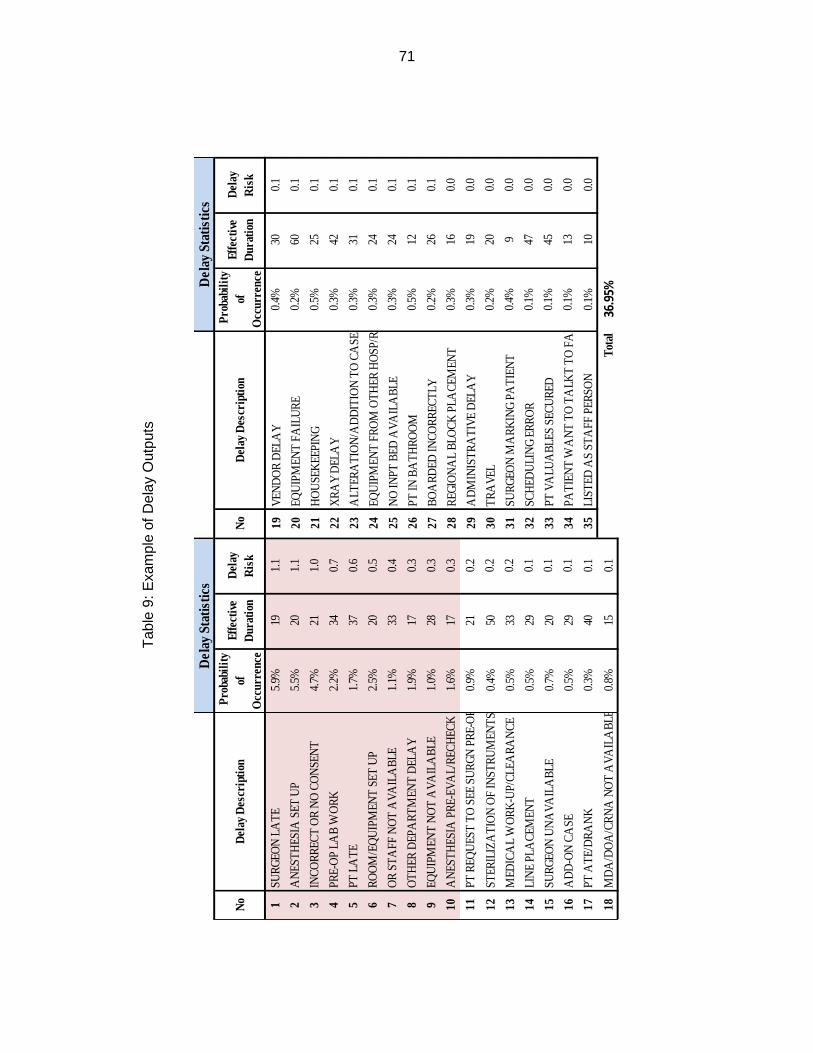
71
No
Del
ay D
escr
iptio
n P
roba
bilit
y of
O
ccur
renc
e
Effe
ctiv
e D
urat
ion
Del
ay
Ris
kN
oD
elay
Des
crip
tion
Pro
babi
lity
of
Occ
urre
nce
Effe
ctiv
e D
urat
ion
Del
ay
Ris
k
1SU
RGEO
N L
ATE
5.
9%19
1.1
19VE
ND
OR
DEL
AY
0.
4%30
0.1
2A
NES
THES
IA S
ET U
P5.
5%20
1.1
20EQ
UIP
MEN
T FA
ILU
RE
0.2%
600.
1
3IN
CORR
ECT
OR
NO
CO
NSE
NT
4.7%
211.
021
HO
USE
KEE
PIN
G0.
5%25
0.1
4PR
E-O
P LA
B W
ORK
2.2%
340.
722
XRA
Y D
ELA
Y0.
3%42
0.1
5PT
LA
TE
1.7%
370.
623
ALT
ERA
TIO
N/A
DD
ITIO
N T
O C
ASE
0.3%
310.
1
6RO
OM
/EQ
UIP
MEN
T SE
T U
P
2.
5%20
0.5
24EQ
UIP
MEN
T FR
OM
OTH
ER H
OSP
/REP
0.3%
240.
1
7O
R ST
AFF
NO
T A
VAIL
ABL
E
1.1%
330.
425
NO
INPT
BED
AVA
ILA
BLE
0.3%
240.
1
8O
THER
DEP
ART
MEN
T D
ELA
Y1.
9%17
0.3
26PT
IN B
ATH
ROO
M0.
5%12
0.1
9EQ
UIP
MEN
T N
OT
AVA
ILA
BLE
1.0%
280.
327
BOA
RDED
INCO
RREC
TLY
0.2%
260.
1
10A
NES
THES
IA P
RE-E
VAL/
RECH
ECK
1.6%
170.
328
REGI
ON
AL
BLO
CK P
LACE
MEN
T
0.3%
160.
0
11PT
REQ
UES
T TO
SEE
SU
RGN
PRE
-OP
0.9%
210.
229
AD
MIN
ISTR
ATI
VE D
ELA
Y
0.
3%19
0.0
12ST
ERIL
IZA
TIO
N O
F IN
STRU
MEN
TS0.
4%50
0.2
30TR
AVE
L
0.2%
200.
0
13M
EDIC
AL
WO
RK-U
P/CL
EARA
NCE
0.
5%33
0.2
31SU
RGEO
N M
ARK
ING
PATI
ENT
0.
4%9
0.0
14LI
NE
PLA
CEM
ENT
0.5%
290.
132
SCH
EDU
LIN
G ER
ROR
0.1%
470.
0
15SU
RGEO
N U
NA
VAIL
ABL
E0.
7%20
0.1
33PT
VA
LUA
BLES
SEC
URE
D
0.
1%45
0.0
16A
DD
-ON
CA
SE
0.5%
290.
134
PATI
ENT
WA
NT
TO T
ALK
T TO
FA
MIL
Y0.1
%13
0.0
17PT
ATE
/DRA
NK
0.3%
400.
135
LIST
ED A
S ST
AFF
PER
SON
0.1%
100.
0
18M
DA
/DO
A/C
RNA
NO
T A
VAIL
ABL
E
0.
8%15
0.1
Tota
l36
.95%
Del
ay S
tatis
tics
Del
ay S
tatis
tics
Tab
le 9
: Exa
mpl
e of
Del
ay O
utpu
ts

72
Given that there are numerous delay reasons for each surgical case, the number of
ways that bottleneck tardiness can be selected is innumerable for practical applications. For
instance, let’s consider that there are 10 cases on the day’s schedule, each with 10 delay
reasons. Further, let’s assume that there are enough resources to debottleneck 30 out of 100
tardiness. Hence, there are about Y10030 [ � 3x10�m different subsets of 30 tardiness that can be
selected. Clearly, evaluation of performance by simulating all these possibilities is impractical. In
the proposed POM-ORS, we use the risk prioritization results to select the tardiness in an
iterative fashion. Note that iterative approach is necessary since the estimated delay risks are
based on baseline scenario and risk prioritization changes with the elimination of tardiness.
Considering the above example and assuming that we select the top delay reason to eliminate
in each iteration. The total number of simulations necessary is only 30 for a single OR, which is
practical for operational intervention. Once the top delay risk is identified, we remove it from the
simulation model and a new round of simulation is performed. This process of eliminating top
delay reason is continuously repeated until a desired performance has been achieved.
4.3 Case Study Application
In this case study, we applied the POM-ORS approach using an actual day’s schedule
and data obtained from the Detroit VAMC (Table 11). In this schedule, there were three
specialties, namely, General, Ophthalmology, and Orthopedics. The distributions of surgery
durations were obtained using the historical data and based on two significant factors (CPT and
surgeon) from January, 2008 to January, 2011. This is in accordance with the earlier research
that CPT and surgeon are the two most important factors that impact the surgery duration
(Strum et al. 2000). The cases were PRP I/HERN INIT REDUC>5YR (CPT 49505) for general
surgeon A, Cataract (CPT 66984) for ophthalmology surgeon B, and Total Knee (CPT 27447)
for orthopedic surgeon. The general surgery cases followed a Weibull (50.8, 1.76) distribution.
The cataract surgery cases followed an Erlang (16.7, 2) distribution. The orthopedic surgery

73
cases followed a Normal (126, 27.3) distribution. The order of the scheduled end time of the last
case in each OR was first OR 1, next OR3, and last OR2. The three different procedure types
exhibited different levels of case duration variability. Cases in OR2 had the largest case duration
variability; thus, we expected the actual OR close time of this OR to have large differences in
each simulation run, whereas the case duration in OR3 has the least case duration variability.
Its close time would be more predictable than that of OR2. The three ORs represented different
scheduling policies. For OR1, the scheduled end time of the last case was much ahead of the
OR close time. For OR2, the last case was scheduled to be end 15 minutes beyond the OR
close time. As for OR3, the expected close time was almost the same as the OR close time. By
comparing the results of POM-ORS in ORs with different scheduling policies, we expected to
obtain insights into the effectiveness of POM-ORS in different OR conditions.
The operating hours of the surgical suite in the studied facility were from 8 AM to 4 PM.
The cases were scheduled in a way such that the OR closing times were not past 4 PM except
on special cases depending on the patient’s condition or other considerations. The scheduled
duration of each case was based on the sum of mean case duration of historical cases and the
mean turnover time for each specialty except for the last cases where there was only cleanup
(Dexter et al. 1999, Alvarez et al. 2010).

74
Table 10: OR Case Schedule
For each case, there were 35 delay reasons in addition to the previous case overrun
(Table 10). In POM-ORS analysis, we only considered the tardiness that had at least 1% of
probability of occurrence (i.e. top 10 tardiness highlighted in Table 10). These tardiness
accounted for 73% of the total probability of tardiness occurrence and also were the top ten in
terms of delay risk. This selection was not restrictive and the POM-ORS could be applied with
any number of delay reasons. For each model, we ran 1000 replications. Arena 13 student
version (Rockwell Automation, Wexford, PA) was used for model building.
4.3.1 POM-ORS Results
We evaluated the effects of POM-ORS on the mean over-utilized OR time, percentage
of days with over-utilized OR time, and percentage of days with cancellations. For cancellations,
we used the policy of cancelling the upcoming cases if the OR closing time was predicted to
past the OR closing time by more than 2 hours.
OR No Scheduled
Start Time
Scheduled Completion
Time Specialty CPT Code
1 8:00 10:30 GENERAL 49505
1 10:30 13:00 GENERAL 49505
1 13:00 14:45 GENERAL 49505
2 8:00 9:15 OPHTHALMOLOGY 66984
2 9:15 10:30 OPHTHALMOLOGY 66984
2 10:30 11:45 OPHTHALMOLOGY 66984
2 11:45 13:00 OPHTHALMOLOGY 66984
2 13:00 14:15 OPHTHALMOLOGY 66984
2 14:15 15:30 OPHTHALMOLOGY 66984
2 15:30 16:15 OPHTHALMOLOGY 66984
3 8:00 10:45 ORTHOPEDICS 27447
3 10:45 13:30 ORTHOPEDICS 27447
3 13:30 15:30 ORTHOPEDICS 27447

75
We first implemented the POM-ORS approach shown in Figure 17 by iteratively
eliminating the top delay reasons for each room. We compared the performances vis-à-vis the
baseline scenario where no tardiness were eliminated. The results are presented in Table 12a
using the historical case durations (e.g. upper part of the Table 12 denoted by Current). The
percentage of days with over-utilized OR time (OT) and the mean over-utilized OR time were
decreased on the average by 25% and 14%, respectively. These improvements show that the
OR managers can improve the over-utilized OR time performance by proactively managing the
anticipated tardiness. We noted that the least improvement in percentage of days with over-
utilized OR time is in OR2, which was scheduled to complete latest. This is because OR2 had
significant over-utilized OR time (mean over-utilized OR time = 58.4 minutes in baseline model).
As a matter of fact, this room was scheduled to overrun by 15 minutes of the OR closing time.
The debottlenecking of tardiness was not sufficient to reduce the probability (see baseline in
Table 12b). By the same analogy, the greatest improvement was observed in OR1. In
comparison, the mean over-utilized OR time was mostly improved for OR3 since it had less
surgery duration variability than OR2. Furthermore, the percentage of days with cancellations
had decreased by 38% on the average. Based on these results, we concluded that the
improvement effects of POM-ORS’s on over-utilized OR time and cancellation depend on the
scheduling policies as well as the surgery duration variability. In particular, when there is
significant over-utilized OR time (e.g. due to poor scheduling), then the impact of POM-ORS in
reducing the over-utilized OR time and cancellation is less discernible (The results of
simulations are documented in Appendix E and Appendix G).
We also investigated the effects of surgery duration variability on the POM-ORS
improvements. In Table 12a, we reduced the case duration variance of all surgeries by half (e.g.
lower part of the table denoted by 50% Variance) and reran the model. The results show that
reducing surgery duration variance improves performance in both over-utilized OR time and the
case cancellation. We note that after the reduction of case duration variance there are no

76
cancellations in OR3 in baseline performance. At the same time, the cancellation in OR2 was
reduced by 80%. The percentages of days with over-utilized OR time were further improved for
both OR2 and OR3. Hence, these results indicate that the benefits of implementing POM-ORS
methodology increase with reduced process variability.
In summary, the POM-ORS is most beneficial when the case schedules are developed
based on accurate case duration estimates (e.g., reduced variance) and without significant
over-utilized OR time.
Table 11: (a) Effects of POOM-ORS on Over-utilized OR time and Case Cancellation; (b) Effect of Debottlenecking Multiple Delay Reasons at a Time on Percentage of Days with Over-utilized
OR time
Cur
rent
OR OT% Mean OT
Cancel %
1 34% 9% N/A
2 10% 14% 35%
3 30% 20% 40%
50%
Var
ianc
e
OR OT% Mean OT
Cancel %
1 N/A N/A N/A
2 16% 28% 80%
3 67% 32% N/A
(a)

77
Occurrence of Over-utilized OR Time
3 Tardiness at a Time 1 Tardiness at a Time
OR 1 OR 2 OR 3 OR 1 OR 2 OR 3
Baseline 12.8% 92.6% 44.4% 12.8% 92.6% 44.4%
Top 3 12.2% 92.6% 42.5% 12.1% 92.6% 42.5%
Top 6 11.5% 92.4% 41.1% 11.5% 92.4% 40.6%
Top 9 11.2% 92.3% 39.4% 11.1% 92.2% 39.3%
Top 12 10.4% 92.0% 37.3% 10.4% 92.0% 37.3%
Top 15 9.9% 91.6% 36.6% 9.9% 91.6% 35.8%
Top 18 9.5% 91.5% 35.3% 9.4% 91.5% 34.8%
Top 21 9.2% 91.0% 34.8% 9.1% 90.8% 34.7%
Top 24 8.9% 90.0% 33.9% 8.7% 90.0% 33.9%
Top 27 8.7% 87.6% 33.3% 8.7% 87.5% 33.3%
Ideal 8.4% 82.9% 31.0% 8.4% 82.9% 31.0%
(b)
The results in Table 12a were based on debottlenecking all the delay reasons through
POM-ORS. In Table 12b, we present the progression of the percentage of days with over-
utilized OR time as we iteratively eliminated delay reasons one at a time for each OR. The
POM-ORS improvement increased nonlinearly with the number of eliminated tardiness. The top
delay risks for later cases are previous case overrun that mask the other delay risks. Thus, in
the first few simulation runs, the top delay risks are associated with delays of early cases.
However, the tardiness from the early cases do not impact the OR close time as tardiness of
later case because of the high case duration variability. As the tardiness of early cases are
removed, the probability of previous case overrun decreases, causing the delay risks for later
cases to increase and to be prioritized. This is one of the weakness of our approach and we
discuss it in the following section. The POM-ORS is a myopic approach where we debottleneck
one tardiness at a time. This is important for restricting the number of simulation runs for

78
practical applications. Some large surgical facilities perform close to 100 cases a day and, with
20-30 delay reasons for each case, the total number of simulations could be daunting. One
remedy is to debottleneck multiple tardiness at a time. Table 12b results compared the
strategies of debottlenecking one versus three tardiness at a time. The difference between the
two strategies in the percentage of days with over-utilized OR time is within 1 percent for the
same number of eliminated delay reasons, meaning aggregate tardiness debottlenecking can
be used as part of POM-ORS.
We caution that the level of aggregation should be kept as minimal as possible since the
risk prioritization of tardiness changes with the debottlenecking. For instance, whereas the
anesthesia delay of the last case in OR3 was ranked 9th in the baseline risk prioritization, the
sequential debottleneck process identified it as the 5th delay to be debottlenecked (Appendix F).
This is because the tardiness preceding the anesthesia delay were masking the effect of
anesthesia delay through the previous case overruns. Once these tardiness were eliminated,
the risk priority of the anesthesia delay increased. Similar re-orderings of delays were observed
in all rooms.
4.3.2 Discussion
Results from the case study clearly show that the POM-ORS approach improves the
percentage of days with over-utilized OR time and its mean duration, and reduces case
cancellations. The extent of improvements depends on the case schedule as well as the case
duration variability. Reducing case duration variance increases the effectiveness of POM-ORS
as the effects of delay reasons are no longer dampened as much by the previous case
overruns. This is similar to the role of inventory in manufacturing settings where the problems
associated with manufacturing processes (e.g., machine breakdowns, quality defects) are
masked by the high levels of safety inventory. The highest impact of lean practices is obtained
after removing the excess inventory and revealing the underlying process problems. In our

79
analysis, case duration distributions are based on CPT code and surgeon factors. Some other
research indicates that anesthesia type, OR team composition, and patients’ characters also
influence the duration (Cassera et al. 2009, Stepaniak et al. 2009, Stepaniak 2010). By more
accurate statistical estimation of the surgery duration distributions, the variability can be further
reduced to improve the benefits of POM-ORS approach.
The sequential debottleneck results indicate that there is no significant difference
between eliminating one versus three tardiness at a time. This suggests that POM-ORS can be
efficiently implemented by aggregating tardiness. However, since the risk priority of tardiness
change with sequential elimination, caution must be exercised. We surmise that, as the
differences between delay risks increase, the need for sequential decreases and aggregation
becomes more acceptable. This is because the tardiness with dominating risks are less likely to
shift in their importance order. In general, one might expect the Pareto principle (the law of the
vital few) to hold where majority of the POM-ORS benefits could be attained by debottlenecking
few tardiness. However, we observed that the benefits of debottlenecking increases with the
tardiness eliminated. This is explained by noting that the initial delay risk estimates are not
accurate for later case delays as the previous case overruns mask the true effect of these later
tardiness. In summary, the sequentially debottlenecking also provides the benefit of accurately
estimating the delay risks for later cases’ tardiness.
The delay reasons are prioritized based on tardiness of case start time, but the effects of
debottlenecking is evaluated in over-utilized OR time and case cancellation rate. Clearly, a 5-
minute delay does not necessarily result in 5-minute addition to the over-utilized OR time, and,
similarly, a 5-minute of surgeon being late for the 1st case may not have the same effect in over-
utilized OR time as a 5-minute of surgeon being late of the last case. Hence, the tardiness
prioritization for debottlenecking should ideally be based on performance measures. However,
this requires extensive simulation effort due to the need for a separate simulation run for each
possible tardiness subset to be eliminated. In the proposed POM-ORS approach, there is need

80
for only a single simulation run. Further, the practice of proactive management requires OR
managers to tackle the most important tardiness first and then extend their efforts to the
subsequent tardiness.
As we explored the POM-ORS under different scheduling policies (under-scheduled,
over-scheduled and matching scheduled) with different case duration variability (low and high).
The effectiveness of POM-ORS should be widely applicable to other facilities, regardless of their
allocated OR time or complexity of surgeries (i.e. case duration distributions) or surgery
specialty characteristics. In the case study, we assumed an 8 hour OR allocation. In other big
facilities, ORs might be allocated with 10 or 12 hours. For those facilities, the number of
scheduled cases in each OR is greater than the scenario studied here with more delay reasons
to be tackled. POM-ORS is more beneficial for big ORs as no matter how many delay reasons
present in the system, the number of simulation runs depends only on the number of delay
reasons to be eliminated. If the OR manager wants to eliminate top 10 delay reasons in each
room, then whether there are 5 ORs or 30 ORs, only ten simulation runs need to be executed.
Thus, the complexity of this approach does not increase exponentially with the OR workload as
many other optimization/statistical approaches, which makes this approach very useful from
practice perspective. In our case study, we simplified the OR operation by assume each OR
performed a single type of cases. Wachtel and Dexter (Wachtel and Dexter 2009) explored
factors that impact the case start time. They found out that the mean tardiness of case starts
does not depend on the mix of case duration nor the type of cases performed in the OR suite,
but the total time elapse as the uncertainty in the total duration of series of cases is greater. The
conclusions of our studies; thus, are not subject to change as the type of facility changes.
A significant portion of the case is delayed due to previous case overrun, even though
some research has indicated that using mean to schedule cases is reasonable (Dexter et al.
1999, Alvarez et al. 2010). The overruns are due to the natural variability of surgery processes.
This problem cannot be solved by obtaining more cases for duration estimation (Zhou et al.
81
1999, Wachtel and Dexter 2009). There are many papers studied the estimation of single case
duration. None of it has the ability to prevent the tardiness of case start. A more detailed
segmentation of case duration data by using more factors can provide a more detail-oriented
mean case duration for case scheduling; however, the case duration variability remains high.
And when more factors are included, the sample size for mean case duration calculation
decreased, making a lot of cases has no or very few historical duration for scheduling (Dexter
and Macario 2000, Dexter et al. 2002). Thus, in order for the OR to optimize the performance, it
is more important to allocate the OR time which takes into account of the case duration
prediction inaccuracy to achieve an optimum efficiency of use of OR time and coordinate the
scheduling of cases to control the total variability of the surgery lists rather than a more accurate
estimation of case duration, because the estimation is not accurate. Given an optimum allocated
OR time, the POM-OR improves the efficiency of use of OR time further not through re-
allocation of OR time, but reducing the cost of over-utilized OR time. Thus, our study
complement the current OR allocation study.
There are several adaptations of the POM-ORS. We implemented POM-ORS by
selecting the top delay reasons one at a time for each OR. However, this independent selection
assumes that there is no interaction among ORs. The degree of interaction between ORs in
Detroit VAMC is negligible. In larger OR theaters, surgeons may simultaneously perform
multiple surgeries in different ORs or anesthesiologists support multiple cases at any given time.
Then, the tardiness in one OR could have impact on the other ORs and vice versa. In such
cases, the shared resources across ORs need to be considered as a single resource and the
tardiness for those resources need to be evaluated jointly. While we have not explicitly
accounted for the costs, the debottlenecking of tardiness requires resources in the form of staff
time, expedited orders, and so on. The POM-ORS methodology can be adapted to include the
cost considerations by selecting the delays based on their priority as well as the availability and
cost of resources.

82
Here, in our analysis, we assumed that the elimination of tardiness will not impact the
quality of care and all the top delay reasons can be completely resolved from the system.
However, this assumption is partially correct in reality. For example, a case is delayed because
of the patient condition needs further medical evaluation. We do not emphasize the importance
of eliminating this tardiness over patient safety by forcing the patient to be in the OR without a
thorough evaluation as it would result in severe outcomes. Thus, some of the delay reasons
might not be able to completely disappear from the system. In implementation, the team can
accommodate the incompleteness of elimination of a specific delay reasons by adjusting the
level of delay resolution through modifying the delay probability of occurrence and realized
durations.
4.4 Conclusion
We developed a proactive management approach for OR resources based on
operational simulation. This approach can be used by OR managers take proactive actions to
improve the operational performance (e.g., reduce the over-utilized OR time and case
cancellations). The proposed approach quantifies risks associated with operational delays and
prioritizes them for elimination subject to available resources. The a simulation model needs to
be run iteratively so that the dynamics in the delay risks are captured in such a way the most
important delay reasons are output on top of all the delay reasons. In such a way, the OR
managers are provided with a number of delay reasons for each OR by eliminating which to
generate the most significant performance benefit. The approach is applicable to any OR facility
type as long as the historical data on case delay information is available to as input into the
model. The execution time of the model depends linearly on the number of delay reasons to be
eliminated for each OR per the choice of OR management and not depend on the size of the
OR, which makes it really beneficial to large ORs where large number of delays cause the
difficulty for delay reason selection at the first place. Through a case study, we demonstrated
83
the benefits of the proposed approach on reducing over-utilized OR time and case
cancellations. The benefits increase with effective scheduling practices, reduced surgery
duration variance, and accurate prediction of surgery durations.
There are several avenues for further investigation. First research opportunity is the
investigation of the interplay between scheduling policies and effectiveness of the proposed
approach. Second research direction is to develop a methodology for selecting multiple delay
reasons and debottlenecking them collectively so as to improve the efficiency of the proposed
approach while maintaining its accuracy.

84
CHAPTER 5 BEHAVIORAL STUDY OF MEAN TURNOVER TIMES AND FIRST CASE START TARDINESS
5.1 Introduction and Literature Review
Operating room (OR) scheduling systems list allocated OR time by service. The cases
are scheduled into the allocated time. When cases end later than the allocated hours, there is
over-utilized OR time. Contemporary OR information systems also include electronic displays
(“whiteboards”) showing information about surgical case progress to facilitate OR managers’
decision making on the day of surgery (e.g., to reduce over-utilized OR time). However,
decisions involving multiple ORs that are made using these passive displays are significantly
worse than random chance (Dexter et al. 2007a). Instead, displays with recommendations
enhance decision-making, and education increases trust in recommendations (Wachtel and
Dexter 2010).
Previous work has identified two psychological biases as contributing to the lack
of benefit of information alone (Dexter et al. 2007, Stepaniak et al. 2009). First, at the
OR control desk, decisions for add-on case scheduling, moving cases between ORs, etc., differ
depending on whether the decision-maker is psychologically risk averse or not risk averse
(Stepaniak et al. 2009). Second, many OR staff make decisions based on increasing clinical
work per unit time during the hours they are assigned (Dexter et al. 2007a). This heuristic (rule-
of-thumb) is logical for decisions involving single ORs, because the heuristic serves to reduce
the expected hours of over-utilized OR time. However, when applied to decisions involving
multiple ORs, the decisions are highly sub-optimal (Dexter et al. 2007a, Dexter et al. 2007b).
For example, if there is one empty post-anesthesia care unit bed for two ORs, the bed often
would go to the first exiting OR with 1 hr under-utilized OR time rather than to the second OR
exiting 10 min later but with > 1 hr over-utilized OR time. For another example, if an
anesthesiologist has two ORs each with experienced certified registered nurse anesthetists

85
ready to start, the anesthesiologist often would first do the quick adult induction in one OR with
under-utilized OR time and then do the longer pediatric induction with caudal block in the OR
with over-utilized OR time (Dexter et al. 2007a). As expected based on being due to a bias,
behavior is unaffected by education and by changes to cases’ classifications of medical urgency
(Dexter et al. 2007a, Ledolter et al. 2010). The bias may be sustained by physician perception
of team activity as being favorable (Shapiro et al. 2010, Masursky et al. 2011).
A limitation of the preceding studies (Dexter et al. 2007a, Dexter et al. 2007b) is that
information alone (e.g., by electronic white board) was worse than random chance for decisions
in simulated scenarios (Dexter et al. 2007a) involving changes in over-utilized OR time (Dexter
et al. 2009, Wachtel and Dexter 2009). Most such decisions are made during regularly
scheduled hours. However, the explanations for the behavior (i.e., the second bias) were
studied in non-operating room settings and on nights and weekends. These periods were
studied to isolate the behavior of clinicians throughout the surgical suite (i.e., the second bias)
from bias of the perioperative manager at the OR control desk with (or without) risk aversion
(i.e., from the first bias) (Dexter et al. 2007b, Stepaniak et al. 2009). Additional research is
warranted, because a recent study reported that the work pace of service workers from patient
transport services and cardiothoracic surgery were influenced by workload (Kc and Terwiesch
2009). By testing if the work pace of OR staff was impacted by OR workload, we aim to increase
understanding of OR staff behavior.
In the current paper, we study a facility with 8 hr allocated time in each OR, staff (e.g.
anesthesiologists, CRNA, nurses, OR techs) scheduled for 8 hr, and hardly any over-utilized OR
time (see below in Results) (Wachtel and Dexter 2010). At such a facility, decisions at the
control desk would be the same, regardless of whether the decision-maker is risk averse or non-
risk averse. Regardless of how cases are moved between ORs and/or how staff are assigned,
there would be hardly any chance of over-utilized OR time and the staff working late (Stepaniak
et al. 2009). Consequently, the (second) bias of increasing clinical work per unit time during the

86
hours to which each staff is assigned would be illustrated by OR staff overall maintaining
a constant patient flow, regardless of the day’s estimated (total) duration of elective cases (i.e.
scheduled OR workload). Such behavior can be tested by estimating the correlations between
1) the scheduled OR workload and the mean turnover times and 2) between the scheduled OR
workload and mean first case start tardiness. We hypothesized that the overall ensemble
behavior of OR staff were decisions that would maintain clinical work per unit time, resulting in
no managerially important correlations (e.g., on less busy days, if the mean turnover times were
longer, then they would be so only by tiny amounts).
5.2 Methods
The quality improvement project was performed for the John D. Dingell VA Medical
Center located in Detroit, Michigan.
We used one-year data from January 1, 2010 to December 31, 2010. One year was
studied (weekends and holidays excluded) so that the same allocated OR time could be used
throughout the period (e.g., no trend) (Epstein and Dexter 2002). The use of the longest period
possible gave us the advantage of maximal statistical power, as it provided the maximum
possible sample size. This was important as our objective was to detect what we hypothesized
to be small effects of OR workload on mean turnover times and mean first case start tardiness.
The analysis was done in two phases. In the first phase, we checked that the allocated
OR time during the date range was optimum. It was pre-requisite for the behavioral study, since
decisions on the day of surgery to move cases or to change start times were sensitive to the
allocations of OR time. To proceed, the facility’s use of five ORs for 8 hr should be less efficient
than running fewer ORs for 8 hr (i.e., staff could reliably know that their workday would end
in 8 hr regardless of their decisions). After this phase was completed, we studied the behavior
of the OR staff. Although the data were from a hospital, many of the surgical patients were
outpatients. The OR conditions we studied in this paper are common for outpatient surgery
87
centers. However, as explained in the Introduction, the usefulness of testing our hypotheses
is principally for hospitals with many ORs having more than 8 hr of cases (e.g., large general
teaching hospitals).
5.2.1 Allocated OR Time
During the one-year period, there were 46 Mondays, 52 Tuesdays and Wednesdays,
and 50 Thursdays and Fridays (holidays excluded). Five ORs were open on each workday for 8
hr, except for Wednesday with one-hour late start for education. The facility functioned as one
giant service. On each day of week, surgeons from different specialties shared the allocated OR
time, and cases were scheduled using Worst Fit Descending algorithm as if they were from a
single service. Nurses, anesthesia providers, etc., cared for patients of all specialties. Although
each specialty had its designated OR, each often did cases in other ORs.
This analysis was performed as described in previous studies (Dexter et al. 2001,
McIntosh et al. 2006). For each day, the OR workload (including turnover times) was grouped
by surgeon. Each surgeon’s workload was assigned to an OR using the Worst Fit Descending
scheduling algorithm (Galambos and Woeginger 1995, Dexter et al. 1999). What this means is
that the surgeon’s list of cases was scheduled into the OR providing the earliest possible start
time (Galambos and Woeginger 1995, McIntosh et al. 2006, Dexter and Traub 2002). Worst Fit
matched the observed behavior of filling all the first case starts (Galambos and Woeginger
1995). With one (typically) or two (occasionally) surgeons per OR per day and typically zero
add-on cases, Worst Fit Descending minimized the expected inefficiency of use of OR time
(Dexter et al. 1999).
Whenever a turnover time was longer than 90 minutes, we rounded the turnover time
down to 90 minutes. We used 90 minutes as the maximum in part because it was the
90th percentile of the turnover times for the data set (Dexter et al. 2001). Longer turnover times

88
might be due to gaps in the OR schedule (e.g. cases not scheduled sequentially) (Dexter et al.
2005).
We deliberately included three days with unusually low workload in the calculations of
allocated OR time. Two workdays (July 27, 2010 and December 28, 2010) had no turnover
times, as there was only one case performed in each OR. One workday (December 6, 2010)
had just one turnover time, and it was longer than 90 minutes. Inclusion of these days
(deliberately) biased results toward more over-utilized OR time.
We explored the options of running four ORs, five ORs and six ORs, each with the
combination of 8 hr and 10 hr allocation for each day of week. For each combination of numbers
of ORs and hours, we compared the inefficiency of use of OR time to the baseline inefficiency
from the actual allocated OR time (Strum et al. 1997). The inefficiency of use of OR time was
calculated as the daily sum of the under-utilized OR time plus 1.75 times the over-utilized
OR time (Epstein and Dexter 2002, Dexter et al. 2001, McIntosh et al. 2006).
The mean potential improvement in the inefficiency of use of OR time and its standard
errors were calculated by performing 1000 replications of cross-validation. For each replication,
¼ of the days in the data set were used as testing set and the other ¾ as the training set. The
analysis was conducted using Matlab R2010a (The MathWorks Inc., Natick, MA).
5.2.2 Behavior of the OR Staff
The three slow days (i.e. July 27, 2010, December 28, 2010, and December 6, 2010)
were excluded from this study since no valid turnover times were available. August 16, 2010
was also excluded because the only turnover was between an elective case and an urgent
case. After excluding these four days, there were 246-days total for study.
The turnovers between elective and urgent cases were not excluded in the preceding
first part of our analysis (i.e. the optimum allocated OR time). The reason for including the
turnovers was because the turnover times were part of OR workload. Excluding them would

89
make the OR workload lower than what actually was observed, resulting in the optimum
allocated OR time being smaller than needed. In contrast, for this second part of the analysis
(i.e., mean turnover time calculation), the inclusion of such turnover times would have
introduced outliers, causing the mean value to be inaccurate. We excluded these days to
reduce the impact of potential outliers on our results.
For each case, the data we used were operating room, surgery date, time that patient
entered the OR, time that patient left the OR, scheduled start time of the case, scheduled end
time of the case, and elective (scheduled) or add-on (urgent). There were 4.4% add-on (urgent)
cases (129 of 2906). We did not include the 3.7% of turnover times that included an urgent case
(47 of 1259) in the behavioral study as such cases were unexpected to the OR staff.
For each workday, there was one independent variable: allocated OR time. There were
also six correlated dependent variables: estimated duration of elective cases, actual duration of
elective cases, estimated duration of add-on cases, actual duration of add-on cases, mean first
case start tardiness, and mean turnover times. The first four were totals for all such cases
during the workday. The latter two were means for all such cases during the day. The
percentiles for the variables are summarized in Table 13.
The tardiness of each first case of the day start was calculated as the difference
between the scheduled start time of the case and the time that the patient entered the OR
(Wachtel and Dexter 2009a, Wachtel and Dexter 2009b). If the time the patient entered the OR
was before the scheduled start time of the case (2.2% of first cases), the tardiness was
considered to be zero (Wachtel and Dexter 2009a, Wachtel and Dexter 2009b).
The raw data had some missing information. For 1.0% of the cases (30 of 2906), there
was no scheduled duration. We did not want to ignore these cases as they occurred on 10%
of the workdays (25 of 246). We imputed the missing information from schedules before
conducting the behavioral analysis (Wachtel and Dexter 2010).

90
Table 12: Percentiles for Defined Variables in the Behavioral Study
Defined Variables 10% 25% 50% 75% 90% Mean
Allocated OR time (hr) 35 40 40 40 40 39
Estimated (total) duration of elective cases (hr) 12 15 20 24 27 19
Actual (total) duration of elective cases (hr) 15 17 21 26 29 22
Estimated (total) duration of add-on cases (hr) 0 0 0 2 3 1
Actual (total) duration of add-on cases (hr) 0 0 0 1 3 1
Mean first case start tardiness (min) 0 2 5 12 17 7
Mean turnover times (min) 26 32 40 47 55 40
As reported previously, mean turnover times were correlated among days (Dexter et al.
2005), and this was built into the analysis. In 1999, Dexter et al. (Dexter et al. 1999), used
structural equation modeling to model variability in underutilized OR time. We modified the path
diagram to better study the psychological biases. The final path diagram used for parameter
estimation is shown in Figure 19. The following five paragraphs give a detailed description of the
path diagram and the reasons for the path selections. The development of the path diagram
was a step in the structural equation modeling used to test our hypotheses.
On Wednesdays, when less OR time was allocated, fewer elective cases and add-on
cases were scheduled. This is represented in the path diagram by the arrow going out from
“Allocated OR time” to “Estimated duration of elective cases” and to “Estimated duration of add-
on cases”. These paths make sense, because the availability of OR time can influence how
many hours of case are added to the day’s schedule (Dexter et al. 1999).

91
Allo
cate
d O
R T
ime
Est
imat
ed
Ele
ctiv
e E
stim
ated
A
dd-o
n
Mea
n 1s
t C
ase
Del
ayM
ean
Tur
nove
r
Act
ual
Ele
ctiv
e A
ctua
l Add
-on
Cas
es
�1
�2
�3
�4
�5
�6
ab
cd
ef
1110
9
8
7
6
5
1
2 34
Fig
ure
19: P
ath
Dia
gram
of t
he S
truc
tura
l Equ
atio
n M
odel
ing

92
When less OR time was allocated, it might matter whether first cases of the day start on-
time, because the OR staff might perceive that a delayed start of the day might cause them
to finish late (Dexter et al. 2009). Thus, a path from “Allocated OR time” to “Mean first case start
tardiness” was added.
The estimated (total) duration of elective cases linearly influenced the actual (total)
duration of elective cases in the model (Figure 19) (Dexter et al. 1999). Likewise, the estimated
(total) duration of add-on cases influenced the actual (total) duration of add-on cases (Dexter et
al. 1999). The Kendall’s τn rank correlations did not show a significant relation between the
mean first case start tardiness and mean turnover times, nor between the estimated (total)
duration of elective cases and the estimated (total) duration of add-on cases (both P > 0.28).
Since the studied facility had copious under-utilized OR time, we did not include these paths.
The other paths included were for hypothesis testing (i.e. the estimated and actual
duration of cases to mean turnover times and mean first case start tardiness). We had two
paths from the estimated (total) durations of both elective and add-on cases to mean turnover
times. OR staff perceptions of the workload might have been based on the estimated (total)
duration of cases. As the day proceeded, staff behavior might also have been impacted by the
actual (total) duration of cases. For example, when a case ended much earlier than planned,
there was plenty of time for the staff to set up the room for the next case. They might work not
as fast. On the other hand, when a case took longer than scheduled, the staff might speed up to
reduce the tardiness of start of the next cases in the OR.
The analyses could have been performed with the number of cases instead of with the
estimated (total) duration of cases (Figure 19). By scatter plot and Pearson linear correlation
coefficient (r = 0.72), the two were substitutable. To choose, we calculated the Kendall’s τb rank
correlations with the mean first case start tardiness and mean turnover times (Wachtel and
Dexter 2010). Because the correlations between the estimated (total) duration of elective cases
and mean turnover times and mean first case start tardiness were larger than those with the

93
number of cases, we used the estimated (total) duration of cases for our analysis. By doing so,
we biased our results toward detecting a relationship between OR workload and turnover times
(i.e., biased to be contrary to our hypothesis).
The parameters of the structural equation model (Figure 19) were estimated to emulate
the observed covariance matrix among the defined variables (Raykov and Marcoulides 2000,
Schumacker and Lomax 2010). The distribution–free, weighted least squares method was used
for parameter estimation because several of the variables were not normally distributed (Lomax
1989). LISREL 8.8 student version (Scientific Software International, Inc., Lincolnwood, IL) was
used to generate the covariance matrix and estimate parameters.
Goodness of fit of the statistical model was assessed several ways, as recommended for
structural equation models (Schumacker and Lomax 2010). The chi-square test along with its P-
value, root mean square error of approximation (RMSEA), and goodness-of-fit index (GFI)/
adjusted goodness-of-fit index (AGFI) were the methods that we used to evaluate the model
performance (Schumacker and Lomax 2010). The chi-square test and its P-value indicate how
different the observed and implied covariance matrices is. A small P-value suggests a poor
model fit (Schumacker and Lomax 2010). RMSEA estimates lack of fit compared to the
saturated model (perfect model). A value of 0.05 or less indicates a good fit, and a value of 0.08
represents an acceptable model (Dexter et al. 1999, Schumacker and Lomax 2010). The
GFI/AGFI are similar to the R-squared/adjusted R-squared in regression. They measure the
amount of variance in the observed covariance matrices predicted by the reproduced matrices.
A GFI/AGFI that is larger than 0.95 suggests a good model (Schumacker and Lomax 2010).
From 2008 through the studied year, the studied facility had no ongoing quality
improvement or monitoring program focused on reducing turnover times. However, there was
a project focused on reducing first case start tardiness. The latter could negatively affect the
generalizability of our findings to other facilities. However, there was no public incentive or
financial reward for individuals or OR groups, making the influence limited. Nonetheless, the

94
estimated relationships for mean first case start tardiness must be considered secondary
to those for turnover time.
Besides the primary analysis, we ran two sensitivity analyses. There were only two
housekeeping teams at the studied facility. When there were more than two cases finished
close to simultaneously, turnover(s) was delayed, waiting for the next available housekeeping
team. This sharing of resources made the turnovers longer (Dexter et al. 2009). To isolated
influences of more than two simultaneous turnovers, we first re-calculated the mean turnover
times, excluding turnovers including any 1-minute period with more than two simultaneous
turnovers. Second, instead of excluding turnover times longer than 90 minutes for the
calculation of the daily mean turnover time, we excluded those turnovers longer than
60 minutes.
5.3 Results
The allocated OR time was significantly larger than optimum (Table 14), satisfying the
condition for the behavioral study. Although five ORs were open daily, four ORs were sufficient
(see Discussion). For each day of the week, there was little over-utilized OR time (from 0.01 ±
0.03 [standard error] hr to 0.06 ± 0.24 hr per OR per day) (Table 14).
The structural equation model demonstrated reasonable fit based on the chi-square test
P = 0.47 (greater than 0.05). The root mean square error of approximation was 0.01 (unitless)
(smaller than 0.05). Both the goodness-of-fit index and the adjusted goodness-of-fit index were
larger than 0.95 (0.99 and 0.98, respectively). The coefficients parameter estimates and their P-
values are given in Table 15.

95
Table 13: Difference in the Inefficiency of Use of Operating Room (OR) Time between Actual
and Optimum Allocation of OR Time
Allocation of OR Time
Day of Week Actual Optimum
OR Inefficiency Difference
Mean ± SE (%)
Over-utilized OR Time per OR (hr)
Monday 5 ORs × 8 Hrs 3 ORs × 8 Hrs +
21.11 ± 0.24 0.06 ± 0.24 1 OR × 10 Hrs
Tuesday 5 ORs × 8 Hrs 4 ORs × 8 Hrs 37.87 ± 0.10 <0.01
Wednesday 5 ORs × 7 Hrs 4 ORs × 7 Hrs 33.58 ± 0.24 0.03 ± 0.16
Thursday 5 ORs × 8 Hrs 4 ORs × 8 Hrs 34.99 ± 0.27 0.01 ± 0.03
Friday 5 ORs × 8 Hrs 4 × 8 Hrs 38.87 ± 0.24 0.01 ± 0.07
There was a substantial range in the estimated (total) duration of elective cases (e.g.,
10th percentile 12 hr versus 90th percentile 27 hr, Table 13). A decrease by 1 hr in the estimated
(total) duration of elective cases caused the mean turnover times to decrease by 0.41 ± 0.21
minutes (P=0.05) (Table 15). Decreases in the actual (total) duration of cases, either of elective
cases or of add-on cases, did not result in significant decreases (changes) in mean turnover
times (P=0.37 and P=0.89, respectively, Table 15). The two sensitivity analyses’ results match
this finding of no managerially relevant increase from decreases in the estimated (total) duration
of elective cases. Observed decreases in mean turnover times in these two analyses were
0.17 ± 0.24 minutes (P=0.46) and 0.16 ± 0.16 minutes (P=0.31), respectively (Table 16)
(Wachtel and Dexter 2010).

96
Table 14: Outputs of Primary Structural Equation Modeling
ORAll 11 EstELEC 12 EstADD 13 ActELEC 14 ActADD 15 1ST16 TOT17
ORAll
Coefficient - 0.6932 0.0141 - - 0.0047 -
SE - 0.1218 0.0238 - - 0.0025 -
P-value - <.0001 0.5520 - - 0.0570 -
EstELEC
Coefficient - - - 0.8785 - 0.0033 0.0068
SE - - - 0.0382 - 0.0013 0.0035
P-Value - - - <.0001 - 0.0084 0.0531
EstADD
Coefficient - - - - 0.7959 0.0014 0.0209
SE - - - - 0.0371 0.0066 0.0296
P-value - - - - <0.0001 0.8338 0.4793
ActELEC
Coefficient - - - - - - 0.0031
SE - - - - - - 0.0034
P-value - - - - - - 0.3689
ActADD
Coefficient - - - - - - -0.0053
SE - - - - - - 0.0365
P-value - - - - - - 0.8853
Each 1 hr decrease in the estimated (total) duration of elective cases caused the mean
first case start tardiness to decrease by 0.2 ± 0.1 minutes (P=0.01). In the studied facility, 69%
of the workdays (170 of 246) were of 5 ORs (i.e., first cases of the day). We saw only four first
cases for the rest of the days because of the overall low estimated (total) duration of elective
cases. The mean estimated (total) duration of elective cases on the days of four first cases was
16.1 ± 0.5 hr vs. 21.8 ± 0.4 hr for the days of five first cases. When there was less workload,
there were fewer numbers of first cases of the day. Thus, there was no fifth OR to wait for the
11. OR allocation 12. Estimated elective case duration 13. Estimated add-on case duration 14. Actual elective case duration 15. Actual add-on case duration 16. Mean first case start tardiness 17.Mean turnover time

97
anesthesiologist with three inductions to do, resulting in smaller mean tardiness (Epstein and
Dexter 2012).
Table 15: Key Outputs of the Sensitivity Analyses of the Structural Equation Modeling
Exclude Simultaneous
TOTs > 2 Exclude TOTs > 60 Min
1ST TOT 1ST TOT
EstELEC
Coefficient 0.0033 0.0029 0.0032 0.0027
SE 0.0012 0.0040 0.0013 0.0027
P-value 0.0074 0.4639 0.0146 0.3149
EstADD
Coefficient 0.0018 0.0208 0.0027 0.0063
SE 0.0067 0.0356 0.0068 0.0211
P-value 0.7881 0.5587 0.6931 0.7660
ActELEC
Coefficient - 0.0038 - 0.0036
SE - 0.0038 - 0.0030
P-value - 0.3192 - 0.2253
ActADD
Coefficient - -0.0056 - 0.0111
SE - 0.0429 - 0.0285
P-value - 0.8964 - 0.6959
5.4 Discussion
We studied the overall (ensemble) behavior of OR staff at a facility with virtually no over-
utilized OR time. We analyzed allocated OR time first, because rational (and biased) decision-
making is sensitive to this parameter (Dexter et al. 2001, McIntosh et al. 2006, Stepaniak et al.
2009). As hypothesized, the mean turnover times were negligibly impacted by the estimated
(total) duration of elective cases. OR staff kept a constant work pace for non-operative times,
except for a slight slowing when there were more than two simultaneous turnovers. The staff
overall did not slow down to fill the time when less busy. This negative finding was not caused

98
by there being only small differences in the estimated (total) duration of elective cases among
days, as this variable varied markedly (Table 14). Rather, the behavior was consistent with the
bias of most staff to maintain their clinical work per unit time during the hours to which they were
assigned (Dexter et al. 2007a, Dexter et al.2007b). As summarized in the Introduction, knowing
that this bias applies commonly overall among many individuals is important for different
facilities with some under-utilized and some over-utilized time, because the consequence is that
electronic displays providing information without evidence-based recommendations will result in
decisions that are worse than decisions made at random (Dexter et al. 2007a, Dexter et al.
2009, Wachtel and Dexter 2009). The fact that the study was made of the overall behavior of
the population (community) of OR nurses, anesthesiologists, etc., is important because many
managerial decisions are spatially and temporally distributed. Changing the behavior involves
the use of multiple displays (e.g., electronic whiteboards and pagers).
Results were insensitive to the heterogeneity among days in the hours of add-on cases
(i.e., OR staff behavior was not significantly influenced by the add-on cases). One likely reason
is that most turnover times take place during the morning (Dexter et al. 2009), whereas most
add-on cases are performed during the afternoon. Another reason is that for surgical suites with
optimum allocated OR time, the substantial OR workload from add-on cases has already been
included in the allocated OR time; thus, the probability of substantial over-utilized OR time
caused by add-on cases is not high. At the studied facility with an extra first case of the day
start, this was even more so.
We analyzed the allocated OR time first to make sure that the hypothesis test would be
done in a rational condition. In addition, in our structural equation modeling, add-on case factors
were included (Table 15), and none of them was statistically significant with respect to the mean
turnover time and mean first case start tardiness. Our results do not depend on the types of
facilities as the psychological bias was observed in other facilities in previous studies (Dexter et

99
al. 2007b, Ledolter et al. 2010). The results confirmed the bias during regularly scheduled OR
hours and complement previous studies.
Some readers may have considered it obvious from their experience that most clinicians
would work each day non-stop, rather than slowing down when there were fewer cases. For
example, in a Swedish qualitative research study, perceptions of efficiency included “doing what
must be done to achieve good workflow” and “working with preserved quality of care as fast as
possible.” (Arakelian et al. 2011). Such prior expectations both reinforce the strength of our
statistical findings and highlight the striking importance of their consequences. First, paying
anesthesiologists substantially more to work late does not result in their working slower and
thereby increasing compensation (see footnote Error! Bookmark not defined.†) (Masursky et al.
2009). Making the same observation from a different hospital was important, because basic
human nature (test) is to do that which increases the compensation of the people doing the
work. Second, for a facility like the one studied with little or no over-utilized OR time, the use of
electronic information displays throughout a surgical suite would not have return on investment.
That would not be true if OR staff often increased non-operative time on days with fewer
estimated (total) duration of cases. Third, for a different facility with more than 8 hr of cases
regularly in some ORs and different hours of cases performed in different ORs, the behavior is
(highly) suboptimal without recommendations (Marcon and Dexter 2007). Again, the reason
is that although clinicians’ behavior to increase clinical work per unit time when assigned
is reasonable for decisions involving one OR at a time, that does not apply to decisions
involving multiple ORs (e.g., anesthesiologists supervising several nurse anesthetists, moving
of cases, scheduling of add-on cases, etc.) (Dexter et al. 2007a, Dexter et al. 2007b, Dexter et
al. 2009, Wachtel and Dexter 2009). The two sensitivity analyses focused on the managerially
irrelevant, but (barely) statistically significant, change in mean turnover times. As described
previously (Dexter et al. 2009), we calculated the percentage of days with more than two
simultaneous turnovers. On days with more cases scheduled (i.e., more turnovers), there were

100
more resulting delays in turnovers caused by there being only two available housekeeping
teams (Figure 20). Waiting for an available housekeeping team made the turnover times longer
than usual (Dexter et al. 2009). When we eliminated the influence of the simultaneous
turnovers, the impacts of the estimated (total) duration of elective cases on mean turnover times
became less. As hypothesized, from another perspective, OR staff’s work pace was not
influenced by OR workload.
Figure 20: Percentage of Days with Simultaneous Turnovers Greater than 2 and Daily Mean Wait Time from the Turnovers
To achieve a reduction in costs, the management of the studied facility could have run
one fewer OR daily and changed allocated OR time (Dexter et al. 2001, Epstein and Dexter
2002). The way to optimize OR cost efficiency was not to reduce turnover times or ensure on-
time start of the workday, but to re-allocate OR hours and to reduce the under-utilized OR hours
(McIntosh et al. 2006). However, randomized clinical trials have found that when there are four
ORs with different surgeons each with at least 8 hr of cases, productivity was increased by
running five ORs (Torkki et al. 2005, Marjamaa et al. 2009). When running three ORs with more
0.00
5.00
10.00
15.00
20.00
25.00
30.00
35.00
40.00
45.00
10%
20%
30%
40%
50%
60%
70%
80%
Daily Mean Waiting Time Percentage of Days

101
than 8 hr of cases, running four ORs also increased productivity (Hanss et al. 2005).
Furthermore, running more ORs increases first cases starts which reduces tardiness from
scheduled start times for surgeons (Wachtel and Dexter 2009a, Wachtel and Dexter 2009b,
Wachtel and Dexter 2010). Therefore, although the choice of five ORs reduced the efficiency of
use of OR time, the tactical decision of running an extra OR might have been rational.
Regardless, the number of ORs open was a tactical decision made before the OR time was
allocated, and was thus incorporated in our calculation of allocated OR time (Dexter and
Macario 2002, McIntosh et al. 2006).
5.5 Conclusion
In summary, we explored the OR staff’s behavior at a facility with allocated OR time that
was optimal conditioned on a pre-determined number of ORs. Over-utilized OR time was rare.
The staff was scheduled to work for at least 8 hr. Given such a system, staff behavior did not
respond to the change in workload. The staff did not increase non-operative time on days with
fewer scheduled hours of cases. The results show that the predicted psychological bias that OR
staff work overall to increase clinical work per unit time during the hours they are assigned also
applies during regularly scheduled OR hours.

102
CHAPTER 6 CONCLUSIONS
6.1 Conclusions
In this dissertation, we reviewed the current research conducted in operating room
management in general and operating room utilization in particular. One of the key assumptions
in existing literature is that surgeons can schedule cases on any workday they select to do the
surgery, which is not applicable to many of the healthcare systems in the world. Given an
inflexible allocated OR time, the application of previous theories (e.g. frequently allocated OR
time) is limited. Thus, research is needed to provide useful information to OR managers for such
facilities to optimize the performance.
In Chapter 2, we used data from a facility with fixed allocated OR time to identify the
most important factors that influence utilization. We identified several factors that are
hypothesized to impact the utilization. Then, stepwise regression and best subset were applied
to rank the importance of factors. Simulation model was built to validate conclusions from the
statistical analysis and provided us with additional information on patient wait time on the day of
surgery. From the analysis, the scheduled OR utilization, the accuracy of case duration
prediction, the hours of cancellations and the hours of add-on cases were the most important
factors identified from all the models.
Based on the results from Chapter 2, we focused our research efforts to the scheduling
and prediction of case duration as they were the key factors identified to influence the OR
utilization. As there is naturally high variability in case duration, there is no way to precisely tell
when the ORs are closed but to predict the probability of the duration of surgery lists fall into a
range. We introduced Type IV Pearson distribution to approximate the duration of surgery lists
of multiple cases whose duration assumed to be log-normally distributed and validated its
accuracy. The results indicated that this model performed much better than the t-distribution

103
used in most of current research. It helped the OR manager to analyze the duration of surgery
lists and arrange the surgery lists to meet the performance targets.
In Chapter 4, an iterative operational simulation approach was proposed to identify the
bottlenecks (i.e. tardiness of case start) on the day of surgery. The model runs in such a way
that every time the most important reason for tardiness of case start defined by delay risk is
distinguished from the other reasons and eliminated. The process continues until a desired
performance in over-utilized OR time and cancellation rate is achieved. A case study illustrated
the application of the proposed approach. This method can improve the performance in both
over-utilized OR time and cancellation, but the effectiveness of the approach is subjected to the
influences of scheduling policy and the variability of case duration. An optimum allocated OR
time and small variability of case duration have this approach achieve its best benefits.
The effectiveness of the implementation of methodology is subject to OR staff’s
behavior. There have been studies implying that OR staff perceives efficiency as to complete
work as soon as possible. This would result sub optimal performance of OR. The Chapter 5 of
our dissertation studied if such a bias also exists for OR suites with hardly any over-utilized OR
time to isolate the bias we were interested in studying from other bias. We used structural
equation modeling to test our hypothesis that OR staff’s work pace was not influenced by the
workload as both mean turnover time and mean first case start tardiness were not statistically
significant influenced by the fluctuation of OR workload. The bias is common in OR facilities;
thus, OR management system needs to provide specific commands to OR staff instead of just
displaying information to prevent the psychological bias.
6.2 Future Research
The research conducted in Chapter 2 to identify the distribution of the duration of surgery
lists performed much better than currently applied t-distribution; however a portion of surgery
lists could not be evaluated by the Type IV Pearson distribution as the lists contained at least

104
one case that had no or only one historical case duration. By including data from multiple
facilities/extending the data collection range, the problem remained. Thus, methods that can
derive distribution parameter estimates from no or one historical case duration would be
extremely helpful to make the Type IV Pearson distribution function to its full capacity.
Another thing is that although the Type IV Pearson distribution provided better
estimates, there was still 5% deviation on the average to the true percentiles, which is an
indicator that there is further improvement space in finding a distribution that represents the true
distribution of surgery lists. By Monte Carlo Simulation, we found out that the inaccuracy was
resulted from the partially met log-normal distribution assumption of individual case duration. As
there is no universal distribution for each individual case duration, a distribution that is robust to
the sum of different type of distributions needs to be explored to better approximate the real
distribution of the duration of surgery lists.
Finally, our study as well as majority of current OR research focus only on OR. As we
know that the success of OR depends on upstream processes such as clinics and downstream
processes such as ICU and wards. A smooth of workflow among all the involved units is the key
to the success of OR. The information exchange, the tracking of patients and the dynamic
decision support in the system is most critical to facilitate the coordination among different units,
especially for a health care system that has multiple locations and patients can be transferred
from one facility to another. However, as the current OR information systems lack the ability to
extract information in a real-time manner, there is always a latency in decision making, which
would result in suboptimal OR performance. The OR operations shall be able to be boosted to
another level if a system that provides real-time decision making capability can be implemented
to assist OR managers in making timely decisions.

105
APPENDIX A: ACTUAL UTILIZATION AND PREDICTED UTILIZ ATION FROM STEPWISE REGRESSION AND BEST SUBSET MODELS
Table 16: Actual Utilization and Predicted Utilization from Models for May
Date Act Util Stepwise Best Subset
5/1/2009 58% 58% 57%
5/4/2009 67% 71% 73%
5/5/2009 81% 74% 73%
5/6/2009 69% 58% 57%
5/7/2009 96% 77% 76%
5/8/2009 72% 79% 78%
5/11/2009 65% 66% 68%
5/12/2009 76% 80% 82%
5/13/2009 95% 86% 88%
5/14/2009 100% 97% 100%
5/15/2009 73% 70% 67%
5/18/2009 92% 87% 89%
5/19/2009 81% 79% 80%
5/20/2009 80% 75% 75%
5/21/2009 96% 88% 89%
5/22/2009 88% 79% 77%
5/26/2009 69% 63% 63%
5/27/2009 70% 71% 72%
5/28/2009 93% 80% 80%
5/29/2009 99% 98% 99%

106
Table 17: Actual Utilization and Predicted Utilization from Models for June
Date Act Util Stepwise Best Subset
6/1/2009 82% 70% 70%
6/2/2009 66% 66% 66%
6/3/2009 69% 74% 74%
6/4/2009 66% 77% 77%
6/5/2009 77% 78% 78%
6/8/2009 96% 96% 96%
6/9/2009 70% 63% 63%
6/10/2009 76% 78% 78%
6/11/2009 66% 70% 70%
6/12/2009 63% 70% 70%
6/15/2009 72% 70% 70%
6/16/2009 72% 77% 77%
6/17/2009 94% 95% 95%
6/18/2009 84% 87% 87%
6/19/2009 83% 79% 79%
6/22/2009 54% 61% 61%
6/23/2009 56% 55% 55%
6/24/2009 78% 71% 71%
6/25/2009 90% 91% 91%
6/26/2009 88% 85% 85%
6/29/2009 78% 75% 75%
6/30/2009 68% 63% 63%

107
Table 18: Actual Utilization and Predicted Utilization from Models for July
Date Act Util Stepwise Best Subset
7/6/2009 74% 79% 79%
7/7/2009 61% 61% 61%
7/8/2009 79% 74% 74%
7/9/2009 88% 85% 85%
7/10/2009 86% 87% 87%
7/13/2009 74% 77% 77%
7/14/2009 74% 72% 72%
7/15/2009 63% 57% 57%
7/16/2009 85% 79% 79%
7/17/2009 83% 77% 77%
7/20/2009 81% 81% 81%
7/21/2009 88% 93% 93%
7/22/2009 91% 78% 78%
7/23/2009 104% 96% 96%
7/24/2009 88% 78% 78%
7/27/2009 87% 88% 88%
7/28/2009 54% 51% 51%
7/29/2009 66% 74% 74%
7/30/2009 107% 109% 109%
7/31/2009 58% 62% 62%

108
Table 19: Actual Utilization and Predicted Utilization from Models for August
Date Act Util Stepwise Best Subset
8/3/2009 73% 78% 78%
8/4/2009 62% 61% 61%
8/5/2009 39% 43% 43%
8/6/2009 68% 79% 79%
8/7/2009 47% 54% 54%
8/10/2009 50% 64% 64%
8/11/2009 70% 83% 83%
8/12/2009 42% 51% 51%
8/13/2009 55% 61% 61%
8/14/2009 61% 61% 61%
8/17/2009 58% 61% 61%
8/18/2009 56% 57% 57%
8/19/2009 78% 61% 61%
8/20/2009 67% 77% 77%
8/21/2009 77% 97% 97%
8/24/2009 58% 66% 66%
8/25/2009 68% 50% 50%
8/27/2009 67% 48% 48%
8/28/2009 78% 87% 87%
8/31/2009 66% 71% 71%
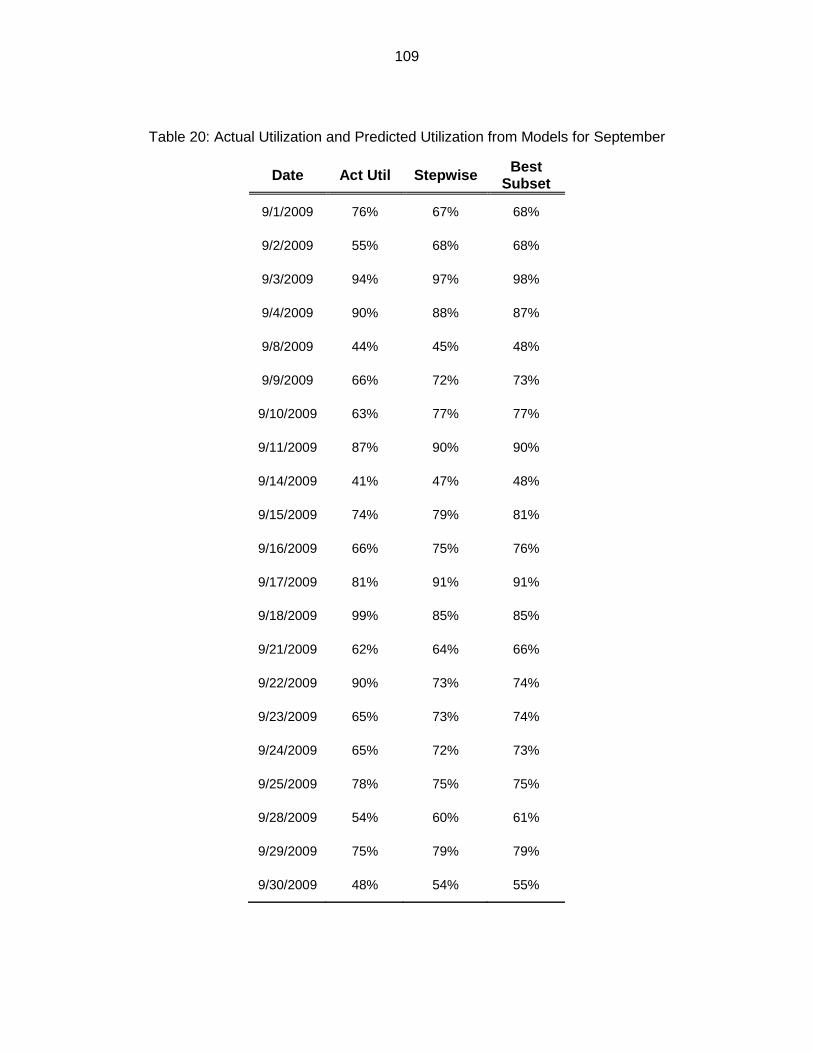
109
Table 20: Actual Utilization and Predicted Utilization from Models for September
Date Act Util Stepwise Best Subset
9/1/2009 76% 67% 68%
9/2/2009 55% 68% 68%
9/3/2009 94% 97% 98%
9/4/2009 90% 88% 87%
9/8/2009 44% 45% 48%
9/9/2009 66% 72% 73%
9/10/2009 63% 77% 77%
9/11/2009 87% 90% 90%
9/14/2009 41% 47% 48%
9/15/2009 74% 79% 81%
9/16/2009 66% 75% 76%
9/17/2009 81% 91% 91%
9/18/2009 99% 85% 85%
9/21/2009 62% 64% 66%
9/22/2009 90% 73% 74%
9/23/2009 65% 73% 74%
9/24/2009 65% 72% 73%
9/25/2009 78% 75% 75%
9/28/2009 54% 60% 61%
9/29/2009 75% 79% 79%
9/30/2009 48% 54% 55%

110
APPENDIX B: STATISTICS OF OR UTILIZATION OF FOUR CA SE DURATION DISTRIBUTIONS FROM SIMULATIONS
Table 21: Simulated Utilization for Case Duration Type 1
Utilization of Case Type 1
Scheduled Utilization 50% 1st Delay 1 50% 1st Delay 2 90% 1st Delay 1 90% 1st Delay 2
50% 55% ± 0.09% 55% ± 0.09% 55% ± 0.09% 55% ± 0.09%
63% 70% ± 0.11% 70% ± 0.11% 70% ± 0.11% 70% ± 0.11%
75% 84% ± 0.11% 84% ± 0.11% 84% ± 0.11% 84% ± 0.11%
88% 95% ± 0.06% 95% ± 0.06% 95% ± 0.06% 93% ± 0.06%
100% 98% ± 0.03% 97% ± 0.03% 97% ± 0.03% 95% ± 0.03%
Table 22: Simulated Utilization for Case Duration Type 2
Utilization Case Type 2
Scheduled Utilization 50% 1st Delay 1 50% 1st Delay 2 90% 1st Delay 1 90% 1st Delay 2
50% 54% ± 0.23% 54% ± 0.23% 54% ± 0.23% 54% ± 0.23%
63% 67% ± 0.22% 67% ± 0.22% 67% ± 0.22% 67% ± 0.22%
75% 79% ± 0.20% 79% ± 0.20% 79% ± 0.20% 78% ± 0.20%
88% 89% ± 0.15% 88% ± 0.15% 88% ± 0.15% 87% ± 0.15%
100% 95% ± 0.09% 94% ± 0.09% 94% ± 0.09% 93% ± 0.09%

111
Table 23: Simulated Utilization for Case Duration Type 3
Utilization Case Type 3
Scheduled Utilization 50% 1st Delay 1 50% 1st Delay 2 90% 1st Delay 1 90% 1st Delay 2
50% 49% ± 0.13% 49% ± 0.3% 49% ± 0.3% 49% ± 0.13%
75% 74% ± 0.15% 74% ± 0.15% 74% ± 0.15% 74% ± 0.15%
100% 94% ± 0.13% 93% ± 0.13% 94% ± 0.13% 92% ± 0.13%
125% 97% ± 0.05% 96% ± 0.05% 96% ± 0.05% 94% ± 0.05%
Table 24: Simulated Utilization for Case Duration Type 4
Utilization Case Type 4
Scheduled Utilization 50% 1st Delay 1 50% 1st Delay 2 90% 1st Delay 1 90% 1st Delay 2
50% 46% ± 0.28% 46% ± 0.28% 46% ± 0.28% 46% ± 0.28%
75% 68% ± 0.26% 68% ± 0.26% 68% ± 0.26% 67% ± 0.26%
100% 84% ± 0.18% 84% ± 0.18% 84% ± 0.18% 83% ± 0.18%
125% 89% ± 0.13% 88% ± 0.13% 89% ± 0.13% 87% ± 0.13%
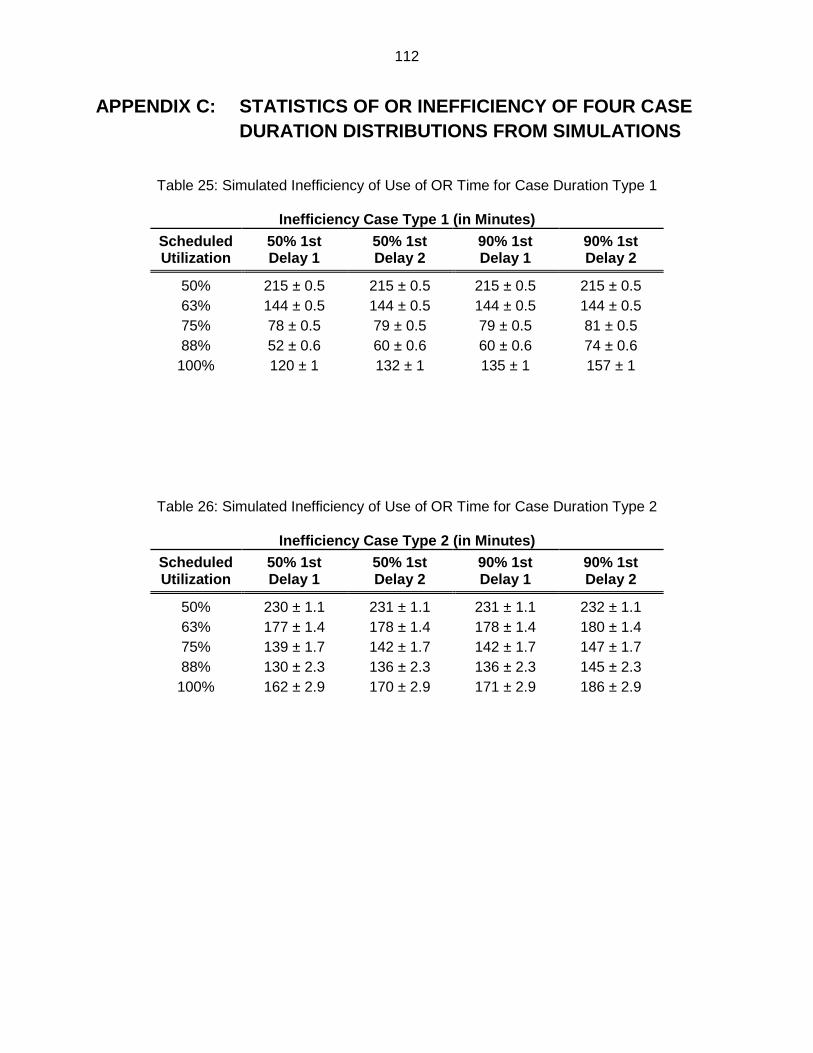
112
APPENDIX C: STATISTICS OF OR INEFFICIENCY OF FOUR C ASE DURATION DISTRIBUTIONS FROM SIMULATIONS
Table 25: Simulated Inefficiency of Use of OR Time for Case Duration Type 1
Inefficiency Case Type 1 (in Minutes)
Scheduled Utilization
50% 1st Delay 1
50% 1st Delay 2
90% 1st Delay 1
90% 1st Delay 2
50% 215 ± 0.5 215 ± 0.5 215 ± 0.5 215 ± 0.5 63% 144 ± 0.5 144 ± 0.5 144 ± 0.5 144 ± 0.5 75% 78 ± 0.5 79 ± 0.5 79 ± 0.5 81 ± 0.5 88% 52 ± 0.6 60 ± 0.6 60 ± 0.6 74 ± 0.6
100% 120 ± 1 132 ± 1 135 ± 1 157 ± 1
Table 26: Simulated Inefficiency of Use of OR Time for Case Duration Type 2
Inefficiency Case Type 2 (in Minutes) Scheduled Utilization
50% 1st Delay 1
50% 1st Delay 2
90% 1st Delay 1
90% 1st Delay 2
50% 230 ± 1.1 231 ± 1.1 231 ± 1.1 232 ± 1.1 63% 177 ± 1.4 178 ± 1.4 178 ± 1.4 180 ± 1.4 75% 139 ± 1.7 142 ± 1.7 142 ± 1.7 147 ± 1.7 88% 130 ± 2.3 136 ± 2.3 136 ± 2.3 145 ± 2.3
100% 162 ± 2.9 170 ± 2.9 171 ± 2.9 186 ± 2.9

113
Table 27: Simulated Inefficiency of Use of OR Time for Case Duration Type 3
Inefficiency Case Type 3 (in Minutes)
Scheduled Utilization
50% 1st Delay 1
50% 1st Delay 2
90% 1st Delay 1
90% 1st Delay 2
50% 246 ± 0.6 246 ± 0.6 246 ± 0.6 246 ± 0.6 75% 125 ± 0.7 126 ± 0.7 126 ± 0.7 128 ± 0.7
100% 74 ± 0.6 86 ± 0.6 82 ± 0.6 104 ± 0.6 125% 228 ± 1.4 244 ± 1.4 240 ± 1.4 269 ± 1.4
Table 28: Simulated Inefficiency of Use of OR Time for Case Duration Type 4
Inefficiency Case Type 4 (in Minutes) Scheduled Utilization
50% 1st Delay 1
50% 1st Delay 2
90% 1st Delay 1
90% 1st Delay 2
50% 274 ± 1.6 275 ± 1.6 275 ± 1.6 277 ± 1.6 75% 203 ± 2.3 206 ± 2.3 205 ± 2.3 210 ± 2.3
100% 189 ± 3.3 195 ± 3.3 192 ± 3.3 203 ± 3.3 125% 323 ± 4.4 330 ± 4.4 327 ± 4.4 341 ± 4.4

114
APPENDIX D: STATISTICS OF MEAN PATIENT WAIT TIME OF FOUR CASE DURATION DISTRIBUTIONS FROM SIMULATIONS
C
ase
Ave
rage W
ait
Tim
e (
Min
ute
s)
- C
ase
Typ
e 2
Dela
ys
Ca
se 2
C
ase
3
Case
4
Case
5
Case
6
Case
7
Case
8
50
% D
ela
y 1
17 ±
0.6
9
27 ±
0.9
5
38 ±
1.1
8
49 ±
1.3
3
61 ±
1.5
5
72
± 1
.71
8
5 ±
1.8
9
50
% D
ela
y 2
5 ±
0.6
4
32 ±
0.9
3
43 ±
1.2
0
54 ±
1.3
5
66 ±
1.5
7
76
± 1
.72
8
9 ±
1.9
0
90
% D
ela
y 1
24 ±
0.7
1
33 ±
0.9
7
44 ±
1.2
0
54 ±
1.3
5
66 ±
1.5
7
77
± 1
.73
8
9 ±
1.9
0
90
% D
ela
y 2
1 ±
0.6
2
42 ±
0.9
8
53 ±
1.2
2
62 ±
1.3
7
74 ±
1.5
9
85
± 1
.75
9
7 ±
1.9
3
C
ase
Ave
rage
Wai
t Tim
e (M
inut
es)
- C
ase
Typ
e 1
Del
ays
C
ase
2
Cas
e 3
C
ase
4
Cas
e 5
C
ase
6
Cas
e 7
C
ase
8
50%
De
lay
1 1
8 ±
0.24
28
± 0
.33
38
± 0
.41
48
± 0
.46
5
9 ±
0.5
2
69 ±
0.5
7 7
9 ±
0.6
2
50%
De
lay
2 5
± 0.
25
33
± 0
.36
43
± 0
.43
53
± 0
.48
6
3 ±
0.5
4
74 ±
0.5
9
84
± 0.
63
9
0% D
ela
y 1
24
± 0.
25
34 ±
0.3
3
44 ±
0.4
1
54 ±
0.4
6
65
± 0
.52
75
± 0
.57
8
5 ±
0.6
2
90%
De
lay
2 1
± 0.
27
43
± 0
.35
53
± 0
.42
63
± 0
.47
7
4 ±
0.5
3
84 ±
0.5
8
94
± 0
.62
Tab
le 3
0: C
ase
Ave
rage
Wai
t Tim
e fo
r C
ase
Dur
atio
n T
ype
21
Tab
le 2
9: C
ase
Ave
rage
Wai
t Tim
e fo
r C
ase
Dur
atio
n T
ype
2

115
C
ase
Ave
rage
Wai
t Tim
e (M
inut
es)
- C
ase
Typ
e 3
Del
ays
C
ase
2
Cas
e 3
C
ase
4
Cas
e 5
50%
Del
ay 1
13
± 0
.39
19
± 0
.52
26
± 0
.65
33
± 0
.72
50
% D
elay
2
20 ±
0.4
3
26 ±
0.5
7
32 ±
0.6
9
39 ±
0.7
6
90%
Del
ay 1
19
± 0
.41
24
± 0
.55
31
± 0
.67
37
± 0
.74
90
% D
elay
2
32 ±
0.4
7
37 ±
0.6
1
43 ±
0.7
3
49 ±
0.7
3
C
ase
Ave
rage
Wai
t Tim
e (M
inut
es)
- C
ase
Typ
e 4
Del
ays
C
ase
2
Cas
e 3
C
ase
4
Cas
e 5
50
% D
ela
y 1
1
6 ±
1.3
1
33
± 1
.76
5
3 ±
2.1
8
69
± 2
.45
5
0%
De
lay
2
23
± 1
.34
3
8 ±
1.7
9
56
± 2
.20
7
2 ±
2.4
7
90
% D
ela
y 1
2
0 ±
1.3
4
36
± 1
.78
5
5 ±
2.1
9
70
± 2
.46
9
0%
De
lay
2
32
± 1
.38
4
5 ±
1.8
2
61
± 2
.24
7
6 ±
2.5
1
Tab
le 3
2: C
ase
Ave
rage
Wai
t Tim
e fo
r C
ase
Dur
atio
n T
ype
4
Tab
le 3
1: C
ase
Ave
rage
Wai
t Tim
e fo
r C
ase
Dur
atio
n T
ype
3

116
APPENDIX E: POM-OR PERFORMANCE FOR EACH SIMULATION RUN ON OVER-UTILIZED OR TIME
Table 33: Mean Over-utilized OR Time from Simulation
Mean Over-utilized OR Time
OR 1 OR2 OR3 OR 1 OR2 OR3
Baseline 24.1 ± 0.4 58.4 ± 0.17 30.6 ± 0.2 15 21.6 ± 2.1 55.7 ± 1.3 27.6 ± 1.3
1 22.1 ± 2.1 56.2 ± 1.4 28.0 ± 1.2 16 22.5 ± 2.2 55.3 ± 1.3 27.3 ± 1.3
2 22.0 ± 1.9 57.8 ± 1.4 28.8 ± 1.2 17 22.2 ± 2.2 54.9 ± 1.3 27.2 ± 1.3
3 22.1 ± 1.9 57.7 ± 1.3 28.7 ± 1.2 18 22.2 ± 2.3 54.5 ± 1.3 27.3 ± 1.3
4 22.5 ± 2.0 58.0 ± 1.3 28.8 ± 1.2 19 21.3 ± 2.0 54.4 ± 1.3 27.0 ± 1.3
5 22.4 ± 1.9 58.0 ± 1.4 28.8 ± 1.2 20 21.7 ± 2.1 54.5 ± 1.3 26.9 ± 1.3
6 22.1 ± 1.9 57.7 ± 1.4 28.5 ± 1.2 21 21.3 ± 2.1 54.4 ± 1.3 26.6 ± 1.3
7 22.4 ± 1.9 57.5 ± 1.3 28.7 ± 1.3 22 21.8 ± 2.1 54.1 ± 1.3 27.0 ± 1.3
8 21.9 ± 1.9 57.0 ± 1.3 28.8 ± 1.3 23 21.7 ± 2.1 54.0 ± 1.3 27.1 ± 1.3
9 22.0 ± 1.9 56.6 ± 1.3 28.5 ± 1.3 24 22.0 ± 2.2 53.7 ± 1.3 27.0 ± 1.4
10 21.5 ± 2.0 56.3 ± 1.3 28.4 ± 1.3 25 22.0 ± 2.2 53.5 ± 1.4 27.1 ± 1.4
11 22.1 ± 2.1 56.2 ± 1.3 28.0 ± 1.3 26 22.0 ± 2.2 53.6 ± 1.4 27.1 ± 1.4
12 21.9 ± 2.1 55.9 ± 1.3 27.2 ± 1.3 27 22.0 ± 2.2 53.8 ± 1.4 26.8 ± 1.4
13 21.7 ± 2.1 55.6 ± 1.3 27.8 ± 1.3 Ideal 22.0 ± 2.3 50.2 ± 1.4 24.6 ± 1.3
14 20.8 ± 2.0 55.7 ± 1.3 27.4 ± 1.3
50% Variance Baseline
N/A 36.7 ± 0.8 15.8 ± 0.8 50%
Variance Ideal
N/A 26.5 ± 0.8 10.7 ± 1.2
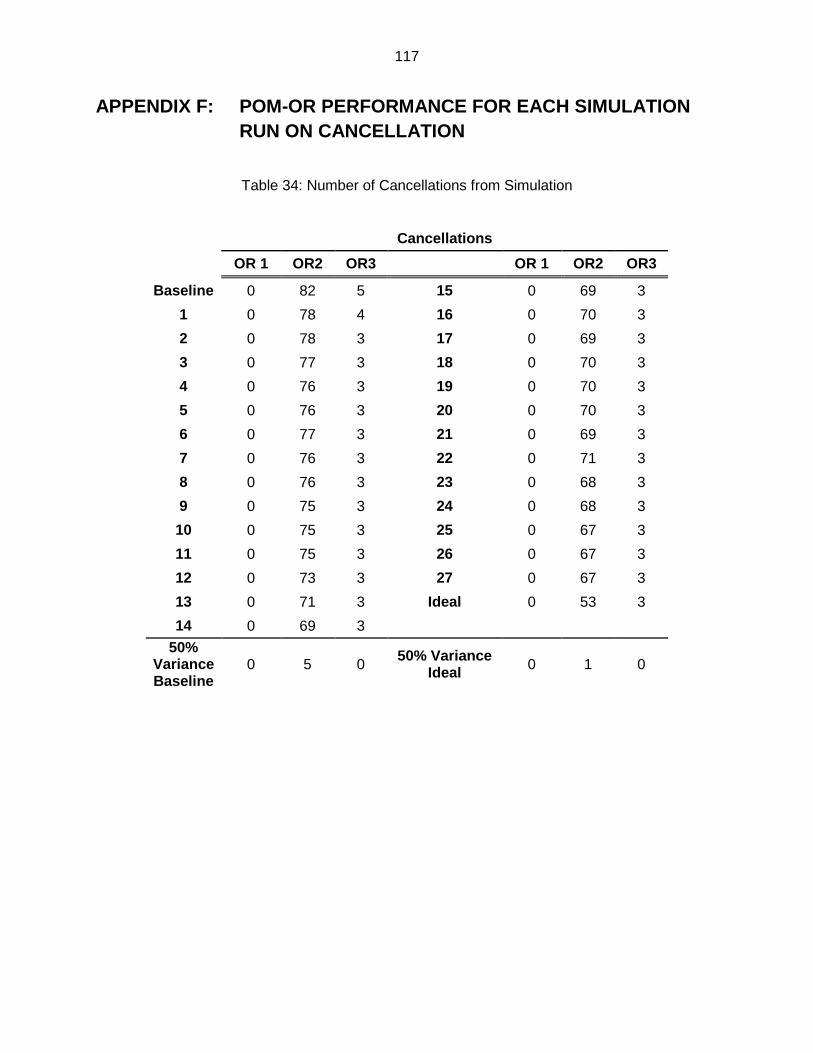
117
APPENDIX F: POM-OR PERFORMANCE FOR EACH SIMULATION RUN ON CANCELLATION
Table 34: Number of Cancellations from Simulation
Cancellations
OR 1 OR2 OR3 OR 1 OR2 OR3
Baseline 0 82 5 15 0 69 3
1 0 78 4 16 0 70 3
2 0 78 3 17 0 69 3
3 0 77 3 18 0 70 3
4 0 76 3 19 0 70 3
5 0 76 3 20 0 70 3
6 0 77 3 21 0 69 3
7 0 76 3 22 0 71 3
8 0 76 3 23 0 68 3
9 0 75 3 24 0 68 3
10 0 75 3 25 0 67 3
11 0 75 3 26 0 67 3
12 0 73 3 27 0 67 3
13 0 71 3 Ideal 0 53 3
14 0 69 3
50% Variance Baseline
0 5 0 50% Variance
Ideal 0 1 0

118
APPENDIX G: SEQUENCE OF TARDINESS ELIMINATION FROM POM-OR
Table 35: Ranks of Delay Reasons for Baseline Model and POM-ORS for OR1
Baseline POM-ORS Case
ID Delay Description Case ID Delay Description
1 SURGEON LATE 1 SURGEON LATE
2 SURGEON LATE 1 ANESTHESIA SET UP
1 INCORRECT OR NO CONSENT 1 INCORRECT OR NO
CONSENT 1 ANESTHESIA SET UP 2 SURGEON LATE
2 ANESTHESIA SET UP 2 ANESTHESIA SET UP
2 PRE-OP LAB WORK 1 PRE-OP LAB WORK
1 PRE-OP LAB WORK 2 INCORRECT OR NO CONSENT
3 INCORRECT OR NO CONSENT 3 INCORRECT OR NO
CONSENT 3 PRE-OP LAB WORK 3 PRE-OP LAB WORK
3 ANESTHESIA SET UP 2 PRE-OP LAB WORK
2 INCORRECT OR NO CONSENT 3 ANESTHESIA SET UP
1 ROOM/EQUIPMENT SET UP 3 SURGEON LATE
2 ROOM/EQUIPMENT SET UP 1 ROOM/EQUIPMENT SET UP
1 OR STAFF NOT AVAILABLE 1 OR STAFF NOT AVAILABLE
3 SURGEON LATE 1 OTHER DEPARTMENT DELAY
3 ROOM/EQUIPMENT SET UP 2 ROOM/EQUIPMENT SET UP
1 OTHER DEPARTMENT DELAY 2 OR STAFF NOT AVAILABLE
2 OR STAFF NOT AVAILABLE 1 ANESTHESIA PRE-EVAL/RECHECK
1 EQUIPMENT NOT AVAILABLE 1 EQUIPMENT NOT AVAILABLE
3 OTHER DEPARTMENT DELAY 2 EQUIPMENT NOT AVAILABLE
1 ANESTHESIA PRE-EVAL/RECHECK 2 ANESTHESIA PRE-
EVAL/RECHECK
3 ANESTHESIA PRE-EVAL/RECHECK 2 OTHER DEPARTMENT DELAY
3 OR STAFF NOT AVAILABLE 3 ROOM/EQUIPMENT SET UP
2 ANESTHESIA PRE-EVAL/RECHECK 3 OR STAFF NOT AVAILABLE
2 EQUIPMENT NOT AVAILABLE 3 OTHER DEPARTMENT DELAY

119
2 OTHER DEPARTMENT DELAY 3 EQUIPMENT NOT AVAILABLE
3 EQUIPMENT NOT AVAILABLE 3 ANESTHESIA PRE-EVAL/RECHECK
Table 36: Ranks of Delay Reasons for Baseline Model and POM-ORS for OR2
Baseline POM-ORS Case
ID Delay Description Case ID Delay Description
4 SURGEON LATE 4 SURGEON LATE 4 ANESTHESIA SET UP 4 ANESTHESIA SET UP
4 PRE-OP LAB WORK 5 INCORRECT OR NO CONSENT
5 INCORRECT OR NO CONSENT 5 ANESTHESIA SET UP
5 ANESTHESIA SET UP 6 ANESTHESIA SET UP
4 INCORRECT OR NO CONSENT 6 PRE-OP LAB WORK
6 ANESTHESIA SET UP 6 SURGEON LATE 7 PRE-OP LAB WORK 5 PRE-OP LAB WORK 6 SURGEON LATE 4 PRE-OP LAB WORK 7 ANESTHESIA SET UP 9 PRE-OP LAB WORK
10 PRE-OP LAB WORK 4 INCORRECT OR NO CONSENT
7 SURGEON LATE 7 ANESTHESIA SET UP 9 PRE-OP LAB WORK 7 SURGEON LATE 9 ANESTHESIA SET UP 8 SURGEON LATE 10 SURGEON LATE 9 ANESTHESIA SET UP
5 SURGEON LATE 6 INCORRECT OR NO CONSENT
5 PRE-OP LAB WORK 9 SURGEON LATE 9 SURGEON LATE 7 PRE-OP LAB WORK
8 SURGEON LATE 8 INCORRECT OR NO CONSENT
9 INCORRECT OR NO CONSENT 9 INCORRECT OR NO
CONSENT
6 PRE-OP LAB WORK 7 INCORRECT OR NO CONSENT
6 OR STAFF NOT AVAILABLE 5 SURGEON LATE
6 INCORRECT OR NO CONSENT 8 ANESTHESIA SET UP
8 ANESTHESIA SET UP 10 PRE-OP LAB WORK
8 INCORRECT OR NO CONSENT 8 PRE-OP LAB WORK
7 INCORRECT OR NO CONSENT 10 SURGEON LATE

120
5 ROOM/EQUIPMENT SET UP 10 ANESTHESIA SET UP
Table 37: Ranks of Delay Reasons for Baseline Model and POM-ORS for OR3
Baseline POM-ORS Case
ID Delay Description Case ID Delay Description
11 ANESTHESIA SET UP 11 ANESTHESIA SET UP
11 SURGEON LATE 11 SURGEON LATE
13 SURGEON LATE 13 SURGEON LATE
11 INCORRECT OR NO CONSENT 12 ANESTHESIA SET UP
12 ANESTHESIA SET UP 13 ANESTHESIA SET UP
11 PRE-OP LAB WORK 12 INCORRECT OR NO CONSENT
12 SURGEON LATE 12 SURGEON LATE
12 PRE-OP LAB WORK 13 INCORRECT OR NO CONSENT
13 ANESTHESIA SET UP 11 INCORRECT OR NO CONSENT
12 INCORRECT OR NO CONSENT 11 PRE-OP LAB WORK
13 PRE-OP LAB WORK 12 PRE-OP LAB WORK
13 INCORRECT OR NO CONSENT 13 PRE-OP LAB WORK
11 ROOM/EQUIPMENT SET UP 11 OR STAFF NOT AVAILABLE
11 EQUIPMENT NOT AVAILABLE 12 OR STAFF NOT AVAILABLE
11 OR STAFF NOT AVAILABLE 13 OR STAFF NOT AVAILABLE
11 OTHER DEPARTMENT DELAY 13 OTHER DEPARTMENT DELAY
12 OR STAFF NOT AVAILABLE 11 ROOM/EQUIPMENT SET UP
13 ROOM/EQUIPMENT SET UP 13 ROOM/EQUIPMENT SET UP
13 ANESTHESIA PRE-EVAL/RECHECK 12 ROOM/EQUIPMENT SET UP
12 ROOM/EQUIPMENT SET UP 11 ANESTHESIA PRE-EVAL/RECHECK
12 OTHER DEPARTMENT DELAY 11 EQUIPMENT NOT AVAILABLE
12 ANESTHESIA PRE-EVAL/RECHECK 13 ANESTHESIA PRE-
EVAL/RECHECK
11 ANESTHESIA PRE-EVAL/RECHECK 12 EQUIPMENT NOT AVAILABLE
12 EQUIPMENT NOT AVAILABLE 13 EQUIPMENT NOT AVAILABLE
13 OR STAFF NOT AVAILABLE 12 OTHER DEPARTMENT DELAY
13 EQUIPMENT NOT AVAILABLE 12 ANESTHESIA PRE-EVAL/RECHECK
13 OTHER DEPARTMENT DELAY 11 OTHER DEPARTMENT DELAY

121
APPENDIX H: PERCENTILE VALUES OF THE DISTRIBUTION O F THE DURATION OF SURGERY LISTS WITH 10 HISTORICAL CASES
Table 38: Percentile Values of the Distribution of the Duration of Surgery Lists from Type IV Pearson Distribution
Date OR 10% 20% 30% 40% 50% 60% 70% 80% 90% Actual Duration
1/3/2011 OR04 362 372 381 390 399 409 421 437 464 391
1/3/2011 OR07 296 316 330 344 356 370 385 403 431 380
1/4/2011 OR01 312 340 361 381 401 422 447 479 530 403
1/4/2011 OR03 381 401 417 430 444 458 473 492 521 395
1/4/2011 OR08 255 270 281 292 302 312 324 339 361 335
1/5/2011 OR03 164 178 189 200 210 221 234 249 274 163
1/5/2011 OR08 231 243 252 261 269 277 286 298 315 318
1/6/2011 OR03 268 305 335 362 391 421 457 503 577 337
1/7/2011 OR02 176 192 204 215 226 238 252 269 297 370
1/7/2011 OR03 341 358 370 381 392 404 418 434 460 455
1/7/2011 OR07 199 217 231 244 257 270 286 305 335 300
1/10/2011 OR02 207 220 230 239 248 257 268 281 301 339
1/10/2011 OR04 365 375 384 392 401 411 423 439 466 385
1/11/2011 OR01 445 464 478 491 503 515 529 546 571 450
1/11/2011 OR08 251 264 274 283 292 300 310 322 340 290
1/12/2011 OR04 222 244 262 278 295 313 333 359 400 319
1/12/2011 OR07 193 209 222 233 245 257 271 289 317 200
1/13/2011 OR07 175 191 204 216 228 240 255 273 302 234
1/14/2011 OR04 162 180 195 208 222 236 253 275 308 227
1/14/2011 OR07 459 485 505 523 541 560 581 608 648 417
1/18/2011 OR08 216 224 231 237 242 248 255 262 273 240
1/19/2011 OR03 248 264 277 288 300 311 325 341 366 427
1/20/2011 OR04 356 378 394 408 422 437 455 476 510 360

122
Date OR 10% 20% 30% 40% 50% 60% 70% 80% 90% Actual Duration
1/21/2011 OR01 318 339 355 370 384 399 417 438 471 345
1/21/2011 OR02 162 178 190 201 212 223 237 255 282 342
1/21/2011 OR03 208 224 237 249 260 272 286 303 329 181
1/24/2011 OR02 501 530 552 571 590 610 632 659 698 615
1/24/2011 OR04 346 363 375 387 398 411 425 443 473 373
1/25/2011 OR01 448 495 532 566 600 636 678 730 810 560
1/25/2011 OR03 289 309 324 338 352 366 382 402 433 272
1/25/2011 OR04 414 444 467 488 509 531 556 589 640 407
1/25/2011 OR08 334 345 354 361 368 375 383 392 406 357
1/26/2011 OR01 69 82 94 105 116 129 145 166 201 55
1/26/2011 OR07 219 235 248 259 270 282 295 313 340 335
1/27/2011 OR04 325 353 375 395 415 436 459 489 535 442
1/28/2011 OR01 408 434 454 471 488 506 527 552 589 350
1/28/2011 OR02 179 194 207 218 229 240 254 271 299 207
1/28/2011 OR03 191 211 226 240 254 269 286 308 340 199
1/28/2011 OR07 242 259 272 284 296 308 323 342 371 250
1/31/2011 OR04 259 276 289 301 314 327 343 363 396 285
1/31/2011 OR07 220 237 250 262 274 286 300 317 344 245
2/1/2011 OR08 388 405 418 429 440 452 465 480 503 378
2/3/2011 OR04 302 332 356 377 399 421 447 479 528 447
2/4/2011 OR03 470 513 547 579 610 643 682 730 806 444
2/4/2011 OR07 166 179 189 199 208 219 230 246 271 174
2/4/2011 OR08 315 341 362 381 400 420 443 471 515 288
2/7/2011 OR07 265 279 290 300 309 319 329 343 363 330
2/8/2011 OR03 242 261 275 289 302 316 332 352 384 373
2/8/2011 OR04 376 384 391 397 403 410 418 428 445 450
2/8/2011 OR08 325 338 348 357 365 374 384 396 413 293
2/9/2011 OR03 297 316 330 344 357 370 386 405 434 393

123
Date OR 10% 20% 30% 40% 50% 60% 70% 80% 90% Actual Duration
2/9/2011 OR04 220 242 258 274 290 306 326 351 390 280
2/9/2011 OR07 156 169 179 189 198 207 219 233 255 280
2/10/2011 OR03 319 359 391 422 454 489 531 586 676 467
2/11/2011 OR07 319 344 363 380 398 417 439 466 508 328
2/11/2011 OR08 263 280 294 305 317 329 342 359 383 277
2/14/2011 OR02 363 380 392 404 415 426 439 455 478 390
2/14/2011 OR03 350 379 402 424 446 471 500 538 600 378
2/14/2011 OR04 336 353 366 377 389 401 416 434 464 447
2/15/2011 OR08 243 259 272 283 293 305 318 334 358 217
2/16/2011 OR02 236 250 260 269 278 288 299 312 334 277
2/16/2011 OR03 170 184 194 203 212 221 232 246 266 264
2/16/2011 OR04 214 241 262 281 301 322 346 378 428 337
2/16/2011 OR08 320 339 353 366 378 391 406 425 454 369
2/17/2011 OR03 250 269 284 298 311 325 341 361 391 277
2/17/2011 OR04 418 450 475 498 521 545 574 610 666 485
2/18/2011 OR04 259 282 300 317 335 354 376 405 452 355
2/18/2011 OR07 287 308 325 340 354 370 387 409 442 421
2/18/2011 OR08 277 294 307 319 331 344 359 378 408 208
2/22/2011 OR06 219 238 252 266 279 293 310 331 363 265
2/22/2011 OR08 245 255 262 268 274 281 288 296 308 258
2/23/2011 OR03 231 249 263 275 287 299 313 331 356 380
2/23/2011 OR07 186 202 215 227 239 251 265 283 309 251
2/23/2011 OR08 109 116 122 126 131 136 142 149 159 126
2/24/2011 OR03 382 416 444 470 496 526 560 606 680 441
2/24/2011 OR04 158 171 182 192 203 214 228 245 274 317
2/28/2011 OR04 344 355 365 374 383 393 406 422 449 405
3/1/2011 OR03 289 313 330 347 363 379 399 422 458 355
3/1/2011 OR04 206 221 233 243 254 266 279 297 326 225

124
Date OR 10% 20% 30% 40% 50% 60% 70% 80% 90% Actual Duration
3/2/2011 OR02 75 85 94 102 110 119 130 144 167 200
3/2/2011 OR04 244 262 276 290 305 321 340 365 408 286
3/2/2011 OR08 189 204 217 228 239 251 264 282 309 200
3/3/2011 OR02 452 470 484 496 509 521 536 553 579 495
3/4/2011 OR03 233 249 261 272 283 295 309 326 354 267
3/4/2011 OR08 336 355 370 384 397 411 427 448 480 271
3/7/2011 OR04 336 352 365 377 389 401 416 435 465 423
3/7/2011 OR07 176 190 200 210 220 230 241 255 276 230
3/8/2011 OR03 166 182 194 205 216 227 241 257 283 258
3/8/2011 OR04 303 327 346 363 380 398 418 444 485 385
3/8/2011 OR08 379 398 412 425 438 451 465 482 508 349
3/9/2011 OR04 259 284 303 321 339 358 379 407 449 465
3/9/2011 OR08 173 181 187 193 199 204 211 219 230 200
3/10/2011 OR01 255 281 301 320 339 360 383 412 458 240
3/10/2011 OR04 202 224 242 258 274 291 310 335 374 287
3/10/2011 OR07 234 253 267 280 293 306 321 340 367 415
3/11/2011 OR03 221 239 252 265 277 290 304 322 349 256
3/11/2011 OR04 223 244 260 275 289 304 322 344 377 213
3/11/2011 OR07 156 171 183 193 204 216 229 246 273 245
3/11/2011 OR08 176 191 203 214 225 237 251 269 299 219
3/14/2011 OR04 203 220 232 244 256 268 283 302 332 440
3/15/2011 OR08 328 347 362 375 388 401 416 434 461 305
3/16/2011 OR04 167 177 186 193 201 209 218 229 248 248
3/16/2011 OR08 250 267 281 293 305 317 332 350 378 343
3/17/2011 OR01 254 277 296 312 329 346 366 391 429 450
3/17/2011 OR03 222 239 252 264 275 287 301 317 342 279
3/17/2011 OR04 360 380 395 409 422 437 453 475 508 443
3/18/2011 OR04 206 223 237 250 263 277 293 313 344 270
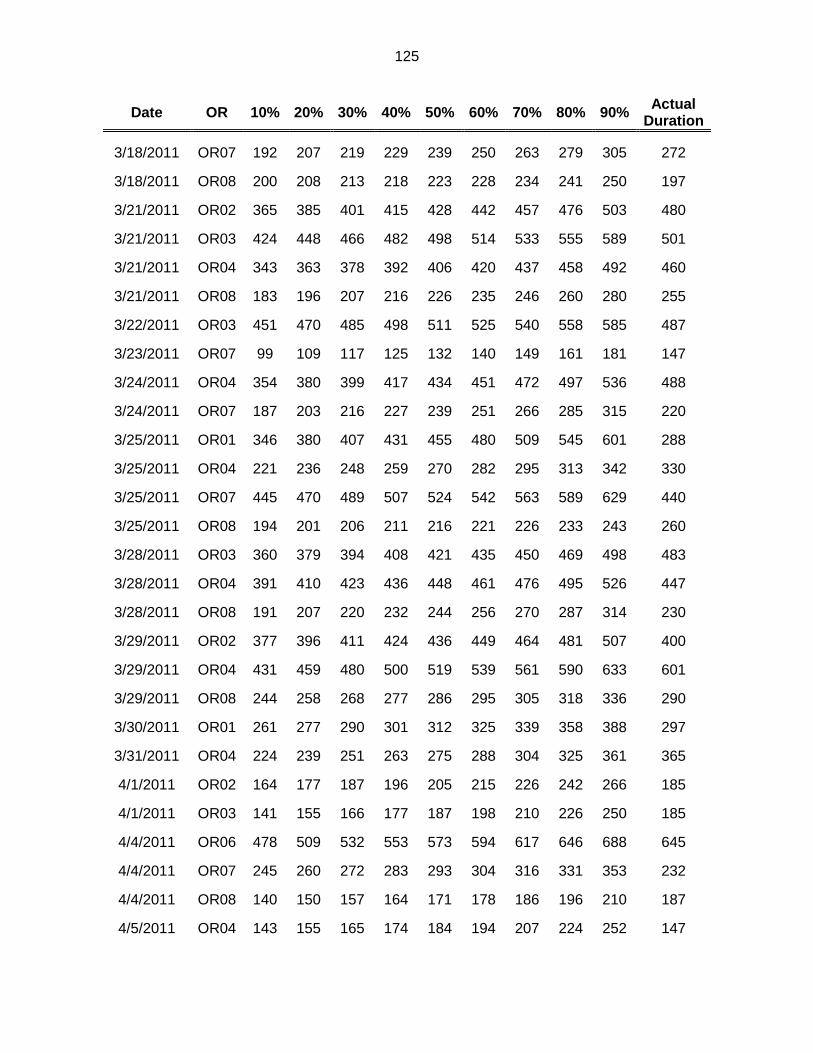
125
Date OR 10% 20% 30% 40% 50% 60% 70% 80% 90% Actual Duration
3/18/2011 OR07 192 207 219 229 239 250 263 279 305 272
3/18/2011 OR08 200 208 213 218 223 228 234 241 250 197
3/21/2011 OR02 365 385 401 415 428 442 457 476 503 480
3/21/2011 OR03 424 448 466 482 498 514 533 555 589 501
3/21/2011 OR04 343 363 378 392 406 420 437 458 492 460
3/21/2011 OR08 183 196 207 216 226 235 246 260 280 255
3/22/2011 OR03 451 470 485 498 511 525 540 558 585 487
3/23/2011 OR07 99 109 117 125 132 140 149 161 181 147
3/24/2011 OR04 354 380 399 417 434 451 472 497 536 488
3/24/2011 OR07 187 203 216 227 239 251 266 285 315 220
3/25/2011 OR01 346 380 407 431 455 480 509 545 601 288
3/25/2011 OR04 221 236 248 259 270 282 295 313 342 330
3/25/2011 OR07 445 470 489 507 524 542 563 589 629 440
3/25/2011 OR08 194 201 206 211 216 221 226 233 243 260
3/28/2011 OR03 360 379 394 408 421 435 450 469 498 483
3/28/2011 OR04 391 410 423 436 448 461 476 495 526 447
3/28/2011 OR08 191 207 220 232 244 256 270 287 314 230
3/29/2011 OR02 377 396 411 424 436 449 464 481 507 400
3/29/2011 OR04 431 459 480 500 519 539 561 590 633 601
3/29/2011 OR08 244 258 268 277 286 295 305 318 336 290
3/30/2011 OR01 261 277 290 301 312 325 339 358 388 297
3/31/2011 OR04 224 239 251 263 275 288 304 325 361 365
4/1/2011 OR02 164 177 187 196 205 215 226 242 266 185
4/1/2011 OR03 141 155 166 177 187 198 210 226 250 185
4/4/2011 OR06 478 509 532 553 573 594 617 646 688 645
4/4/2011 OR07 245 260 272 283 293 304 316 331 353 232
4/4/2011 OR08 140 150 157 164 171 178 186 196 210 187
4/5/2011 OR04 143 155 165 174 184 194 207 224 252 147

126
Date OR 10% 20% 30% 40% 50% 60% 70% 80% 90% Actual Duration
4/6/2011 OR06 189 208 222 236 250 264 281 302 335 190
4/7/2011 OR01 338 366 388 409 430 454 482 519 579 537
4/7/2011 OR02 387 404 416 427 438 449 461 476 498 450
4/7/2011 OR03 440 459 473 486 498 511 526 544 570 626
4/7/2011 OR04 369 395 415 432 449 468 488 514 553 460
4/7/2011 OR07 375 405 429 450 472 495 521 554 605 410
4/8/2011 OR04 180 204 223 240 258 277 300 328 373 250
4/11/2011 OR04 516 550 576 600 623 648 676 711 764 510
4/11/2011 OR07 261 278 291 303 314 326 340 358 386 427
4/11/2011 OR08 156 167 175 182 190 197 206 216 231 217
4/13/2011 OR01 457 482 500 517 533 549 568 592 628 429
4/13/2011 OR04 411 437 458 478 497 518 542 574 624 392
4/14/2011 OR04 615 637 654 669 685 701 721 745 783 632
4/14/2011 OR07 213 239 259 277 296 315 338 368 413 284
4/15/2011 OR07 327 346 361 375 388 403 420 441 474 328
4/15/2011 OR08 191 203 213 221 229 238 247 259 276 196
4/18/2011 OR02 602 624 640 655 669 683 699 718 745 685
4/18/2011 OR03 292 316 335 352 369 387 408 435 476 341
4/18/2011 OR04 341 356 368 379 389 401 415 432 461 495
4/19/2011 OR06 149 161 170 178 186 194 204 216 234 150
4/20/2011 OR04 286 310 328 344 361 378 398 423 462 310
4/20/2011 OR06 177 193 206 218 230 243 257 276 304 160
4/20/2011 OR07 118 129 137 145 153 161 170 183 203 165
4/20/2011 OR08 120 127 131 135 139 143 148 153 162 170
4/21/2011 OR04 628 655 676 694 712 730 752 779 821 583
4/22/2011 OR03 265 281 293 303 313 324 336 351 373 324
4/22/2011 OR04 272 293 310 326 341 358 377 401 437 380
4/22/2011 OR07 357 382 400 417 434 452 472 497 536 274

127
Date OR 10% 20% 30% 40% 50% 60% 70% 80% 90% Actual Duration
4/22/2011 OR08 245 259 270 279 288 298 308 321 340 365
4/25/2011 OR03 572 599 622 644 669 696 731 778 860 675
4/26/2011 OR01 358 380 397 412 427 443 461 484 519 462
4/26/2011 OR02 268 283 295 305 315 326 337 352 374 260
4/26/2011 OR08 200 208 214 220 225 231 237 244 255 194
4/27/2011 OR01 529 561 586 608 630 653 679 712 762 482
4/27/2011 OR04 374 394 409 422 435 449 465 486 518 385
4/28/2011 OR01 124 136 145 154 163 172 183 197 220 262
4/29/2011 OR01 177 194 206 217 229 241 255 272 300 190
4/29/2011 OR07 324 346 363 379 394 411 430 454 491 340
4/29/2011 OR08 335 357 374 390 405 422 440 463 499 340
5/2/2011 OR01 534 583 621 656 690 727 770 823 905 670
5/2/2011 OR03 426 457 484 509 536 567 604 655 740 608
5/2/2011 OR04 390 408 422 434 447 460 475 494 524 398
5/2/2011 OR08 147 157 165 173 180 189 198 211 230 195
5/3/2011 OR08 284 299 310 320 330 340 352 366 386 278
5/4/2011 OR04 347 366 380 392 405 418 434 453 485 272
5/4/2011 OR08 202 214 222 230 238 246 254 265 281 217
5/5/2011 OR04 479 502 520 536 553 571 592 619 664 486
5/5/2011 OR07 260 291 317 341 365 392 424 465 530 285
5/6/2011 OR03 152 167 179 190 200 212 225 242 269 163
5/6/2011 OR04 282 308 329 347 366 386 409 438 482 335
5/6/2011 OR07 245 265 280 294 308 322 339 361 394 270
5/6/2011 OR08 272 288 301 312 322 333 346 361 383 330
5/9/2011 OR01 285 304 319 333 346 359 375 395 425 370
5/9/2011 OR03 375 396 412 426 440 455 471 491 520 354
5/9/2011 OR07 169 182 193 203 213 224 236 251 275 220
5/10/2011 OR08 531 547 558 568 578 588 598 611 629 420

128
Date OR 10% 20% 30% 40% 50% 60% 70% 80% 90% Actual Duration
5/11/2011 OR02 270 293 311 327 343 360 380 404 442 233
5/11/2011 OR04 260 283 300 315 331 347 366 390 427 340
5/12/2011 OR01 438 472 500 525 551 579 612 654 722 280
5/12/2011 OR07 211 224 235 244 253 262 272 285 305 200
5/13/2011 OR07 476 508 532 554 575 598 623 655 702 430
5/16/2011 OR01 171 189 203 216 230 244 260 281 314 195
5/16/2011 OR04 364 382 396 408 420 433 448 467 497 497
5/18/2011 OR02 124 136 146 154 163 172 183 197 219 235
5/19/2011 OR02 346 361 373 383 392 402 413 427 447 435
5/20/2011 OR03 193 206 216 224 233 242 252 265 285 288
5/20/2011 OR07 185 194 200 206 213 220 228 239 257 245
5/20/2011 OR08 252 266 276 286 296 306 318 334 357 366
5/23/2011 OR04 365 380 392 402 413 424 437 455 483 360
5/24/2011 OR02 339 356 368 380 390 401 413 428 450 475
5/24/2011 OR04 149 164 175 185 196 207 220 236 261 190
5/25/2011 OR07 499 524 542 558 574 590 608 630 662 480
5/26/2011 OR02 341 357 369 379 389 399 411 425 445 398
5/26/2011 OR03 263 287 305 322 340 358 380 407 449 410
5/27/2011 OR08 247 256 263 269 275 281 287 295 306 327
5/31/2011 OR04 295 314 329 342 355 369 384 403 431 330
6/1/2011 OR02 131 140 147 154 161 168 177 188 207 193
6/2/2011 OR02 382 397 409 419 429 439 450 463 483 429
6/2/2011 OR03 203 226 245 263 281 301 324 355 404 293
6/3/2011 OR02 154 166 176 185 194 203 213 227 247 182
6/6/2011 OR04 392 421 443 463 483 505 529 559 605 444
6/6/2011 OR06 362 388 408 426 443 462 482 508 546 405
6/7/2011 OR04 163 176 187 197 206 216 228 243 266 275
6/7/2011 OR08 278 294 307 319 331 343 358 377 406 430

129
Date OR 10% 20% 30% 40% 50% 60% 70% 80% 90% Actual Duration
6/8/2011 OR04 459 485 505 522 540 558 579 606 647 530
6/10/2011 OR08 224 234 242 249 255 262 269 278 291 276
6/13/2011 OR03 366 393 415 434 454 475 499 529 578 414
6/13/2011 OR04 592 617 635 652 669 687 707 733 774 695
6/13/2011 OR06 390 418 439 459 478 498 521 550 594 415
6/14/2011 OR04 261 277 289 300 311 322 335 351 375 340
6/15/2011 OR07 153 166 176 186 196 206 218 234 259 112
6/15/2011 OR08 174 183 190 197 203 209 216 224 237 220
6/17/2011 OR04 271 290 304 317 330 344 360 379 409 305
6/20/2011 OR04 215 227 237 246 255 266 279 295 323 250
6/20/2011 OR08 172 184 194 202 210 219 229 241 260 305
6/21/2011 OR08 190 204 216 226 236 246 258 273 295 337
6/22/2011 OR01 229 246 258 270 281 294 308 327 357 283
6/22/2011 OR08 181 190 198 204 211 217 224 233 246 190
6/23/2011 OR03 206 220 231 241 250 260 271 285 307 243
6/27/2011 OR02 356 372 384 395 405 416 427 442 463 555
6/27/2011 OR03 305 325 341 355 369 384 400 420 449 394
6/27/2011 OR04 358 372 382 392 402 413 426 443 471 415
6/28/2011 OR08 379 403 421 438 454 471 489 513 547 335
6/30/2011 OR01 289 323 350 376 403 432 466 512 584 465
6/30/2011 OR02 526 535 542 548 554 561 568 577 591 658
6/30/2011 OR03 339 360 377 392 407 422 439 461 493 420
7/1/2011 OR03 370 396 416 435 453 473 497 526 574 516
7/1/2011 OR08 356 379 397 413 428 444 462 485 518 545
7/5/2011 OR04 255 267 277 285 294 302 313 325 346 328
7/6/2011 OR01 253 266 277 286 295 305 316 329 349 250
7/6/2011 OR07 168 176 183 189 194 200 207 216 230 250
7/7/2011 OR04 357 379 396 410 425 440 457 479 514 600
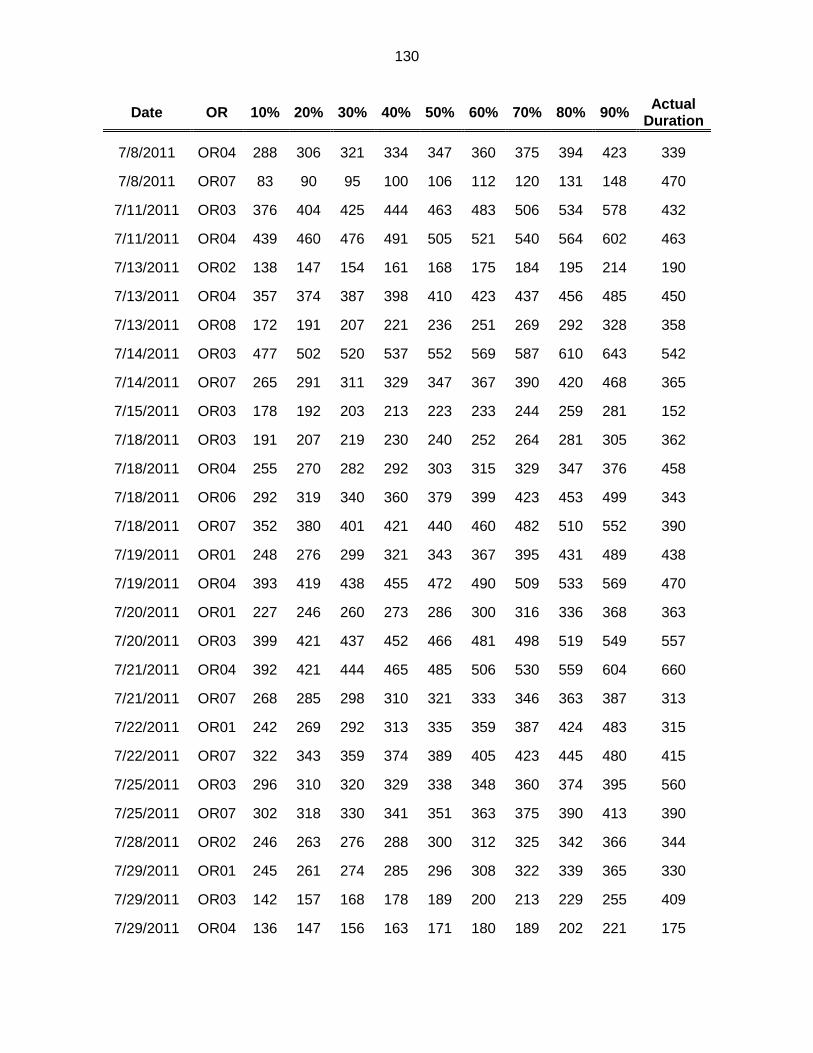
130
Date OR 10% 20% 30% 40% 50% 60% 70% 80% 90% Actual Duration
7/8/2011 OR04 288 306 321 334 347 360 375 394 423 339
7/8/2011 OR07 83 90 95 100 106 112 120 131 148 470
7/11/2011 OR03 376 404 425 444 463 483 506 534 578 432
7/11/2011 OR04 439 460 476 491 505 521 540 564 602 463
7/13/2011 OR02 138 147 154 161 168 175 184 195 214 190
7/13/2011 OR04 357 374 387 398 410 423 437 456 485 450
7/13/2011 OR08 172 191 207 221 236 251 269 292 328 358
7/14/2011 OR03 477 502 520 537 552 569 587 610 643 542
7/14/2011 OR07 265 291 311 329 347 367 390 420 468 365
7/15/2011 OR03 178 192 203 213 223 233 244 259 281 152
7/18/2011 OR03 191 207 219 230 240 252 264 281 305 362
7/18/2011 OR04 255 270 282 292 303 315 329 347 376 458
7/18/2011 OR06 292 319 340 360 379 399 423 453 499 343
7/18/2011 OR07 352 380 401 421 440 460 482 510 552 390
7/19/2011 OR01 248 276 299 321 343 367 395 431 489 438
7/19/2011 OR04 393 419 438 455 472 490 509 533 569 470
7/20/2011 OR01 227 246 260 273 286 300 316 336 368 363
7/20/2011 OR03 399 421 437 452 466 481 498 519 549 557
7/21/2011 OR04 392 421 444 465 485 506 530 559 604 660
7/21/2011 OR07 268 285 298 310 321 333 346 363 387 313
7/22/2011 OR01 242 269 292 313 335 359 387 424 483 315
7/22/2011 OR07 322 343 359 374 389 405 423 445 480 415
7/25/2011 OR03 296 310 320 329 338 348 360 374 395 560
7/25/2011 OR07 302 318 330 341 351 363 375 390 413 390
7/28/2011 OR02 246 263 276 288 300 312 325 342 366 344
7/29/2011 OR01 245 261 274 285 296 308 322 339 365 330
7/29/2011 OR03 142 157 168 178 189 200 213 229 255 409
7/29/2011 OR04 136 147 156 163 171 180 189 202 221 175

131
Date OR 10% 20% 30% 40% 50% 60% 70% 80% 90% Actual Duration
7/29/2011 OR07 252 269 283 296 309 322 337 357 388 265
8/1/2011 OR02 379 399 415 429 443 457 472 491 518 380
8/1/2011 OR03 447 476 498 518 537 558 580 608 650 630
8/3/2011 OR04 235 250 261 272 283 294 308 326 354 235
8/5/2011 OR07 273 294 309 323 337 352 369 389 421 395
8/8/2011 OR04 387 408 424 438 452 467 483 504 537 455
8/9/2011 OR04 340 361 377 391 405 420 436 457 487 340
8/9/2011 OR08 313 333 349 363 377 391 408 429 462 466
8/11/2011 OR04 381 396 407 418 429 440 453 471 500 495
8/12/2011 OR07 394 421 441 460 478 497 518 545 586 463
8/15/2011 OR04 350 380 403 424 444 466 491 521 567 415
8/16/2011 OR02 179 196 209 221 232 245 259 278 306 175
8/17/2011 OR02 118 128 136 144 151 159 169 182 202 307
8/17/2011 OR07 156 172 183 194 205 217 231 250 281 180
8/17/2011 OR08 189 200 207 214 221 228 236 245 259 206
8/18/2011 OR06 385 415 438 459 479 500 524 553 597 493
8/18/2011 OR07 253 268 280 290 300 311 323 338 361 393
8/19/2011 OR07 378 404 424 443 461 481 503 531 575 425
8/19/2011 OR08 113 120 125 130 135 140 145 152 162 202
8/22/2011 OR04 350 381 404 426 447 469 494 526 573 460
8/22/2011 OR08 123 137 148 158 168 178 190 206 230 210
8/23/2011 OR06 169 186 200 212 225 239 255 276 308 250
8/23/2011 OR08 230 247 260 272 284 297 313 333 364 320
8/24/2011 OR01 406 445 477 505 534 565 600 645 715 590
8/24/2011 OR04 224 241 255 267 279 292 307 327 359 333
8/25/2011 OR04 347 361 372 382 393 404 417 434 462 458
8/26/2011 OR06 110 120 127 135 142 150 159 170 188 145
8/26/2011 OR07 254 273 289 303 318 333 351 374 410 342

132
Date OR 10% 20% 30% 40% 50% 60% 70% 80% 90% Actual Duration
8/29/2011 OR06 317 344 364 383 402 421 444 472 515 400
8/31/2011 OR01 239 259 274 288 301 315 332 353 386 280
9/1/2011 OR03 242 255 266 275 284 293 304 317 337 350
9/2/2011 OR01 280 310 334 357 379 404 432 469 526 265
9/2/2011 OR06 101 111 120 128 136 144 154 167 186 289
9/2/2011 OR07 339 360 377 392 408 424 443 467 504 390
9/6/2011 OR08 356 379 398 414 431 449 469 494 533 400
9/7/2011 OR07 142 157 170 181 193 205 220 239 269 205
9/8/2011 OR04 336 356 370 384 397 411 426 447 479 370
9/9/2011 OR02 332 348 361 373 384 396 410 428 455 380
9/9/2011 OR07 365 389 407 424 440 457 477 501 539 455
9/9/2011 OR08 209 218 224 230 236 242 248 256 268 237
9/12/2011 OR03 142 152 160 167 175 183 192 204 222 178
9/12/2011 OR04 356 386 409 430 451 472 497 527 573 440
9/13/2011 OR02 173 187 199 209 219 230 242 258 282 280
9/13/2011 OR08 317 335 348 360 372 385 400 419 447 380
9/14/2011 OR03 177 190 201 210 219 230 241 257 282 200
9/15/2011 OR01 195 210 221 231 241 251 263 277 299 317
9/15/2011 OR05 96 109 120 130 141 153 167 185 215 132
9/16/2011 OR04 171 186 197 208 218 229 241 257 281 358
9/16/2011 OR05 129 138 146 152 159 167 175 187 205 267
9/16/2011 OR07 192 211 227 241 255 270 288 311 346 287
9/16/2011 OR08 293 305 314 322 329 337 345 355 370 350
9/19/2011 OR01 282 306 325 342 359 376 396 421 458 300
9/19/2011 OR04 360 385 403 421 438 455 476 502 542 422
9/19/2011 OR06 100 114 124 134 143 154 166 182 206 224
9/20/2011 OR01 288 306 320 332 345 357 372 389 415 326
9/20/2011 OR04 232 249 262 273 284 296 310 326 351 224

133
Date OR 10% 20% 30% 40% 50% 60% 70% 80% 90% Actual Duration
9/20/2011 OR08 364 389 408 426 443 461 481 506 544 370
9/21/2011 OR04 301 324 342 358 375 392 412 438 479 345
9/22/2011 OR03 300 319 334 347 360 374 389 408 436 474
9/23/2011 OR07 235 254 269 283 297 311 328 349 381 385
9/26/2011 OR02 378 390 399 407 415 423 432 444 461 415
9/26/2011 OR04 356 377 392 406 420 435 452 473 506 515
9/27/2011 OR01 436 470 497 521 544 569 597 633 687 525
9/27/2011 OR04 359 381 397 411 426 441 457 478 510 438
9/27/2011 OR08 344 359 371 381 391 402 413 427 447 395
9/28/2011 OR02 380 393 403 412 420 429 439 451 469 380
9/28/2011 OR07 249 270 286 301 316 332 350 374 409 440
9/28/2011 OR08 202 218 230 241 252 264 278 295 323 322
9/29/2011 OR01 174 194 210 226 242 259 280 306 348 237
9/29/2011 OR04 360 377 391 403 414 427 442 461 491 436
9/30/2011 OR03 435 459 478 495 512 530 550 576 615 359
9/30/2011 OR04 229 244 256 267 278 289 302 318 342 212
9/30/2011 OR07 331 354 372 388 404 421 440 465 501 449
10/4/2011 OR08 268 280 290 298 306 315 324 336 352 345
10/5/2011 OR02 141 151 158 165 172 179 188 200 219 160
10/5/2011 OR03 170 186 198 210 221 234 248 267 297 172
10/5/2011 OR05 119 136 149 162 175 188 204 225 259 233
10/5/2011 OR07 242 258 271 282 293 305 318 335 361 403
10/5/2011 OR08 153 166 176 186 195 206 218 234 259 372
10/6/2011 OR04 348 362 374 384 394 406 419 437 465 410
10/6/2011 OR06 176 191 203 213 224 235 247 263 287 410
10/7/2011 OR07 373 395 412 427 443 459 477 501 537 362
10/12/2011 OR01 318 338 353 366 380 394 410 431 463 365
10/12/2011 OR04 226 239 249 259 269 280 293 310 338 336

134
Date OR 10% 20% 30% 40% 50% 60% 70% 80% 90% Actual Duration
10/13/2011 OR02 384 413 435 455 475 496 519 547 590 625
10/13/2011 OR05 357 374 388 400 411 424 439 458 488 425
10/14/2011 OR01 400 431 455 477 499 522 548 581 633 510
10/14/2011 OR08 204 219 231 242 253 264 276 292 315 340
10/17/2011 OR03 400 420 436 449 463 477 492 511 539 423
10/18/2011 OR01 298 315 329 341 353 365 379 396 422 295
10/18/2011 OR03 336 368 393 416 440 465 495 533 595 412
10/18/2011 OR04 471 494 512 529 545 561 581 604 641 460
10/19/2011 OR02 325 341 354 365 377 390 405 423 453 340
10/19/2011 OR05 95 110 122 133 145 157 172 192 225 90
10/19/2011 OR08 258 270 279 287 295 304 314 326 346 330
10/20/2011 OR03 198 218 233 248 262 277 295 317 351 287
10/20/2011 OR06 207 223 235 246 257 268 280 296 319 245
10/21/2011 OR01 184 197 207 216 225 234 245 258 279 210
10/21/2011 OR07 279 299 315 329 343 358 376 397 431 282
10/24/2011 OR02 377 391 402 411 420 429 440 452 471 400
10/24/2011 OR04 310 326 339 350 361 374 388 406 435 380
10/24/2011 OR07 360 398 428 456 483 513 547 591 660 580
10/26/2011 OR03 167 183 196 208 220 233 248 266 294 348
10/26/2011 OR05 291 313 331 347 363 381 401 427 468 324
10/26/2011 OR07 190 203 213 222 232 242 254 269 294 250
10/27/2011 OR01 532 566 591 614 636 659 685 717 764 720
10/28/2011 OR02 185 202 214 226 238 250 264 282 310 274
10/28/2011 OR08 307 328 345 360 374 390 407 428 460 333
10/31/2011 OR04 307 322 333 344 355 366 380 397 426 468
10/31/2011 OR06 282 302 318 332 345 360 376 396 426 315
11/1/2011 OR02 378 392 402 412 420 430 440 452 471 360
11/1/2011 OR08 219 230 238 245 252 259 267 277 291 245

135
Date OR 10% 20% 30% 40% 50% 60% 70% 80% 90% Actual Duration
11/2/2011 OR03 170 184 195 206 216 227 240 256 280 185
11/2/2011 OR06 246 262 275 287 298 310 324 341 366 256
11/2/2011 OR07 119 130 140 148 156 165 175 189 210 210
11/2/2011 OR08 206 217 225 233 241 249 258 271 290 340
11/3/2011 OR01 164 178 189 199 209 220 232 249 275 170
11/3/2011 OR05 334 353 367 380 392 405 420 440 471 410
11/3/2011 OR06 215 227 236 244 252 261 270 281 299 373
11/4/2011 OR03 112 120 127 133 139 146 154 165 183 146
11/7/2011 OR02 462 486 504 520 535 552 570 593 627 631
11/7/2011 OR04 334 351 364 376 388 400 415 434 464 405
11/7/2011 OR08 148 160 170 178 186 195 205 217 236 200
11/8/2011 OR03 236 253 267 280 292 305 319 338 365 340
11/9/2011 OR02 145 154 161 167 174 181 190 201 220 178
11/9/2011 OR04 202 215 226 235 245 256 269 286 314 225
11/9/2011 OR08 291 306 316 326 335 345 356 370 392 361
11/10/2011 OR05 218 236 250 263 276 290 306 328 362 313
11/10/2011 OR06 510 529 544 557 569 582 596 614 640 473
11/14/2011 OR02 298 316 329 341 353 366 381 399 428 473
11/15/2011 OR03 197 208 216 224 231 239 248 260 278 402
11/15/2011 OR08 362 376 386 395 404 413 422 434 451 388
11/16/2011 OR04 222 235 245 254 264 275 288 304 332 265
11/16/2011 OR05 123 141 156 169 183 199 216 240 276 128
11/16/2011 OR08 186 197 205 212 219 227 236 248 267 350
11/17/2011 OR04 374 388 399 408 417 426 436 448 467 428
11/18/2011 OR08 227 244 257 269 280 293 307 325 354 265
11/21/2011 OR01 273 300 322 342 362 384 410 443 495 450
11/21/2011 OR02 155 168 177 186 195 204 214 227 246 123
11/21/2011 OR03 163 182 197 210 224 239 255 277 310 281

136
Date OR 10% 20% 30% 40% 50% 60% 70% 80% 90% Actual Duration
11/21/2011 OR06 177 193 205 217 228 240 254 270 296 168
11/21/2011 OR07 224 241 255 267 279 291 305 323 349 329
11/22/2011 OR08 444 465 481 496 512 528 548 574 615 475
11/23/2011 OR02 160 173 182 191 200 209 220 234 255 245
11/23/2011 OR03 172 188 200 211 222 234 247 264 289 189
11/28/2011 OR05 468 495 516 535 555 575 599 630 678 460
11/29/2011 OR03 199 217 231 243 256 269 283 302 330 249
11/29/2011 OR04 485 503 516 528 540 552 565 582 607 495
12/1/2011 OR01 298 317 331 344 357 370 385 404 434 370
12/1/2011 OR04 377 393 406 417 429 441 455 473 503 430
12/5/2011 OR03 299 319 334 347 361 375 390 409 438 292
12/5/2011 OR04 349 370 386 401 415 430 447 469 502 343
12/5/2011 OR06 165 181 194 205 216 228 242 259 286 205
12/5/2011 OR08 104 114 122 129 137 145 154 166 185 177
12/6/2011 OR03 412 431 445 457 470 483 497 516 543 377
12/6/2011 OR08 368 383 394 404 413 422 433 445 463 395
12/7/2011 OR01 315 342 362 380 398 417 439 466 508 256
12/7/2011 OR03 355 378 396 412 427 443 461 484 517 426
12/7/2011 OR05 100 110 119 127 136 146 158 174 202 114
12/7/2011 OR08 305 324 338 351 364 378 394 414 445 380
12/9/2011 OR07 181 195 205 215 225 235 248 264 289 244
12/9/2011 OR08 259 277 292 305 318 332 347 366 394 270
12/12/2011 OR04 446 476 500 521 542 564 590 621 669 345
12/12/2011 OR08 159 173 184 195 205 215 227 242 265 205
12/13/2011 OR04 213 227 238 247 257 267 278 293 314 364
12/14/2011 OR08 263 279 292 303 314 325 338 355 380 443
12/15/2011 OR04 266 285 299 312 325 340 356 377 411 350
12/15/2011 OR05 141 163 180 197 213 232 253 283 332 241

137
Date OR 10% 20% 30% 40% 50% 60% 70% 80% 90% Actual Duration
12/16/2011 OR04 377 397 412 426 439 454 470 490 521 459
12/16/2011 OR07 465 498 523 546 569 592 619 652 703 405
12/16/2011 OR08 308 329 346 362 378 395 415 441 482 403
12/19/2011 OR08 137 149 159 168 176 186 196 210 230 184
12/20/2011 OR08 304 320 332 343 354 365 377 392 414 285
12/21/2011 OR08 340 360 376 390 404 419 436 458 491 408
12/22/2011 OR06 204 217 227 236 244 254 264 277 297 262
12/28/2011 OR08 144 151 156 161 166 171 176 182 192 135
12/30/2011 OR07 259 276 289 300 312 324 338 355 382 328
Table 39: Percentile Values of the Distribution of the Duration of Surgery Lists from T-distribution
Date OR 10% 20% 30% 40% 50% 60% 70% 80% 90% Actual Duration
1/3/2011 OR04 381 389 395 400 405 410 414 420 428 391
1/3/2011 OR07 327 338 346 353 359 366 372 380 391 380
1/4/2011 OR01 361 378 390 400 410 420 430 443 460 403
1/4/2011 OR03 406 420 430 438 446 454 462 472 486 395
1/4/2011 OR08 282 289 295 300 304 309 314 319 327 335
1/5/2011 OR03 181 193 201 208 214 221 228 236 247 163
1/5/2011 OR08 251 258 263 268 272 276 280 285 293 318
1/6/2011 OR03 305 339 363 384 403 423 444 468 502 337
1/7/2011 OR02 202 213 220 227 233 239 246 253 264 370
1/7/2011 OR03 369 379 386 392 397 403 409 415 425 455
1/7/2011 OR07 230 242 250 257 263 270 277 285 297 300
1/10/2011 OR02 223 233 240 246 252 257 263 270 280 339
1/10/2011 OR04 384 392 398 402 407 412 417 422 430 385
1/11/2011 OR01 469 482 491 498 505 513 520 529 542 450
1/11/2011 OR08 274 280 285 289 293 297 301 306 313 290

138
Date OR 10% 20% 30% 40% 50% 60% 70% 80% 90% Actual Duration
1/12/2011 OR04 259 273 283 292 300 308 317 327 341 319
1/12/2011 OR07 221 231 239 246 252 258 265 273 283 200
1/13/2011 OR07 194 207 215 223 230 237 245 254 266 234
1/14/2011 OR04 184 198 208 216 224 232 241 250 264 227
1/14/2011 OR07 523 533 540 546 552 557 563 570 580 417
1/18/2011 OR08 230 235 238 241 244 247 249 253 258 240
1/19/2011 OR03 276 285 292 298 304 309 315 322 332 427
1/20/2011 OR04 385 398 408 417 424 432 441 451 464 360
1/21/2011 OR01 339 357 370 381 391 401 412 425 443 345
1/21/2011 OR02 189 199 207 213 219 225 232 239 250 342
1/21/2011 OR03 236 246 253 259 265 271 277 284 294 181
1/24/2011 OR02 534 555 570 583 595 608 621 636 657 615
1/24/2011 OR04 372 382 390 396 402 408 415 422 433 373
1/25/2011 OR01 506 544 571 594 615 637 660 687 724 560
1/25/2011 OR03 325 335 343 350 356 362 368 376 386 272
1/25/2011 OR04 473 487 497 506 514 523 532 542 556 407
1/25/2011 OR08 355 360 364 367 369 372 375 379 384 357
1/26/2011 OR01 84 98 109 118 126 135 144 154 169 55
1/26/2011 OR07 247 257 264 271 276 282 288 295 305 335
1/27/2011 OR04 364 383 397 408 419 430 441 455 474 442
1/28/2011 OR01 436 456 471 483 495 506 519 533 553 350
1/28/2011 OR02 201 212 220 227 233 239 246 254 265 207
1/28/2011 OR03 226 237 245 251 257 263 270 278 288 199
1/28/2011 OR07 277 286 293 298 304 309 314 321 330 250
1/31/2011 OR04 279 293 303 312 320 328 337 347 361 285
1/31/2011 OR07 250 259 266 272 278 283 289 296 306 245
2/1/2011 OR08 421 428 434 439 443 448 453 458 466 378
2/3/2011 OR04 348 367 380 392 402 413 425 438 457 447

139
Date OR 10% 20% 30% 40% 50% 60% 70% 80% 90% Actual Duration
2/4/2011 OR03 555 579 596 610 624 638 653 670 694 444
2/4/2011 OR07 189 198 205 210 215 221 226 233 241 174
2/4/2011 OR08 369 382 391 399 406 414 422 431 443 288
2/7/2011 OR07 289 297 303 307 312 317 322 327 335 330
2/8/2011 OR03 274 286 294 301 308 315 322 330 342 373
2/8/2011 OR04 386 394 399 404 408 412 417 422 430 450
2/8/2011 OR08 350 356 360 364 367 371 374 379 385 293
2/9/2011 OR03 330 340 348 355 361 368 374 382 393 393
2/9/2011 OR04 255 268 278 287 295 302 311 321 334 280
2/9/2011 OR07 173 183 190 196 202 208 214 222 232 280
2/10/2011 OR03 365 401 428 451 472 493 515 542 579 467
2/11/2011 OR07 361 377 388 398 407 416 425 436 452 328
2/11/2011 OR08 294 304 310 316 322 327 333 340 350 277
2/14/2011 OR02 384 396 404 411 418 424 431 440 451 390
2/14/2011 OR03 384 407 424 438 452 465 479 496 519 378
2/14/2011 OR04 362 373 380 387 393 399 405 413 423 447
2/15/2011 OR08 271 280 287 292 297 302 308 314 323 217
2/16/2011 OR02 252 262 270 276 283 289 295 303 313 277
2/16/2011 OR03 187 197 204 210 215 221 226 233 243 264
2/16/2011 OR04 255 272 285 295 305 315 326 338 355 337
2/16/2011 OR08 360 368 374 380 385 390 395 401 409 369
2/17/2011 OR03 273 288 298 307 316 324 333 343 358 277
2/17/2011 OR04 479 494 504 513 522 530 540 550 565 485
2/18/2011 OR04 307 319 328 335 342 349 356 365 377 355
2/18/2011 OR07 330 340 348 355 361 367 374 382 392 421
2/18/2011 OR08 312 321 327 332 337 342 347 353 362 208
2/22/2011 OR06 251 263 271 278 285 292 299 308 319 265
2/22/2011 OR08 262 267 271 273 276 279 282 285 290 258
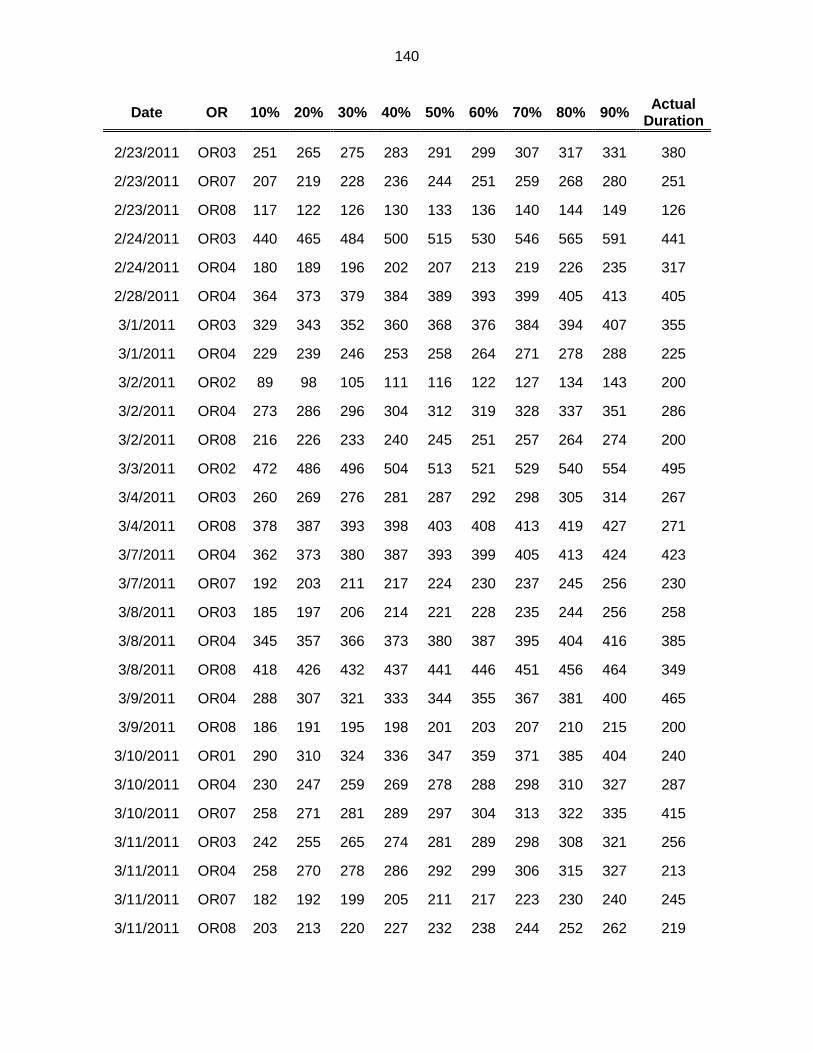
140
Date OR 10% 20% 30% 40% 50% 60% 70% 80% 90% Actual Duration
2/23/2011 OR03 251 265 275 283 291 299 307 317 331 380
2/23/2011 OR07 207 219 228 236 244 251 259 268 280 251
2/23/2011 OR08 117 122 126 130 133 136 140 144 149 126
2/24/2011 OR03 440 465 484 500 515 530 546 565 591 441
2/24/2011 OR04 180 189 196 202 207 213 219 226 235 317
2/28/2011 OR04 364 373 379 384 389 393 399 405 413 405
3/1/2011 OR03 329 343 352 360 368 376 384 394 407 355
3/1/2011 OR04 229 239 246 253 258 264 271 278 288 225
3/2/2011 OR02 89 98 105 111 116 122 127 134 143 200
3/2/2011 OR04 273 286 296 304 312 319 328 337 351 286
3/2/2011 OR08 216 226 233 240 245 251 257 264 274 200
3/3/2011 OR02 472 486 496 504 513 521 529 540 554 495
3/4/2011 OR03 260 269 276 281 287 292 298 305 314 267
3/4/2011 OR08 378 387 393 398 403 408 413 419 427 271
3/7/2011 OR04 362 373 380 387 393 399 405 413 424 423
3/7/2011 OR07 192 203 211 217 224 230 237 245 256 230
3/8/2011 OR03 185 197 206 214 221 228 235 244 256 258
3/8/2011 OR04 345 357 366 373 380 387 395 404 416 385
3/8/2011 OR08 418 426 432 437 441 446 451 456 464 349
3/9/2011 OR04 288 307 321 333 344 355 367 381 400 465
3/9/2011 OR08 186 191 195 198 201 203 207 210 215 200
3/10/2011 OR01 290 310 324 336 347 359 371 385 404 240
3/10/2011 OR04 230 247 259 269 278 288 298 310 327 287
3/10/2011 OR07 258 271 281 289 297 304 313 322 335 415
3/11/2011 OR03 242 255 265 274 281 289 298 308 321 256
3/11/2011 OR04 258 270 278 286 292 299 306 315 327 213
3/11/2011 OR07 182 192 199 205 211 217 223 230 240 245
3/11/2011 OR08 203 213 220 227 232 238 244 252 262 219

141
Date OR 10% 20% 30% 40% 50% 60% 70% 80% 90% Actual Duration
3/14/2011 OR04 230 240 247 254 260 266 272 280 290 440
3/15/2011 OR08 366 375 381 386 391 396 401 407 416 305
3/16/2011 OR04 180 189 195 200 205 209 215 221 229 248
3/16/2011 OR08 284 294 300 306 311 317 322 329 338 343
3/17/2011 OR01 283 301 314 325 335 346 357 370 387 450
3/17/2011 OR03 243 255 264 272 279 286 294 302 315 279
3/17/2011 OR04 386 400 410 418 426 434 443 453 467 443
3/18/2011 OR04 229 242 253 261 269 277 286 296 310 270
3/18/2011 OR07 218 228 234 240 246 251 257 264 273 272
3/18/2011 OR08 214 218 220 223 225 227 230 232 236 197
3/21/2011 OR02 391 405 414 423 431 438 447 457 470 480
3/21/2011 OR03 464 477 486 494 502 509 517 527 540 501
3/21/2011 OR04 373 385 394 402 409 417 425 434 446 460
3/21/2011 OR08 201 210 217 223 228 234 240 247 256 255
3/22/2011 OR03 476 489 499 507 514 522 530 539 553 487
3/23/2011 OR07 110 120 126 132 137 143 148 155 164 147
3/24/2011 OR04 385 403 416 427 437 448 458 471 489 488
3/24/2011 OR07 213 223 231 237 243 249 256 263 274 220
3/25/2011 OR01 395 419 435 450 463 476 491 507 530 288
3/25/2011 OR04 250 258 264 270 275 279 285 291 299 330
3/25/2011 OR07 507 516 523 528 534 539 545 552 561 440
3/25/2011 OR08 207 210 213 216 218 220 222 225 229 260
3/28/2011 OR03 394 404 412 418 424 430 437 444 455 483
3/28/2011 OR04 416 428 437 445 452 459 466 475 487 447
3/28/2011 OR08 212 224 233 240 247 254 261 270 282 230
3/29/2011 OR02 402 415 424 432 439 446 454 463 476 400
3/29/2011 OR04 486 499 509 517 524 532 540 549 562 601
3/29/2011 OR08 269 276 281 285 289 293 297 302 308 290

142
Date OR 10% 20% 30% 40% 50% 60% 70% 80% 90% Actual Duration
3/30/2011 OR01 284 295 302 309 315 321 328 335 346 297
3/31/2011 OR04 241 256 267 276 285 294 303 314 329 365
4/1/2011 OR02 182 192 199 204 210 215 221 228 237 185
4/1/2011 OR03 158 169 177 184 190 197 204 212 223 185
4/4/2011 OR06 540 552 561 568 574 581 588 597 608 645
4/4/2011 OR07 265 276 284 290 297 303 309 317 328 232
4/4/2011 OR08 152 159 164 169 173 177 182 187 195 187
4/5/2011 OR04 164 172 179 184 189 194 200 206 215 147
4/6/2011 OR06 211 225 236 244 252 261 269 280 294 190
4/7/2011 OR01 375 398 415 430 443 457 471 488 512 537
4/7/2011 OR02 408 419 427 434 441 447 454 462 473 450
4/7/2011 OR03 472 482 490 496 502 508 514 521 532 626
4/7/2011 OR04 402 420 432 443 453 463 474 486 504 460
4/7/2011 OR07 417 438 454 467 479 491 504 519 541 410
4/8/2011 OR04 221 235 246 255 263 271 280 290 305 250
4/11/2011 OR04 577 594 606 616 625 635 645 657 674 510
4/11/2011 OR07 292 301 307 313 318 323 329 336 345 427
4/11/2011 OR08 169 177 182 187 191 196 200 206 214 217
4/13/2011 OR01 490 505 517 526 535 544 554 565 581 429
4/13/2011 OR04 466 478 486 494 501 508 515 524 536 392
4/14/2011 OR04 657 668 675 682 688 694 700 707 718 632
4/14/2011 OR07 255 270 281 290 299 308 317 328 343 284
4/15/2011 OR07 371 380 387 392 398 403 408 415 424 328
4/15/2011 OR08 213 220 225 228 232 236 240 245 251 196
4/18/2011 OR02 639 650 658 665 671 678 685 693 704 685
4/18/2011 OR03 331 346 357 366 374 383 392 403 417 341
4/18/2011 OR04 364 374 382 388 394 399 406 413 423 495
4/19/2011 OR06 164 172 179 184 189 194 199 206 214 150
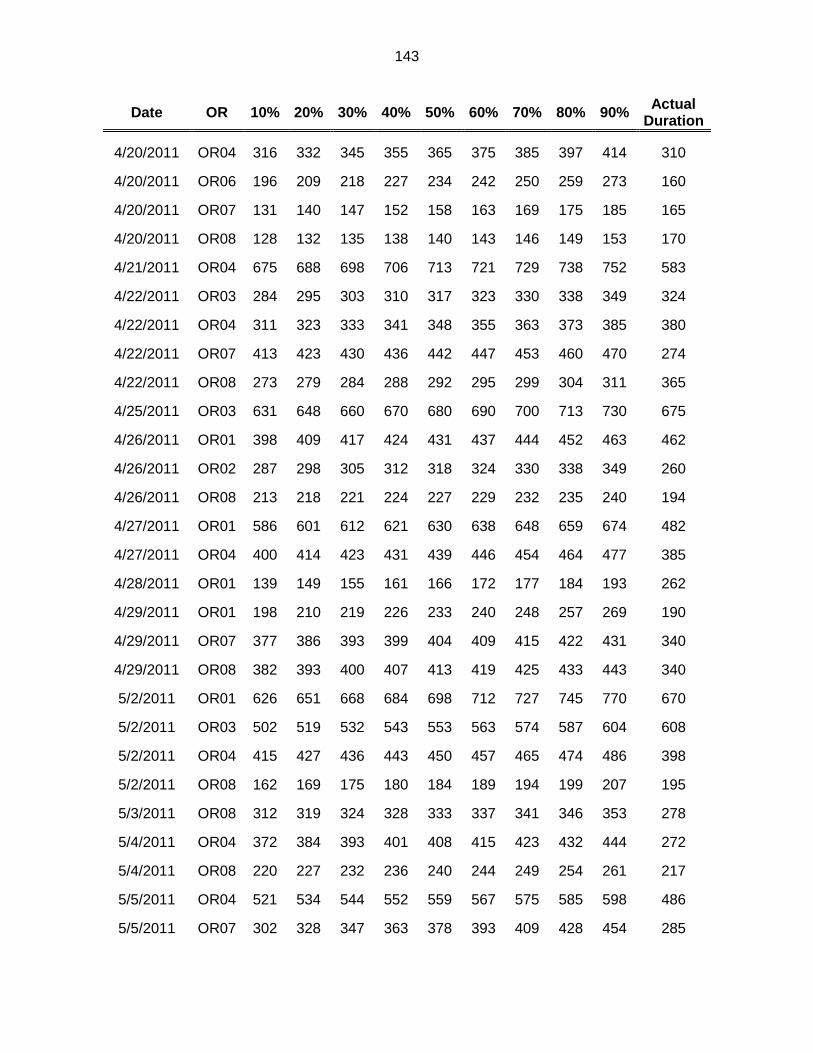
143
Date OR 10% 20% 30% 40% 50% 60% 70% 80% 90% Actual Duration
4/20/2011 OR04 316 332 345 355 365 375 385 397 414 310
4/20/2011 OR06 196 209 218 227 234 242 250 259 273 160
4/20/2011 OR07 131 140 147 152 158 163 169 175 185 165
4/20/2011 OR08 128 132 135 138 140 143 146 149 153 170
4/21/2011 OR04 675 688 698 706 713 721 729 738 752 583
4/22/2011 OR03 284 295 303 310 317 323 330 338 349 324
4/22/2011 OR04 311 323 333 341 348 355 363 373 385 380
4/22/2011 OR07 413 423 430 436 442 447 453 460 470 274
4/22/2011 OR08 273 279 284 288 292 295 299 304 311 365
4/25/2011 OR03 631 648 660 670 680 690 700 713 730 675
4/26/2011 OR01 398 409 417 424 431 437 444 452 463 462
4/26/2011 OR02 287 298 305 312 318 324 330 338 349 260
4/26/2011 OR08 213 218 221 224 227 229 232 235 240 194
4/27/2011 OR01 586 601 612 621 630 638 648 659 674 482
4/27/2011 OR04 400 414 423 431 439 446 454 464 477 385
4/28/2011 OR01 139 149 155 161 166 172 177 184 193 262
4/29/2011 OR01 198 210 219 226 233 240 248 257 269 190
4/29/2011 OR07 377 386 393 399 404 409 415 422 431 340
4/29/2011 OR08 382 393 400 407 413 419 425 433 443 340
5/2/2011 OR01 626 651 668 684 698 712 727 745 770 670
5/2/2011 OR03 502 519 532 543 553 563 574 587 604 608
5/2/2011 OR04 415 427 436 443 450 457 465 474 486 398
5/2/2011 OR08 162 169 175 180 184 189 194 199 207 195
5/3/2011 OR08 312 319 324 328 333 337 341 346 353 278
5/4/2011 OR04 372 384 393 401 408 415 423 432 444 272
5/4/2011 OR08 220 227 232 236 240 244 249 254 261 217
5/5/2011 OR04 521 534 544 552 559 567 575 585 598 486
5/5/2011 OR07 302 328 347 363 378 393 409 428 454 285
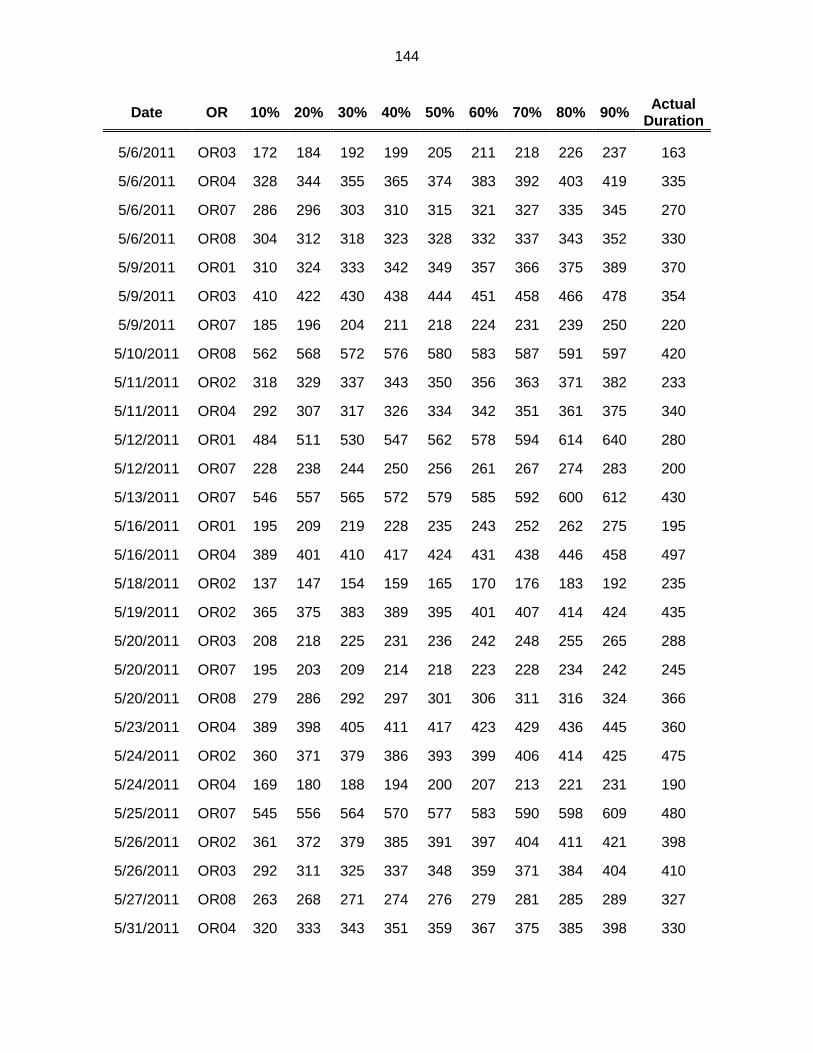
144
Date OR 10% 20% 30% 40% 50% 60% 70% 80% 90% Actual Duration
5/6/2011 OR03 172 184 192 199 205 211 218 226 237 163
5/6/2011 OR04 328 344 355 365 374 383 392 403 419 335
5/6/2011 OR07 286 296 303 310 315 321 327 335 345 270
5/6/2011 OR08 304 312 318 323 328 332 337 343 352 330
5/9/2011 OR01 310 324 333 342 349 357 366 375 389 370
5/9/2011 OR03 410 422 430 438 444 451 458 466 478 354
5/9/2011 OR07 185 196 204 211 218 224 231 239 250 220
5/10/2011 OR08 562 568 572 576 580 583 587 591 597 420
5/11/2011 OR02 318 329 337 343 350 356 363 371 382 233
5/11/2011 OR04 292 307 317 326 334 342 351 361 375 340
5/12/2011 OR01 484 511 530 547 562 578 594 614 640 280
5/12/2011 OR07 228 238 244 250 256 261 267 274 283 200
5/13/2011 OR07 546 557 565 572 579 585 592 600 612 430
5/16/2011 OR01 195 209 219 228 235 243 252 262 275 195
5/16/2011 OR04 389 401 410 417 424 431 438 446 458 497
5/18/2011 OR02 137 147 154 159 165 170 176 183 192 235
5/19/2011 OR02 365 375 383 389 395 401 407 414 424 435
5/20/2011 OR03 208 218 225 231 236 242 248 255 265 288
5/20/2011 OR07 195 203 209 214 218 223 228 234 242 245
5/20/2011 OR08 279 286 292 297 301 306 311 316 324 366
5/23/2011 OR04 389 398 405 411 417 423 429 436 445 360
5/24/2011 OR02 360 371 379 386 393 399 406 414 425 475
5/24/2011 OR04 169 180 188 194 200 207 213 221 231 190
5/25/2011 OR07 545 556 564 570 577 583 590 598 609 480
5/26/2011 OR02 361 372 379 385 391 397 404 411 421 398
5/26/2011 OR03 292 311 325 337 348 359 371 384 404 410
5/27/2011 OR08 263 268 271 274 276 279 281 285 289 327
5/31/2011 OR04 320 333 343 351 359 367 375 385 398 330

145
Date OR 10% 20% 30% 40% 50% 60% 70% 80% 90% Actual Duration
6/1/2011 OR02 142 150 155 160 165 169 174 180 188 193
6/2/2011 OR02 400 411 418 425 431 437 443 451 462 429
6/2/2011 OR03 221 246 264 280 294 309 324 342 368 293
6/3/2011 OR02 168 178 185 192 197 203 210 217 227 182
6/6/2011 OR04 433 452 466 477 488 499 510 524 543 444
6/6/2011 OR06 412 424 433 441 448 455 463 472 484 405
6/7/2011 OR04 180 191 198 204 210 216 222 230 240 275
6/7/2011 OR08 315 322 327 332 336 340 344 350 357 430
6/8/2011 OR04 499 514 525 535 544 553 562 573 589 530
6/10/2011 OR08 242 247 251 254 257 260 263 267 272 276
6/13/2011 OR03 417 432 442 451 459 467 476 487 501 414
6/13/2011 OR04 637 649 657 664 671 677 684 692 704 695
6/13/2011 OR06 443 456 466 474 482 490 498 507 521 415
6/14/2011 OR04 281 293 301 308 315 321 328 336 348 340
6/15/2011 OR07 176 185 192 198 203 208 214 220 230 112
6/15/2011 OR08 189 194 198 201 204 208 211 215 220 220
6/17/2011 OR04 305 315 322 328 334 340 346 353 364 305
6/20/2011 OR04 235 244 251 256 261 266 272 278 287 250
6/20/2011 OR08 187 196 202 208 213 219 224 231 240 305
6/21/2011 OR08 213 222 229 235 240 245 251 258 267 337
6/22/2011 OR01 253 264 272 278 285 291 298 306 317 283
6/22/2011 OR08 196 202 206 209 212 216 219 223 229 190
6/23/2011 OR03 224 234 241 248 254 259 266 273 283 243
6/27/2011 OR02 375 386 394 401 407 414 420 428 439 555
6/27/2011 OR03 340 351 359 366 373 379 386 394 405 394
6/27/2011 OR04 380 389 396 402 407 412 418 425 434 415
6/28/2011 OR08 429 439 447 453 459 465 472 479 490 335
6/30/2011 OR01 335 363 384 401 418 434 451 472 500 465
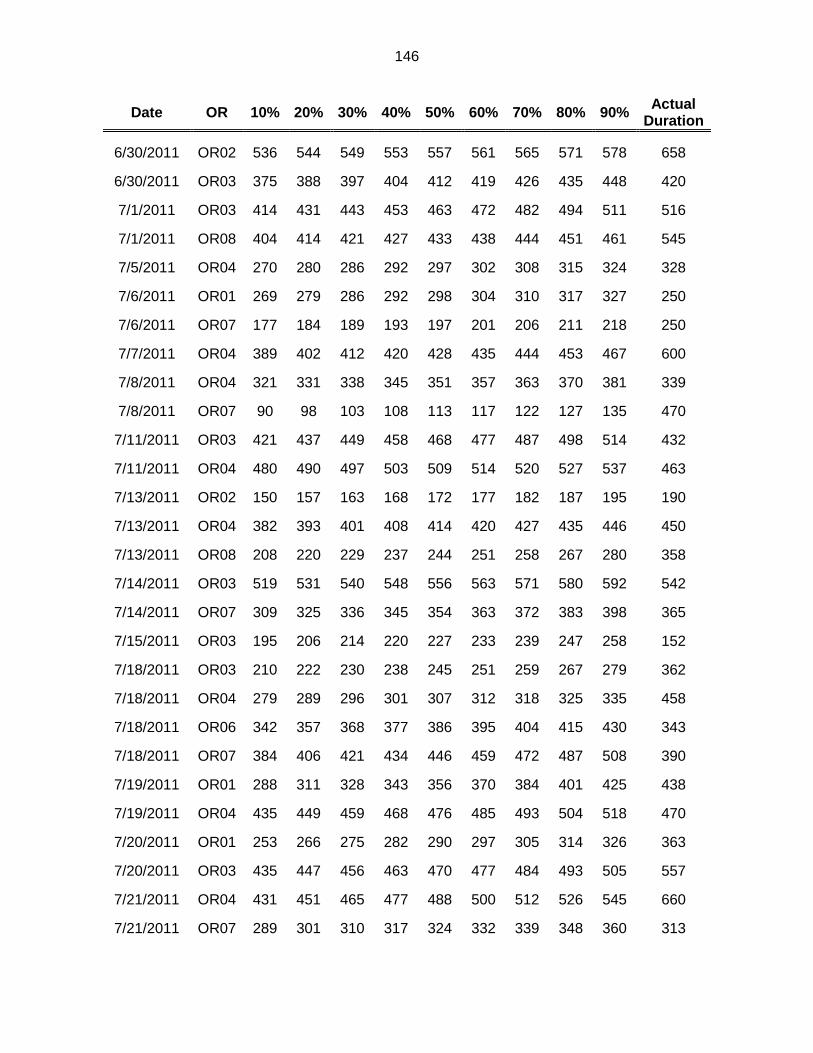
146
Date OR 10% 20% 30% 40% 50% 60% 70% 80% 90% Actual Duration
6/30/2011 OR02 536 544 549 553 557 561 565 571 578 658
6/30/2011 OR03 375 388 397 404 412 419 426 435 448 420
7/1/2011 OR03 414 431 443 453 463 472 482 494 511 516
7/1/2011 OR08 404 414 421 427 433 438 444 451 461 545
7/5/2011 OR04 270 280 286 292 297 302 308 315 324 328
7/6/2011 OR01 269 279 286 292 298 304 310 317 327 250
7/6/2011 OR07 177 184 189 193 197 201 206 211 218 250
7/7/2011 OR04 389 402 412 420 428 435 444 453 467 600
7/8/2011 OR04 321 331 338 345 351 357 363 370 381 339
7/8/2011 OR07 90 98 103 108 113 117 122 127 135 470
7/11/2011 OR03 421 437 449 458 468 477 487 498 514 432
7/11/2011 OR04 480 490 497 503 509 514 520 527 537 463
7/13/2011 OR02 150 157 163 168 172 177 182 187 195 190
7/13/2011 OR04 382 393 401 408 414 420 427 435 446 450
7/13/2011 OR08 208 220 229 237 244 251 258 267 280 358
7/14/2011 OR03 519 531 540 548 556 563 571 580 592 542
7/14/2011 OR07 309 325 336 345 354 363 372 383 398 365
7/15/2011 OR03 195 206 214 220 227 233 239 247 258 152
7/18/2011 OR03 210 222 230 238 245 251 259 267 279 362
7/18/2011 OR04 279 289 296 301 307 312 318 325 335 458
7/18/2011 OR06 342 357 368 377 386 395 404 415 430 343
7/18/2011 OR07 384 406 421 434 446 459 472 487 508 390
7/19/2011 OR01 288 311 328 343 356 370 384 401 425 438
7/19/2011 OR04 435 449 459 468 476 485 493 504 518 470
7/20/2011 OR01 253 266 275 282 290 297 305 314 326 363
7/20/2011 OR03 435 447 456 463 470 477 484 493 505 557
7/21/2011 OR04 431 451 465 477 488 500 512 526 545 660
7/21/2011 OR07 289 301 310 317 324 332 339 348 360 313

147
Date OR 10% 20% 30% 40% 50% 60% 70% 80% 90% Actual Duration
7/22/2011 OR01 283 306 322 336 349 362 376 393 415 315
7/22/2011 OR07 369 379 386 392 398 403 409 416 426 415
7/25/2011 OR03 313 323 331 337 343 349 355 362 373 560
7/25/2011 OR07 333 340 346 351 355 360 365 370 378 390
7/28/2011 OR02 264 278 288 296 304 312 320 330 344 344
7/29/2011 OR01 273 283 290 296 302 307 313 320 330 330
7/29/2011 OR03 162 173 180 187 194 200 207 215 226 409
7/29/2011 OR04 150 159 165 170 175 180 186 192 200 175
7/29/2011 OR07 289 298 305 311 316 322 327 334 344 265
8/1/2011 OR02 400 416 427 437 446 455 465 476 492 380
8/1/2011 OR03 497 513 524 534 543 552 561 573 588 630
8/3/2011 OR04 259 268 276 282 287 293 299 306 316 235
8/5/2011 OR07 309 321 329 336 343 350 357 366 378 395
8/8/2011 OR04 415 429 439 447 455 463 472 482 495 455
8/9/2011 OR04 377 388 396 403 409 416 423 431 442 340
8/9/2011 OR08 356 364 371 376 381 386 391 398 406 466
8/11/2011 OR04 404 414 421 427 433 439 445 452 462 495
8/12/2011 OR07 456 466 474 480 486 492 498 506 516 463
8/15/2011 OR04 387 408 424 437 449 461 474 490 511 415
8/16/2011 OR02 198 211 221 230 238 246 254 264 278 175
8/17/2011 OR02 134 142 147 152 157 162 166 172 180 307
8/17/2011 OR07 170 185 196 206 215 223 233 244 259 180
8/17/2011 OR08 207 212 216 220 223 226 229 233 239 206
8/18/2011 OR06 445 458 467 474 482 489 496 505 518 493
8/18/2011 OR07 279 287 293 299 304 309 314 320 329 393
8/19/2011 OR07 439 451 460 467 474 480 487 496 508 425
8/19/2011 OR08 122 127 130 133 136 139 142 145 150 202
8/22/2011 OR04 389 410 426 439 452 464 477 493 515 460

148
Date OR 10% 20% 30% 40% 50% 60% 70% 80% 90% Actual Duration
8/22/2011 OR08 141 152 160 166 173 179 186 193 204 210
8/23/2011 OR06 193 206 216 224 232 239 248 257 270 250
8/23/2011 OR08 265 274 280 285 290 295 300 306 315 320
8/24/2011 OR01 452 485 509 529 548 567 588 612 645 590
8/24/2011 OR04 252 262 269 276 282 288 294 301 312 333
8/25/2011 OR04 369 379 386 392 397 403 408 415 425 458
8/26/2011 OR06 121 129 135 140 145 150 155 161 169 145
8/26/2011 OR07 299 309 315 321 327 332 338 345 354 342
8/29/2011 OR06 367 381 391 399 407 415 424 434 448 400
8/31/2011 OR01 267 280 289 297 304 312 320 329 341 280
9/1/2011 OR03 258 268 275 281 287 293 299 306 315 350
9/2/2011 OR01 324 347 364 378 391 404 418 435 458 265
9/2/2011 OR06 114 123 129 135 140 145 151 158 167 289
9/2/2011 OR07 381 394 403 411 418 425 433 442 455 390
9/6/2011 OR08 408 417 424 430 435 441 447 453 463 400
9/7/2011 OR07 147 165 179 190 201 211 222 236 254 205
9/8/2011 OR04 364 377 385 393 400 407 414 423 435 370
9/9/2011 OR02 361 370 377 383 388 393 399 406 415 380
9/9/2011 OR07 421 430 437 443 449 455 461 468 478 455
9/9/2011 OR08 223 228 232 235 237 240 243 247 252 237
9/12/2011 OR03 154 163 169 174 179 184 189 196 204 178
9/12/2011 OR04 394 415 430 443 455 467 480 495 516 440
9/13/2011 OR02 191 202 210 217 223 230 237 244 255 280
9/13/2011 OR08 354 362 368 372 377 382 386 392 400 380
9/14/2011 OR03 201 209 216 221 226 231 236 243 251 200
9/15/2011 OR01 211 223 231 238 245 251 258 267 278 317
9/15/2011 OR05 120 129 135 140 145 150 155 161 170 132
9/16/2011 OR04 190 201 209 216 222 229 235 243 254 358

149
Date OR 10% 20% 30% 40% 50% 60% 70% 80% 90% Actual Duration
9/16/2011 OR05 141 149 154 159 164 168 173 178 186 267
9/16/2011 OR07 225 238 248 256 264 271 280 289 303 287
9/16/2011 OR08 315 320 324 328 331 334 337 341 346 350
9/19/2011 OR01 307 327 342 354 365 377 389 404 424 300
9/19/2011 OR04 391 409 421 432 442 452 463 476 493 422
9/19/2011 OR06 118 128 136 142 148 154 160 168 178 224
9/20/2011 OR01 311 324 333 341 348 356 364 373 386 326
9/20/2011 OR04 254 266 274 282 288 295 302 310 322 224
9/20/2011 OR08 417 427 434 440 445 451 457 464 474 370
9/21/2011 OR04 346 356 364 370 376 382 388 395 405 345
9/22/2011 OR03 333 344 351 358 364 370 377 385 395 474
9/23/2011 OR07 274 285 292 298 304 310 317 324 334 385
9/26/2011 OR02 393 401 407 413 418 422 428 434 442 415
9/26/2011 OR04 384 398 407 416 424 431 440 449 463 515
9/27/2011 OR01 482 506 524 539 553 567 582 599 624 525
9/27/2011 OR04 397 408 416 423 430 436 443 451 462 438
9/27/2011 OR08 373 380 385 390 394 398 403 408 415 395
9/28/2011 OR02 397 406 412 418 423 428 433 440 449 380
9/28/2011 OR07 281 297 308 318 327 335 345 356 372 440
9/28/2011 OR08 226 237 246 253 260 266 273 282 294 322
9/29/2011 OR01 206 221 233 242 251 260 270 281 296 237
9/29/2011 OR04 386 397 405 412 418 424 431 439 450 436
9/30/2011 OR03 485 495 503 509 515 521 528 535 546 359
9/30/2011 OR04 248 259 267 274 280 286 293 301 312 212
9/30/2011 OR07 382 392 399 405 411 417 423 430 440 449
10/4/2011 OR08 292 298 302 305 308 312 315 319 325 345
10/5/2011 OR02 152 160 166 171 176 180 185 191 199 160
10/5/2011 OR03 188 201 211 220 227 235 244 254 267 172

150
Date OR 10% 20% 30% 40% 50% 60% 70% 80% 90% Actual Duration
10/5/2011 OR05 150 159 166 171 177 182 188 194 204 233
10/5/2011 OR07 270 279 286 292 298 303 309 316 325 403
10/5/2011 OR08 175 184 190 196 201 206 211 218 226 372
10/6/2011 OR04 370 380 387 393 399 405 411 418 427 410
10/6/2011 OR06 195 206 214 221 228 235 242 250 261 410
10/7/2011 OR07 426 435 441 447 452 457 463 469 478 362
10/12/2011 OR01 345 358 368 376 383 391 399 408 421 365
10/12/2011 OR04 247 256 263 269 274 279 285 292 301 336
10/13/2011 OR02 419 440 456 469 481 494 507 522 544 625
10/13/2011 OR05 383 394 402 409 415 422 429 437 448 425
10/14/2011 OR01 444 465 481 494 506 519 532 547 569 510
10/14/2011 OR08 229 239 245 251 257 262 268 275 284 340
10/17/2011 OR03 434 445 453 460 466 473 480 488 499 423
10/18/2011 OR01 328 338 345 351 357 363 369 376 386 295
10/18/2011 OR03 388 409 424 437 449 461 474 490 511 412
10/18/2011 OR04 501 518 530 541 550 560 570 582 599 460
10/19/2011 OR02 358 367 373 378 383 387 393 399 407 340
10/19/2011 OR05 122 131 138 144 149 154 160 166 175 90
10/19/2011 OR08 281 288 293 297 300 304 308 313 319 330
10/20/2011 OR03 220 236 248 258 267 277 286 298 314 287
10/20/2011 OR06 226 238 246 253 260 267 274 282 294 245
10/21/2011 OR01 201 210 217 223 228 234 240 246 256 210
10/21/2011 OR07 325 334 341 346 352 357 363 369 379 282
10/24/2011 OR02 395 405 411 417 422 428 433 440 449 400
10/24/2011 OR04 334 345 353 359 365 371 378 386 396 380
10/24/2011 OR07 420 442 458 471 483 496 509 524 546 580
10/26/2011 OR03 186 199 209 218 225 233 241 251 265 348
10/26/2011 OR05 335 345 353 359 365 370 377 384 394 324
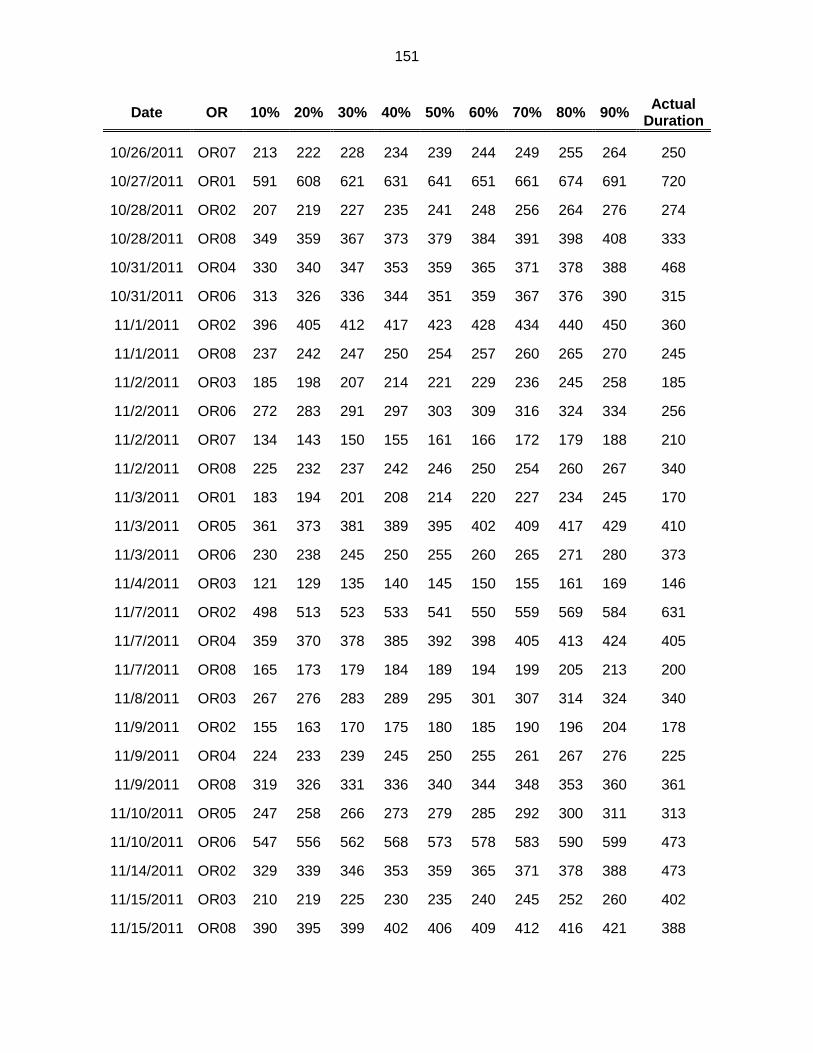
151
Date OR 10% 20% 30% 40% 50% 60% 70% 80% 90% Actual Duration
10/26/2011 OR07 213 222 228 234 239 244 249 255 264 250
10/27/2011 OR01 591 608 621 631 641 651 661 674 691 720
10/28/2011 OR02 207 219 227 235 241 248 256 264 276 274
10/28/2011 OR08 349 359 367 373 379 384 391 398 408 333
10/31/2011 OR04 330 340 347 353 359 365 371 378 388 468
10/31/2011 OR06 313 326 336 344 351 359 367 376 390 315
11/1/2011 OR02 396 405 412 417 423 428 434 440 450 360
11/1/2011 OR08 237 242 247 250 254 257 260 265 270 245
11/2/2011 OR03 185 198 207 214 221 229 236 245 258 185
11/2/2011 OR06 272 283 291 297 303 309 316 324 334 256
11/2/2011 OR07 134 143 150 155 161 166 172 179 188 210
11/2/2011 OR08 225 232 237 242 246 250 254 260 267 340
11/3/2011 OR01 183 194 201 208 214 220 227 234 245 170
11/3/2011 OR05 361 373 381 389 395 402 409 417 429 410
11/3/2011 OR06 230 238 245 250 255 260 265 271 280 373
11/4/2011 OR03 121 129 135 140 145 150 155 161 169 146
11/7/2011 OR02 498 513 523 533 541 550 559 569 584 631
11/7/2011 OR04 359 370 378 385 392 398 405 413 424 405
11/7/2011 OR08 165 173 179 184 189 194 199 205 213 200
11/8/2011 OR03 267 276 283 289 295 301 307 314 324 340
11/9/2011 OR02 155 163 170 175 180 185 190 196 204 178
11/9/2011 OR04 224 233 239 245 250 255 261 267 276 225
11/9/2011 OR08 319 326 331 336 340 344 348 353 360 361
11/10/2011 OR05 247 258 266 273 279 285 292 300 311 313
11/10/2011 OR06 547 556 562 568 573 578 583 590 599 473
11/14/2011 OR02 329 339 346 353 359 365 371 378 388 473
11/15/2011 OR03 210 219 225 230 235 240 245 252 260 402
11/15/2011 OR08 390 395 399 402 406 409 412 416 421 388

152
Date OR 10% 20% 30% 40% 50% 60% 70% 80% 90% Actual Duration
11/16/2011 OR04 243 252 259 264 269 274 280 286 295 265
11/16/2011 OR05 156 166 173 180 185 191 198 205 215 128
11/16/2011 OR08 204 211 216 220 225 229 233 238 245 350
11/17/2011 OR04 391 401 407 413 419 424 430 437 447 428
11/18/2011 OR08 255 266 273 280 286 292 299 306 317 265
11/21/2011 OR01 326 341 352 362 371 379 389 400 415 450
11/21/2011 OR02 169 178 185 190 196 201 207 213 222 123
11/21/2011 OR03 188 202 213 222 230 239 248 258 273 281
11/21/2011 OR06 194 208 217 225 233 241 249 258 272 168
11/21/2011 OR07 253 263 270 276 282 288 294 301 311 329
11/22/2011 OR08 488 497 504 510 515 521 527 534 543 475
11/23/2011 OR02 178 187 194 200 205 210 216 223 232 245
11/23/2011 OR03 189 202 212 220 228 235 243 253 266 189
11/28/2011 OR05 519 532 542 550 558 566 574 584 597 460
11/29/2011 OR03 220 233 242 250 258 266 274 283 296 249
11/29/2011 OR04 507 520 528 536 543 550 558 566 579 495
12/1/2011 OR01 324 336 345 353 360 367 375 383 396 370
12/1/2011 OR04 401 412 420 426 433 439 446 453 464 430
12/5/2011 OR03 323 337 347 356 364 372 381 391 405 292
12/5/2011 OR04 378 392 402 410 418 426 434 444 458 343
12/5/2011 OR06 182 196 206 214 222 230 239 249 262 205
12/5/2011 OR08 116 125 131 137 142 147 152 159 168 177
12/6/2011 OR03 444 454 461 467 473 479 485 492 502 377
12/6/2011 OR08 398 404 408 412 415 418 422 426 432 395
12/7/2011 OR01 357 372 383 392 401 410 420 431 446 256
12/7/2011 OR03 399 411 419 426 432 439 446 454 466 426
12/7/2011 OR05 119 127 133 138 142 147 152 157 165 114
12/7/2011 OR08 346 355 362 367 372 378 383 390 399 380

153
Date OR 10% 20% 30% 40% 50% 60% 70% 80% 90% Actual Duration
12/9/2011 OR07 205 214 221 227 232 238 244 251 260 244
12/9/2011 OR08 296 305 311 317 322 327 332 339 348 270
12/12/2011 OR04 503 517 527 536 544 552 561 571 585 345
12/12/2011 OR08 178 189 196 202 208 214 220 228 238 205
12/13/2011 OR04 231 241 249 255 260 266 272 279 289 364
12/14/2011 OR08 294 303 309 314 319 324 330 336 345 443
12/15/2011 OR04 290 304 314 323 331 339 347 358 372 350
12/15/2011 OR05 166 183 195 206 215 225 235 247 264 241
12/16/2011 OR04 417 426 433 439 444 449 455 461 471 459
12/16/2011 OR07 540 553 562 570 577 584 592 601 614 405
12/16/2011 OR08 353 364 371 378 384 390 396 404 414 403
12/19/2011 OR08 153 162 169 175 180 185 191 198 207 184
12/20/2011 OR08 335 342 348 352 356 361 365 371 378 285
12/21/2011 OR08 384 394 401 407 412 418 424 431 440 408
12/22/2011 OR06 226 234 239 244 248 252 257 262 269 262
12/28/2011 OR08 155 159 162 165 167 170 172 175 179 135
12/30/2011 OR07 289 298 305 311 316 321 327 334 343 328
Table 40: Empirical Percentile Values of the Distribution of the Duration of Surgery Lists from Monte Carlo Simulation
Date OR 10% 20% 30% 40% 50% 60% 70% 80% 90% Actual Duration
1/3/2011 OR04 362 373 382 391 399 409 421 437 464 391
1/3/2011 OR07 296 316 330 343 356 370 385 404 431 380
1/4/2011 OR01 312 339 360 380 400 422 447 479 529 403
1/4/2011 OR03 380 401 417 431 444 458 474 493 521 395
1/4/2011 OR08 255 270 281 292 302 312 324 339 361 335
1/5/2011 OR03 163 178 189 200 210 221 233 249 274 163
1/5/2011 OR08 231 243 252 261 268 277 286 298 315 318

154
Date OR 10% 20% 30% 40% 50% 60% 70% 80% 90% Actual Duration
1/6/2011 OR03 268 305 335 363 391 421 458 505 578 337
1/7/2011 OR02 176 191 204 215 226 238 252 270 297 370
1/7/2011 OR03 341 358 370 381 393 404 418 434 460 455
1/7/2011 OR07 199 216 231 244 256 270 285 305 335 300
1/10/2011 OR02 207 220 230 239 248 258 268 281 301 339
1/10/2011 OR04 365 375 384 393 401 411 423 439 465 385
1/11/2011 OR01 445 464 478 490 503 515 529 546 571 450
1/11/2011 OR08 251 264 274 283 291 300 310 322 339 290
1/12/2011 OR04 222 244 262 278 295 313 334 360 402 319
1/12/2011 OR07 193 209 222 233 245 257 272 289 317 200
1/13/2011 OR07 175 191 204 216 228 240 255 274 302 234
1/14/2011 OR04 161 180 195 208 222 237 253 275 308 227
1/14/2011 OR07 459 485 505 523 541 560 580 607 648 417
1/18/2011 OR08 216 224 231 237 243 248 255 262 273 240
1/19/2011 OR03 248 264 277 289 300 312 325 341 366 427
1/20/2011 OR04 355 376 393 408 422 438 455 477 510 360
1/21/2011 OR01 317 339 355 370 384 400 417 439 472 345
1/21/2011 OR02 162 177 189 200 212 224 237 255 282 342
1/21/2011 OR03 208 225 237 249 260 273 286 304 330 181
1/24/2011 OR02 501 530 552 572 591 610 632 659 698 615
1/24/2011 OR04 346 362 375 387 398 411 425 444 473 373
1/25/2011 OR01 448 495 532 566 600 636 678 730 811 560
1/25/2011 OR03 288 308 324 337 351 366 382 402 432 272
1/25/2011 OR04 413 443 467 488 509 531 557 590 640 407
1/25/2011 OR08 334 345 353 361 368 375 383 392 406 357
1/26/2011 OR01 69 82 94 105 116 129 145 166 202 55
1/26/2011 OR07 219 235 247 259 270 282 296 313 340 335
1/27/2011 OR04 325 353 375 395 415 436 460 490 534 442

155
Date OR 10% 20% 30% 40% 50% 60% 70% 80% 90% Actual Duration
1/28/2011 OR01 408 434 453 471 488 506 527 552 588 350
1/28/2011 OR02 178 194 206 217 229 241 254 272 299 207
1/28/2011 OR03 191 211 226 240 254 269 287 308 341 199
1/28/2011 OR07 242 259 272 284 296 309 323 342 371 250
1/31/2011 OR04 259 275 289 301 314 327 343 364 397 285
1/31/2011 OR07 220 237 250 262 274 286 300 318 345 245
2/1/2011 OR08 388 405 418 429 441 452 465 480 503 378
2/3/2011 OR04 302 332 356 377 399 421 447 479 529 447
2/4/2011 OR03 469 513 547 578 610 643 682 731 808 444
2/4/2011 OR07 166 179 189 199 209 219 231 246 271 174
2/4/2011 OR08 314 341 362 381 400 420 443 472 515 288
2/7/2011 OR07 265 279 290 300 309 319 330 343 363 330
2/8/2011 OR03 242 261 275 288 302 316 332 352 384 373
2/8/2011 OR04 376 385 391 397 404 410 418 428 445 450
2/8/2011 OR08 325 338 348 357 365 374 384 396 413 293
2/9/2011 OR03 297 316 330 343 356 370 386 405 435 393
2/9/2011 OR04 220 241 258 274 289 306 326 351 390 280
2/9/2011 OR07 155 169 179 188 198 208 219 233 255 280
2/10/2011 OR03 318 358 391 422 454 489 531 586 675 467
2/11/2011 OR07 319 343 362 380 398 417 438 465 508 328
2/11/2011 OR08 263 280 294 305 317 329 342 359 383 277
2/14/2011 OR02 362 379 392 404 415 427 439 455 478 390
2/14/2011 OR03 350 379 403 425 447 472 501 538 600 378
2/14/2011 OR04 335 352 365 377 389 402 416 435 465 447
2/15/2011 OR08 243 259 272 282 293 305 318 334 358 217
2/16/2011 OR02 236 249 260 269 278 288 299 313 334 277
2/16/2011 OR03 170 183 194 203 212 222 232 246 266 264
2/16/2011 OR04 214 240 261 281 300 322 347 379 430 337

156
Date OR 10% 20% 30% 40% 50% 60% 70% 80% 90% Actual Duration
2/16/2011 OR08 320 338 352 366 378 392 407 425 455 369
2/17/2011 OR03 250 269 284 298 311 325 341 361 391 277
2/17/2011 OR04 418 449 474 497 520 545 574 610 667 485
2/18/2011 OR04 259 282 300 318 336 355 377 406 452 355
2/18/2011 OR07 286 308 325 340 354 370 388 409 443 421
2/18/2011 OR08 277 294 307 319 332 344 359 378 407 208
2/22/2011 OR06 219 238 252 266 279 294 310 331 363 265
2/22/2011 OR08 245 255 262 268 274 281 287 296 308 258
2/23/2011 OR03 231 249 262 274 287 299 313 331 357 380
2/23/2011 OR07 186 202 215 227 239 251 265 283 310 251
2/23/2011 OR08 109 116 122 126 131 136 142 149 159 126
2/24/2011 OR03 382 416 444 470 496 525 560 605 678 441
2/24/2011 OR04 157 171 182 192 203 214 227 245 274 317
2/28/2011 OR04 344 356 365 374 383 394 406 422 448 405
3/1/2011 OR03 289 312 330 347 363 379 398 422 458 355
3/1/2011 OR04 205 220 232 243 254 266 280 298 326 225
3/2/2011 OR02 75 85 94 102 110 119 130 144 168 200
3/2/2011 OR04 244 262 276 290 304 320 340 365 408 286
3/2/2011 OR08 188 204 216 228 239 251 265 282 309 200
3/3/2011 OR02 452 470 484 497 509 521 536 553 579 495
3/4/2011 OR03 233 248 261 272 283 295 309 327 354 267
3/4/2011 OR08 336 355 370 384 397 411 427 448 480 271
3/7/2011 OR04 335 352 365 377 389 402 417 435 465 423
3/7/2011 OR07 176 190 201 210 220 230 241 255 277 230
3/8/2011 OR03 166 181 193 204 215 227 241 258 283 258
3/8/2011 OR04 304 327 346 363 380 398 419 445 486 385
3/8/2011 OR08 379 398 412 425 437 451 465 482 508 349
3/9/2011 OR04 259 283 303 321 339 358 380 407 449 465

157
Date OR 10% 20% 30% 40% 50% 60% 70% 80% 90% Actual Duration
3/9/2011 OR08 173 181 187 193 199 204 211 219 230 200
3/10/2011 OR01 254 280 301 320 339 359 382 412 457 240
3/10/2011 OR04 201 224 241 258 274 291 311 336 376 287
3/10/2011 OR07 234 252 267 280 293 306 321 340 367 415
3/11/2011 OR03 220 238 252 265 277 290 304 322 349 256
3/11/2011 OR04 223 244 260 275 289 304 322 344 378 213
3/11/2011 OR07 156 170 182 193 204 216 229 246 274 245
3/11/2011 OR08 176 191 203 214 225 237 251 269 299 219
3/14/2011 OR04 202 219 232 244 256 269 284 303 332 440
3/15/2011 OR08 328 347 362 375 388 401 416 434 462 305
3/16/2011 OR04 166 177 186 193 201 209 218 230 248 248
3/16/2011 OR08 249 267 280 293 305 317 332 351 379 343
3/17/2011 OR01 254 278 296 312 329 346 366 391 428 450
3/17/2011 OR03 222 239 252 263 275 287 300 317 342 279
3/17/2011 OR04 359 379 394 408 422 437 454 475 508 443
3/18/2011 OR04 206 223 237 250 263 277 293 312 343 270
3/18/2011 OR07 192 207 218 229 239 250 263 280 305 272
3/18/2011 OR08 200 208 213 218 223 228 234 240 250 197
3/21/2011 OR02 365 385 401 415 428 442 457 476 503 480
3/21/2011 OR03 424 448 466 482 498 514 533 555 588 501
3/21/2011 OR04 342 362 378 392 406 421 438 459 492 460
3/21/2011 OR08 183 197 207 216 226 235 246 260 280 255
3/22/2011 OR03 451 470 485 499 511 525 540 558 585 487
3/23/2011 OR07 98 109 117 124 132 140 149 162 181 147
3/24/2011 OR04 354 379 399 417 434 452 473 498 537 488
3/24/2011 OR07 187 202 215 227 238 251 266 285 315 220
3/25/2011 OR01 347 380 407 431 455 481 510 546 602 288
3/25/2011 OR04 221 236 248 259 270 282 295 313 342 330

158
Date OR 10% 20% 30% 40% 50% 60% 70% 80% 90% Actual Duration
3/25/2011 OR07 445 469 489 506 524 542 563 590 629 440
3/25/2011 OR08 194 201 206 211 216 221 226 233 243 260
3/28/2011 OR03 359 379 394 407 421 434 450 469 498 483
3/28/2011 OR04 390 409 423 436 449 462 477 496 526 447
3/28/2011 OR08 190 207 220 231 243 256 270 287 314 230
3/29/2011 OR02 377 396 411 424 437 450 464 482 507 400
3/29/2011 OR04 431 459 480 500 519 539 562 591 634 601
3/29/2011 OR08 244 257 268 277 286 295 305 317 335 290
3/30/2011 OR01 261 277 290 301 312 325 339 358 388 297
3/31/2011 OR04 224 239 251 263 274 288 303 325 361 365
4/1/2011 OR02 164 177 187 196 205 215 226 241 265 185
4/1/2011 OR03 141 155 166 177 187 198 210 226 249 185
4/4/2011 OR06 478 509 532 553 573 594 617 646 688 645
4/4/2011 OR07 245 260 272 283 294 304 316 331 353 232
4/4/2011 OR08 140 150 157 164 171 178 186 196 210 187
4/5/2011 OR04 143 155 165 175 184 194 207 223 250 147
4/6/2011 OR06 189 208 222 236 250 265 281 303 335 190
4/7/2011 OR01 338 366 388 409 431 454 482 518 578 537
4/7/2011 OR02 387 404 416 428 438 449 462 477 498 450
4/7/2011 OR03 439 458 473 485 498 511 526 543 570 626
4/7/2011 OR04 369 394 414 432 450 468 489 514 552 460
4/7/2011 OR07 375 405 428 450 471 495 520 553 604 410
4/8/2011 OR04 180 203 222 240 258 277 300 328 373 250
4/11/2011 OR04 516 550 577 601 624 649 677 711 763 510
4/11/2011 OR07 261 278 291 302 314 326 340 358 386 427
4/11/2011 OR08 156 167 175 182 190 197 206 216 231 217
4/13/2011 OR01 456 480 499 516 532 549 569 592 627 429
4/13/2011 OR04 409 436 457 477 496 518 543 575 626 392

159
Date OR 10% 20% 30% 40% 50% 60% 70% 80% 90% Actual Duration
4/14/2011 OR04 614 637 654 670 685 702 721 745 783 632
4/14/2011 OR07 213 238 258 277 296 316 339 368 414 284
4/15/2011 OR07 326 346 361 375 388 403 420 441 474 328
4/15/2011 OR08 191 203 213 221 229 238 247 259 277 196
4/18/2011 OR02 601 624 641 655 669 683 699 717 744 685
4/18/2011 OR03 291 316 335 353 370 388 409 435 476 341
4/18/2011 OR04 340 356 368 379 390 401 415 432 460 495
4/19/2011 OR06 149 161 170 178 186 195 204 216 234 150
4/20/2011 OR04 286 309 327 344 360 378 398 423 461 310
4/20/2011 OR06 177 193 206 218 230 243 257 275 303 160
4/20/2011 OR07 117 128 137 145 153 161 171 183 203 165
4/20/2011 OR08 120 127 131 135 139 143 148 153 162 170
4/21/2011 OR04 627 654 675 694 712 731 752 779 820 583
4/22/2011 OR03 265 281 292 303 313 324 337 352 374 324
4/22/2011 OR04 271 293 310 325 341 358 377 401 437 380
4/22/2011 OR07 357 381 400 417 434 452 472 497 535 274
4/22/2011 OR08 245 259 270 279 288 298 308 321 340 365
4/25/2011 OR03 570 601 625 649 672 699 732 776 856 675
4/26/2011 OR01 357 379 397 412 427 443 461 484 520 462
4/26/2011 OR02 268 283 295 305 315 326 337 352 374 260
4/26/2011 OR08 200 208 214 220 225 231 237 245 255 194
4/27/2011 OR01 529 560 585 608 630 653 679 712 762 482
4/27/2011 OR04 373 393 408 422 436 450 467 487 519 385
4/28/2011 OR01 124 136 145 154 163 173 184 198 219 262
4/29/2011 OR01 177 193 206 217 229 241 255 273 300 190
4/29/2011 OR07 324 345 363 378 394 411 430 454 491 340
4/29/2011 OR08 334 356 374 390 405 421 440 463 499 340
5/2/2011 OR01 535 583 622 656 691 727 770 823 907 670

160
Date OR 10% 20% 30% 40% 50% 60% 70% 80% 90% Actual Duration
5/2/2011 OR03 425 459 486 511 538 568 603 652 737 608
5/2/2011 OR04 388 407 422 434 447 460 475 494 524 398
5/2/2011 OR08 147 157 165 173 180 189 198 211 230 195
5/3/2011 OR08 283 299 310 320 330 341 352 366 386 278
5/4/2011 OR04 346 364 379 392 405 419 434 454 485 272
5/4/2011 OR08 202 214 222 230 238 246 254 265 281 217
5/5/2011 OR04 479 501 519 536 553 571 593 621 664 486
5/5/2011 OR07 260 291 317 341 366 393 424 465 530 285
5/6/2011 OR03 152 167 178 189 200 212 225 242 268 163
5/6/2011 OR04 282 308 329 348 366 387 410 438 482 335
5/6/2011 OR07 245 264 280 294 308 322 339 361 394 270
5/6/2011 OR08 272 288 301 312 322 334 346 361 383 330
5/9/2011 OR01 284 304 319 332 346 360 376 395 425 370
5/9/2011 OR03 374 396 412 427 441 455 471 491 520 354
5/9/2011 OR07 168 182 193 203 213 223 236 251 275 220
5/10/2011 OR08 531 547 559 569 578 588 598 611 629 420
5/11/2011 OR02 269 292 310 327 343 360 380 404 441 233
5/11/2011 OR04 260 282 300 315 331 348 367 391 428 340
5/12/2011 OR01 438 472 499 525 551 578 611 653 721 280
5/12/2011 OR07 211 225 235 244 253 262 273 285 305 200
5/13/2011 OR07 476 507 531 553 575 598 624 655 703 430
5/16/2011 OR01 171 189 203 216 230 244 261 282 315 195
5/16/2011 OR04 364 381 395 408 420 433 448 467 497 497
5/18/2011 OR02 124 136 145 154 163 173 183 197 219 235
5/19/2011 OR02 346 361 373 383 392 402 413 427 446 435
5/20/2011 OR03 193 206 216 224 233 242 252 265 285 288
5/20/2011 OR07 185 194 201 207 213 220 228 238 256 245
5/20/2011 OR08 252 266 277 286 296 307 319 334 357 366

161
Date OR 10% 20% 30% 40% 50% 60% 70% 80% 90% Actual Duration
5/23/2011 OR04 365 380 392 403 413 425 438 455 482 360
5/24/2011 OR02 339 356 368 380 390 402 414 429 451 475
5/24/2011 OR04 149 163 175 185 196 207 220 237 262 190
5/25/2011 OR07 499 524 542 559 574 591 609 630 662 480
5/26/2011 OR02 341 357 369 379 389 399 411 424 445 398
5/26/2011 OR03 263 287 305 323 340 358 380 407 449 410
5/27/2011 OR08 247 256 263 269 275 281 287 295 306 327
5/31/2011 OR04 295 314 329 342 355 369 384 403 431 330
6/1/2011 OR02 131 140 147 154 161 168 177 188 207 193
6/2/2011 OR02 382 397 409 419 429 439 450 464 483 429
6/2/2011 OR03 203 227 245 263 281 300 324 354 404 293
6/3/2011 OR02 153 166 176 185 194 203 214 227 248 182
6/6/2011 OR04 391 420 443 463 483 504 528 559 605 444
6/6/2011 OR06 362 388 407 426 443 461 482 508 546 405
6/7/2011 OR04 162 176 187 197 206 216 228 243 266 275
6/7/2011 OR08 278 294 308 319 331 343 358 376 405 430
6/8/2011 OR04 458 484 504 522 540 558 580 606 647 530
6/10/2011 OR08 224 234 242 248 255 262 269 278 291 276
6/13/2011 OR03 365 392 414 434 453 475 499 529 578 414
6/13/2011 OR04 591 616 635 652 669 688 708 733 774 695
6/13/2011 OR06 390 418 440 459 479 499 522 551 594 415
6/14/2011 OR04 261 277 289 300 311 322 335 351 375 340
6/15/2011 OR07 153 166 176 186 196 206 218 234 259 112
6/15/2011 OR08 174 183 190 197 203 209 216 225 237 220
6/17/2011 OR04 271 290 304 318 331 344 360 379 409 305
6/20/2011 OR04 215 227 237 246 256 266 278 295 323 250
6/20/2011 OR08 172 184 193 202 210 219 229 241 260 305
6/21/2011 OR08 190 204 216 226 236 247 258 273 295 337

162
Date OR 10% 20% 30% 40% 50% 60% 70% 80% 90% Actual Duration
6/22/2011 OR01 228 245 258 269 281 294 308 327 356 283
6/22/2011 OR08 181 190 198 204 211 217 224 233 246 190
6/23/2011 OR03 206 220 231 241 250 260 272 285 307 243
6/27/2011 OR02 355 372 384 394 405 416 427 442 463 555
6/27/2011 OR03 304 325 341 355 369 384 400 420 449 394
6/27/2011 OR04 358 372 383 393 402 413 426 442 470 415
6/28/2011 OR08 379 403 422 438 454 471 490 513 548 335
6/30/2011 OR01 289 323 351 377 403 432 466 510 584 465
6/30/2011 OR02 526 535 542 548 554 561 568 577 591 658
6/30/2011 OR03 338 360 377 392 407 422 440 461 493 420
7/1/2011 OR03 369 395 415 434 453 473 497 527 574 516
7/1/2011 OR08 356 379 397 412 428 444 462 485 518 545
7/5/2011 OR04 254 267 276 285 294 303 313 326 346 328
7/6/2011 OR01 252 266 277 286 295 305 316 329 349 250
7/6/2011 OR07 168 176 183 188 194 200 208 216 230 250
7/7/2011 OR04 356 378 395 410 425 441 458 481 514 600
7/8/2011 OR04 288 306 321 334 347 360 376 395 424 339
7/8/2011 OR07 83 90 95 101 106 113 120 130 148 470
7/11/2011 OR03 376 404 425 444 463 483 506 534 578 432
7/11/2011 OR04 438 459 475 490 505 522 540 564 602 463
7/13/2011 OR02 138 147 155 161 168 175 184 195 214 190
7/13/2011 OR04 356 373 386 398 410 423 437 456 485 450
7/13/2011 OR08 172 191 207 221 236 252 269 293 328 358
7/14/2011 OR03 477 502 520 537 553 569 588 610 643 542
7/14/2011 OR07 264 289 309 328 347 367 390 421 469 365
7/15/2011 OR03 178 192 203 213 223 233 245 259 281 152
7/18/2011 OR03 191 207 219 230 240 252 265 281 305 362
7/18/2011 OR04 254 269 281 292 303 315 329 347 376 458

163
Date OR 10% 20% 30% 40% 50% 60% 70% 80% 90% Actual Duration
7/18/2011 OR06 291 319 340 359 379 400 423 453 499 343
7/18/2011 OR07 352 380 401 421 440 460 483 510 553 390
7/19/2011 OR01 247 276 299 321 343 367 395 430 489 438
7/19/2011 OR04 394 419 438 455 472 489 509 534 569 470
7/20/2011 OR01 226 245 259 273 286 300 316 337 369 363
7/20/2011 OR03 398 420 437 452 466 481 498 519 550 557
7/21/2011 OR04 391 421 444 465 485 506 530 560 605 660
7/21/2011 OR07 268 285 298 310 322 333 346 363 387 313
7/22/2011 OR01 242 269 292 313 335 359 387 423 484 315
7/22/2011 OR07 321 342 359 374 389 405 423 445 480 415
7/25/2011 OR03 296 309 320 329 338 348 360 374 395 560
7/25/2011 OR07 301 317 330 341 351 362 375 390 413 390
7/28/2011 OR02 246 263 277 288 300 312 325 342 366 344
7/29/2011 OR01 244 261 274 285 296 308 322 339 365 330
7/29/2011 OR03 142 156 168 178 189 200 213 230 256 409
7/29/2011 OR04 135 146 155 163 171 180 189 202 221 175
7/29/2011 OR07 251 269 283 296 309 322 338 357 388 265
8/1/2011 OR02 379 400 415 429 442 456 471 490 518 380
8/1/2011 OR03 447 476 498 518 537 558 580 608 649 630
8/3/2011 OR04 235 250 262 272 283 295 308 326 354 235
8/5/2011 OR07 273 293 309 323 338 353 369 390 421 395
8/8/2011 OR04 386 407 423 438 452 467 484 506 539 455
8/9/2011 OR04 340 361 377 391 406 420 437 457 487 340
8/9/2011 OR08 313 333 349 363 377 392 409 429 462 466
8/11/2011 OR04 380 396 407 418 429 440 454 471 499 495
8/12/2011 OR07 394 420 441 459 477 497 518 545 585 463
8/15/2011 OR04 350 380 403 424 445 467 491 522 568 415
8/16/2011 OR02 179 195 209 220 232 245 259 278 306 175

164
Date OR 10% 20% 30% 40% 50% 60% 70% 80% 90% Actual Duration
8/17/2011 OR02 118 128 136 144 151 159 169 182 202 307
8/17/2011 OR07 155 171 183 194 205 217 232 251 282 180
8/17/2011 OR08 189 200 207 214 221 228 236 245 259 206
8/18/2011 OR06 385 415 438 458 479 500 524 553 597 493
8/18/2011 OR07 253 268 280 290 300 311 323 338 361 393
8/19/2011 OR07 378 404 424 443 461 480 503 532 575 425
8/19/2011 OR08 113 120 125 130 135 140 145 152 162 202
8/22/2011 OR04 350 380 404 426 447 470 495 526 574 460
8/22/2011 OR08 123 137 148 158 168 178 190 206 230 210
8/23/2011 OR06 169 186 200 213 226 240 256 276 309 250
8/23/2011 OR08 231 247 260 272 284 297 313 333 364 320
8/24/2011 OR01 405 444 476 505 534 565 600 645 715 590
8/24/2011 OR04 223 240 254 266 279 292 308 327 358 333
8/25/2011 OR04 346 361 372 382 393 404 417 433 461 458
8/26/2011 OR06 109 119 127 135 142 150 159 170 188 145
8/26/2011 OR07 254 273 289 304 318 334 352 375 411 342
8/29/2011 OR06 317 344 365 383 402 422 444 473 515 400
8/31/2011 OR01 238 258 274 287 301 316 333 354 386 280
9/1/2011 OR03 242 255 266 275 284 294 304 317 337 350
9/2/2011 OR01 280 310 335 357 379 404 432 469 526 265
9/2/2011 OR06 101 111 120 128 136 144 154 167 187 289
9/2/2011 OR07 339 360 377 392 408 424 443 467 504 390
9/6/2011 OR08 356 379 397 414 431 448 468 493 533 400
9/7/2011 OR07 141 157 169 181 193 206 220 239 269 205
9/8/2011 OR04 334 354 370 384 397 411 427 448 479 370
9/9/2011 OR02 331 348 361 373 384 396 410 428 454 380
9/9/2011 OR07 365 389 407 424 440 458 477 502 538 455
9/9/2011 OR08 209 218 224 230 236 242 249 256 268 237

165
Date OR 10% 20% 30% 40% 50% 60% 70% 80% 90% Actual Duration
9/12/2011 OR03 142 152 160 167 174 182 192 203 222 178
9/12/2011 OR04 355 386 409 430 450 472 497 528 572 440
9/13/2011 OR02 172 187 198 209 219 230 242 258 282 280
9/13/2011 OR08 317 334 348 360 373 385 400 419 447 380
9/14/2011 OR03 177 190 200 210 220 230 242 257 282 200
9/15/2011 OR01 195 209 221 231 241 251 263 277 299 317
9/15/2011 OR05 95 109 120 130 141 153 167 185 216 132
9/16/2011 OR04 171 186 197 208 218 229 242 257 281 358
9/16/2011 OR05 129 138 146 152 159 167 175 187 205 267
9/16/2011 OR07 191 211 227 241 255 271 288 311 347 287
9/16/2011 OR08 293 305 314 322 329 337 345 355 370 350
9/19/2011 OR01 283 306 325 342 359 376 396 421 458 300
9/19/2011 OR04 360 384 403 420 437 455 476 501 541 422
9/19/2011 OR06 100 113 124 134 143 154 166 182 206 224
9/20/2011 OR01 287 306 320 333 345 357 372 389 415 326
9/20/2011 OR04 232 249 262 273 285 297 310 327 353 224
9/20/2011 OR08 364 389 409 426 444 462 482 506 544 370
9/21/2011 OR04 300 323 341 358 374 392 413 439 480 345
9/22/2011 OR03 300 319 334 347 360 374 389 408 436 474
9/23/2011 OR07 234 254 269 283 297 311 328 349 381 385
9/26/2011 OR02 378 390 399 408 416 424 433 444 461 415
9/26/2011 OR04 355 376 392 407 421 436 453 474 506 515
9/27/2011 OR01 436 470 497 520 544 569 598 633 687 525
9/27/2011 OR04 359 380 396 411 425 440 457 478 509 438
9/27/2011 OR08 344 359 371 381 392 402 413 427 447 395
9/28/2011 OR02 380 393 403 412 420 429 439 451 469 380
9/28/2011 OR07 249 270 286 301 316 332 350 373 409 440
9/28/2011 OR08 202 218 230 241 252 264 278 295 322 322

166
Date OR 10% 20% 30% 40% 50% 60% 70% 80% 90% Actual Duration
9/29/2011 OR01 173 193 210 226 242 259 279 306 348 237
9/29/2011 OR04 359 377 390 403 415 428 442 461 490 436
9/30/2011 OR03 434 459 478 495 512 530 550 576 616 359
9/30/2011 OR04 229 244 256 267 278 289 302 318 343 212
9/30/2011 OR07 330 353 371 388 404 421 440 464 501 449
10/4/2011 OR08 268 281 290 298 307 315 324 336 352 345
10/5/2011 OR02 141 151 158 165 172 179 188 199 218 160
10/5/2011 OR03 170 185 198 209 221 234 249 267 296 172
10/5/2011 OR05 119 136 149 162 175 189 205 226 261 233
10/5/2011 OR07 241 258 271 282 293 305 318 335 361 403
10/5/2011 OR08 153 166 176 186 195 206 218 234 260 372
10/6/2011 OR04 347 362 374 384 395 406 420 437 465 410
10/6/2011 OR06 176 191 203 214 224 235 247 263 287 410
10/7/2011 OR07 373 395 412 427 443 459 477 501 536 362
10/12/2011 OR01 317 337 352 366 380 394 411 431 463 365
10/12/2011 OR04 226 239 250 260 270 280 293 310 337 336
10/13/2011 OR02 383 413 435 455 475 495 519 548 590 625
10/13/2011 OR05 356 374 387 399 412 425 440 458 488 425
10/14/2011 OR01 399 430 454 477 499 522 548 581 633 510
10/14/2011 OR08 203 219 231 242 253 264 276 292 315 340
10/17/2011 OR03 399 420 435 449 463 477 492 511 539 423
10/18/2011 OR01 298 315 329 341 353 365 379 396 422 295
10/18/2011 OR03 336 367 393 416 439 465 496 534 595 412
10/18/2011 OR04 471 494 512 528 544 562 581 605 641 460
10/19/2011 OR02 325 341 354 365 377 390 405 424 453 340
10/19/2011 OR05 95 110 121 132 144 157 172 192 224 90
10/19/2011 OR08 257 269 279 287 296 304 314 327 346 330
10/20/2011 OR03 198 218 233 247 262 277 295 317 351 287

167
Date OR 10% 20% 30% 40% 50% 60% 70% 80% 90% Actual Duration
10/20/2011 OR06 207 223 235 246 257 268 280 296 319 245
10/21/2011 OR01 184 197 207 216 225 234 245 259 279 210
10/21/2011 OR07 278 298 314 329 343 358 375 397 431 282
10/24/2011 OR02 377 391 402 411 420 429 440 452 471 400
10/24/2011 OR04 309 325 338 350 362 374 388 407 435 380
10/24/2011 OR07 359 397 428 456 484 514 548 592 660 580
10/26/2011 OR03 167 183 196 208 220 233 248 266 295 348
10/26/2011 OR05 291 313 331 347 363 381 401 427 469 324
10/26/2011 OR07 190 203 213 222 232 242 254 269 293 250
10/27/2011 OR01 532 565 591 614 636 659 685 717 764 720
10/28/2011 OR02 185 201 214 226 238 250 264 282 310 274
10/28/2011 OR08 307 329 345 360 374 390 407 429 460 333
10/31/2011 OR04 306 322 333 344 355 366 380 397 425 468
10/31/2011 OR06 282 302 318 332 345 360 376 396 425 315
11/1/2011 OR02 377 391 402 412 421 430 440 453 471 360
11/1/2011 OR08 219 230 238 245 252 259 267 277 291 245
11/2/2011 OR03 170 184 195 206 216 227 240 256 280 185
11/2/2011 OR06 246 262 275 287 298 310 323 340 366 256
11/2/2011 OR07 118 130 139 147 156 165 176 189 210 210
11/2/2011 OR08 205 217 225 233 241 249 259 271 291 340
11/3/2011 OR01 164 178 189 199 209 220 232 249 275 170
11/3/2011 OR05 333 352 367 380 392 406 421 440 470 410
11/3/2011 OR06 215 227 236 244 252 260 270 281 299 373
11/4/2011 OR03 112 120 127 133 139 146 154 165 183 146
11/7/2011 OR02 462 486 503 520 535 552 570 593 627 631
11/7/2011 OR04 333 351 364 376 388 401 416 434 464 405
11/7/2011 OR08 148 160 169 178 186 195 205 217 236 200
11/8/2011 OR03 236 253 267 280 292 305 319 337 365 340

168
Date OR 10% 20% 30% 40% 50% 60% 70% 80% 90% Actual Duration
11/9/2011 OR02 144 154 161 168 174 182 190 201 219 178
11/9/2011 OR04 202 215 226 236 246 256 269 286 314 225
11/9/2011 OR08 290 305 316 326 335 345 357 371 392 361
11/10/2011 OR05 218 236 250 263 276 290 307 328 362 313
11/10/2011 OR06 510 529 544 557 569 583 597 614 640 473
11/14/2011 OR02 298 315 329 341 353 366 381 399 428 473
11/15/2011 OR03 197 208 216 224 231 239 249 260 277 402
11/15/2011 OR08 363 376 386 396 404 413 422 434 451 388
11/16/2011 OR04 222 235 245 255 264 275 287 304 331 265
11/16/2011 OR05 123 141 155 169 183 199 217 239 276 128
11/16/2011 OR08 186 196 205 212 220 228 237 248 267 350
11/17/2011 OR04 374 388 398 408 417 426 436 449 467 428
11/18/2011 OR08 226 243 257 269 281 293 308 326 354 265
11/21/2011 OR01 273 300 322 342 362 384 410 443 496 450
11/21/2011 OR02 155 167 177 186 195 204 214 227 246 123
11/21/2011 OR03 163 182 196 210 224 238 255 277 310 281
11/21/2011 OR06 176 192 205 217 228 240 254 270 296 168
11/21/2011 OR07 224 241 255 267 279 291 305 323 349 329
11/22/2011 OR08 443 465 481 497 512 529 548 573 615 475
11/23/2011 OR02 159 172 182 191 200 210 221 235 256 245
11/23/2011 OR03 172 188 200 211 222 234 247 264 289 189
11/28/2011 OR05 468 495 516 536 556 577 601 631 681 460
11/29/2011 OR03 199 217 231 243 256 269 283 302 330 249
11/29/2011 OR04 484 502 516 528 540 552 566 582 608 495
12/1/2011 OR01 297 316 331 344 357 370 386 405 434 370
12/1/2011 OR04 376 393 406 418 429 442 456 474 502 430
12/5/2011 OR03 298 318 334 347 360 374 390 409 437 292
12/5/2011 OR04 348 369 386 401 415 431 448 470 503 343

169
Date OR 10% 20% 30% 40% 50% 60% 70% 80% 90% Actual Duration
12/5/2011 OR06 165 181 194 205 217 229 243 260 286 205
12/5/2011 OR08 104 114 122 129 137 145 154 166 186 177
12/6/2011 OR03 412 430 444 457 470 483 498 516 543 377
12/6/2011 OR08 369 383 394 404 413 422 433 445 463 395
12/7/2011 OR01 315 341 361 380 398 418 440 467 509 256
12/7/2011 OR03 355 378 396 412 427 443 461 484 518 426
12/7/2011 OR05 100 110 119 128 136 146 158 174 201 114
12/7/2011 OR08 304 323 338 351 364 378 394 414 445 380
12/9/2011 OR07 181 194 205 215 225 235 248 264 290 244
12/9/2011 OR08 259 278 292 305 318 332 347 366 394 270
12/12/2011 OR04 446 476 500 522 543 565 590 622 670 345
12/12/2011 OR08 159 173 184 194 204 215 227 242 265 205
12/13/2011 OR04 212 226 237 247 257 267 278 293 315 364
12/14/2011 OR08 262 279 291 303 314 326 339 355 380 443
12/15/2011 OR04 266 284 299 312 326 340 357 378 412 350
12/15/2011 OR05 140 162 179 196 213 232 254 285 334 241
12/16/2011 OR04 377 397 412 426 440 454 470 490 520 459
12/16/2011 OR07 465 498 524 547 569 593 620 653 703 405
12/16/2011 OR08 308 329 346 362 378 395 415 441 482 403
12/19/2011 OR08 137 149 159 168 176 186 196 210 230 184
12/20/2011 OR08 304 320 332 343 354 365 377 392 414 285
12/21/2011 OR08 339 360 376 390 405 420 437 459 492 408
12/22/2011 OR06 204 217 227 236 245 254 264 277 296 262
12/28/2011 OR08 144 151 157 161 166 171 176 182 192 135
12/30/2011 OR07 258 275 288 300 312 324 338 356 382 328

170
REFERENCES
Abouleish, A. E., S. L. Hensley, et al. (2003). “Inclusion of turnover time does not influence
identification of surgical services that over- and underutilized allocated block time.”
Anesthesia and Analgesia 96: 813 – 818.
Abouleish, A. E., D. S. Prough, and C. W. Whitten (2002). “Comparing clinical productivity of
anesthesiology groups.” Anesthesiology 97: 608 – 615.
Alshekhli, O., D. C. Y. Foo, et al. (2011). “Process simulation and debottlenecking for an
industrial cocoa manufacturing process.” Food and Bioproducts Processing 89: 528 –
536.
Alvarez, R., R. Bowry, and M. Carter (2010). “Prediction of the time to complete a series of
surgical cases to avoid cardiac operating room overutilization.” Canadian Journal of
Anesthesia 57: 973 – 979.
Arakelian, E., L. Gunningberg, et al. (2011). “How operating room efficiency is understood in a
surgical team: a qualitative study.” International Journal of Quality Health Care 23: 100 –
106.
Arnaout, J. M. and S. Kulbashian (2008). “Maximizing the utilization of operating rooms with
stochastic times using simulation.” IEEE Proceedings of the 2008 Simulation
Conference: 1617 – 1623.
Ballard, S. M. and M. E. Kuhl (2006). “The use of simulation to determine maximum capacity in
the surgical suite operating room.” Proceedings of the 2006 Winter Simulation
Conference: 433 – 438.
Beaulieu, N. and Q. Xie (2004). “An optimal lognormal approximation to lognormal sum
distributions.” IEEE Transactions on Vehicular Technology 53: 479 – 489.
Cady, F. and D. M. Allen (1972). “Combining experiments to predict future yield data.”
Agronomy Journal 64: 211 – 214.

171
Cassera, M. A., B. Zheng, et al. (2009). “Surgical time independently affected by surgical team
size.” The American Journal of Surgery 198: 216 – 222.
Chang, Q., J. Ni, et al. (2007a). “Maintenance opportunity planning system.” ASME Transaction,
Journal of Manufacturing Science and Engineering 129: 661 – 668.
Chang, Q., J. Ni, et al. (2007b). “Supervisory factory control based on real-time production
feedback.” ASME Transaction, Journal of Manufacturing Science and Engineering 129:
653 – 660.
Chopra, S. and P. Meindl (2006). Supply Chain Management: Strategy, Planning and
Operations, 3rd Edition. NJ., Prentice Hall, New Jersey.
Cipriano, L., B. Chesworth, et al. (2007). “Predicting joint replacement waiting times.” Health
Care Management Science 10(2): 195 – 215.
CMS (2010). National health expenditure projectsions 2010 – 2020. Center for Medicare and
Medicaid Services, US Department of Health and Human Services.
Cranfield, J. and M. Soljak (1989). “Use of time information to maximize theatre utilization.”
Australian Health Revies 12(3): 5 – 15.
Dekker, R. and E. Smeitink (1994). “Preventive maintenance at opportunities of restricted
duration.” Naval Research Logistics 41: 335 - 353.
Dekker, R. (1995). “Integrating optimisation, priority setting, planning and combining of
maintenance activities.” European Journal of Operational Research 82: 225 – 240.
Denton, B., J. Viapiano, and A. Vogl (2007). “Optimization of surgery sequencing and
scheduling decisions under uncertainty.” Health Care Management Science 10: 13 – 24.
Denton, B. T., A. S. Rahman, et al. (2006). “Simulation of a multiple operating room surgical
suite.” Proceedings of the 38th Conference on Winter Simulation: Winter Simulation
Conference 2006: 414 – 424.
Dexter, E. U., F. Dexter, et al. (2009).”Both bias and lack of knowledge influence organizational
focus on first case of the day starts.” Anesthesia and Analgesia 108: 1257 – 1261.

172
Dexter, F (1996). “Application of prediction levels to operating room scheduling.” AORN Journal
63: 607 – 615.
Dexter, F., A. E. Abouleish, et al. (2003). “Use of operating room information system data to
predict the impact of reducing turnover times on staffing costs.” Anesthesia and
Analgesia 97: 1119 - 1126.
Dexter, F. and R. H. Epstein (2009). “Typical savings from each minute reduction in tardy first
case of the day starts.” Anesthesia and Analgesia 108: 1262 – 1267.
Dexter, F., R. H. Epstein, et al. (2005). “Estimating the incidence of prolonged turnover times
and delays by time of day.” Anesthesiology 102: 1242 – 1248.
Dexter, F., R. H. Epstein, and H. M. Marsh (2001). “A Statistical analysis of weekday operating
room anesthesia group staffing at nine independently managed surgical suites.”
Anesthesia and Analgesia 92: 1493 - 1498.
Dexter, F., R. H. Epstein, et al. (2004). “Making management decisions on the day of surgery
based on operating room efficiency and patient waiting times.” Anesthesiology 101: 1444
– 1455.
Dexter, F. and J. Ledolter (2005). “Bayesian prediction bounds and comparisons of operating
room times even for procedures with few or no historic data.” Anesthesiology 103: 1259
– 1267.
Dexter, F., J. D. Lee, et al. (2007). “A psychological basis for anesthesiologists’ operating room
managerial decision-making on the day of surgery.” Anesthesia and Analgesia 105: 430
– 434.
Dexter, F. and A. Macario (2000). “What is the relative frequency of uncommon ambulatory
surgery procedures in the united States with an anesthesia provider?” Anesthesia and
Analgesia 90: 1343 – 1347.

173
Dexter, F., and A. Macario (2002). “Changing allocations of operating room time from a system
based on historical utilization to one where the aim is to schedule as many surgical
cases as possible.” Anesthesia and Analgesia 94: 1272 –1279.
Dexter, F. and A. Macario (2004). “When to release allocated operating room time to increase
operating room efficiency.” Anesthesia and Analgesia 98: 758 – 762.
Dexter, F., A. Macario, et al. (2005). “Validity and usefulness of a method to monitor surgical
services’ average bias in scheduled case durations.” Canadian Journal of Anesthesia
52: 935 – 939.
Dexter, F., A. Macario, et al. (1999). “Statistical method to evaluate management strategies to
decrease variability in operating room utilization - Application of linear statistical
modeling and Monte-Carlo simulation to operating room management.” Anesthesiology
91: 262 – 274.
Dexter, F., A. Macario, et al. (1999). “Forecasting surgical groups’ total hours of elective cases
for allocation of block time: application of time series analysis to operating room
management.” Anesthesiology 91: 1501 – 1508.
Dexter, F., A. Macario, et al. (2003). “Operating room utilization alone is not an accurate metric
for the allocation of or block time to individual surgeons with low case load.”
Anesthesiology 98: 1243 – 1249.
Dexter, F., A. Macario, and R. D. Traub (1999). “Which algorithm for scheduling add-on elective
cases maximizes operating room utilization? Use of bin packing algorithms and fuzzy
constraints in operating room management.” Anesthesiology 91: 1491 – 1500.
Dexter, F., A. Macario, et al. (1999). “An operating room scheduling strategy to maximize the
use of operating room block time: computer simulation of patient scheduling and survey
of patients’ preferences for surgical waiting time.” Anesthesia and Analgesia 89: 7 – 2.

174
Dexter, F., E. Marcon, et al. (2009). “Numbers of simultaneous turnovers calculated from
anesthesia or operating room information management system data.” Anesthesia and
Analgesia 109: 900 – 905.
Dexter, F. and R. D. Traub (2000). “Sequencing cases in operating rooms: predicting whether
one surgical case will last longer than another.” Anesthesia and Analgesia 90: 975 –
979.
Dexter, F. and R. D. Traub (2000). “Statistical method for predicting when patients should be
ready on the day of surgery.” Anesthesiology 93(20): 1107 – 1114.
Dexter, F. and R. D. Traub (2002). “How to schedule elective surgical cases into specific
operating rooms to maximize the efficiency of use of operating room time.” Anesthesia
and Analgesia 94: 933 – 942.
Dexter, F., R. D. Traub, et al. (2002). “What sample sizes are required for pooling surgical case
durations among facilities to decrease the incidence of procedures with little historical
data?” Anesthesiology 96: 1230 – 1236.
Dexter, F., R. D. Traub,and P. Lebowitz (2001). “Scheduling a delay between different
surgeons’ cases in the same operating room on the same day using upper prediction
bounds for case durations.” Anesthesia and Analgesia 92: 943 – 946.
Dexter, F., R. D. Traub, and A. Macario (2003). “How to release allocated operating room time
to increase efficiency: predicting which surgical service will have the most underutilized
operating room time.” Anesthesia and Analgesia 96: 507 – 512.
Dexter, F., R. D. Traub, and F. Qian (1999). “Comparison of statistical methods to predict the
time to complete a series of surgical cases.” Journal of Clinical Monitoring and
Computing 15: 45 - 51.
Dexter, F., L. S. Weih, et al. (2006). “Observational study of operating room times for knee and
hip replacement surgery at nine U.S. community hospitals.” Health Care Management
Science 9: 325 – 339.

175
Dexter, F., A. Willemsen-Dunlap, and J. D. Lee (2007). “Operating room managerial decision-
making on the day of surgery with and without computer recommendations and status
display.” Anesthesia and Analgesia 105: 419 – 429.
Ejkemans, M. J. C., M. van Houdenhoven, et al. (2010). “Predicting the unpredictable: a new
prediction model for operating room times using individual characteristics and the
surgeon’s estimate.” Anesthesiology 112: 41 – 49.
Epstein, R. H. and F. Dexter (2002). “Statistical power analysis to estimate how many months of
data are required to identify operating room staffing solutions to reduce labor costs and
increase productivity.” Anesthesia and Analgesia 94: 640 – 643.
Epstein, R. H. and F. Dexter (2012). “Influence of supervision ratios by anesthesiologists on
first-case starts and critical portions of anesthetics.” Anesthesiology 116: 683 – 691.
Faiz, O., P. Tekkis, et al. (2008). “Is theatre utilization a valid performance indicator for NHS
operating theatres?” BMC Health Services Research 8: 28 – 35.
Feng, C. X., Z. G. Yu, and J. H. Wang (2005). “Validation and data splitting in predictive
regression modeling of honing surface roughness data.” International journal of
Production Research 43(8): 1555 – 1571.
Fenton, L. F. (1960). “The sum of lognormal probability distributions in scatter transmission
systems.” IRE Transaction of Communication System CS-8: 57 – 67.
Galambos, G. and G. J. Woeginger (1995). “The on-line bin packing, a restricted survey.”
Mathematical Methods of Operations Research 42: 25 – 45.
Hanss, R., B. Buttgereit, et al. (2005). “Overlapping induction of anesthesia: an analysis of
benefits and costs.” Anesthesiology 103: 391 – 400.
HFMA (2005). “Achieving operating room efficiency through process integration.” Tech.rep.,
Health Care Financial Management Association Report.
Institute of Medicine (1999). “To err is huam: Building a safer health system.”

176
Iravani, S. and I. Duenyas (2002). “Integrated maintenance and production control of a
deteriorating production system.” IIE Transactions 34: 423 - 435.
Jebali, A., A. Hadj, and P. Ladet (2006). “Operating rooms scheduling.” International Journal of
Production Economics 99: 52 – 62.
Kc, D. S. and C. Terwiesch (2009). “Impact of workload on service time and patient safety: An
econometric analysis of hospital operations.” Management Science 55(9): 1486 – 1498.
Kenne, J., A. Gharbi, and M. Beit (2007). “Age-dependent production planning and maintenance
strategies in unreliable manufacturing systems with lost sale.” European Journal of
Operational Research 178: 408 - 420.
Khanlari, A., K. Mohammadi, and B. Sohrabi (2008). “Prioritizing equipments for preventive
maintenance activities using fuzzy rules.” Computers & Industrial Engineering 54: 169-
184.
Koulouris, A., J. Calandranis, and D. P. Petrides (2000). “Throughput analysis and
debottlenecking of integrated batch chemical processes.” Computers and Chemical
Engineering 24(2-7): 1387 – 1394.
Kwan, R. and C. Leung (2006). “An accurate method for approximating probability distributions
in wireless communications.” Proceeding of IEEE WCNC06 2: 1114 – 1119.
Lamiri, M. X. Xie, and S. Zhang (2008). “Column generation approach to operating theater
planning with elective and emergency patients.” IIE Transaction 40(9): 838 – 852.
Langer, R., J. Li, et al. (2010). “Simulation study of a bottleneck-based dispatching policy for a
maintenance workforce.” International Journal of Production Research 48: 1745 - 1763.
Ledolter, J., F. Dexter, and R. E. Wachtel (2010). “Control chart monitoring of the numbers of
cases waiting when anesthesiologists do not bring in members of call team.” Anesthesia
and Analgesia 111: 196 – 203.

177
Li, J., D. E. Blumenfeld, et al. (2009). “Throughput analysis of production systems: recent
advances and future topics.” International Journal of Production Research 47: 3823-
3851.
Li, Y., S. Zhang, et al. (2010). “Predicting surgical case durations using ill-conditioned CPT code
matrix.” IIE Transactions 42: 121 – 135.
Lomax, R. G. (1989). Covariance structure analysis: Extensions and developments. In B.
Thompson (Ed.), Advances in social science methodology. Creenwich, CT: JAI. Volume
1:171 – 204
Macario, A (2006). “Are Your Hospital Operating Rooms "Efficient"?” Anesthesiology 105: 237-
240.
Macario, A. (2009) “Truth in scheduling: Is it possible to accurately predict how long a surgical
case will accurately last?” Anesthesiology 108: 681 – 685.
Macario, A. (2010). “What does one minute of operating room time cost?” Journal of Clinical
Anesthesia 22: 233 – 236.
Macario, A. and F. Dexter (1999). “Estimating the duration of a case when the surgeon has not
recently performed the procedure at the surgical suite.” Anesthesia and Analgesia 89:
1241 – 1245.
Macario, A., T. S. Vitez, et al. (1995). “Where are the costs in perioperative care? Analysis of
hospital costs and charges for inpatient surgical care.” Anesthesiology 83(6): 1138 –
1144.
Marcon, E. and F. Dexter (2007). “Observational study of surgeons’ sequencing of cases and its
impact on post-anesthesia care unit and holding area staffing requirements at hospitals.”
Anesthesia and Analgesia 105: 119 – 126.
Marjamaa, R. A., P. M. Torkki, et al. (2009). “What is the best workflow for an operating room?
A simulation study of five scenarios.” Health Care Management Science 12: 142 – 146.

178
Masursky, D., F. Dexter, et al. (2009). “Incentive payments to academic anesthesiologists for
late afternoon work did not influence turnover times.” Anesthesia and Analgesia 108:
1622 – 1626.
Masursky, D., F. Dexter, et al. (2011). “Surgeons’ and anesthesiologists’ perceptions of turnover
times.” Anesthesia and Analgesia 112: 440 – 444.
Mendenhall, W. and T. Sincich (2003). A Second Course in Statistics: Regression Analysis, 6th
Edition. NJ., Pearson Education.
McIntosh, C., F. Dexter, and R. H. Epstein (2006). “Impact of service-specific staffing, case
scheduling, turnovers, and first-case starts on anesthesia group and operating room
productivity: tutorial using data from an Australian hospital.” Anesthesia and Analgesia
103: 1499 – 1516.
Miller, R. G. (1974). “The Jackknife: A Review.” Biometrika 61: 1 – 15.
Montgomery, D. C., E.A. Peck, and G.G. Vining (2001). Introduction to Linear Regressoion
Analysis. 3rd edition, New York, NY., John Wiley & Sons.
Moody’s Investor Services (2000). “Not for profit health care: 2000 outlook and medicare”.
Murat, A. and B. Nepal (2010). “Effect of scheduling policies on operating room overtime
performance.” International Journal of Services and Operations Management 7(2): 231 –
251.
Myers, R. H. (1990). Classical and Modern Regression with Applications. 2nd edition. CA.,
Dusbury.
Nie, H. and S. Chen (2007). “Lognormal sum approximation with Type IV Pearson distribution.”
IEEE Communication Letters 11: 790 – 792.
Ogulata, S. and R. Erol (2003). “A hierarchical multiple criteria mathematical programming
approach for scheduling general surgery operations in large hospitals.” Journal of
Medical Systems 27(3): 259 – 270.

179
OR Manager (2000). “Hospitals bottom line suffering.” 16: 32.
Ozkarahan, I. (2000). “Allocation of surgeries to operating rooms by goal programming.” Journal
of Medical Systems 24(6): 339 – 378.
Pandit, J. J. and A. Carey (2006). “Estimating the Duration of Common Elective Operations:
Implications for Operating List Management.” Anesthesia 61: 768 – 776.
Pandit, J. J. and A. Tavare (2011). “Using mean duration and variation of procedure times to
plan a list of surgical operations to fit into the scheduled list time.” European Journal of
Anaesthesiology 28: 493 – 501.
Peltokorpi, A., P. Torkki P, et al. (2009). “Improving economic efficiency of operating rooms:
Production planning approach.” International Journal o Services Standards 5(3): 199 –
213.
Peltokorpi, A. (2011). “How do strategic decisions and operative practices affect operating room
productivity?” Health Care Management Science 14: 370 – 382.
Vissers, J. M. H., J. W. M. Bertrand, and G. de Vries (2001). “A framework for production control
in health care organizations.” Production Plan Control 12(6): 591 – 604.
Raykov, T. and G. A. Marcoulides (2000). A first course in structural equation modeling.
Mahwah, N.J.: Lawrence Erlbaum Associates, 2000
Reason, J (1995). “Understanding adverse events: human factors.” Quality Health Care 4: 80 –
89.
Reklaitis, G. V., J. Pekny, and G. S. Joglekar (1997). “Scheduling and simulation of batch
processes.” Handbook of batch process design. London, UK: Blackie Academic and
Professional.
Schumacker, R. E. and R. G. Lomax (2010). A beginner’s guide to structural equation modeling,
3rd Edition. Danvers, MA: Taylor and Francis Group, 2010:74 – 77.
Schwartz, S. and Y. Yeh (1982). “On the distribution function and moments of power sums with
lognormal components.” Bell System Technical Journal 61: 1441 – 1462.

180
Shapiro, L. E., P. H. Alfille, and W. S. Sandberg (2010). “Roots with a social memory.”
Anesthesia and Analgesia 111: 19 – 20.
Sharda, B., and S. J. Bury (2010). “Bottleneck analysis of a chemical plant using discrete event
simulation.” Proceedings of the 2010 Winter Simulation Conference: 1547 – 1555.
Snee, R. D. (1977). “Validation of Regression Models: Methods and Examples.” Technometrics
19(4): 415 – 428.
Soboley, B. and L. Kuramoto (2005). “Policy analysis using patient flow simulations: conceptual
framework and study design.” Clinical and Investigative Medicine 18(6): 359 – 363.
Steins, K., F. Persson, and H. Martin (2010). “Increasing utilization in a hospital operating
department using simulation modeling.”, Simulation 86: 463 – 480.
Stepaniak, P. S., H. Christiaan, et al. (2009). “Modeling procedure and surgical times for current
procedural terminology-anesthesia-surgeon combinations and evaluation in terms of
case-duration prediction and operating room efficiency: a multicenter study.” Anesthesia
and Analgesia 109(4): 1232 – 1245.
Stepaniak, P. S. (2010). “Modeling and prediction of surgical procedure times.” Statistica
Neerlandica 64(1): 1 – 18.
Stepaniak, P. S., G. H. Mannaerts, et al. (2009). “The effect of the operating room coordinator's
risk appreciation on operating room efficiency.” Anesthesia and Analgesia 108: 1249 –
1256.
Strum, D. P., J. H. May, et al. (2003). “Estimating times of surgeries with two component
procedures: comparison of the lognormal and normal models.” Anesthesiology 98: 232 –
240.
Strum, D. P., J. H. May, and L. G. Vargas (2000). “Modeling the uncertainty of surgical
procedure times: comparison of the log-normal and normal models.” Anesthesiology 92:
1160 – 1167.

181
Strum, D. P., L. G. Vargas, and J. H. May (1999). “Surgical subspecialty block utilization and
capacity planning. A minimal cost analysis model.” Anesthesiology 90: 1176 – 1185.
Strum, D. P., A. R. Sampson, et al. (2000). “Surgeon and type of anesthesia predict variability
in surgical procedure times.” Anesthesiology 92: 1454 – 1466.
Torkki, P. M., R. A. Marjamaa, et al. (2005). “Use of anesthesia induction rooms can increase
the number of urgent orthopaedic cases completed within 7 hours.” Anesthesiology 103:
401 – 405.
Tyler, D. C., C. A. Pasquariello, and C. Chen (2003). “Determining optimum operating room
utilization.” Anesthesia and Analgesia 96: 1114 – 1121.
Vasilakis, C., B. G. Sobolev, et al. (2007). “A simulation study of scheduling clinic appointments
in surgical care: individual surgeon versus pooled lists.” Journal of Operations Research
Society 58(2): 202–211.
Voudouris, V. T. (1996). “Mathematical programming techniques to debottleneck the supply
chain of fine chemical industries.” Computers and Chemical Engineering 20 S2: S1269 –
1274.
Wachtel, R. E. and F. Dexter (2008). “Tactical increases in operating room block time for
capacity planning should not be based on utilization.” Anesthesia and Analgesia 106:
215 – 226.
Wachtel, R. E. and F. Dexter (2009). “Reducing tardiness from scheduled start times by making
adjustments to the operating room schedule.” Anesthesia and Analgesia 108: 1902 –
1909.
Wachtel, R. E. and F. Dexter (2009). “Influence of the operating room schedule on tardiness
from scheduled start times.” Anesthesia and Analgesia 108: 1889 – 1901.
Wachtel, R. E. and F. Dexter (2010). “Curriculum providing cognitive knowledge and problem-
solving skills for anesthesia systems-based practice. Accreditation Council for Graduate
Medical Education (ACGME).” Journal of Graduate Medical Education 2: 624 – 632.
182
Weisberg, S (1985). Applied Linear Regression, 2nd Edition. Canada, John Wiley & Sons.
Wu, J., N. V. Nehta, and J. Zhang (2005) “A flexible lognormal sum approximation method.”
Proceeding of IEEE GLOBECOM 6: 3413 – 3417.
Zequeira, R. I., J. E. Valdes, and C. Berengure (2008). “Optimal buffer inventory and
opportunistic preventive maintenance under random production capacity availability.”
International Journal of Production Economics 111: 686-696.
Zhang, J., X. X. Zhu, and G. P. Towler (2001). “A level-by-level debottlenecking approach in
refinery operation.” Industrial and Engineering Chemistry Research 40: 1428 – 1540.
Zhou, J. and F. Dexter (1998). “Method to assist in the scheduling of add-on surgical cases-
upper prediction bounds for surgical case durations based on the log-normal
distribution.” Anesthesiology 89: 1228 – 1232.
Zhou, J., F. Dexter, et al. (1999). “Relying solely on historical surgical times to estimate
accurately future surgical times is unlikely to reduce the average length of time cases
finish late.” Journal of Clinical Anesthesia 11: 601 – 605.

183
ABSTRACT
OPERATING ROOM UTILIZATION AND BEHAVIORAL STUDY
by
JIHAN WANG
August 2012
Advisor : Dr. Kai Yang
Major : Industrial Engineering
Degree : Doctor of Philosophy
Operating Rooms (OR) are the most expensive care units in health care systems. In
order for OR theatre to operate in cost efficient way, it is desirable that the ORs exhibit high
utilization, while at the same time, maintain a low-level over-utilized OR time. At the operational
level, there are many factors that could influence the OR utilization performances. The objective
of this study is to develop effective approaches focusing on the most important factors that
influence OR utilization to assist OR management in decision making to achieve better
utilization and cost efficiency. In the study, model selection and cross-validation methods were
used to find the best linear model of OR utilization given different subsets of the factors. As the
scheduled utilization and case duration prediction accuracy were identified as the two most
statistically significant factors, we then proposed a new distribution to approximate the total
duration of surgery lists of multiple cases and compared its accuracy in the estimation of the
probability of under- and over-run of surgery lists with the widely applied t-distribution. Monte
Carlo simulation was used to validate the appropriateness of the proposed new distribution by
comparing the percentiles of the empirical distribution of the duration of surgery lists with those
calculated from the proposed distribution. The tardiness of case starts prohibit OR from
achieving optimal efficiency, as they causes over-utilized OR time and cancellations. Given
limited resources, it is critical for the OR management to prioritize the tackling of tardiness. An

184
iterative simulation method considering multiple delay reasons at a time was proposed that
continuously identifies the top delay risks to facilitate proactive decision making to prevent
tardiness from taking place. The effectiveness of this approach was examined through a case
study by having different scheduling policies and case duration distributions. In the end, the
behavioral pattern of OR staff was explored by constructing a structural equation model.
Relationships among different variables and mean turnover time duration were estimated. It was
found out that the work pace of OR staff during turnover times was not affected by the OR
workload, and proved there was a psychological bias of OR staff to make decisions based on
increasing clinical work per unit time during the hours they are assigned. This research
complements current OR management study by introducing better and new methods for OR
operational decision making.

185
AUTOBIOGRAPHICAL STATEMENT
JIHAN WANG
EDUCATION
DOCTOR OF PHILOSOPHY
Industrial Engineering Wayne State University, Detroit, MI 2009 - 2012 MASTER OF SCIENCE Industrial Engineering Wayne State University, Detroit, MI 2007 - 2009 BACKELOR OF SCIENCE Industrial Engineering Wayne State University, Detroit, MI 2002 - 2007
EXPERIENCE
JOHN D. DINGELL VA MEDICAL CENTER
Detroit, MI Research Assisant /Industrial Engineer Student Trainee January 2009 - Current FORD MOTOR COMPANY
Dearborn, MI
Quality Data Analyst Co-op May 2008 - December 2008
SELECTED PUBLICATIONS
1. J. Wang, F. Dexter, and K. Yang. "Behavioral Study of Daily Mean Turnover Times and First Case of the Day Tardiness of Starts." Accepted Pending Minor Changes, in Review of Anesthesia and Analgesia, San Francisco, CA, 2012.
2. J. Wang and K. Yang. "Using Type IV Pearson distribution to calculate the probabilities of under- and over-run of surgery lists consisting of multiple cases." in Review of European Journal of Anaesthesiology, Geneva, Switzerland, 2012
3. J. Wang, EA. Murat, H. Neemuchwala, and K. Yang. "Proactive Management of Operating Room Resources through Operational Simulation." Manuscript preparation, targeting Health Care Management Science, Secaucus, NJ, 2012