Embed Size (px)
Citation preview


© 2013European Nuclear Society avenue des Arts 56 1000 Brussels, Belgium Phone + 32 2 505 30 54 Fax +32 2 502 39 02 E-mail [email protected] Internet www.euronuclear.org ISBN 978-92-95064-18-8 These transactions contain all contributions submitted by 19 April 2013. The content of contributions published in this book reflects solely the opinions of the authors concerned. The European Nuclear Society is not responsible for details published and the accuracy of data presented.
2 of 58 04/19/2013

Table of Contents:
"HALDEN REACTOR: UPDATED APPROACHES FOR SAFE, RELIABLE AND VERSATILE RESEARCHES”
Elisenberg, T. (1) 1 - Institute for energy technology, Norway
ANALYSIS OF THE CONTROL ROD INTERACTION EFFECT IN
THE FIRST CORE OF RSG-GAS (MPR-30) REACTOR Sembiring, T. M. (1); Liem, P. H. (2)
1 - National Nuclear Energy Agency of Indonesia (BATAN),
Indonesia 2 - Nippon Advanced Information Service (NAIS Co. Inc.),
Japan
MAJOR EXPANSION OF NIST REACTOR EXPERIMENTAL AND OPERATIONAL CAPABILITIES
O'Kelly, S. (1) 1 - NIST Center for Neutron Research, United States
OPERATIONAL AND MAINTENANCE ASSESSMENT OF RESEARCH REACTORS OMARR
Morris, C. (1) 1 - International Atomic Energy Agency, Austria
IN-CORE FUEL MANAGEMENT OPTIMISATION WITHIN THE OSCAR-4 CODE SYSTEM
Schlunz, E. B. (1); Prinsloo, R. H. (1); Bokov, P. M. (1)
1 - The South African Nuclear Energy Corporation (Necsa),
South Africa
FISSION CHAMBER MODELLING FOR MTR USE Filliatre, P. (1); Jammes, C. (1); Geslot, B. (2);
Veenhof, R. (3) 1 - CEA, DEN, DER, Instrumentation Sensors and Dosimetry
Laboratory, France 2 - CEA, DEN, DER, Experimental Programs Laboratory, France 3 - RD51 Collaboration, CERN, Switzerland
REPLACEMENT OF PUMPS IN PRIMARY COOLING CIRCUIT TO ENABLE FULL CORE CONVERSION IN MARIA REACTOR
Krzysztoszek, G. (1); Mieleszczenko, W. (1)
1 - National Centre for Nuclear Research, Poland
NEW DESIGN CONCEPT FOR PRIMARY COOLING SYSTEM OF MEDIUM POWER RESEARCH REACTORS
Kim, S. H. (1); Seo, K. (1); Yoon, J. (1); Lim, I. C. (1)
1 - Korea Atomic Energy Research Institute, Korea, Republic of
THE HFR VESSEL SURVEILLANCE PROGRAMME: PRINCIPLES AND LATEST RESULTS
Wouters, O. (1); Luzginova, N. (1)
1 - Nuclear Research and Consultancy Group, Netherlands
OPAL: SUCCESSFUL LONG SHUTDOWN IN LATE 2012 Storr, G. (1)
1 - Australian Nuclear Science and Technology Organisation
(ANSTO), Australia
3 of 58 04/19/2013

Operation and Maintenance
4 of 58 04/19/2013

1
“HALDEN REACTOR: UPDATED APPROACHES FOR SAFE, RELIABLE AND VERSATILE RESEARCHES”
THOMAS ELISENBERG,
Reactor Manager - Reactor Operation and Engineering Department,
BORIS VOLKOV
Experimental Engineering Department,
ALF OVE BRASETH
Systems and Interface Design
Abstract The Halden Boiling Water Reactor (HBWR) has been operated for many years and continued playing an important role in experimental support of reliable, safe and effective utilization of nuclear fuel and materials for commercial NPPs. The constant availability of the HBWR is based on maintenance, upgrading and supervision of the reactor systems which play a key role in safe long-term operation in the future. The experimental systems have been progressively upgraded with innovative techniques which enable the Halden reactor to have unique experimental capabilities. This paper is describing updated approaches to the Halden reactor utilization for safe research of innovative fuel and materials under demanding conditions. The latest modifications of the reactor control room, and surveillance of the reactor vessel, as well as plans for upgrading, are presented to share the experience of new installations and its utilization.
1. Introduction The Halden Reactor Project (HRP) is an undertaking of many nuclear organizations from 19 countries (in 2012) which joined efforts with the main objective to support safe, reliable and
effective utilization of nuclear fuel and materials in operating commercial nuclear power plants. This international Project is hosted by the Norwegian Institute for Energy Technology (IFE) which is leading the HRP joint nuclear research program established with member countries shown in Figure 1. The program is renewed by the member organizations every third year to meet nuclear industry requirements. In addition to the joint program experiments, a number of organizations from the participating countries execute their own development work on a bilateral or multilateral basis with IFE-HRP structures. The researchers are utilizing the HRP infrastructure with the maximum possible effectiveness whereas IFE is committed to continue efficiently responding on technical issues and to maintain the facilities in
the conditions keeping high competitive capacity.
Figure 1 HRP member countries as for 2012
5 of 58 04/19/2013

2
The Halden Boiling Water Reactor (HBWR) has been operated since 1959 and are continuously playing an important role in experimental support of reliable, safe and effective utilization of nuclear fuel and materials for commercial NPPs. At the same time the HBWR has been progressively upgraded with innovative techniques and systems which enable it to be one of the most versatile test reactors having unique experimental capabilities. The future availability of the HBWR is based on continuous maintenance, upgrading and supervision of the reactor systems, and the current and future programs of the HRP are thus based on the long-term operation of the HBWR.
2. The Halden Boling Water Reactor The Halden Boiling Water Reactor (HBWR) is located in Halden, a coastal town in south-east Norway near to the border to Sweden. The reactor hall is situated within a rock hillside on the north bank of the river Tista. The size of the site area is 7000 m2. The reactor vessel and the primary circuit system are placed inside a rock cavern (reactor hall) with a net volume of 4500 m3 (Figure 2). The rock covering is 30-50 m thick and acts as a natural containment. Heat removal circuits are either placed inside the reactor hall or in the reactor entrance tunnel. The control room and service facilities are placed outside the excavation. The service facilities contain offices, workshops, and laboratories. The HBWR is a natural circulation boiling water reactor with 14 tons of heavy water as moderator and coolant. The maximum power is 25 MW (thermal), and the maximum water
temperature is 240C, corresponding to an operating pressure of 33.6 bars. Figure 3 shows a simplified flow sheet of the reactor system.
The energy released in the reactor is transferred by steam transformers to a secondary, closed circuit containing light water. The secondary circuit transfer the heat out of the containment to a third light water circuit which in turn delivers steam to the neighbouring paper factory.
Figure 2 Halden Reactor hall
Figure 3: Simplified flow sheet
6 of 58 04/19/2013

3
The reactor has possibility to irradiate simultaneously 30-35 fuel and material test rigs. The average availability of the HBWR is around 50% of the year, thus the actual time of the reactor vessel irradiation is less than 30 years of its lifetime. The scheme of the reactor core is shown in Figure 4 and operational data are given in Table 1.
3. In-service inspection and material surveillance According to the national requirements, the inspection and test programmes of the reactor vessel include ultrasonic examination of vessel welds, lid, bolts, bottom nozzle and piping. The irradiation induced changes in the vessel material are being monitored by material testing and flux evaluations. Fracture mechanical analysis of material samples are performed by VTT’s laboratory in Finland, using materials with appropriate fluence. Flux assessments during operational time enable quantification of the fluence received by the different parts of the vessel, taking into account the changing core loading over the years. The material tests and the analysis performed have shown that the reactor can be operated safely well beyond year 2100. All components and pipes in the primary, secondary and tertiary systems are inspected according to a programme approved by the authorities. Another important part of the in-service inspection of the reactor vessel, including surveillance of operations, is internal visual inspection by radiation resistance camera. Until 2011 telescope with mirrors was in use. The telescope operation was complicated by large dimensions, complicity of mounting/dismounting, optical distortions etc. It was not possible to get good inspection results and provide trustworthy data during monitoring of operations using this equipment. There was not possible to use ordinary TV camera (based on CCD or CMOS matrix) by the reason of high
Table 1 HBWR data
Reactor type Boiling water reactor
Power Up to 25 MW
Pressure 33.3 bar
Saturation temperature 240 oC
Moderator / coolant D2O
Heavy water volume 14 m3
Primary circuit Natural +forced
Number of control stations
30
Number of cells for experiments
35
Max height of fuel 1.7 m
Height of active core 0.8 m
Driver fuel Fuel rod assemblies
Lattice pitch Hexagonal – 130 mm
Av. thermal neutron flux 3x10¹³ n/cm2 s
Ramp configuration 1.2x10¹⁴ n/cm2 s
Av. fast neutron flux 2x10¹³ n/cm2 s
Booster rigs 5x10¹³ n/cm2 s
Figure 4 HBWR core with indication of some of
the special test rigs
7 of 58 04/19/2013

4
operational dose rate of ɣ -irradiation (up to 106 rad / hour), high temperature (up to +80º C) and limited diameter of fuel channels (76 mm). In 2012 the Halden Reactor Project bought a new camera, a radiation-tolerant visual inspection system STS-40M (Figure 5), from the Russian company ZAO Diakont which has positive experience of nuclear installations on many reactors worldwide [2]. The camera has 200 MRad radiation tolerance with 40.5 mm diameter and waterproof housing.
In February, 2012, the qualification tests of STS-40M system were provided with the presence of notified body (TÜV Nord Sweden AB) and 3rd party inspector (Dekra). Detection of tiny cracks was successfully provided on the sample used for verification of TV cameras at the Swedish nuclear power plants. All parties paid attention to the high quality of generated images and ease to use. In May 2012, the first underwater TV inspection in the reactor was provided. Good inspection results under high radiation influence and temperature was obtained. The equipment has a good universality of the TV system, due to interchangeable lenses with different viewing angles and lighting heads, which allow choosing the most optimal TV inspection technology. Pictures from the reactor vessel are shown in Figure 6 (calibration) and Figure 7 (Inspection).
Figure 6 Calibration block inside the reactor vessel. Each hole with 1 mm diameter.
Figure 7 Vessel wall inner lining. Vertical scratches are due to ultrasonic inspection.
Figure 5 STS-40M from ZAO Diakont
8 of 58 04/19/2013

5
4. Upgrading of the Halden Boling Water Reactor During all the years of operating the HBWR, systems have been constantly upgraded during periodic shutdowns. All valves, heat exchangers and piping in the primary system have been exchanged during the last decade. As a result, the reactor vessel, lower main pipe and the steam manifold are the only remaining parts of the original construction, as shown in Figure 8.
In the same period the secondary and tertiary cooling circuits, the reactor control systems, electrical supply systems, instrumentation, safety system and other parts important for normal operation have been upgraded or replaced. During spring 2012, a new Large Screen Display (LSD) was installed in the control room, replacing old analogue wall panels, (Figure 9 and 10). The installation was done in close cooperation between expert reactor operators, and design and implementation competence from the MTO sector (Safety in Man-Technology-Organization) at the OECD Halden Reactor Project. The purpose of the LSD, named the Halden Reactor Display, is to provide operators with the “big-picture” of the reactor operational state.
Fig. 9 The control room with old-style
panels before the installation on the LSD Fig 10: The new Large Screen Display
Figure 10 Upgrading of the HBWR primary circuit Grey: original; Red: replaced pipes; Blue: replaced components
9 of 58 04/19/2013

6
The Halden Reactor Display is based on a scientific LSD concept named Information Rich Design (IRD) developed at IFE. The display is a successor of two earlier research applications in the nuclear domain; a 1st generation display at a nuclear simulator in Finland [3], and a 2nd generation display at the HAMBO simulator at the Halden Reactor Project [4]. The objective of the IRD concept is to display process data suitable for fast effortless visual perception, even in larger human scaled displays. The concept simplifies cognition of larger data sets through design patented direct-perception qualitative indicators. The indicators align process values (pressure, temperatures, liquid levels etc.), target values and alarm limits. This is enabled by part-wise mathematical normalization of the measuring range, see Figure 11. The IRD qualitative generic indicators have many similarities with older analogue type indicators.
Figure 11: IRD mini-trends on left side, using traditional scale on right side
The Halden Reactor Display is designed to be complimentary to existing operator stations, and it is currently only offering process monitoring, not interaction. The display uses a traditional mimic style layout with flow-lines connecting process equipment, this ensures a familiar recognizable display. Orientation is made easy by visualization of larger vessels such as the reactor vessel and drums. The main functionality is shown in Figure 12.
Figure 12: Third generation “Halden reactor display”, 1.4m x 4.5 m The installation of the Large Screen Display was a great renewal of the control room. In addition to the screen itself the roof was totally renewed including new lightning. The list of some of the Halden reactor facilities upgraded for the last decade is given in Table 3, whereas the items of the upgrading planned in the near future are shown in Table 4.
Experimental
circuits (11)
Reactor-
tank
Primary circuit
(brown)
Secondary circuit
(green)
Tertiary circuit
(blue)
Feed-water
tank
Steam
generator
Steam
drum
Radiation monitoring
(air, coolant)
Purification
system
Main steam line
out
10 of 58 04/19/2013

7
Table 3 Examples of upgradings of the Halden Boiling Water Reactor; 2003-2012.
Installation of Large Screen Display in reactor control room 2012
Installation of redundant shut off valve in primary sub-cooler circuit 2012
Exchange of uninterrupted power supply 2011
Exchange of water piping for cooling water, discharge water, surface water 2010
New control system for operating control rods 2009
New fire protection installations 2008
Exchange of steam transformers and valves in primary circuit 2007
Exchange of piping in primary steam circuit 2007
Exchange of radioactive discharge pipe to the river 2006
Exchange of valves and pipes in primary sub-cooler circuit 2005
Installation of new alarm system 2004
Repair of sub-cooler pipe in primary circuit by Weld Overlay repair 2003
Exchange of valves and heat exchanger in primary sub-cooler circuit 2003
Table 4 Planned upgrading’s in near future
Installation of redundant safety valve in primary circuit 2013
Upgrading of physical protection of reactor plant 2013
Exchange of emergency diesel unit 2014
New building for production of experimental systems for external delivery 2014
Exchange of electrical transformers 2014-2016
The main objectives of the upgradings are:
Maintain a high level of safety: o Monitor vessel embrittlement o Update safety and alarm systems o Perform IAEA reviews
Extend the reactor licence beyond 2014
11 of 58 04/19/2013

8
5. Updating of the Halden Experimental Capabilities In order to meet the new requirements and challenges to the nuclear industry the HRP and IFE should constantly not only maintaining the HBWR but also improve some experimental systems, instruments and test methods. Nowadays the following systems and tests are mostly demanded at HRP:
o LOCA tests series to determine fuel relocation for high burnup fuel; o RAMP tests o Corrosion tests with modified cladding materials; o Gas pressure tolerance for high burnup fuel (lift-off test) o Power cycling
The quality of HBWR experiments are also maintained by the development of new instruments and special units for material tests. The sophistication of the experimental systems and test rigs with purpose-built instrumentation at the HBWR allows flexible approaches for investigations of different types of innovative fuel and cladding materials. In particular the accident tolerance materials are under consideration after Fukushima accident. It should also be mentioned that the HRP is participating in a measured way in Generation IV reactor research, in particular aimed on high temperature materials and instrumentation developments.
6. Conclusion During many years of operation, the Halden reactor has played an important role in support of world-wide nuclear energy development, particularly in the area of reliable, safe and effective utilization of nuclear fuel and materials. A history of the HRP establishment gives a picture of an international Project which successfully relies on the versatility of the research carried out in its reactor. The results from the Halden reactor continue to be the basis for the safe introduction of innovative fuels and materials to nuclear power plants. The reactor and its associated experimental systems have been steadily updated. The constant availability of the HBWR is based on maintenance, upgrading and supervision of the reactor systems which play a key role in safe operation. The recent modifications as well as plans for upgrading are important issues for the HBWR long term operation in the future.
7. References [1] B.Volkov, Y.Minagawa, T.Elisenberg, M.McGrath “Upgrading of the Halden Reactor
Experimental Capabilities for Innovative Fuel and Material Testing”, RRFM 2011. [2] «DIAKONT»: http://www.diakont.com/solutions/nuclear-energy/camera/visual-inspection-
d40-camera/ [3] A.O. Braseth, V. Nurmilaukas, J. Laarni, Realizing the Information Rich Design for the
Loviisa Nuclear Power Plant. NPIC&HMIT, Knoxville Tennessee, 2009. [4] A.O. Braseth, T. Karlsson, H. Jokstad, Improving alarm visualization and consistency for a
BWR large screen display using the Information Rich Concept. NPIC&HMIT, Las Vegas, 2010.
12 of 58 04/19/2013

ANALYSIS OF CONTROL ROD INTERACTION EFFECT IN THE FIRST CORE OF RSG-GAS (MPR-30) REACTOR
T.M. Sembiring Center for Reactor Technology and Nuclear Safety, National Nuclear Energy Agency (BATAN)
Kawasan PUSPIPTEK Gd. No. 80, Serpong, Tangerang Selatan 15310 - Indonesia
P.H. Liem
Nippon Advanced Information Service (NAIS Co., Inc.) 416 Muramatsu, Tokaimura, Ibaraki 319-1112 - Japan
ABSTRACT
A reactor should be able to be shutdown anytime with the negative reactivity of its control rods even under the condition that one of control rod with the maximum reactivity worth is stuck. A good estimation of the control rod reactivity worth is therefore mandatory. The reactivity worth of an individual or a collection of control rods (bank rods) can be determined experimentally or by calculations. Determining the "true" reactivity worth of control rods become complicated by the existence of control rod interaction effect. In this paper, we report some preliminary results of the undergoing analysis on the control rod interaction effect of the first core of RSG-GAS reactor. The first core of RSG GAS was chosen since we have complete data on the control rods’ worth from calibration experiments and the core condition is accurately known, i.e. all fuel elements are fresh. All calculations were performed by using a 3-dimensional multigroup neutron diffusion method code, BATAN-3DIFF. This research showed that the control rod interaction effect among 6 control rods were in the range of 7 – 30 %.
1. Introduction A reactor should be able to be shutdown anytime with the negative reactivity of its control rods even under the condition that one of control rod with the maximum reactivity worth is stuck. A good estimation of the control rod reactivity worth is therefore mandatory. The reactivity worth of an individual or a collection of control rods (bank rods) can be determined experimentally or by calculations. Determining the "true" reactivity worth of control rods become complicated by the existence of control rod interaction effect. The control rod interaction effect is indicated by the difference in the total value of reactivity worth of the control rods and the collective sum of the value of the individual reactivity worth of the control rods. If there is no difference then the control rod interaction is zero [1]. Control rod interaction studies for the equilibrium core of the RSG-GAS reactor have been conducted by Liem et al [1]. Following the work, the influence of the movement of the control rods on the core reactivity for the first core of the RSG-GAS reactor has been analysed by Taryo [2]. In addition, Taryo and Kuntoro [3] have conducted an investigation on the shadowing effect of control rods for a hypothetical MTR reactor. In this paper, we report some preliminary results of the undergoing analysis on the control rod interaction effect of the first core of RSG-GAS reactor with the final goal of applying the methodology developed by Liem [1]. The first core of RSG GAS was chosen since we have complete data on the control rods’ worth from calibration experiments and the core condition was accurately known, i.e. all fuel elements were fresh. This paper also presents the results of the calculations have been carried out by Liem et al for the equilibrium core RSG-GAS reactor as the basis for a future plan to analyze the interaction of the control rods for the first
13 of 58 04/19/2013

core. All calculations were performed by using a 3-dimensional multigroup neutron diffusion method code, BATAN-3DIFF [4].
2. Description of RSG-GAS Reactor RSG-GAS is a Be-reflected, light-water-moderated and -cooled, 30 MWth (max.) multi-purpose reactor. The equilibrium core has 40 standard fuel elements (FEs) and 8 control fuel element (CEs) on the 10 × 10 core grid positions. There are 8 core grid positions for neutron flux trap distributed among the FEs and CEs as shown in Fig 1. At the nominal power, the reactor produces thermal neutron flux in the order of 1014 n/cm2s. Originally, the core used the oxide fuel (U3O8-Al), but, presently, the core uses the silicide fuel (U3Si2-Al). The main data of RSG-GAS reactor can be seen in Refs [5,6].
Note: BE = Beryllium Element;BS = Beryllium Element with plug;CIP/IP = Irradiation Position; PNRS/HYRS =
Pneumatic/ Hydraulic Rabbit System;
Fig 1. Equilibrium core configuration of RSG-GAS reactor with burn-up (% of 235U loss) in the
second rows.
Fig 2. Full core configuration of the RSG GAS first core
BS B B B B BS B B
B
B
B
FE
0
FE
40
FE
32
FE
0
BS
NS
B
BS
FE
0
FE
48
FE
8
CE
40
IP
FE
16
FE
48
FE
0
B
FE
16
FE
16
CE
8
FE
24
FE
32
CE
24
FE
8
FE
40
FE
32
IP
FE
24
FE
24
CE
48
FE
40
B
FE
40
CE
48
FE
24
FE
32
IP
FE
32
B
FE
40
FE
8
CE
0
FE
24
FE
24
CE
16
FE
16
FE
40
B
FE
0
FE
48
FE
16
IP
CE
32
FE
8
FE
48
FE
0
B
B
B
FE
16
FE
32
FE
8
FE
8
B
B
BS
B
BS
B
B
B
B
B
BS
B
BS
B
PN
RS
HY
RS
HY
RS
HY
RS
HY
RS
B
B
12345678910
Beryllium Block Reflector
A
B
C
D
E
F
G
H
J
K PRTF
CIP
14 of 58 04/19/2013

The equilibrium core was achieved by 6 transition cores during the commissioning period. The number of fuel and the power was increased successively during transition cores. The first core of RSG-GAS reactor consists of 12 fresh standard and 6 control fuel elements as seen in Fig. 2.
3. Calculation methods The control rod interaction effect is determined by using the following calculation steps: 1. Total reactivity worth of 6 control rod taken from 0 cm (fully inserted) and 60 cm (fully
withdrawal) positions. 2. Individual control rod reactivity worth for C-8, C-5, D-4, E-9, F-8 and F-5 core grid position.
In this step, the evaluation of the individual control rod worth are conducted under the condition that other (five) rods are fully withdrawn.
3. Same as step-2 but the other 5 control rods are 30 cm inserted (half withdrawn, bank) The control rod interaction effect is formulated as [1],
1
1
...3,2,1
N
i
i
N
(1)
If 0 or
N
i
iN
1
,..2,1 shows the well-known shadowing effect where the existence of
other control rods reduces the reactivity worth of the control rod under consideration. In the contrary if 0 the flux depression caused by the neighborhood rods resulted in an
increase of the flux at the control rod under consideration and finally enhance its reactivity worth.
4. Results and discussions
In Table 1, the total reactivity worth of 6 control rods was evaluated based on Eq. (1) for
N,..2,1 and based on the simple summation of six individual control rod worth for the
condition where bank control rods were fully withdrawn. In Table 2, we evaluated the same values but for the condition where bank control rods were half withdrawn. The evaluation in Table 2 is more realistic and closer to the experiment condition when the control rod calibrations were conducted using the bank compensation method.
Control rod i N...3,2,1
C-5 2.19 - -
C-8 2.09 - -
D-4 1.87 - -
E-9 2.05 - -
F-5 1.93 - -
F-8 2.14 - -
N
i
i
1
12.25 15.90 0.30
Tab 1: The interaction control rod effect on the total reactivity worth (%Δk/k) for fully
withdrawn condition of bank control rods
15 of 58 04/19/2013

Control rod i N...3,2,1
C-5 2.45 - -
C-8 2.45 - -
D-4 2.18 - -
E-9 2.36 - -
F-5 2.54 - -
F-8 2.50 - -
N
i
i
1
14.86 15.90 0.07
Tab 2: The interaction control rod effect to the total reactivity worth (%Δk/k) for half
withdrawn condition of bank control rods Calculation results showed that the control rod interaction effect for both conditions (Table 1
and 2) showed positive values ( 0 ), that is, the existence of other control rods enhances
the individual control rod worth. For the fully withdrawn condition the interaction effect is around 30%, while for the half withdrawn condition decreased to 7 %, as expected. Liem et.al. [1] have proposed a method to determine the control rod interaction effect by the exact perturbation theory which demands only a small number of criticality calculations. The equilibrium core of RSG-GAS reactor which has 8 control rods was used as the object of their research. By using three assumptions, the interaction effect can be estimated with a small number of criticality calculations [1]. The methodology is planned to be applied to the first core of RSG GAS. As an example of the equilibrium core (not for the first core), using
the methodology the disturbance functions );( jia and average disturbances )(ia for
combination of 8 control rod were calculated as shown in Table 3.
);( jia i )(ia
1 2 3 4 5 6 7 8
j
1 - 0.941 0.814 1.053 1.061 1.158 1.134 1.173
i
1 0.9985
2 0.941 - 1.047 0.810 1.169 1.050 1.183 1.130 2 0.9972
3 0.814 1.047 - 1.125 0.942 1.176 1.057 1.164 3 0.9953
4 1.053 0.810 1.125 - 1.178 0.938 1.161 1.053 4 0.9993
5 1.061 1.169 0.942 1.178 - 1.122 0.812 1.053 5 0.9966
6 1.158 1.050 1.176 0.938 1.122 - 1.039 0.811 6 0.9997
7 1.134 1.183 1.057 1.161 0.812 1.039 - 0.935 7 0.9969
8 1.173 1.130 1.164 1.053 1.053 0.811 0.935 - 8 1.0012
Tab 3: The calculated disturbance functions and average disturbances [1]
It can be noted that if the matrix element is greater than unity then the corresponding two control rods interact mutually in such a way that the total reactivity worth of the control rods is greater than the summation of the individual control rod worth, and vice versa.
5. Summary and Future Work This preliminary analysis results showed that the control rod interaction effect among 6 control rods showed positive values in the range of 7 – 30 % for the first core of RSG-GAS reactor. It expected that the analysis results for the condition where the bank rods were half withdrawn could be used to predict the interaction effect during the rod calibration experiments using the bank compensation method, and to provide a quantitative mean for
16 of 58 04/19/2013

further corrections on the measured control rod worth. As mentioned above, for future works, a more detail and comprehensive analysis of the control rod interaction effect of the first core of RSG-GAS reactor using the exact perturbation theory proposed by the previous research will be conducted.
References [1] LIEM, P.H., et al., “Study on the Control Rod Interaction Effect in RSG-GAS
Multipurpose Reactor (MPR-30)”, Annals of Nuclear Energy 29, p. 701–16 (2002) [2] TARYO, T., “Analysis of Control Rod Movement on Reactivity of the Reactivity of the
RSG-GAS First Core Using CITATION”, Atom Indonesia 27, No. 2, p. 103–116 (2001) [3] TARYO, T. and KUNTORO, I., “Analysis of Shaddowing Effect in a Hypotetical MTR
Reactor”, Atom Indonesia 28, No. 2, p. 41–56 (2001) [4] LIEM, P.H., “Validation of BATAN Standard 3-D Diffusion Code, BATAN-3DIFF, on
the First Core of RSG-GAS”, Atom Indonesia 25, No. 1, p. 47-64 (1999) [5] LIEM, P.H., et al., “Fuel Management Strategy for the New Equilibrium Silicide Core
Design of RSG GAS (MPR-30)”, Nuclear Engineering and Design 180, p. 207–219 (1998)
[6] BATAN, “MPR-30 Safety Analysis Report” , Rev. 7, Jakarta (1987)
17 of 58 04/19/2013

OPERATIONAL AND MAINTENANCE ASSESSMENT OF RESEARCH REACTORS OMARR
(RRFM2013-A0087)
CHARLES R MORRIS
Research Reactor Section Division of Nuclear Fuel Cycle and Waste Technology, IAEA Vienna International Centre, 1400 Vienna Austria
ABSTRACT
The IAEA has proposed a peer review process called OMARR. OMARR stands for Operational and Maintenance Assessment of Research Reactors. The aim of this IAEA service is to provide advice and assistance to Member States to improve their operational and maintenance (O&M) practises thereby optimising availability, reliability and the application of human and financial resources throughout their facilities operational life cycle, from commissioning through to decommissioning. OMARR missions will be initiated by the operating organisations. The OMARR will consist of up to three missions: a Pre-OMARR Mission, the Main Mission and the Follow Up Mission if requested by the facility. It was decided to have two pathfinder missions to kick off the OMARR program, one on a larger power RR and the second on a smaller facility. NIST was the first to respond and is a 20MW reactor; LENA 250kW, was the first small facility to express a desire for an OMARR mission. Both missions have been completed and the presentation will document and discuss, to the extent allowed by the facilities, the lessons learned and how effective the program was.
OMARR MISSIONS
1. Introduction OMARR stands for Operational and Maintenance Assessment of Research Reactors and its service will be provided under the auspices of the International Research Reactor Operational and Maintenance Network (“IRON” will be discussed and formulated after a number of OMARR missions have been completed). The aim of this IAEA service is to provide advice and assistance to Member States to improve their operational and maintenance (O&M) practises by peer to peer reviews thereby optimising availability, reliability and the application of human and financial resources throughout their facilities operational life cycle, from commissioning through to decommissioning. OMARR Peer Reviews, to be initiated in 2012, will be available to Operating Organizations in all Member States with research reactors (RRs) under construction, commissioning or in operation. Robust design, careful manufacture and sound construction are all prerequisites for RR sustainable availability and reliability. However, a high quality operational and maintenance programme ultimately depends on effective management, sound policies, procedures and practices, on comprehensive instructions, on adequate resources and on the capability of the O&M personnel. A positive attitude and conscientiousness on the part of the management and the staff to learn lessons from internal and external experience is extremely important in enhancing performance. OMARR considers these aspects in assessing the effectiveness of a research reactor’s O&M experience feedback programmes. The assessment considers the
18 of 58 04/19/2013

application of IAEA and international standards and related technical reports. Although these standards establish an essential basis for effective O&M practises, the incorporation of more detailed requirements in accordance with national or international good practices may also be necessary. Moreover, some special aspects might need to be assessed by experts on a case by case basis. The IAEA Code of Conduct on the Safety of Research Reactors and the Optimization of Research Reactor Availability and Reliability Recommended Practices, IAEA Nuclear Energy Series, No. NP-T-5.4 document (see attachment 1 and 2), cover the baseline for good practises in RR O&M. The OMARR guidelines, based on these two documents, provide overall guidance for the experts to ensure the consistency, and comprehensiveness of the assessment. This could also be used by the facility to prepare a self-assessment report on the effectiveness of its O&M experience feedback processes. It recommends the required expertise of the OMARR team members themselves and forms the bases of the assessment. OMARR missions are performance oriented in that they accept different approaches to O&M management that represent good practices and may contribute to ensuring a good operational availability and reliability on the part of the operating organization. This is particularly true considering the broad diversity of facility’s mission, design, power level, age and available resources existing within the international RR community. Recommendations and potential solutions are made on items of direct relevance to O&M with a principal aim to improve performance. While suggestions made could also enhance plant Nuclear safety, these are considered a secondary, although positive outcome, more directly related to the objective of INSARR Missions. Whenever O&M improvements are relevant, good practices and lessons learned identified at given facilities may be communicated either anonymously or facility specific to other facilities after approval by the Operating Organisation. The OMARR service, focusing on O&M improvements, is one of a suite of complementary services offered by the IAEA for the research reactor community. Other services include:
IRSRR (Incident Reporting System for Research Reactors);
INSARR (Integrated Safety Assessment of Research Reactors);
RRDB (Research Reactor Database);
RRADB (Research Reactor Ageing Database);
General expert missions, workshops and training events.
2.0 OMARR Guidelines Although the IAEA has been carrying out research reactor safety reviews since 1972, in order to
meet the individual operating organizations’ and Member States’ increasing requests for
assistance to ensure and improve research reactor availability and reliability, the IAEA is
announcing the creation of a formal research reactor peer review service.
OMARR missions will be initiated by the operating organisations. The OMARR will consist of up
to three missions: a Pre-OMARR Mission, the Main Mission and a Follow Up Mission if
requested by the facility.
2.1 Pre-OMARR Mission
The Pre-OMARR mission has the duration of 2 to 3 days and is performed by a team consisting
of one or two IAEA staff members with relevant O&M experience and experts from IRON if
deemed necessary. The purpose of this mission is to discuss and to agree with the Operating
19 of 58 04/19/2013

Organization the conduct of the Main Mission. The items discussed during the Pre-OMARR
mission are normally:
the main features of the OMARR Mission;
scope of the review indicating where applicable the specific topics to be reviewed;
walk-through of the facility;
definition of the information to be provided before the Main Mission (advanced
information package);
overview of the facility design and modifications;
overview of the O&M organisations;
overview of the documentation available;
logistic support and financial arrangements,
a work plan for the Operating Organization, and for the OMARR-team, to be performed
before the Main Mission.
The Pre-OMARR Mission usually takes place 2 to 4 months before the Main Mission.
2.2 Main OMARR Mission
The main objective of the OMARR is to conduct a comprehensive O&M review of the research
reactor facility, to suggest areas of improvement, potential solutions and to identify good
practices. The OMARR recommendations can also be used to disseminate implementation
practices within the RR community upon agreement by the recipient facility. An important spin-
off from the OMARR will be the mutual transfer of knowledge and experience between experts
and reactor personnel and the development of self-assessment capabilities among the team
members to be applied in their own facilities, to the extent that the OMARR team recognized it
as good practice and recommended it for application at other facilities.
The duration of the Main Mission varies from 1 to 2 weeks depending on the reactor complexity
and topics to be reviewed. A team leader and a deputy team leader (one Agency staff member
with relevant O&M experience) and at least three external experts constitute the review team.
The size of the team should be tailored to the facility which requested the OMARR. Observers
from organizations receiving a future OMARR may be invited to participate depending on the
acceptance of the recipient facility.
Qualification of the OMARR team members is very important and experts should:
have preferably ten years of recent experience in research reactor O&M or a specific
area of expertise;
currently hold a senior position responsible for the specific area of review and preferably
five years in that area;
have mission depended language skills and good command of English;
have skills as an evaluator.
The team members are preferably recruited from IRON partners, research reactor personnel
and operating organizations, and, if needed, designers, constructors, or private consultants.
Every team member will sign a Confidentiality Agreement before starting to receive information
from the host institution.
20 of 58 04/19/2013

The OMARR teams carry out comprehensive, independent assessments of research reactor
facilities and O&M practises. Also, they exchange experience with reactor personnel by the
means of personal or group interviews. The duration of an OMARR depends on its objectives
and scope (typically one to two weeks). Among the areas normally covered are the topics listed
in IAEA Nuclear Energy Series No. NP-T-5.4, 'Optimization of Research Reactor Availability and
Reliability: Recommended Practices, which are:
1. CUSTOMER/USER EXPECTATIONS. . . . . . . . . . . . . . . . . . . . . . . . . . . . . . . . . . . . . . . . . .
Identification of the customer base . . . . . . . . . . . . . . . . . . . . . . . . . . . . . . . . . . . . . . . . Facility needs . . . . . . . . . . . . . . . . . . . . . . . . . . . . . . . . . . . . . . . . . . . . . . . . . . . . . . . . Reactor scheduling . . . . . . . . . . . . . . . . . . . . . . . . . . . . . . . . . . . . . . . . . . . . . . . . . . . . Communication with the customer . . . . . . . . . . . . . . . . . . . . . . . . . . . . . . . . . . . . . . . .
2. FUEL CYCLE AND CORE MANAGEMENT . . . . . . . . . . . . . . . . . . . . . . . . . . . . . . . . . . . . .
Front end . . . . . . . . . . . . . . . . . . . . . . . . . . . . . . . . . . . . . . . . . . . . . . . . . . . . . . . . . . . . utilization . . . . . . . . . . . . . . . . . . . . . . . . . . . . . . . . . . . . . . . . . . . . . . . . . . . . . . . . . . . . Back end . . . . . . . . . . . . . . . . . . . . . . . . . . . . . . . . . . . . . . . . . . . . . . . . . . . . . . . . . . . . Non-uranium bearing strategic materials . . . . . . . . . . . . . . . . . . . . . . . . . . . . . . . . . .
3. MAINTENANCE . . . . . . . . . . . . . . . . . . . . . . . . . . . . . . . . . . . . . . . . . . . . . . . . . . . . . . . . .
Preventive/predictive maintenance . . . . . . . . . . . . . . . . . . . . . . . . . . . . . . . . . . . . . . . . Inspection, test and surveillance . . . . . . . . . . . . . . . . . . . . . . . . . . . . . . . . . . . . . . . . . . Corrective maintenance. . . . . . . . . . . . . . . . . . . . . . . . . . . . . . . . . . . . . . . . . . . . . . . . . Breakdown maintenance Maintenance assessment . . . . . . . . . . . . . . . . . . . . . . . . . . . . . . . . . . . . . . . . . . . . . . . Plant life management assessment . . . . . . . . . . . . . . . . . . . . . . . . . . . . . . . . . . . . . . . Work control programme . . . . . . . . . . . . . . . . . . . . . . . . . . . . . . . . . . . . . . . . . . . . . . . . Maintenance of critical external services. . . . . . . . . . . . . . . . . . . . . . . . . . . . . . . . . . . .
4. DESIGN CONSIDERATIONS . . . . . . . . . . . . . . . . . . . . . . . . . . . . . . . . . . . . . . . . . . . . . . . . .
Review of the design for impact on reactor availability . . . . . . . . . . . . . . . . . . . . . . . . . Review of the design for impact on reactor reliability. . . . . . . . . . . . . . . . . . . . . . . . . . . Review of the design for maintainability. . . . . . . . . . . . . . . . . . . . . . . . . . . . . . . . . . . . . Review for site integration . . . . . . . . . . . . . . . . . . . . . . . . . . . . . . . . . . . . . . . . . . . . . . . . . .
5. CONFIGURATION MANAGEMENT . . . . . . . . . . . . . . . . . . . . . . . . . . . . . . . . . . . . . . . . . . .
Documentation control programme . . . . . . . . . . . . . . . . . . . . . . . . . . . . . . . . . . . . . . . . Equipment (SSC) Change control . . . . . . . . . . . . . . . . . . . . . . . . . . . . . . . . . . . . . . . . . Temporary plant configuration changes . . . . . . . . . . . . . . . . . . . . . . . . . . . . . . . . . . . .
6. REGULATORY INTERFACE . . . . . . . . . . . . . . . . . . . . . . . . . . . . . . . . . . . . . . . . . . . . . . . .
.Communication levels . . . . . . . . . . . . . . . . . . . . . . . . . . . . . . . . . . . . . . . . . . . . . . . . . Regulatory body director/operating organization — senior management level . . . . . . .
21 of 58 04/19/2013

Inspectorate/operating organization . . . . . . . . . . . . . . . . . . . . . . . . . . . . . . . . . . . . . . .
Expert level/operating organization — technical counterpart . . . . . . . . . . . . . . . . . . . . Communication principals . . . . . . . . . . . . . . . . . . . . . . . . . . . . . . . . . . . . . . . . . . . . . . . Action/commitment tracking programme. . . . . . . . . . . . . . . . . . . . . . . . . . . . . . . . . .
7. HUMAN RESOURCE MANAGEMENT . . . . . . . . . . . . . . . . . . . . . . . . . . . . . . . . . . . .
Planning . . . . . . . . . . . . . . . . . . . . . . . . . . . . . . . . . . . . . . . . . . . . . . . . . . . . . . . . . . Hiring . . . . . . . . . . . . . . . . . . . . . . . . . . . . . . . . . . . . . . . . . . . . . . . . . . . . . . . . . . . . . . . Continuing training and qualification . . . . . . . . . . . . . . . . . . . . . . . . . . . . . . . . . . . . . . . Knowledge management and succession planning. . . . . . . . . . . . . . . . . . . . . . . . . . . . Outsourcing. . . . . . . . . . . . . . . . . . . . . . . . . . . . . . . . . . . . . . . . . . . . . . . . . . . . . . . . . Management support . . . . . . . . . . . . . . . . . . . . . . . . . . . . . . . . . . . . . . . . . . . . . . . . . . . . . . . .
8. MANAGEMENT INITIATED IMPROVEMENTS .
Corrective action programmes (also called continuous improvement or operating experience
(OPEX) programmes) . . . . . . . . . . . . . . . . . . . . . . . . . . . . . . . . . . . . . . . . . . . . . . . . . Document control programmes . . . . . . . . . . . . . . . . . . . . . . . . . . . . . . . . . . . Equipment configuration control (also called physical plant status or alignment control) Communication improvement programmes . . . . . . . . . . . . . Operation and maintenance philosophy . . . . . . . . . . . . . . Conservative decision making . . . . . . . . . . . . . . . . . . . . . . Internal and external assessments . . . . . . . . . . . . . . . . . Procedural use and compliance . . . . . . . . . . . . . . . . . . . . . Peer networking . . . . . . . . . . . . . . . . . . . . . . . . . . . . . . . . . . . .
9. PUBLIC RELATIONS . . . . . . . . . . . . . . . . . . . . . . . . . . . . .
Visits . . . . . . . . . . . . . . . . . . . . . . . . . . . . . . . . . . . . . . . . . . Internal communication. . . . . . . . . . . . . . . . . . . . . . . . . . . External communication . . . . . . . . . . . . . . . . . . . . . . . . . . . . . . .
10. PERFORMANCE MONITORING. . . . . . . . . . . . . . . . . . . . . . . . . . .
Continuity and consistency . . . . . . . . . . . . . . . . . . . . . . . . . Operational performance . . . . . . . . . . . . . . . . . . . . . . . . . . . . Maintenance performance. . . . . . . . . . . . . . . . . . . . . . . . . . . Health physics/radiological control performance. . . . . . . Performance reporting. . . . . . . . . . . . . . . . . . . . . . . . . . . .
Not all of the above topics may need to be addressed and this will depend on the host facility to
determine which of the above areas are to be included. Also there may be some issues that
may be added to the scope of the mission which while not strictly related to availability and
reliability, may have an impact such as industrial safety issues.
In order to review current practises the OMARR team will address:
scope of the review indicating where applicable the specific topics to be reviewed;
22 of 58 04/19/2013

walk-through of the facility;
definition of the information to be provided before the Main Mission (advanced
information package);
overview of the facility design and modifications;
overview of the O&M organisations;
overview of the documentation available;
logistic support and financial arrangements,
a work plan for the Operating Organization, and for the OMARR-team, to be performed
before the Main Mission.
the facility O&M documentation including: procedures, instructions, surveillance, daily
logs, and reporting processes;
the integrated management system (with the focus on procedures and record-keeping);
the configuration management programme (e.g. drawing and document control,
engineering change control, vendor and supplier document control);
engineering project management and control of modifications;
the conduct of operations;
the maintenance programme;
ageing management programme;
procedures related to operational performance monitoring (e.g. planning, performance
indicator programme);
personnel training, (re)qualification and succession planning;
the organization of O&M staff arrangements, and;
areas requested by the operating organization.
Prior to the actual visit to the facility, the team may decide it necessary to meet at a convenient
venue in the host country and review:
specific OMARR objectives;
information received from the facility;
the preliminary schedule and team arrangements;
roles and responsibilities of team members.
At the site, the team:
conducts an entry meeting with the host management to review the OMARR objectives;
meets the host contacts, and reviews logistical arrangements and communication
protocols to be followed;
assesses the implementation of the integrated management system, including
configuration management;
examines O&M documentation of the reactor facility to compare programme
implementation with procedural guidance;
reviews operational records and performance of the reactor, observing routine
operations and if possible start-up and shutdown;
reviews maintenance procedures and records and ageing management processes;
assesses routine maintenance and breakdown maintenance support (including
computer based systems), if possible observing maintenance practises and reporting
such as routine calibrations, and breakdown servicing of major equipment;
23 of 58 04/19/2013

reviews training records and, if possible, observes classroom, simulator or on-the-job
training in practice;
discusses technical details with the responsible personnel, operational, engineering and
maintenance staff;
reviews the engineering procedures, records and project management of modifications,
changes and upgrades, and;
assesses other areas as requested by the host facility.
Issues identified by the reviewer must be:
supported by facts;
based on a comparison with generally accepted good practices;
agreed by the OMARR team;
and presented to and accepted by the facility management.
The implication of each issue on operations, or maintenance performance should be clearly
elaborated. The OMARR team identifies issues for which it provides either a recommendation or
a suggestion and, if possible, a solution. Good practices are also indicated. The definition for
each one is as follows:
Recommendation: team advice on how to improve O&M practises. It is based on
standards and proven, good international practices and addresses the root causes
rather than the symptoms of the identified concern.
Suggestion: an additional team proposal in conjunction with a recommendation. It may
indirectly contribute to improvements in operational safety but is primarily intended to
make a good performance more effective.
Good Practice: an activity or use of equipment, which the team considers to have
demonstrably improved performance relative to peer facilities (similar mission, power
level and operational context).
Daily meetings between OMARR team and facility staff are held during the Main mission, where
all issues are presented and discussed. At the end of the OMARR, the team conveys its
preliminary conclusions and recommendations at a final, exit meeting. Subsequently, an
OMARR report is submitted to the Facility Management. The official report is produced by the
team leader and sent to the host institution through the IAEA.
2.2 Follow-Up OMARR Mission
If requested by the host facility, a Follow-up Mission may take place approximately 12 months
after the Main Mission. The duration, scope, reporting and the necessary expert team are
determined in line with the arrangements of the original Main Mission.
3.0 OMARR EXPENSES
OMARR missions are an Agency service normally provided cost-free to operating organisations
located in those Member States which are considered to be developing countries. The question
of payment for OMARR missions requested by operating organisations in those Member States
which are not developing countries and for special OMARR missions dealing with issues other
24 of 58 04/19/2013

than the ones normally dealt with, is settled on a case-by-case basis, with the requesting
operating organisation.
4.0 REFERENCES
IAEA Nuclear Energy Series No. NP-T-5.4, 'Optimization of Research Reactor Availability and
Reliability: Recommended Practices
25 of 58 04/19/2013

IN-CORE FUEL MANAGEMENT OPTIMISATION WITHIN THE OSCAR-4 CODE SYSTEM
E.B. SCHLÜNZ, R.H. PRINSLOO, P.M. BOKOV Radiation and Reactor Theory, The South African Nuclear Energy Corporation (Necsa)
Elias Motswaledi Street, 0240 Pelindaba – South Africa
ABSTRACT
The OSCAR-4 code is a deterministic core calculational system, which utilises response-matrix methods for few-group cross-section generation and multigroup nodal-diffusion methods for the three-dimensional global solution. The code system is geared towards typical reactor analysis activities. As such, it automates core-follow and reload calculations. A new support feature has been developed for the OSCAR-4 code system, namely a module for multiobjective in-core fuel management optimisation (ICFMO). This optimisation module incorporates a scalarising objective function to suitably model multiple objectives in order to achieve balanced solutions. A metaheuristic technique, known as harmony search, has been adapted for, and used to solve the ICFMO problem. The capabilities of the ICFMO feature for OSCAR-4 are demonstrated in this paper. Several test problem scenarios have been created for the SAFARI-1 research reactor, each containing different typical reactor utilisation goals and prioritisations thereof. The goals include isotope production, fuel economy and neutron flux levels in experimental devices, with constraints specifying the adherence to the standard safety envelope. The optimisation module has been used to optimise the reload configuration for each test problem and the solutions are compared to that obtained by using a typical operational reload strategy. As the results indicate, the ICFMO feature of OSCAR-4 is effective to produce good reload configurations from cycle to cycle, within an acceptable computational budget.
1. Introduction The in-core fuel management optimisation (ICFMO) problem refers to the problem of finding an optimal fuel reload configuration for a nuclear reactor core. Problem characteristics for ICFMO include: high dimensionality, discrete variables, nonlinear and nonconvex functions, and computationally expensive function evaluations [1]. In many cases, the problem is also multiobjective in nature, depending on the type of reactor and its operational requirements. The OSCAR code system (Overall System for the CAlculation of Reactors) has been used for several years as the primary calculational tool to support the day-to-day operations of the SAFARI-1 research reactor in South Africa [2, 3]. The development of an ICFMO module as a new support feature for OSCAR-4 [2] (the latest version of the code system) stems from the strong drive towards commercialisation of research reactors (e.g. via isotope production), as well as the ongoing requirement to service research and development activities. The in-core fuel management strategy becomes a critical component in reactor operations in order to utilise a reactor effectively for all production, research and safety requirements. In this paper, the capabilities of the new ICFMO feature for OSCAR-4 are demonstrated by applying it to several test problem scenarios that have been created for SAFARI-1. Each scenario contains different typical reactor utilisation goals. The fuel reload configurations obtained for each of the scenarios are then compared to a typical operational reload strategy. The paper is organised as follows. Section 2 contains a brief description of the OSCAR code system, followed by Section 3 that contains a description of the ICFMO module. Section 4 starts with a short description of the SAFARI-1 research reactor, followed by information about the test problem scenarios. The optimisation results are presented in Section 5 and finally the conclusions of the paper are reported in Section 6.
26 of 58 04/19/2013

2. The OSCAR code system The Radiation and Reactor Theory (RRT) section at Necsa provides calculational support to SAFARI-1 in terms of core-follow and reload calculations, as well as for safety analyses. As stated above, the OSCAR code system is the primary tool used for this function. The system is also being used by reactor calculation groups at NRG Petten [4] and Delft University in the Netherlands [5]. The OSCAR-4 code [2] is a deterministic core calculational system, which utilises response-matrix methods for few-group cross-section generation and multigroup nodal-diffusion methods for the three-dimensional global solution. Few group homogenised cross-sections are generated by the two-dimensional collision-probability based HEADE code (HEterogeneous Assembly DEpletion) for use in the three-dimensional global diffusion solver. Core calculations are performed with the three-dimensional multigroup nodal-diffusion simulator, called MGRAC (Multi-Group Reactor Analysis Code), which employs the multi-group analytic nodal method.
3. The optimisation module for ICFMO The ICFMO feature of OSCAR-4 optimises the fuel reload configuration of a reactor at the beginning of one of its operational cycles. The optimisation module receives as input: a core layout that indicates the fuel loading positions, the available fuel assemblies that may be loaded into the core, the objective(s) to optimise, the constraint(s) to adhere to, and finally, the number of iterations that the optimisation algorithm should perform. The optimisation algorithm is initialised by default with random solutions (fuel reload configurations) and iteratively generates new candidate solutions in an attempt to improve the objective function. However, it may also be initialised with user-defined configurations, should this be desired. The algorithm learns from its search history as it progresses, in order to generate improving candidate solutions at subsequent iterations. Candidate solutions are evaluated by the OSCAR-4 system, which returns operational and/or safety related parameters in the core that may appear as objectives or constraints. Reactor core calculations are typically computationally expensive. The total running time for an optimisation algorithm that attempts to solve the ICFMO problem is directly linked to the type of reactor calculation being performed by the system when a candidate solution is evaluated. Depletion calculations (such as burning to end-of-cycle (EoC), or to an equilibrium cycle) would require too much computational time for an optimisation algorithm to effectively explore the search space within a limited computational budget. As such, only beginning-of-cycle (BoC) calculations are performed for the optimisation module by OSCAR-4 at present. This allows more candidate solutions to be evaluated within limited time frames. However, it also implies that objectives and constraints require BoC formulations, thereby excluding fuel economy considerations that require depletion calculations. In order to overcome this deficiency, a naïve uranium-235 (235U) depletion calculation has been implemented to estimate EoC fuel assembly 235U masses. The underlying assumption for this calculation is that power levels in the fuel assembly positions (at BoC with equilibrium xenon conditions) remain constant throughout the operational cycle. Let mBoC and mEoC denote the BoC and EoC 235U mass (in grams) in a specific fuel assembly, respectively. Let Ė denote the power level (MW) in the fuel assembly’s position and let ℓ denote the estimated cycle length (in days). Finally, let β denote the user defined 235U burn rate (in grams per
megawatt-day). The EoC 235U mass in the fuel assembly can then be estimated as
mEoC ≈ mBoC – β×Ė×ℓ . (1)
These estimated EoC fuel assembly 235U masses may be used to determine the discharge mass/burnup of assemblies in order to take fuel economy into consideration, without the need of depletion calculations by OSCAR-4.
27 of 58 04/19/2013

3.1 Constraint handling and objective function formulation All ICFMO problems are formulated as minimisation problems in the optimisation module, and a penalty function approach is incorporated for constraint handling. Let J be the number of constraints in an ICFMO problem and let x denote a candidate solution (fuel reload
configuration). Without loss of generality, the constraint set may be formulated as
hj(x) ≤ Hj, j = 1,…, J , (2)
where hj(x) denotes the parameter value of constraint j (returned by OSCAR-4 after the evaluation of x) and Hj denotes the constraint limit. If a candidate solution violates any of the
constraints, a corresponding penalty value is incurred for that violation and added to the objective function value. This penalty value is related to the magnitude of the constraint violation. The penalty function P(x) adopted in the optimisation module is defined as
(3) Single objective, as well as multiobjective, ICFMO problem formulations are incorporated into the optimisation module. Let n be the number of different objectives. Let fi (x) denote the parameter value of objective i returned by OSCAR-4 after the evaluation of x, for i = 1,…,n.
An augmented weighted Chebychev goal programming approach [6, 7] has been implemented in the module as a scalarising objective function. This approach introduces the concept of an aspiration level αi for each objective i and should be specified a priori by the
decision maker. According to the satisficing principle in [6], decision makers strive for improvement in any one objective up to a point of “sufficient satisfaction,” after which attention is turned to improve other objectives. Therefore, we define the aspiration level of an objective as the value at which optimisation towards that objective may stop and the decision maker would be satisfied with it. Aspiration levels may or may not be attainable. The optimisation module solves a multiobjective ICFMO problem by minimising the distance between the objective vector F(x) = [ f1(x), f2(x), … , fn(x) ] of a solution x and the aspiration vector Α = [α1, α2, … , αn] according to the Chebychev norm. Therefore, the maximum
deviation of any objective from its aspiration level is minimised. If, for a particular solution, the maximum deviation cannot be improved upon, it may still be possible to improve achievements in the other objectives. In order to overcome such occurrences, an augmentation term is added to the Chebychev problem. Therefore, the objective of a multi-objective ICFMO problem is to minimise the function
(4) with wi and ki denoting the relative importance weight and the scaling/normalisation factor, respectively, associated with objective i. The parameter ρ is a sufficiently small positive scalar ensuring that the augmentation term does not nullify the Chebychev term. For a single objective formulation (i.e. n = 1), the maximum-operator may be disregarded and the value of ρ may be set to zero. Furthermore, the aspiration level should be chosen as an unattainable value in order to search for the optimum solution.
3.2 Harmony search algorithm A metaheuristic algorithm called harmony search (HS) [8] has been adapted for ICFMO and implemented in the optimisation module for solving the problem. The HS algorithm is inspired by the musical phenomenon of harmony – an aesthetically pleasing combination of sounds.
,)()()(max1
,...,1 xPxf
k
wxf
k
wz
n
i
ii
i
iii
i
i
nin
otherwise. ,
if , where,
0
,)()(
)()()(1
jj
j
jj
j
J
j
j
HxhH
Hxh
xpxpxP
28 of 58 04/19/2013

The analogy for the HS algorithm is as follows. The optimisation algorithm seeks an optimal solution by combining different values from decision variables, analogous to a musical performance seeking a perfect harmony by playing different sounds on musical instruments. Furthermore, the objective function value can be improved iteration by iteration in the algorithm, just as the harmony can be improved through practice after practice in the performance. The reader is referred to [8] for a description of the basic algorithm. In our implementation of the HS algorithm, a solution to the ICFMO problem is represented by a permutation vector. We adapted the procedure in HS that creates a new solution in order to accommodate our permutation vector representation of a solution. The adaptation enabled the procedure to create unbiased and valid solutions without the need of a repair procedure. Furthermore, the so-called pitch adjustment step in HS, serving as a local perturbation step, was adapted to perform pair-wise swaps between variables after a solution vector has been created, instead of the classical single-variable modifications that are performed during the creation of a solution.
4. Application of the optimisation module In order to demonstrate the capabilities of the new ICFMO support feature of OSCAR-4, several test problem scenarios have been created for the SAFARI-1 research reactor. Each scenario contains typical reactor utilisation goal(s) and prioritisations thereof, with the standard safety envelope being adhered to at all times. This section contains a brief description of the SAFARI-1 reactor, followed by the specifications for each scenario.
4.1 The SAFARI-1 research reactor SAFARI-1 is a 20 MW tank-in-pool type materials testing reactor situated at Pelindaba in South Africa. The reactor is owned and operated by the South African Nuclear Energy Corporation Ltd (Necsa) and has been used for nuclear and materials research for more than 40 years. In addition to research, SAFARI-1 has also been steered towards commercial utilisation. Irradiation services for isotope production, such as molybdenum-99 (99Mo), and silicon doping are some of the most important contributors to the reactor’s commercial utilisation. The core layout of the SAFARI-1 model in OSCAR-4 is presented in Figure 1. The SAFARI-1 core consists of a 9×8 lattice which houses 26 low-enriched uranium fuel assemblies, 6 control rods of fuel-follower type, 7 isotope production rig facilities for 99Mo production, as well as various other core components. In this paper, only 26 fuel assemblies are considered for placement into the 26 fuel loading positions of the core. The reactor is also equipped with a number of beam tubes which are used for the neutron scattering (Tube 1), neutron radiography (Tube 2) and neutron diffraction (Tube 5) facilities.
4.2 Specifications for the scenarios The constraints of the standard safety envelope considered for the scenarios impose limits on the relative power peaking factor (PPF), the control bank worth (CBW) and the shutdown margin (SM) of the reactor. An additional 99Mo utilisation constraint for adherence to a minimum level of 99Mo yield per rig (denoted by MoCon) is also considered. However, the specific limiting values of these constraints are proprietary knowledge and thus not reproduced here. In order to judge the capabilities of the optimisation module, a Reference Scenario has been established by configuring the fuel assemblies in SAFARI-1 according to a typical operational reload strategy. This strategy attempts to level the neutron flux profile over the core and does not seek to optimise any utilisation parameters.
29 of 58 04/19/2013

4.2.1 Scenario 1: Maximisation of fuel economy Scenario 1 has the goal of maximising the fuel economy of the reactor, subject to production and research constraints. The production constraint specifies adherence to a minimum economically viable 99Mo yield, while the research constraint specifies adherence to minimum acceptable thermal neutron intensities at all 3 beam tubes (90% of the reference scenario levels). In order to achieve this scenario’s goal, the single objective ICFMO problem formulation is to minimise the estimated EoC discharge mass of 3 fuel assemblies (chosen a priori as the number of assemblies to be discharged), subject to the production, research, standard safety envelope, and additional utilisation constraints. Theoretically, there is a constraint on the minimum discharge mass of an assembly due to its physical and design properties. However, no assembly in the SAFARI-1 core is remotely close to this limit and hence, the constraint may be disregarded without influencing the problem.
4.2.2 Scenario 2: Maximisation of research objectives Scenario 2 is considered a pure research utilisation-orientated scenario and has the goal of simultaneously maximising the thermal neutron intensity at all 3 neutron beam tubes. In order to achieve this goal, the multiobjective ICFMO problem formulation is to maximise the thermal neutron flux in each of the 3 beam tubes, subject to the standard safety envelope constraints. Since this is a multiobjective scenario with 3 objectives, the decision maker needs to supply aspiration levels, weights and scaling factors for each objective. Aspiration levels were chosen as unattainable optimistic values. Equal weights of 1.0 were assigned to the beam tube objectives. The scaling factor values were defined as the difference between an objective’s aspiration level and its worst feasible value found thus far. Thus, the scaling factors are dynamically updated during the search algorithm’s progression. This definition of the scaling factors is also used for the subsequent scenarios.
4.2.3 Scenario 3: Maximisation of production objectives A pure production utilisation-orientated scenario is considered in Scenario 3. The goal is to simultaneously maximise the production of 99Mo and the silicon doping capacity. In order to achieve this goal, the multiobjective ICFMO problem formulation is to maximise the power levels in the 99Mo rig positions and maximise the thermal neutron flux in the silicon doping facility, subject to the standard safety envelope constraints and the additional 99Mo utilisation constraint (minimum 99Mo yield per rig). Aspiration levels were chosen as highly optimistic values while a weight of 1.5 was assigned to the 99Mo objective and 1.0 to the Silicon objective.
Fig 1: The core layout the SAFARI-1 model
30 of 58 04/19/2013

4.2.4 Scenario 4: Maximisation of research-production objectives In Scenario 4, we now combine the goals of Scenario 2 and 3 in order to create a comprehensive research-production scenario. In order to achieve this goal, the multiobjective ICFMO problem formulation is to maximise the power levels in the 99Mo rig positions, maximise the thermal neutron flux in the silicon doping facility, and maximise the thermal neutron flux in each of the 3 beam tubes, all subject to the standard safety envelope constraints and the additional 99Mo utilisation constraint. The aspiration levels were chosen to be the same as in Scenario 2 and 3. A weight of 1.5 was assigned to the 99Mo objective, 1.0 to the Silicon objective, and 0.5 to each of the beam tube objectives.
5. Results The ICFMO problems contained in the 4 scenarios were solved via the new optimisation module for OSCAR-4. Since the HS algorithm is a stochastic technique, 6 independent solution calculations (using different random seeds) were performed for each scenario. It was empirically found that, in general, 900 iterations yielded suitable convergence levels for our test scenarios during a search instance. Thus, the termination criterion for the algorithm was set at a maximum of 900 iterations (objective function evaluations). This resulted in an optimisation algorithm execution time of approximately 2.5 days on a personal computer for a single solution calculation. Such a computational running duration is acceptable within the context of a typical shutdown and reload period for SAFARI-1, lasting 5 days. The best solution obtained for each scenario is presented in this section. The objective parameter values of these best solutions are scaled according to the parameter values of the reference scenario. However, with multiobjective problems such as Scenario 2, 3 and 4, selecting a “best” solution is not as simple as comparing the objective function values of the best solutions in each of the 6 computational runs. A direct comparison between objective function values does not take into account the fact that the objectives may be scaled differently (due to their scaling factors that are dynamically updated). Since multiobjective solutions typically consist of trade-offs between individual objectives (because of conflicting objectives), the objective vectors of the 6 best solutions should rather be considered together. A single best solution that optimises all the (possibly conflicting) objectives may not even exist. The decision maker should thus identify a “best” solution according to the (subjective) compromise/trade-off that is the most acceptable to him/her. It was found that the best solutions obtained for each scenario were all feasible (i.e. the penalty function attained a value of zero). Their constraint parameter values are reported here together and have been scaled according to the limiting values. These scaled parameter values for the standard safety envelope and additional utilisation constraint of each scenario are presented in Table 1.
Scenario PPF (<) CBW (>) SM (>) MoCon (>)
Reference 0.8143 1.5335 1.2058 1.2873
Scenario 1 0.9480 1.4616 1.0003 1.0989
Scenario 2 0.9321 1.4269 1.0177 -
Scenario 3 0.9104 1.5061 1.1223 1.1931
Scenario 4 0.8400 1.4145 1.0184 1.1617
Tab 1: Scaled parameter values for the constraints of all the scenarios
5.1 Scenario 1: Maximisation of fuel economy As described in Section 3, we implemented a simplified model for fuel economy estimation and essentially it entails the usage of the BoC power distribution to estimate the EoC discharge burnup. When applying this model to the Reference Scenario, the estimation of
31 of 58 04/19/2013

total discharged mass yields 451.95 g (sum of 3 ejected element masses). On the other hand, when considering the best solution obtained by the optimisation module, this value is improved to 444.28 g. The scaled parameter values for the production and research constraints of the best solution are presented in Table 2.
Tab 2: Scaled parameter values for the production and research constraints of Scenario 1 Of primary interest in this simplified approach is to rank appropriately various core configurations in terms of fuel economy, rather than to estimate the absolute values of the discharge masses correctly. A detailed analysis with OSCAR-4, simulating the power variation over a cycle for each of the two configurations, Reference and best, yields total EoC discharge masses of 461.61 g and 455.46 g, respectively (as compared to 451.95 g and 444.28 g). We may conclude that although the absolute value of the estimated total discharge mass is in error, the simplified approach correctly predicts that the best core improves upon the Reference by about 6 g. By comparing the actual 235U masses that were depleted (from this detailed cycle analysis), the best configuration depletes 6.15 g more 235U in the three elements to be discharged, during the cycle. If we consider that, in the Reference Scenario, the total mass burned in these three elements in the cycle is 61.38 g; we may conclude that our optimisation effort has improved the burnup in these elements, during this cycle by around 10%. Nevertheless, since the current focus is on improving the burnup of these three elements during their final cycle in the core (last cycle of a 10 cycle residence), the improvement in average discharge mass is only 0.61% per element. The true improvement in discharge mass per element would only be clear once this optimisation approach has been applied to multiple cycles. In Figure 2, the core configurations of the Reference Scenario and Scenario 1 are presented visually in terms of the 235U mass (in grams) in each fuel assembly. The optimised core configurations for the scenarios that follow are presented similarly, with the Reference configuration on the left hand side in each figure. We observe that the high-mass fuel assemblies (which generate higher power levels in their respective regions in the core) are located next to, or close by, the low-mass assemblies. This enables the low-mass assemblies to burn 235U as much as possible, since they are located in high power regions.
5.2 Scenario 2: Maximisation of research objectives The scaled objective vectors corresponding to the 6 best solutions obtained by the computational runs for Scenario 2 are presented in Table 3. In this scenario instance, a decision maker may choose solution 3 as being the best trade-off/compromise solution. It yielded improvements of 9.22% and 15.28% in the Tube 1 and Tube 2 objectives,
99Mo (>) Tube 1 (>) Tube 2 (>) Tube 5 (>)
1.2172 1.1827 1.1922 1.0205
Fig 2: The core configurations of the Reference Scenario (left) and Scenario 1 (right)
32 of 58 04/19/2013

respectively, and worsened the Tube 5 objective by 1.31%, compared to the Reference solution. This best solution for Scenario 2 is depicted in Figure 3 on the right hand side. The improvements in the Tube 1 and Tube 2 objectives may be attributed to more 235U mass that are now located in columns 3 and 4, rows B to F. However, some of the high-mass assemblies are still located on core periphery in order to satisfy the safety envelope.
Solution Tube 1 Tube 2 Tube 5
1 +10.78% + 4.99% –11.10%
2 +11.07% +13.88% – 6.86%
3 + 9.22% +15.28% – 1.31%
4 +10.18% +12.36% – 2.37%
5 +11.33% + 9.37% – 9.62%
6 +11.34% +14.26% – 5.51%
Tab 3: Scaled objective vectors for Scenario 2
5.3 Scenario 3: Maximisation of production objectives The scaled objective vectors corresponding to the 6 best solutions obtained for Scenario 3 are presented in Table 4. In this scenario instance, a decision maker may choose solution 2 as the best trade-off solution. It yielded an improvement of 1.48% in the 99Mo yield objective, and worsened the Silicon objective by 5.0%, compared to the Reference solution. The core configurations of the Reference Scenario and Scenario 3 are presented in Figure 4. In the Reference Scenario reload configuration, high-mass fuel assemblies are placed on the periphery of the core in an attempt to level the neutron flux profile over the core. As a result, row H consists of many high-mass assemblies, and they are adjacent to the silicon doping facility. The Reference configuration thus already yields a very high Silicon objective value. With our objective weighting that was biased towards 99Mo yield (a weight of 1.5 versus 1.0 for Silicon), it could be expected that the solutions obtained by the optimisation module would improve the 99Mo and decrease the Silicon by a noticeable margin, as reflected in Table 4.
Solution 99Mo yield Silicon
1 +0.89% –2.47%
2 +1.48% –5.00%
3 +0.89% –6.05%
4 +1.48% –6.21%
5 +1.18% –5.78%
6 +0.89% –6.83%
Tab 4: Scaled objective vectors for Scenario 3
Fig 3: The core configurations of the Reference Scenario (left) and Scenario 2 (right). The
labels “T1”, “T2” and “T5” denote the approximate locations of Tube 1, 2 and 5, respectively.
33 of 58 04/19/2013

Fig 4: The core configurations of the Reference Scenario (left) and Scenario 3 (right)
5.4 Scenario 4: Maximisation of research-production objectives The scaled objective vectors corresponding to the 6 best solutions obtained for Scenario 4 are presented in Table 5. In this scenario instance, a decision maker may choose solution 6 as being the best trade-off/compromise solution. It yielded improvements of 1.18%, 9.56% and 11.47% in the 99Mo yield, Tube 1 and Tube 2 objectives, respectively, when compared to the Reference Scenario solution. However, it worsened the Silicon and Tube 5 objectives by 6.51% and 2.16%, respectively. The best solution obtained for Scenario 4 is depicted in Figure 5 on the right hand side. The improvements in the 99Mo yield, Tube 1 and Tube 2 objectives, may be attributed to the high-mass fuel assemblies that are now located in column 3 (and 4). This leads to an improved 235U surrounding of the 99Mo rig positions, as well as a closer proximity of the assemblies to the beam tubes. However, this positioning occurs at the cost of the Silicon objective, since less 235U mass is now adjacent (row H) to the silicon doping facility.
Solution 99Mo yield Silicon Tube 1 Tube 2 Tube 5
1 +0.89% –8.32% +6.11% + 7.45% –2.23%
2 +0.89% –5.09% +5.02% + 5.10% –4.73%
3 +0.89% –7.67% +7.86% + 7.36% –6.13%
4 +1.18% –5.42% +4.78% + 4.97% –0.38%
5 +0.89% –8.08% +2.95% + 3.45% +1.42%
6 +1.18% –6.51% +9.56% +11.47% –2.16%
Tab 5: Scaled objective vectors for Scenario 4
Fig 5: The core configurations of the Reference Scenario (left) and Scenario 4 (right). The
labels “T1”, “T2” and “T5” denote the approximate locations of Tube 1, 2 and 5, respectively.
34 of 58 04/19/2013

6. Conclusion In this paper, a new ICFMO support feature for the OSCAR-4 code system has been presented. A scalarising objective function has been implemented to suitably model the multiple objectives of the ICFMO problem. This objective function is based on an augmented weighted Chebychev goal programming approach with penalty function constraint handling. The approach yielded well-balanced trade-off solutions for the multiobjective problem. A harmony search algorithm is utilised for solving the ICFMO problem. It was found that the HS algorithm performed well in obtaining good reload configurations and converging within an acceptable computational budget. The capabilities of this support feature were demonstrated on several test problem scenarios for the SAFARI-1 research reactor. The scenarios comprised optimisation goals of fuel economy, research, production and combined research-production capabilities. As an example, a trade-off solution obtained for the combined research-production scenario yielded significant improvements in two of the research objectives (9.56% and 11.47%), a slight improvement in one of the production objectives (1.18%), and worsened the remaining two objectives (–6.51% and –2.16%). The results indicate that the optimisation feature is effective at producing good reload configuration from cycle to cycle, within an acceptable computational budget. The automation of searching for good reload configurations, and the good quality configurations obtained by this optimisation feature may therefore greatly aid in the decision making of a reactor operator tasked with designing reload configurations.
7. Acknowledgments We wish to thank the National Research Foundation of South Africa for providing us with the funding in order to attend and present our work at the RRFM 2013 conference.
8. References [1] J.G. Stevens, K.S. Smith, K.R. Rempe and T.J. Downar, “Optimization of pressurized
water reactor shuffling by simulated annealing with heuristics”, Nuclear Science and Engineering, 121, pp. 67-88, 1995.
[2] G. Stander, R.H. Prinsloo, E. Müller and D.I. Tomašević, “OSCAR-4 code system application to the SAFARI-1 reactor”, International Conference on the Physics of Reactors (PHYSOR ’08), Interlaken, Switzerland, September 14-19, 2008.
[3] G. Ball, “Calculational support provided to SAFARI-1”, AFRA Regional Conference on Research Reactor Operation, Utilisation and Safety, Algiers, Algeria, April 10-11, 1999.
[4] J.A. Hendriks, C.M. Sciolla, S.C. van der Marck and J. Valkó, “Neutronics validation during conversion to LEU”, International Conference on the Physics of Reactors (PHYSOR ’06), Vancouver, Canada, September 10-14, 2006.
[5] P.F.A. de Leege, H.P.M. Gibcus and F. Reitsma, “Reactivity effects of a research reactor (HOR) during transition of a HEU to LEU core”, International Conference on the Physics of Reactors (PHYSOR ’02), Seoul, South Korea, October 7-10, 2002.
[6] T.J. Stewart, “The essential multiobjectivity of linear programming”, ORiON, 23(1), pp. 1-15, 2007.
[7] K. Miettinen, Nonlinear Multiobjective Optimisation, Kluwer Academic Publishers, Boston (MA), 1999.
[8] Z.W. Geem, J.H. Kim and G.V. Loganathan, “A new heuristic optimization algorithm: Harmony search”, Simulation, 76(2), pp. 60-68, 2001.
35 of 58 04/19/2013

FISSION CHAMBER MODELLING FOR MTR USE
P. FILLIATRE, C. JAMMESCEA, DEN, Cadarache, DER/SPEx/LDCI, F-13108 Saint-Paul-lez-Durance, France.
B. GESLOTCEA, DEN, Cadarache, DER/SPEx/LPE, F-13108 Saint-Paul-lez-Durance, France.
R. VEENHOFRD51 Collaboration
ABSTRACT
Fission chambers are nuclear detectors that are widely used to deliver online neutron flux measurements for mock-up reactors and material testing reactors. Those measurements have a wide range of applications, including characterization of experimental conditions, reactor monitoring and safety. Depending on the application, detectors may experience a wide range of constraints, of several magnitudes, in term of neutron flux, gamma-ray flux, temperature. Hence, designing a specific fission chamber for a given application is a demanding task, requiring experimental feedback and simulating tools, that are based on a comprehensive understanding of the underlying physics.
A computation route that simulates the neutron-induced charge spectrum and pulse shape of a fission chamber is presented. It is based on the GARFIELD suite, and makes use of the MAGBOLTZ and SRIM codes. It allows to simulate the signal in current and Campbelling modes. Computations made with several fission chambers exemplify the possibilities of the route. A good qualitative agreement is obtained when comparing the results with the experimental data available to date. After a further experimental qualification, this route will improve the design of fission chambers by assessing its overall sensitivity.
1. Introduction
On mock-up and material testing reactors, online neutron flux measurements are routinely performed by fission chambers. Those detectors may experience a wide range of constraints, of several magnitudes, in term of neutron flux, gamma-ray flux, temperature. Designing a specific fission chamber for a given application can be achieved by a combination of experimental feedback and simulating tools, the latter being based on a comprehensive understanding of the underlying physics. Another benefit is to increase the lifetime of fission chambers and perform an early diagnosis of failures [1,2].
In this paper, a computation route is presented that simulate the neutron-induced charge spectrum and pulse shape of a fission chamber based on the GARFIELD suite [3], which can be used for an evaluation of the signal in current and Campbelling modes in a way that completes previous efforts in this domain [4,5,6,7,8].
The paper is organized as follows. First, the simulation route is outlined; second, the results that can be obtained using common fission chambers as examples are presented; then we conclude.
36 of 58 04/19/2013
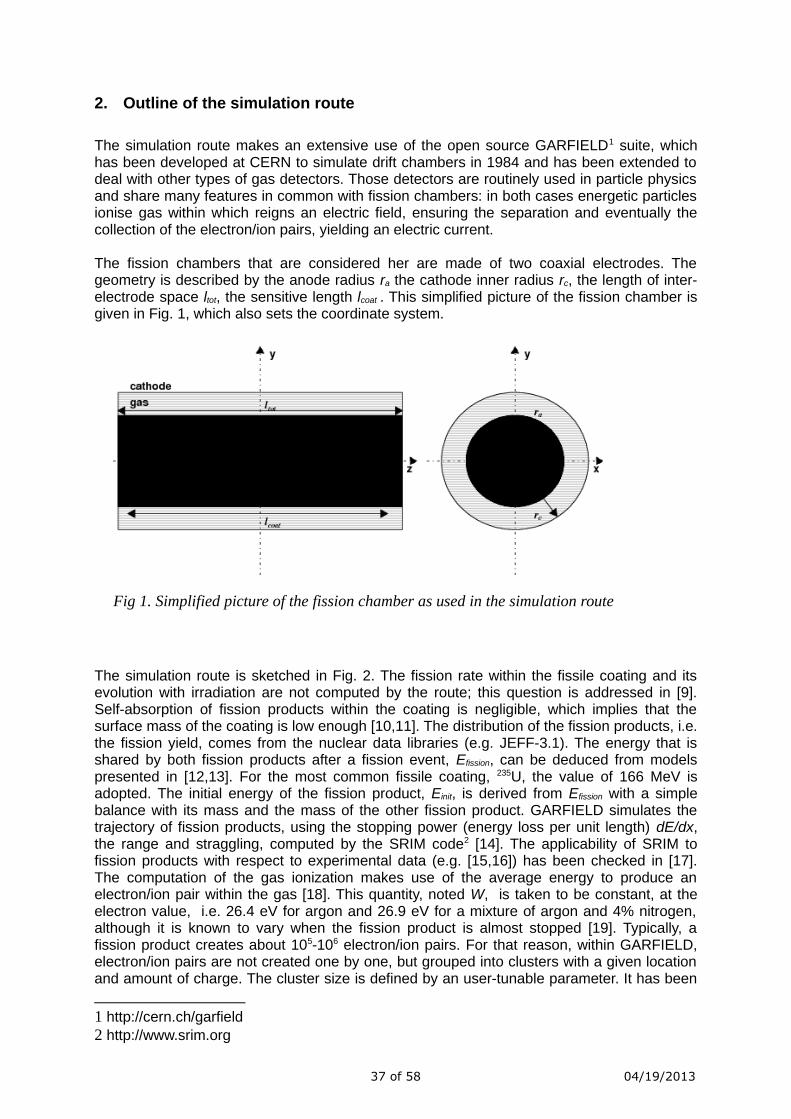
2. Outline of the simulation route
The simulation route makes an extensive use of the open source GARFIELD1 suite, which has been developed at CERN to simulate drift chambers in 1984 and has been extended to deal with other types of gas detectors. Those detectors are routinely used in particle physics and share many features in common with fission chambers: in both cases energetic particles ionise gas within which reigns an electric field, ensuring the separation and eventually the collection of the electron/ion pairs, yielding an electric current.
The fission chambers that are considered her are made of two coaxial electrodes. The geometry is described by the anode radius ra the cathode inner radius rc, the length of inter-electrode space ltot, the sensitive length lcoat . This simplified picture of the fission chamber is given in Fig. 1, which also sets the coordinate system.
The simulation route is sketched in Fig. 2. The fission rate within the fissile coating and its evolution with irradiation are not computed by the route; this question is addressed in [9]. Self-absorption of fission products within the coating is negligible, which implies that the surface mass of the coating is low enough [10,11]. The distribution of the fission products, i.e. the fission yield, comes from the nuclear data libraries (e.g. JEFF-3.1). The energy that is shared by both fission products after a fission event, Efission, can be deduced from models presented in [12,13]. For the most common fissile coating, 235U, the value of 166 MeV is adopted. The initial energy of the fission product, Einit, is derived from Efission with a simple balance with its mass and the mass of the other fission product. GARFIELD simulates the trajectory of fission products, using the stopping power (energy loss per unit length) dE/dx, the range and straggling, computed by the SRIM code2 [14]. The applicability of SRIM to fission products with respect to experimental data (e.g. [15,16]) has been checked in [17]. The computation of the gas ionization makes use of the average energy to produce an electron/ion pair within the gas [18]. This quantity, noted W, is taken to be constant, at the electron value, i.e. 26.4 eV for argon and 26.9 eV for a mixture of argon and 4% nitrogen, although it is known to vary when the fission product is almost stopped [19]. Typically, a fission product creates about 105-106 electron/ion pairs. For that reason, within GARFIELD, electron/ion pairs are not created one by one, but grouped into clusters with a given location and amount of charge. The cluster size is defined by an user-tunable parameter. It has been
1 http://cern.ch/garfield2 http://www.srim.org
Fig 1. Simplified picture of the fission chamber as used in the simulation route
37 of 58 04/19/2013

checked that this trick introduces no significant bias in the results presented in Sec. 3.
The electric field is approximated by the classical formula for an infinite-length cylindrical capacitor. The electron drift parameters (speed, diffusion, avalanche) are computed with MAGBOLTZ3 [20], which performs a Monte-Carlo resolution of the Boltzmann transport equation in various gases (including mixtures) with integrated cross-section libraries extensively checked at CERN. The ion mobility comes from tabulated data [21]. One electron and one ion of each cluster are drifted with a Runge-Kutta-Fehlberg integration method. In the absence of a magnetic field, the drift lines are purely radial. The drift time, integrated diffusion, multiplication, and losses through attachment are derived. The current induced by the ion and electron drift is computed, with an excellent agreement with the theoretical laws given in Ref. [3,22]. Retrieving the current induced by all the clusters is straightforward. Because this suite cannot deal with recombination, it is assumed that the chamber is operated in saturation or avalanche region. Space charge effects are not taken into account, although they can be dealt with after some modifications in GARFIELD [23]. The contribution of gamma-rays to the signal is not considered and has been addressed elsewhere [24].
As GARFIELD can proceed one fission product at a time, the selection of this fission product, run of GARFIELD, processing of its results on a Nhist number of histories, are done by appropriate scripts in. ROOT4 language. On a typical workstation, it would require several hours to compute a single pulse. To have a good statistics, the number of histories must be about 104.
The derivation of the charge spectrum is done straightforwardly by summing over the
3 http://cern.ch/magboltz4 http://root.cern.ch
Fig 2. Outline of the simulation route. Entry data are labeled in italic letters, computed quantities in boldface. Data at the starting points of the arrows are used by the code featured by the filling pattern of the arrow head to compute the quantity at the end point.
38 of 58 04/19/2013

clusters. The mean pulse can be computed as the average of all individual pulses. If the preamplifier response is known, the observed mean pulse may be obtained after a convolution. In practice, this fixes the rise time of the pulse, and also the pulse length if the preamplifier is not fast enough with respect to the collection time.
If the fission rate τ is known, the number of pulses and their starting time are randomly distributed according to a Poisson process, each pulse is uniformly chosen among the simulated pulses; all these pulses are then averaged. From this simulation, the mean current and the spectral density for a given sampling frequency f, observed when the chamber is operated in current and Campbelling mode respectively, may be easily derived.
3. Simulation results
In this section, some results that can be obtained with our simulation route when applied to the fission chambers described in Tab. 1 are presented.
CFUZ CFUR CF4 CF8
ra (mm) 0.35 1 1.25 0.5
rc (mm) 0.65 1.25 1.75 3.15
lcoat (mm) 12 14 8 33.5
ltot (mm) 47 14 12 33.5
Bias voltage (V) 150 250 300 300
Gas Argon+4% N2 Argon+4% N2 Argon Argon
Pressure (bars) 5 5 12 9
Tab 1. Input data for the fission chambers considered in Sec. 3. The coated electrode is the anode, except for the CF8
The charge spectra for the CFUZ, CFUR, CF4 and CF8 are shown in Fig. 3. The spectra of the CFUZ and CFUR are very similar: the inter-electrode spacing rc-ra is almost the same. As the fission product looses only a fraction of its energy in the gas, the spectra do not reflect the distribution of Einit, which exhibits two peaks as the fission yield. With a CF4, the collected charge is larger, in accordance with the larger inter-electrode spacing. The spectrum of the CF8 exhibits two peaks, as 77% of the fission products are stopped within the gas. Note that the range of the fission products is a few millimeters, i.e. of the order of magnitude of the inter-electrode spacing of that chamber. The mean collected charge is are in good agreement with the values obtained at the FICTIONS-8 experiment undertaken at the BR2 reactor under the CEA-SCK•CEN collaboration for a CFUR (0.40×10⁶qe for the simulation against 0.44×10⁶qe for the experiment, where qe is the elementary charge) and for a CF4 (1.69 against 1.4) [25].
The electron and ion mean pulses are given in Fig. 4 and 5. Pulses have a nearly triangular shape, with the exception of the CF8, due to the fact that its coated electrode is the cathode.
39 of 58 04/19/2013

Fig 4. Mean electron pulse for the CFUZ, CFUR, CF4 and CF8
Fig 3. Charge spectrum for the CFUZ, CFUR, CF4 and CF8
40 of 58 04/19/2013

A sample of signal is obtained by cumulating electron and ion pulses for the CFUR, taking T=2×10⁻³ s and various values of the fission rate τ and the sampling frequency f. The mean current is checked to be independent of f and proportional to τ. The slope corresponds to the sensitivity of the fission chamber in current mode. For an 235U coating of 7.89 µg this translates into a sensitivity with respect to a conventional flux of 0.9×10⁻¹⁸ A/(n/cm2/s), in rather good agreement with the value reported with the FICTIONS-8 experiment: 1.24×10⁻¹⁸
A/(n/cm2/s) [26]. Also the spectral density is found to be proportional to τ, in agreement with the Campbell theorem. The slope depends on the frequency: at 10 kHz, electrons and ions contribute to the spectral density, at 10 Mhz, only the electrons contribute. The spectral density is shown on Fig.6 and 7 for the CFUR and the CF4, with a phenomenological fit by:
s ( f )=se+si
1+(f / f c)a
in which si and se can be interpreted as the height of the ion and electron plateaus respectively, fc is the frequency cutoff (inversely proportional to the ion collection time), a is related to the width of the transition. For the CF4, the end of the electron plateau is also observed at the expected cutoff frequency. For both fission chambers, the cutoff frequency, respectively 0.21 MHz and 35 kHz is in good agreement with the ion collection times from Fig.5. The computed sensitivity in the 20 kHz - 300 kHz band is respectively 4×10-27 A2/Hz/(c/s) (where (c/s) stands for count per second) and 3×10-26 A2/Hz/(c/s). Given the experimental issues, this is n qualitative agreement with the values reported after the FICTIONS-8 experiment: 8×10-27 A2/Hz/(c/s) and 1.8×10⁻²⁶ A2/Hz/(c/s) [27,25]. It would be desirable to gather more data from dedicated experiment to explore this discrepancy.
Fig 5. Mean ion pulse for the CFUZ, CFUR, CF4 and CF8
41 of 58 04/19/2013

4. Conclusion
A computation route capable of simulating the charge spectrum and the mean neutron-induced pulse shape of a fission chamber, and also to derive the mean current and variance from it, has been presented. This route may be useful to design a fission chamber and to assess its overall sensitivity. Next developments would include in this route recombination
Fig 6. Spectral density for a CFUR
Fig 7. Spectral density for a CF4
42 of 58 04/19/2013

and space charge effects. First comparisons with experimental results, namely the FICTIONS-8 experiment, yield a good qualitative agreement. In a near future, an experimental program will be undertaken to qualify the route using mock-up reactors and wide choice of fission chambers. Depending on the results, a refinement of the model and an effort on the accuracy of input data are also to be considered.
5. References
[1] C. Blandin, G. Bignan, J. Guyard & A. Lebrun, Development and modeling of neutron detectors for in-core measurement requirements in nuclear reactors, 10th International Symposium on Reactor Dosimetry, Osaka, Japan, Sept. 13-17 1999[2] C. Jammes et al., IEEE Trans. Nuc. Sci. 57 (2010) 3678[3] R. Veenhof, GARFIELD, A Drift Chamber Simulation Program, CERN, 1994, CERN program library, entry W5050 http://cern.ch/garfield, Nucl. Instr. and Meth. A 419 (1998) 726[4] O. Poujade & A. Lebrun, Nucl. Instr. and Meth. A 433 (1999) 673[5] S. Chabod, G. Fioni, A. Letourneau & F. Marie, Nucl. Instr. and Meth. A 566 (2006) 633[6] S. Chabod, Nucl. Instr. and Meth. A 598 (2009) 578[7] S. Chabod, A. Letourneau, P. Gourdon & C. Laye, IEEE Trans. Nuc. Sci. 57 (2010) 2702[8] S. Normand, P. Delacour, B. Lescop et al. A new small fission chamber for in core and wide range neutron flux measurement, IMORN-29 Budapest (2004)[9] P. Filliatre, L. Oriol, C. Jammes & L. Vermeeren, Nucl. Instrum. Meth. Phys. Res. A 593 (2008) 510[10] C. Jammes, P. Filliatre, P. Loiseau, B. Geslot, Nucl. Instr. and Meth. A 681 (2012) 101[11] O. Cabellos, P. Fernandez, D. Rapisarda & N. Garcia-Herranz, Nucl. Instr. and Meth. A 618 (2010) 248[12] V. E. Viola, K. Kwiatkowski & M. Walker, Phys. Rev. C 31 (1985) 1550[13] D.G. Madland, Nuc. Phys. A 772 (2006) 113[14] J. F. Ziegler, J. P. Biersack & M. D. Ziegler, The Stopping and Range of ions in Matter, SRIM.org, 2008[15] M. Forte, A. Bertin, M. Bruno, G. Vannini & A. Vitale, Phys. Rev. B, 14 (1976) 956[16] Schmitt, H. W. & Leachman, R. B., Phys. Rev. 102 (1956) 183[17] P. Filliatre, C. Jammes & B. Geslot, Nucl. Instr. and Meth. A 618 (2010) 294[18] International commission on radiation units and measurements, Average energy required to produce an ion pair, ICRU report 31, 1979[19] Knipp, J. K. & Ling, R. C., Phys. Rev. 82 (1951) 30[20] S.F. Biagi Nucl. Instr. and Meth. A 421 (1999) 234 http://consult.cern.ch/writeup/magboltz[21] H. W. Ellis et al., Atomic Data and Nuclear data tables, 17, 177 (1976); 22, 179 (1978); 31, 113 (1984)[22] E. Kowalski, Nuclear electronics, Springer-Verlag, 1970[23] M. Aleksa, Performance of the ATLAS Muon Spectrometer, PhD thesis, 1999, Technischen Universitat Wien[24] P. Filliatre, L. Vermeeren, C. Jammes, B. Geslot & D. Fourmentel, Nucl. Instr. and Meth. A 648 (2011) 228[25] B. Geslot et al., Method to calibrate fission chambers in Campbelling mode, ANIMMA-2011, Ghent, June 6-9 2011[26] L. Vermeeren et al., Irradiation tests in BR2 of miniature fission chambers in pulse, Campbelling and current mode, ANIMMA-2011, Ghent, June 6-9 2011[27] B. Geslot et al., Rev. Sci. Ins, 82 (2011) 033504
43 of 58 04/19/2013

1. Introduction
The high flux research reactor MARIA is a water and beryllium moderated reactor of a pool
type with graphite reflector and pressurized channels containing concentric tube assemblies of
fuel channels.
In the framework of the Reduced Enrichment for Research and Test Reactors (RERTR) in
National Centre for Nuclear Research there has been led from 2005 the works over
conversion program from HEU to LEU
In view of reduction of enrichment under assumption for preserving to maximum extent the
physical parameters of the reactor it was proposed to use the silicide fuel (U3Si2) with
uranium density of 4.8 g/cm3, which substantially surpassed the uranium density of oxide fuel
(UO2), to be 2.8 g/cm3. Supplier of the silicide fuel is the French company Areva (CERCA
Romans). The silicide fuel to be proposed has been proved up to very high levels of burnups
and has been widely used in more than twenty research reactors in the world.
The fuel assemblies for MARIA reactor differ from hitherto being applied fuel elements U3Si2
(fuel plates) in the world. To use the new fuel type in MARIA reactor it was required to carry
out the validation of the new fuel elements in MARIA reactor. The main point of the
certification procedure for the new fuel for MARIA reactor was to perform the irradiation of
two test fuel subassemblies (LTA, Lead Test Assemblies) under normal operation conditions
of the reactor.
In September 2012 started the MARIA reactor conversion process from HEU (MR) to LEU
(MC) fuel.
2. Modernization of the fuel channel cooling circuit
2.1. Main assumptions for modernization of the fuel channel cooling
circuit
In 2009 the MARIA reactor conversion program on low enriched fuel was extended to
upgrading of the pump system in the fuel channel cooling circuit.
One of the necessary conditions to proceeding the conversion of MARIA reactor core for low
enriched MC fuel is to provide the flow rate on the level of 30 m3/h through the channel of the
44 of 58 04/19/2013

core containing 25 fuel channels under higher by around 25% pressure drop in fuel channel.
Parameters of the hitherto operating in the cooling circuits primary pumps manufactured by
the Guinard firm are unable to meet these requirement. It is indispensable to replace presently
used pump assemblies by the new ones of appropriately higher parameters.
The necessity to replace the pump facilities has consequences to consider the mode for the
shutdown and emergency cooling. In the present system for that goal the main pumps
operating at half rated revolutions are being used which is ensured by using the two-speed
motors. This kind of solution – beyond certain profits (minimalization of number of facilities,
reliability and effectiveness to be confirmed by experience gained for many years) – it also
possess faults of which the major one is based on the fact that the intensity of flow rate in the
shutdown regime substantially exceeds the level to be needed for reactor core cooling after
shutdown.
The above arguments incline to chargé the shutdown task and emergency reactor cooling task
to a separate shutdown pumps system with parameters to be matched to the real needs to be
arisen from the course of reactor power shutdown. This system includes three parallels
branches of the shutdown assemblies. Each loop is equipped with isolation gate valves at inlet
and outlet of the pump, a check valve at inlet and outlet of the pump, a check valve at pump
outlet and a bypass ensuring to maintain normal coolant flow through the pump under the
locked check valve at pump outlet.
2.2. The characteristics of the new fuel channel cooling circuit.
Bearing in mind these assumptions on order of the IAE a conceptual project of upgrading the
fuel channel cooling circuit for MARIA reactor has been developed [2]. Schematic design of
the fuel channel cooling system after upgrading is shown in Fig.1 and in Table 1.
Table 1. Parameters of the pump assemblies of the MARIA reactor fuel channel
cooling circuit to be upgraded.
Parameter Pumps
Main units Shutdown units
Number of installed assemblies 4 3
Number of operating assemblies 3 2
Flow rate [m3/h] 400 70
45 of 58 04/19/2013

Pressure head [H2O m.col.] 128 12
Demand of power supply [kW] 179 3.1
Motor power [kW] 200 4
During the normal operation of the system there are operating two main pumps and two
residual power pumps. The remaining pump assemblies are in reserve. Cooling capacity of the
two main pumps (of 800 m3/h) provides to cool the reactor containing the 25 MC fuel
channels. The residual power pumps during the normal reactor operation time provide the
coolant circulation only through the bypass piping.
The start-up of the main pump is performed by the operator, however, the two main pumps
are to be setting in power each one from another transformer. The main pumps are to be in
motion in turn. Then the operator puts into operation the shutdown pumps to be supplied from
the emergency power source. If during the startup one pump wouldn’t start up the operator
sets in motion the reserve pump.
The main pumps operate in automatics with the valve gates installed behind each main pump.
When the main pump is disengaged the gate valve behind the pump is closed. Setting the
pump in motion causes an opening of the gate valves up to full opening. Disconnection of the
main pump brings about to close the gate valve in automatic mode.
An automatics of operation for the main circulation pumps should protect against excessive
overloading during operation mode of one pump only. The hydraulic characteristic of the
main circulation pump has such peculiarity that if in operation is only one pump the capacity
of the pump increases from 400 m3/h to 620 m
3/h (it regards the reactor core with 25 fuel
channels). To prevent the consequences associated with overloading of the pump assembly it
is necessary to reduce the flow rate up to 500 m3/h by means of partial opening of the gate
valve behind the operating pump.
Forwards the normal operation conditions of the cooling system is to be included reactor
shutdown cooling to be realized by means of residual power pumps. Disconnection of the
main primary pumps after reactor scram causes a reduction of pressure in the pressure header
of the circuit and when the pressure difference between the pressure and suction headers of
the main pumps will reach the pressure head of the shutdown pump the water from the
pressure ferrule of the shutdown pump flows to the delivery collector of the reactor cooling
system ensuring the cooling of the fuel channels.
46 of 58 04/19/2013

3. Safety analysis for modernization of the cooling circuit
Modernization of the cooling circuit for the reactor fuel channels does not cause any changes
within the scope of safety analyses at the steady states, because all parameters (power, coolant
flow rate, temperature) remain to be unchanged with regards to the terms described in [1] and
[4]. However, it is necessary to verify the analyses for unsteady states associated with
triggering of the cooling mode from the main into the shutdown one for which an extreme
case refers to the total loss of the basic power supply for the motors of main circulation
pumps. The course of this process will undergo a change due to that:
- the characteristics of the coastdown for the main pumps (various moments of inertia of
the pumps assemblies);
- the magnitude of the target flow rate in the shutdown cooling mode.
Among reactor unsteady states to be analyzed in connection with conversion of the core from
MR fuel on MC fuel of significant importance are those states in which the specifics of MC
fuel, i.e. the terms for heat exchange and balance of fission products activity is manifested. It
is also necessary to take into account the modification of the fuel channels’ cooling circuit.
Due to that the verification of analyses is needed for the following groups of unsteady states:
Decay of coolant flow rate in the channel circuit.
Blocking of flow rate through the LTA fuel channel and in a consequence its
burnout.
Loss of tightness of the fuel channel cooling circuit.
Insertion of the positive reactivity and relevant to this matter the changes of power
during reactor start-up and at operation on full power.
Neutron calculations pursued for conversion process unveil that the basic neutron parameters
of the MARIA reactor don’t undergo any significant variations in comparison with the MR
fuel.
In connection with modification of the fuel channel cooling system to be based on replacing
of the primary circulation pumps and implementing shutdown pumps the characteristic of loss
of coolant flow after disconnecting the primary pumps suffers change. Therefore it is
necessary to pursue an analysis of cooling conditions for the fuel channel at unsteady state to
47 of 58 04/19/2013

be induced by total loss of basic power supply for the motors of the main pumps. The data
relevant to the new fuel elements of the circuit are the catalogue data to be included in an
offer or ensuing from the project [2] and due to that they will need to be proved by the
measurements being done after their installing.
In work [3] there are included the analyses for unsteady state after decay of power supply in
the main pumps (Wafapomp) after their modernization for both types of fuel and for two
options of the residual cooling: two or one shutdown pump is on. Beyond the following
assumptions there were taken into consideration:
catalogue inertia of Wafapomp assemblies,
maximum number of fuel channels in the core – 25 (conservative approach),
coolant flow rate for the MR fuel - 25 m3/h, whereas for the MC fuel – 30 m
3/h,
water temperature at the inlet to the channel – 45C,
water pressure at the inlet to the channel – 1.7 MPa,
rated power of the fuel channel – 1.8 MW,
accident signal after pressure drop to the level 1.4 MPa,
water flow rates through the stabilizer and the filter branch – 30 m3/h i 2.5 m
3/h.
In Fig. 1 are presented the calculation results in the form of time-dependent courses of
changes of the following parameters:
coolant flow rate through the channel with accounting for the total flow rate and
the flow to be induced by the operation of residual power pumps,
fuel channel power (total and the component to be added by the residual power
after shutdown),
maximum cladding temperature of the fuel element (in the MR fuel it is related to
the inner cladding of the third fuel tube and in the MC fuel – to the 6th
fuel),
48 of 58 04/19/2013

Fig.1. Residual cooling after reactor shudown – 25 MC FA. – 2 reactor shutdown pumps
4. Preliminary schedule of replacement of the pump
1. Reactor MARIA shutdown - April 24, 2013
2. Dismantling of the existing pumps - April 29 – May 6, 2013
3. Modernisation of foundation for the
main pumps - May 7-15, 2013
4. Foundation for the auxiliary pumps - April 29 – May 11, 2013
5. Assembling of auxiliary pumps - May 14-20, 2013
6. Assembling of pipings along with pipe
fittings for the auxiliary pumps - May 20-31, 2013
7. Transport and setting-up of the main
pumps - May 23 – June 3, 2013
8. Assembling of pipings along with
fixtures for the main pumps - June 5-19, 2013
9. Test starting-up of the pumps trial motion:
- internal pressure test - June 20-21, 2013
- start-up - June 24-25, 2013
- test starting-up, 72 h - June 26-28, 2013
49 of 58 04/19/2013

10. Measurements of pump vibration and
other system hydraulic conditions - June 26 – July 5, 2013
11. The Regulatory Authority approval - July 15-19, 2013
12. Reactor MARIA startup - July 22, 2013
References
[1] Annex 2009/1 to ERB MARIA reactor. Irradiation testing of MC fuel. June 2009.
[2] Technical Description 1 18914_01. ENERGOPROJECT®-WARSZAWA.2011
[3] W. Mieleszczenko: Preliminary analysis of main circulation pumps shutdown conse-
quences after loss of the basic electrical supply and post-shutdown cooling model for MARIA
reactor fuel elements cooling circuit after modernization, Raport B-12/2012.
[4] Operational Safety Report of MARIA Reactor, 2009.
50 of 58 04/19/2013

New Design Concept for Primary Cooling System of Medium Power
Research Reactors
S.H. KIM, K.W. SEO, J. YOON Fluid System Design Div., Korea Atomic Energy Research Institute
989-111 Deadeok-daero, Yuseong-gu, Daejeon – Republic of Korea
I.C. IM Research Reactor Utilization Dept., Korea Atomic Energy Research Institute
989-111 Deadeok-daero, Yuseong-gu, Daejeon – Republic of Korea
ABSTRACT
A research reactor with medium power has a compact core to achieve a high density neutron flux with a relatively small size. It requires a high heat removal capacity of Primary Cooling System (PCS), which removes heat from the core and transfers it to the secondary cooling system, and therefore causes a high pressure drop in the core. The reactor coolant in the core flows downward due to the operator convenience above the pool top and removal of lift force for fuel assemblies onto the grid plate. The PCS consists of piping from the Reactor Structure Assembly (RSA) outlet nozzle to PCS pipe highest points, decay tanks, PCS pumps, heat exchangers, the RSA inlet nozzle. The siphon breaker installed at the PCS highest points prevents the reactor from uncovering when the break occurs at the pipe lower than the reactor. The high pressure drop at the core of this type of a reactor causes two major difficulties to the PCS design: 1) a small Net Positive Suction Head available for pumps, and 2) a possibility of cavitation at the highest PCS pipe downstream the RSA outlet nozzle. To solve above those problems, a new concept of the PCS is proposed in this paper. A tank located below the reactor pool is introduced and the RSA outlet pipe is connected into the tank. The core flow is maintained by the water level difference between the reactor pool and the tank. The PCS pump intakes the flow from the tank. With another piping layout considering the LOCA at the pipe, this concept has several advantages over the previous design. The flywheel occasionally used for the initial phase of the residual heat removal is not required in this design. Furthermore, the core flow keeps downward until the water levels between the two reach the same level. When the size of the bottom tank is carefully chosen, the bottom tank can take the role of the decay tank.
1. Introduction
The primary cooling system of a research reactor characterized by medium-power and downward flow in the core has a typical layout [1]. The coolant out of the core is sucked into the primary cooling pump, cooled by the primary cooling heat exchanger, and returned to the core. Because the core flow induces a pressure drop, the primary cooling pump is located at the low level to meet the Net Positive Suction Head required (NPSHr). The siphon breaker is installed on the highest point of the primary cooling system. This breaker prevents the reactor pool from losing its inventory due to the siphon phenomenon, which is caused by a break in the piping located lower than the reactor. In the reactor pool, the flap valve is installed on the primary cooling pipe. This valve opens when the flow rate of the primary cooling system is reduced to a certain value, and then provides cooling water for the residual heat of the core.
51 of 58 04/19/2013

In this layout, it is necessary to remove the residual heat even when the primary cooling pump is stopped due to a loss of off-site power or a failure of the pump itself. For this purpose, there are two approaches according to the power level of the core [2]. When the core power is low, the flywheel attached to the pump works to cool the core at the initial status by the coast-down of the primary cooling system. For the high-power reactor, the emergency diesel generator is installed to supply electricity to a pump when the off-site power is lost. After the flow rate of the primary cooling system is lowered enough, the flap valve is opened and the core is cooled by the natural convection, which is formed by a pass with the flap valve, reactor pool, and the core. When the flow rate of primary cooling system is reduced, the gravity force overcomes downward flow in the core and, finally, the flow reversal occurs in the core. At that moment the heat removal capacity by the primary coolant system is the lowest. Therefore, it is important to design the primary cooling system to sustain its flow rate enough not to violate the safety limit when the flow reversal occurs. The KIJANG Research Reactor (KJRR) project is started in 2012. The thermal power of the reactor is less than 20 MW and it has multiple functions such as Fission Moly radioisotopes, Neutron Transmutation Doping, and fast neutron flux irradiation [3]. This reactor requires a high neutron flux and downward flow in the core. The downward flow in the core was determined by considering the operator convenience above the pool top and removal of the lift force for fuel assemblies onto the grid plate. A compact core to achieve a high density neutron flux with a relatively small size was designed for KJRR. The pressure drop of the KJRR core is relatively high. The high pressure drop at the core of the downward-core-flow reactor causes two major difficulties to the PCS design: 1) a small Net Positive Suction Head available for pumps, and 2) a possibility of cavitation at the highest PCS pipe downstream the RSA outlet nozzle. The first problem can be solved by placing the pumps at the lower level. The second one can be overcome by increasing the reactor pool water level. Both ways increase the construction cost and give difficulties to operators due to the water level. These two problems can be solved by designing the pressurized PCS. However, it also causes an increase of construction cost and difficulties of operation and maintenance. To solve these problems, another concept for the PCS layout is proposed in this paper. This proposed layout of the PCS was developed during the early stage of the KJRR project. The components and operation of the proposed layout are described in detail. Using a simple model, the operational characteristics of the layouts were studied. 2. Proposed Concept
2.1 Components Figure 1 shows a schematic diagram of the proposed concept. This concept introduces the passive residual heat removal tanks (PRHRT) under the reactor pool. A pipe connects the core outlet of the reactor and the PRHRT. The flow in the pipe connection is induced by the level difference between the reactor pool and PRHRT. The PRHRT consists of two parts: the lower part (hereinafter ‘main tank’) is located below the bottom of the reactor pool and has a large cross-sectional area; the upper part (hereinafter, ‘chimney') is located above the bottom of the reactor pool and has a small cross-sectional area. In the main tank, baffles are formed in order to increase the residence time. At the initial stage of residual heat removal, it requires a high downward flow rate in the core for a sufficient time to remove a large amount of heat. To meet this requirement, it is necessary to maintain the level difference for a given time. This is achieved by the large cross-sectional area of the main tank. The chimney allows the downward flow in the core for long enough time to remove the residual heat after the pump is stopped and before the flap valve is opened. The primary cooling pump is located beside the main tank. This location was decided by considering the limitation that a pump in general can lift the water from a surface at an atmospheric pressure of less than 7.6 meters (25 feet). When the pump is installed at a low elevation due to this limitation, this pump location makes it possible to place the other PCS
52 of 58 04/19/2013

components at a higher level, and reduces the possibility of losing the pool inventory by the siphon effect. One of the unique points in this layout is the PCS pump room. Due to the location of the pump, the suction is taken from the main tank. The penetration of the PRHRT wall might be a vulnerable point, and it can be a LOCA point. To deal with the LOCA at that point, the pump room should be designed to be watertight. If the suction piping breaks, only the pump room would be flooded, and there would be no more leakage. Even further, a detection method can be provided to protect the pump in this situation. The discharge line of the pump is placed inside the chimney. If there is a break at the discharge line, this layout would make leakages from the break return to the PRHRT. 2.2 Operation The primary coolant flows through the core, connection pipe, PRHRT, PCS pump, and primary heat exchanger and returns to the core. Under normal operation, the flow rate and the pressure drop at the core determines the level difference between the reactor pool and the PRHRT. The coolant downstream the core is highly radioactive. After flowing through baffles in the main tank, short lived radioisotopes, such as N-16, are decayed out. The pump takes the water from the main tank and discharges it to the primary heat exchanger to reduce the temperature of the primary coolant. First, the startup operation for the reactor will be as below. The reactor pool and the PRHRT are the same level. The level of the PRHRT is maintained in the chimney. When the PCS pump is started to operate, water in the PRHRT is taken by the pump. However, the level difference between the PRHRT and the reactor pool is not high enough to induce a high core flow. Because the suction flow rate is much higher than the core flow, the level of PRHRT becomes lower and it causes an increase of the core flow. When the level is reduced to the main tank, the level of PRHRT is decreased slowly. When the level of PRHRT is reached to a certain point, the core flow generated by the level difference is balanced with the suction flow of the pump. From that point, the level of PRHRT is no longer moving. When the PCS pump is stopped, the situation will be operated in reverse order. When the PCS pump is stopped and the PCS flow is decreased, the flow rate in the core is maintained by the level difference between the reactor pool and the PRHRT. The flow rate at the core is reduced as the level of the PRHRT is increased. When the level is remained in the main tank, the downward flow is high enough to remove a relatively high heat flux of
Fig. 1 Schematic Diagram of Concept
53 of 58 04/19/2013

the core. Even though the PCS flow is decreased, the initial core flow rate remains high due to the large cross-sectional area of the main tank. When the level of the PRHRT reaches that of the reactor pool, the flow rate at the core is reduced to zero. Shortly before the level becomes the same, the flap valve is opened and the natural convection through it begins to remove the residual heat.
3. Simulation
3.1 Modeling To get some insight into this layout, we tried to make a simple model that can be examined for various input data. The reactor pool and the PRHRT have water inventories of M and M. The inventories are balanced with the inlet and outlet mass flow rate [4]. For the reactor pool, the inlet is the pump discharge and the outlet is the connection pipe. For the PRHRT, the inlet is the connection pipe and the outlet is the pump suction. The mass conservation of M and M can be written as follows: dMdt = ρA dhdt = m − m (1)
dMdt = ρA dhdt = m − m (2)
where m, m, A, A, h, and h are the mass flow rate in the core and of the pump, the cross-sectional area of the reactor pool and the PRHRT, and the water level of the reactor pool and the PRHRT, respectively. The mass flow rate in the core can be represented by the following: ρg(z − z) = Km2ρA = ΔPm m (3)
where ρ is the water density, g is the gravitational acceleration, z is the water level of the reactor pool from the reference elevation, z is the water level of the PRHRT from the reference elevation, K is the loss coefficient of the core, m is the mass flow rate in the core, A is the flow cross-sectional area in the core, ΔP is the pressure drop in the core at the rated condition, and m is the mass flow rate in the core at the rated condition. When the elevation difference between the bottoms of the reactor pool and the PRHRT is Δz, Eq. (3) can be rewritten with the level from the bottom, h and h, as follows: ρg(h − h + Δz) = ΔPm m (4)
ΔP 14 m × (ρg) ρ 1000 kg/m3 m 500 kg/s g 9.81 m/s2 h @ t=0 12 m Δz ,
5 m h @ t=0 3 m m 500 kg/s A 1 m2 for h < 5 m 20 m2 for h ≥ 5 m A 8 m2 for h < 5 m
0.5, 1, and 2 m2 for h ≥ 5 m
Tab 1: Parameters for a simulation
54 of 58 04/19/2013

The behavior of the proposed layout can be simulated by Eq. (1), (2), and (4). For the simulation we have to determine several parameters. These parameters are summarized in Table 1. The height of the reactor structure assembly is assumed to be 5 m. The main tank is also assumed to have a height of 5 m for the simulation. The simulated scenario is as below; 1) steady-state, 2) a pump stop at 0 sec, 3) a pump start at 300 sec, and 4) steady-state. In this simulation, it is assumed that there is no coast-down due to the pump inertia, and therefore, m changes to a given value abruptly. Eqs. (1), (2), and (4) are solved numerically. For simplicity, the Euler forward difference is used for the discretization. 3.2 Results To examine the effects of the cross-sectional area of the chimney, a series of simulations was conducted in the chimney areas of 0.5, 1, and 2 m2. The results showed that the proposed layout provides a sufficient core flow as was expected. Fig. 2 shows the mass flow rate in the core and Fig. 3 shows water surface elevations of the reactor pool and the PRHRT. The core flow decreased slowly at the start. When the level reached into the chimney, the core flow decreased rapidly. The reason is that the cross-sectional area of the chimney is smaller than that of the main tank. Fig. 2 shows that the core flow was linearly decreased proportionally to the area at the water level of PRHRT. After the levels were balanced, the pump was started. The core flow was increased rapidly, but, at this time, the rate was not linear. After the level was diminished to the main tank, the increase rate of the core flow was significantly reduced, and it therefore took a long time to reach the steady-state. It was also found that the time from the steady-state to the level equilibrium is shorter than that for the reverse situation. The three cases of cross-sectional areas of a chimney with a fixed area of the main tank were simulated. In the initial stage, when the water level was in the main tank, the behaviors were the same. After the water level was in the chimney, the fastest water level increase was found for the smallest cross-sectional area case. A case of 0.5 m2 chimney cross-sectional area showed the smallest level change than the others. Since the amount of water that transferred from the reactor pool to the PRHRT was proportional to the cross-sectional area of the PRHRT, the water level change of the reactor pool was also dependent on it. When a situation in which the pump was started was simulated, it was found that the recovery time to the steady-state was decreased as the cross-sectional area was decreased. Another set of simulations were conducted to investigate the effect of the main tank height to the system behavior. The heights of the main tank were selected to be 3, 4, and 5 m for each case and a chimney with a 2 m2 cross-sectional area was attached above it. Figs. 4
Fig 2. Mass flow rate for various
cross-sectional areas of the chimney
Fig 3. Level for various cross-sectional areas of the chimney
55 of 58 04/19/2013

and 5 compare the simulation results. For the lowest height case, it was found that it took the shortest time to reach the point where the mass flow rate in the core decreases more rapidly and that the level difference between the steady-state and the level equilibrium was the smallest. After the pump was restarted, the core flow rates for the three cases were the same as long as the level was in the chimney. The lowest height case was returned to the rated core flow in shortest time. These phenomena can be explained by the fact that the level change of PRHRT is determined by the flow rate difference between the core and the pump and that the level change in the PRHRT is dependent on the cross-sectional area at that level even though the flow rate difference was the same. From the view point of the residual heat removal, the proposed layout has a potential to maintain a large amount of core flow rate for a long time after a pump stops. The dimension of the main tank is determined by the initial flow rate in the core, which is required by the residual heat removal and the time delay in the reactor protection system at a reactor trip. The cross-sectional area of the chimney is determined by considering the required flow rate for the residual heat removal after a reactor trip. In addition, the large volume of main tank or the chimney causes a large level difference between the normal operating condition and the level equilibrium after a pump stops. This level difference might affect the formation and conservation of the hot water layer that is operated at the top of the pool for an open-pool type research reactor and equipment for the utilization and operation of the reactor. In the simulations, the pump inertia was ignored. If the effect of the pump inertia is included by assuming a coast-down curve, the result will be more realistic [5]. In that case, the pump flow rate will be maintained for a certain amount time. Due to the maintained pump flow rate, the level change will be slower and the core flow rate will be higher than that shown in the present results.
4. Conclusion A passive residual heat removal system for an open-pool type reactor with a downward flow is proposed. This system consists of a tank, so-called PRHRT, located under the reactor pool, and a connecting pipe installed between them. The core flow is maintained by the water level difference between the tank and the reactor pool. In this layout, the downward core flow can be maintained for a while after the pump is stopped since there is still a water level difference. Using a simplified model, the proposed system was evaluated. This model showed that the system can provide a sufficient downward flow to the core after the pump is stopped. The dimension of the PRHRT should be determined under a consideration of the requirements for the residual heat removal and the acceptable band of level change for the reactor pool
Fig 5. Level for various heights of the main tank
Fig 4. Mass flow rate for various heights of the main tank
56 of 58 04/19/2013

operation.
5. References [1] M.-S. Yang, Research Reactor – Design, Management and Utilization, KAERI, 2009. [2] J.V. Lolich, Advanced Nuclear Research Reactor, INVAP, 2004. [3] S.I. Wu, I.C. Lim, S.Y. Oh and J.J. Ha, Launching of a New Research Reactor project
in Korea, IGORR, 2012. [4] F.M. White, Fluid Mechanics, 4th ed., the McGraw-Hill Companies, 2001. [5] Todreas, Kazimi, Nuclear Systems II - Elements of Thermal Hydraulic Design,
Hemisphere Publishing Corp. 1990.
Acknowledgements
This work was supported by the National Research Foundation of Korea (NRF) grant funded by the Korea government (MEST).
57 of 58 04/19/2013