Embed Size (px)
Citation preview
Operation-Based Improvements through the Use of
Trommel Screens for Processing and Contaminant
Reduction across Various Seasons
Ali Rajabpour, Ph.D. Candidate
Daryl McCartney, Ph.D., P.Eng.
1
17 September, 2015
The National Compost Conference
Gatineau, Québec
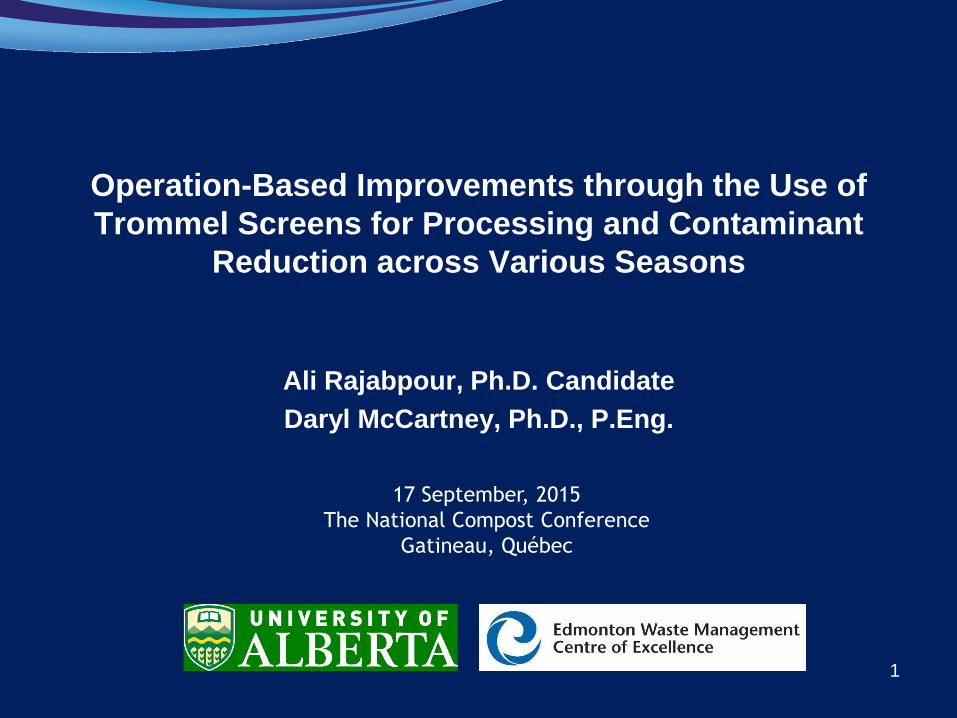
Background: Rotary Screen (Trommel)
• Originally adapted from
mineral processing
– Diameter
– Length
– Inclination angle
– Rotational velocity
– Shape and size of apertures
– Feed rate
• Screening of organic fines
• Final screening of compost
product
• … 2
ω
R
h
1
3
2
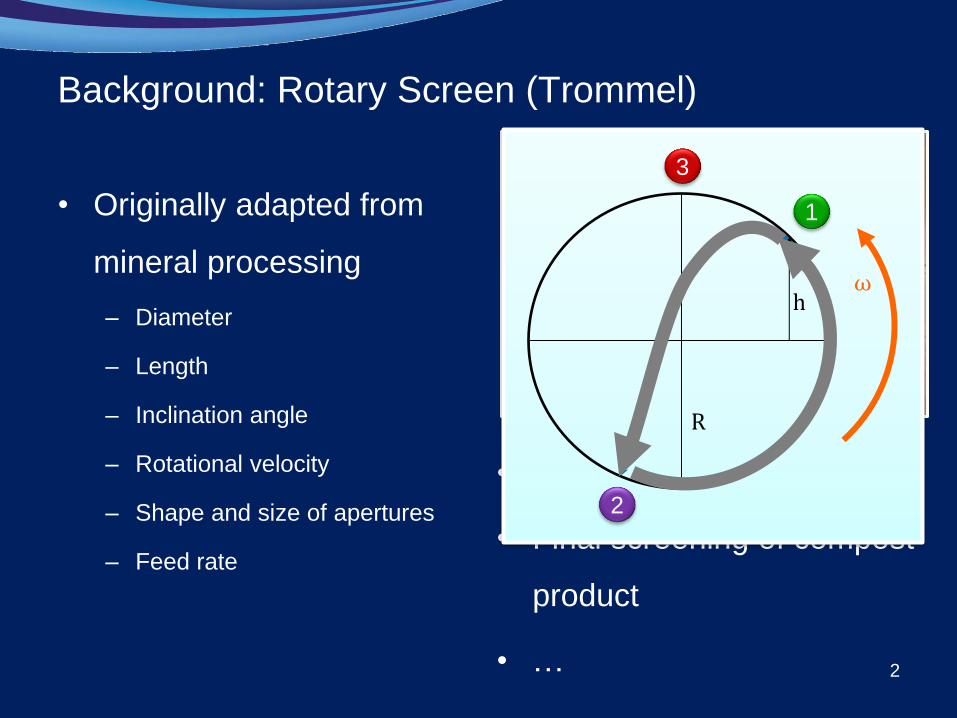
Background: North American Case Studies
3
CA
LA
MD
AB
Jan Feb Mar Apr May Jun Jul Aug Sep Oct Nov Dec-20
-10
0
10
20
30
Ave
rag
e T
em
pe
ratr
e (
oC
)
Month
Baltimore, MD
Bereckley, CA
New Orleans, LA
Edmonton, AB
Case Studies
Berkeley, CA (Glaub et al.,1982)
New Orleans, LA (Glaub et al.,1982)
Baltimore, MD (Hannon et al.,1983)
Edmonton, AB (Rajabpour et al., 2015)
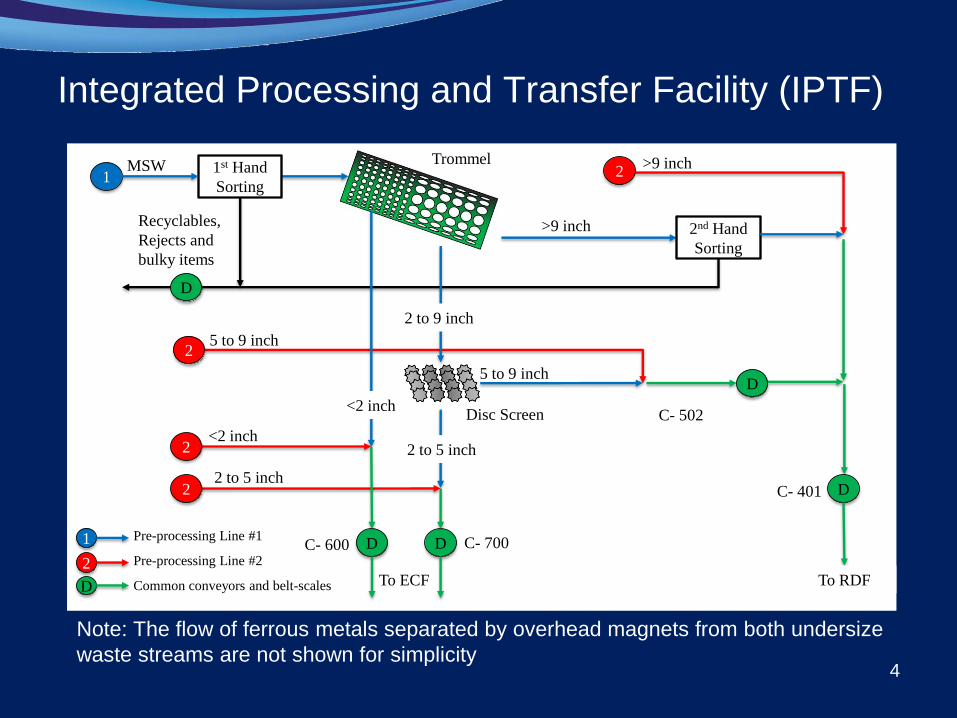
Integrated Processing and Transfer Facility (IPTF)
4
Note: The flow of ferrous metals separated by overhead magnets from both undersize
waste streams are not shown for simplicity
<2 inch
2 to 5 inch
5 to 9 inch
>9 inch
2
2
2
2
5 to 9 inch
MSW
<2 inch
>9 inch 2nd Hand
Sorting
1
2 to 5 inch
2 to 9 inch
D D
D
D
To ECF To RDF
C- 502
C- 401
C- 700C- 600
Recyclables,
Rejects and
bulky items
1st Hand
Sorting
D
Trommel
Disc Screen
Pre-processing Line #1
Pre-processing Line #2
Common conveyors and belt-scales
2
1
D
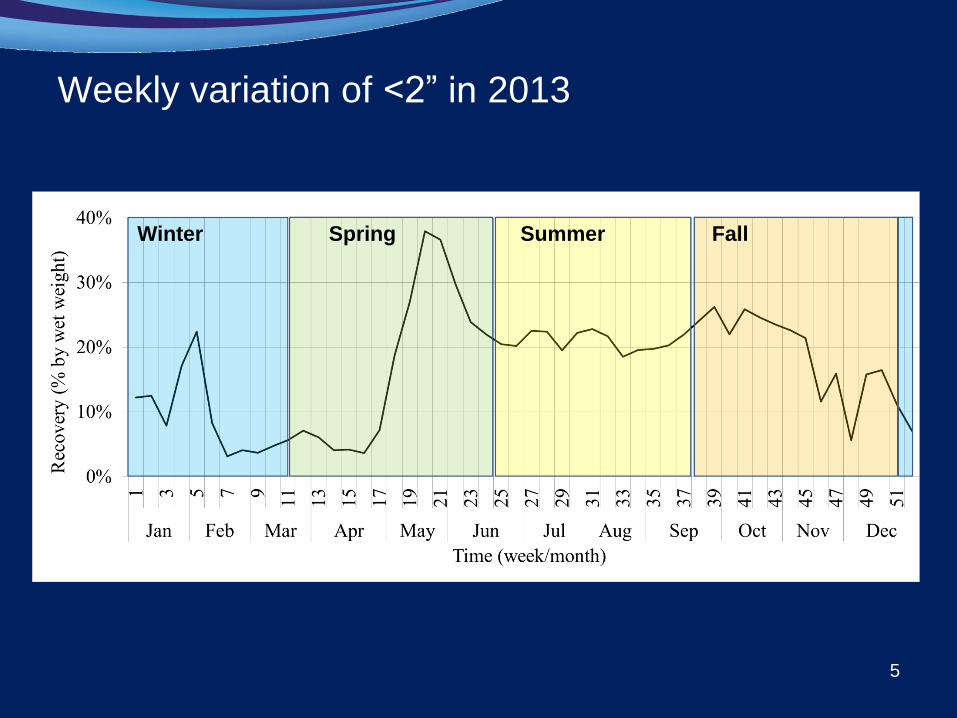
Weekly variation of <2” in 2013
5
Winter Spring Summer Fall
Areas of improvement
• Variation in recovery of <2” waste stream over time
• Feed rates exceeding the designed throughput (summer)
• Clogging of 2” apertures (especially in winter)
• Non-biodegradable contaminants in compost feedstock
• Available options:
– Increase the screen size
– Control the feed rates
6
Objectives
• To assess the effectiveness of screening with larger
screen size (i.e., 3”)
• To quantify the feed rate that:
1. Maximizes the screening of the organic-rich fines (<2”); and/or
2. Maximizes the waste processing throughput
7
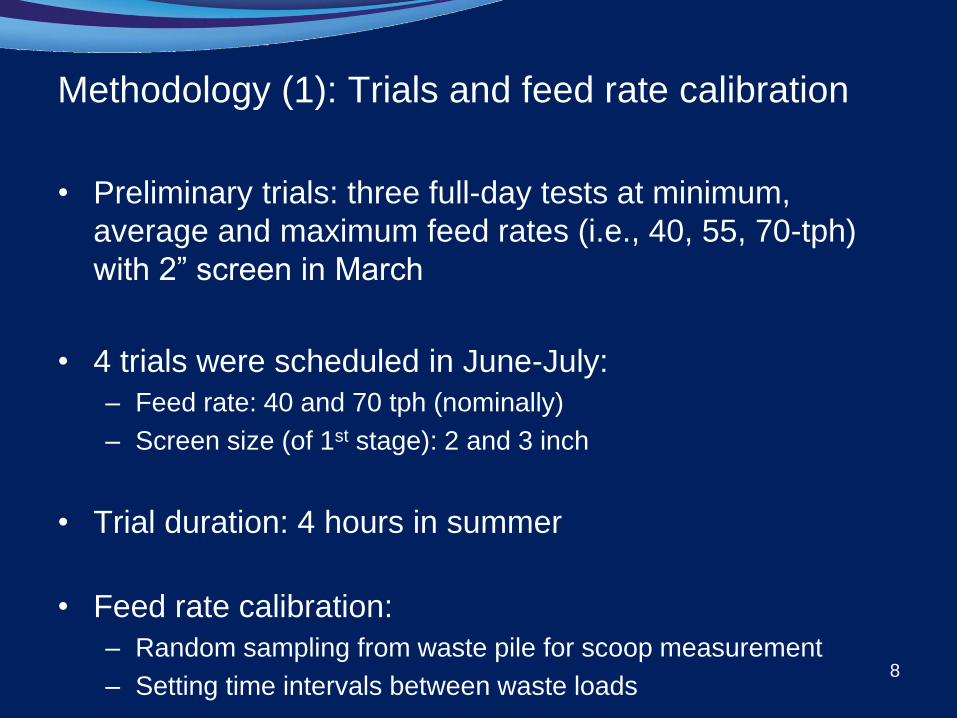
Methodology (1): Trials and feed rate calibration
• Preliminary trials: three full-day tests at minimum,
average and maximum feed rates (i.e., 40, 55, 70-tph)
with 2” screen in March
• 4 trials were scheduled in June-July:
– Feed rate: 40 and 70 tph (nominally)
– Screen size (of 1st stage): 2 and 3 inch
• Trial duration: 4 hours in summer
• Feed rate calibration:
– Random sampling from waste pile for scoop measurement
– Setting time intervals between waste loads
8
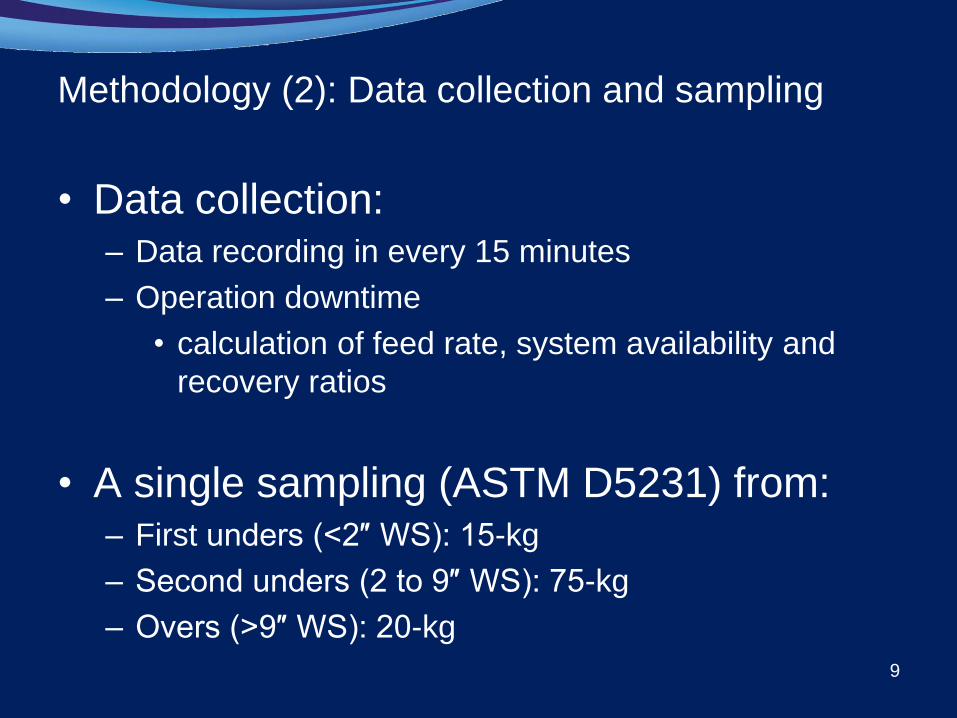
Methodology (2): Data collection and sampling
• Data collection: – Data recording in every 15 minutes
– Operation downtime
• calculation of feed rate, system availability and
recovery ratios
• A single sampling (ASTM D5231) from: – First unders (<2″ WS): 15-kg
– Second unders (2 to 9″ WS): 75-kg
– Overs (>9″ WS): 20-kg
9
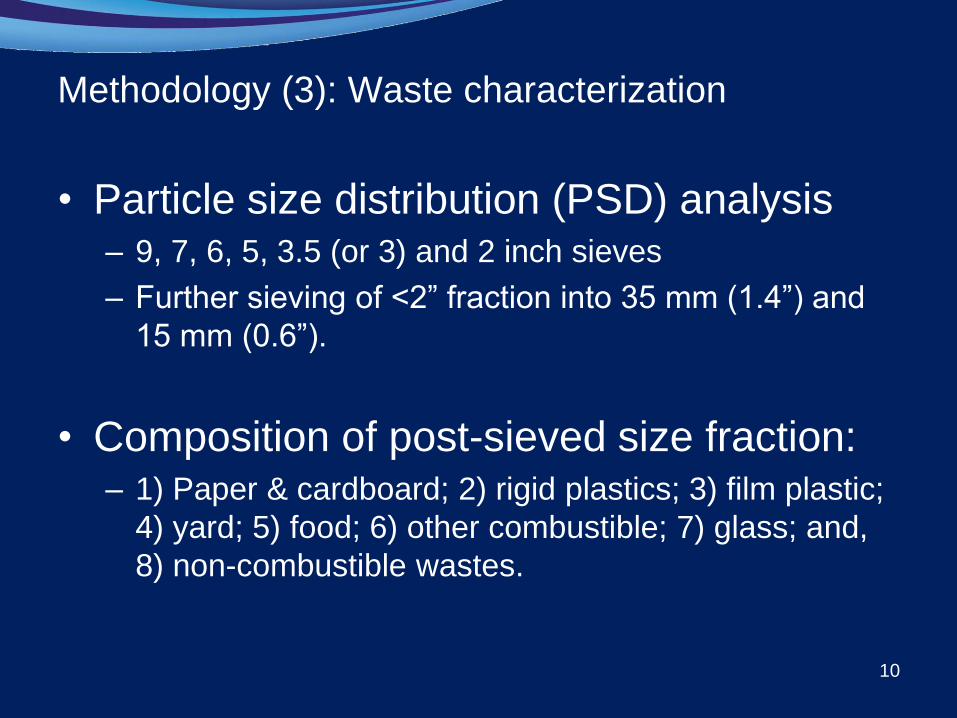
Methodology (3): Waste characterization
• Particle size distribution (PSD) analysis – 9, 7, 6, 5, 3.5 (or 3) and 2 inch sieves
– Further sieving of <2” fraction into 35 mm (1.4”) and
15 mm (0.6”).
• Composition of post-sieved size fraction: – 1) Paper & cardboard; 2) rigid plastics; 3) film plastic;
4) yard; 5) food; 6) other combustible; 7) glass; and,
8) non-combustible wastes.
10
0 60 120
180
240
300
360
420
480
540
600
660
0
10
20
30
40
To
tal re
co
ve
ry (
%,
by w
et w
eig
ht)
Operation Time (min)
Min rate (41 tph)
Mean rate (60 tph)
Max rate (75 tph)
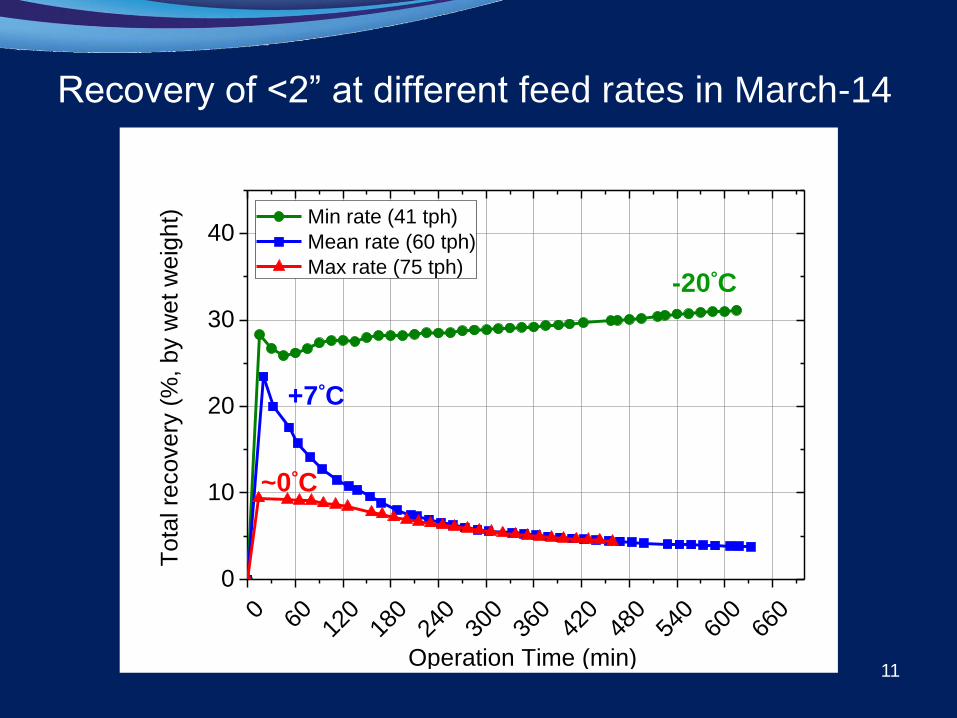
Recovery of <2” at different feed rates in March-14
11
-20°C
+7°C
~0°C
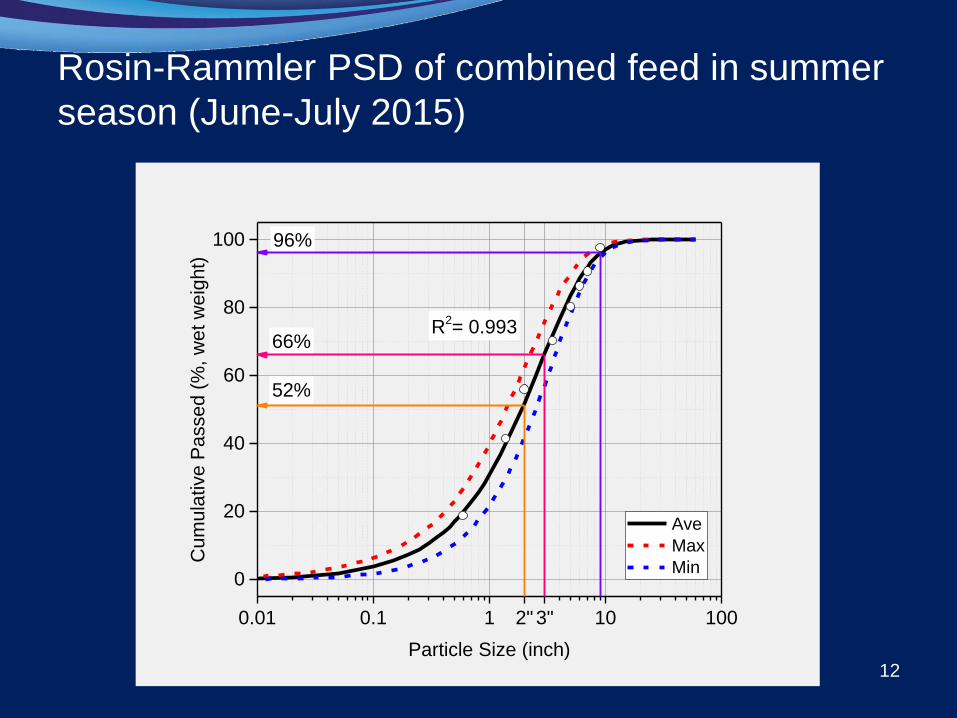
Rosin-Rammler PSD of combined feed in summer
season (June-July 2015)
12
0.01 0.1 1 10 1002" 3"
0
20
40
60
80
100 96%
66%66%R
2= 0.993
Cum
ula
tive P
assed (
%, w
et w
eig
ht)
Particle Size (inch)
Ave
Max
Min
52%
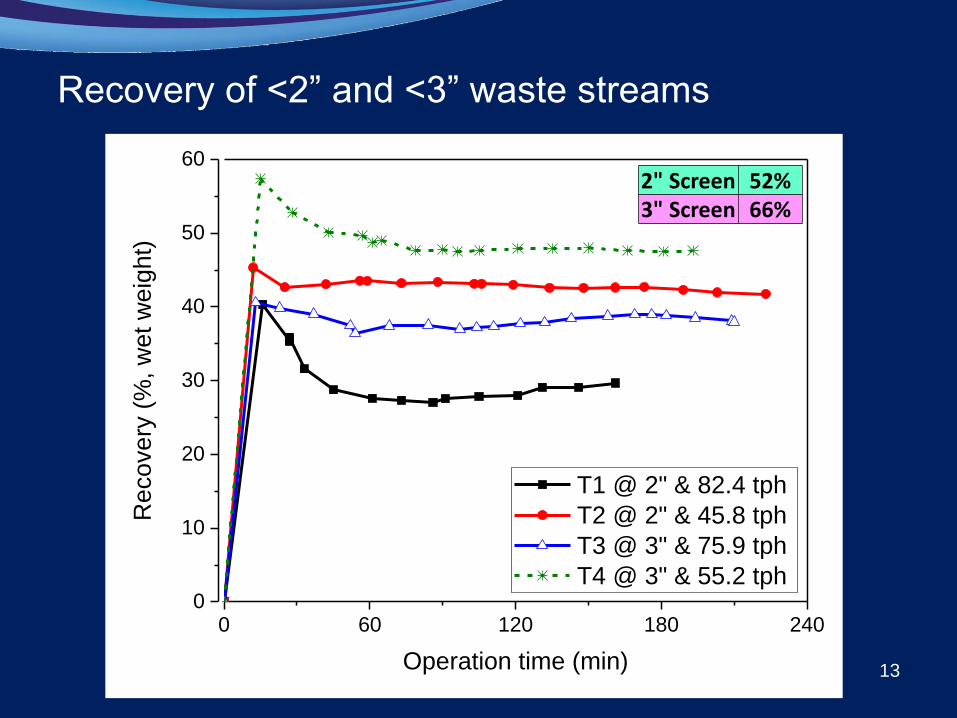
0 60 120 180 2400
10
20
30
40
50
60R
eco
ve
ry (
%, w
et w
eig
ht)
Operation time (min)
T1 @ 2" & 82.4 tph
T2 @ 2" & 45.8 tph
T3 @ 3" & 75.9 tph
T4 @ 3" & 55.2 tph
Recovery of <2” and <3” waste streams
13
2" Screen 52% 3" Screen 66%
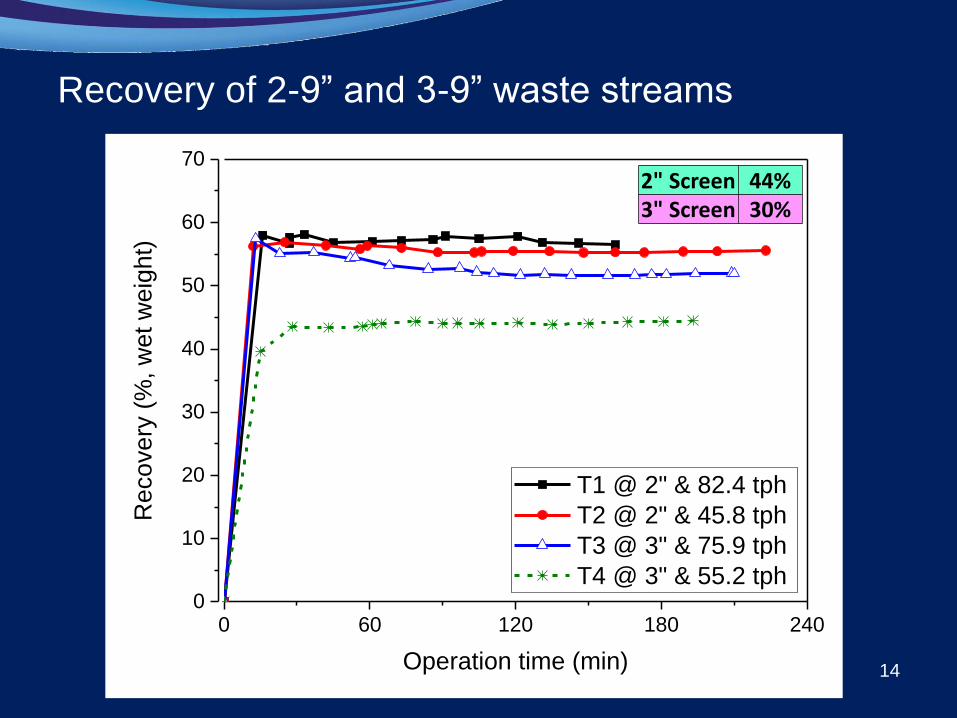
0 60 120 180 2400
10
20
30
40
50
60
70R
eco
ve
ry (
%, w
et w
eig
ht)
Operation time (min)
T1 @ 2" & 82.4 tph
T2 @ 2" & 45.8 tph
T3 @ 3" & 75.9 tph
T4 @ 3" & 55.2 tph
Recovery of 2-9” and 3-9” waste streams
14
2" Screen 44% 3" Screen 30%
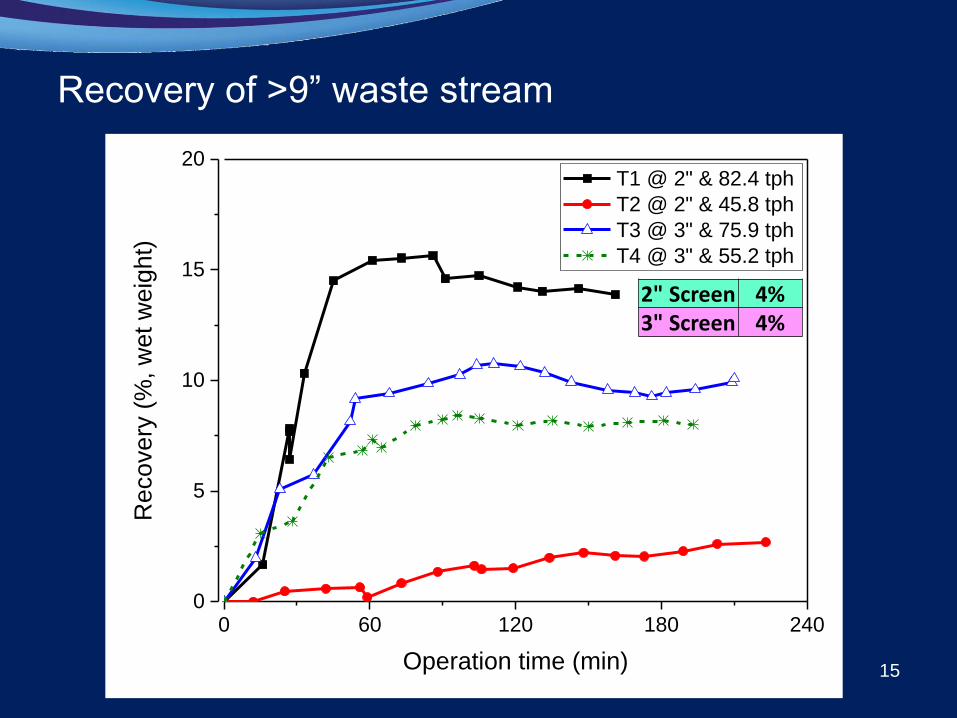
0 60 120 180 2400
5
10
15
20R
eco
ve
ry (
%, w
et w
eig
ht)
Operation time (min)
T1 @ 2" & 82.4 tph
T2 @ 2" & 45.8 tph
T3 @ 3" & 75.9 tph
T4 @ 3" & 55.2 tph
Recovery of >9” waste stream
15
2" Screen 4% 3" Screen 4%
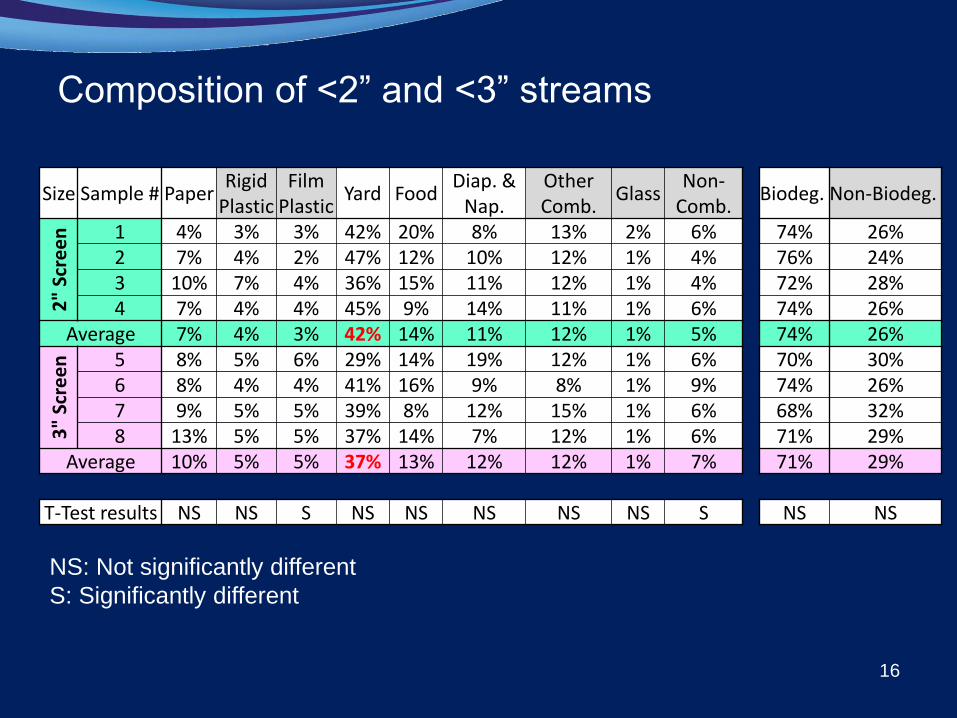
Composition of <2” and <3” streams
16
NS: Not significantly different
S: Significantly different
Size Sample # Paper Rigid
Plastic Film
Plastic Yard Food
Diap. & Nap.
Other Comb.
Glass Non-
Comb. Biodeg. Non-Biodeg.
2"
Scre
en
1 4% 3% 3% 42% 20% 8% 13% 2% 6% 74% 26% 2 7% 4% 2% 47% 12% 10% 12% 1% 4% 76% 24% 3 10% 7% 4% 36% 15% 11% 12% 1% 4% 72% 28% 4 7% 4% 4% 45% 9% 14% 11% 1% 6% 74% 26%
Average 7% 4% 3% 42% 14% 11% 12% 1% 5% 74% 26%
3"
Scre
en
5 8% 5% 6% 29% 14% 19% 12% 1% 6% 70% 30% 6 8% 4% 4% 41% 16% 9% 8% 1% 9% 74% 26% 7 9% 5% 5% 39% 8% 12% 15% 1% 6% 68% 32% 8 13% 5% 5% 37% 14% 7% 12% 1% 6% 71% 29%
Average 10% 5% 5% 37% 13% 12% 12% 1% 7% 71% 29%
T-Test results NS NS S NS NS NS NS NS S NS NS

Composition of <2” and <3” streams
17
NS: Not significantly different
S: Significantly different
Size Sample # Paper Rigid
Plastic Film
Plastic Yard Food
Diap. & Nap.
Other Comb.
Glass Non-
Comb. Biodeg. Non-Biodeg.
2"
Scre
en
1 1% 1% 0% 54% 23% 6% 5% 4% 6% 83% 17% 2 2% 1% 0% 69% 12% 4% 6% 2% 4% 87% 13% 3 2% 1% 0% 71% 9% 4% 5% 3% 5% 87% 13% 4 2% 0% 0% 88% 1% 2% 2% 2% 4% 93% 7%
Average 2% 1% 0% 70% 11% 4% 4% 3% 5% 87% 13%
3"
Scre
en
5 2% 4% 0% 42% 21% 11% 10% 3% 7% 75% 25% 6 3% 1% 0% 57% 19% 6% 6% 3% 5% 85% 15% 7 6% 1% 0% 63% 9% 9% 7% 3% 3% 86% 14% 8 4% 2% 1% 53% 17% 8% 11% 1% 3% 81% 19%
Average 4% 2% 1% 54% 16% 8% 8% 2% 5% 82% 18%
T-Test results NS NS S S NS S S NS NS NS NS
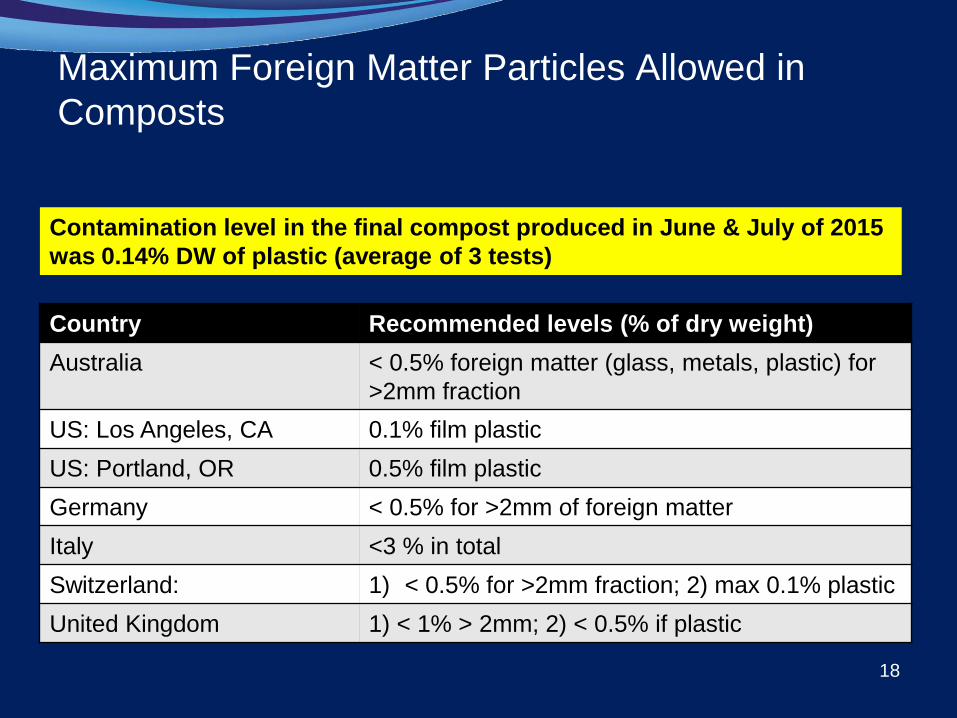
Maximum Foreign Matter Particles Allowed in
Composts
18
Country Recommended levels (% of dry weight)
Australia < 0.5% foreign matter (glass, metals, plastic) for
>2mm fraction
US: Los Angeles, CA 0.1% film plastic
US: Portland, OR 0.5% film plastic
Germany < 0.5% for >2mm of foreign matter
Italy <3 % in total
Switzerland: 1) < 0.5% for >2mm fraction; 2) max 0.1% plastic
United Kingdom 1) < 1% > 2mm; 2) < 0.5% if plastic
Contamination level in the final compost produced in June & July of 2015
was 0.14% DW of plastic (average of 3 tests)
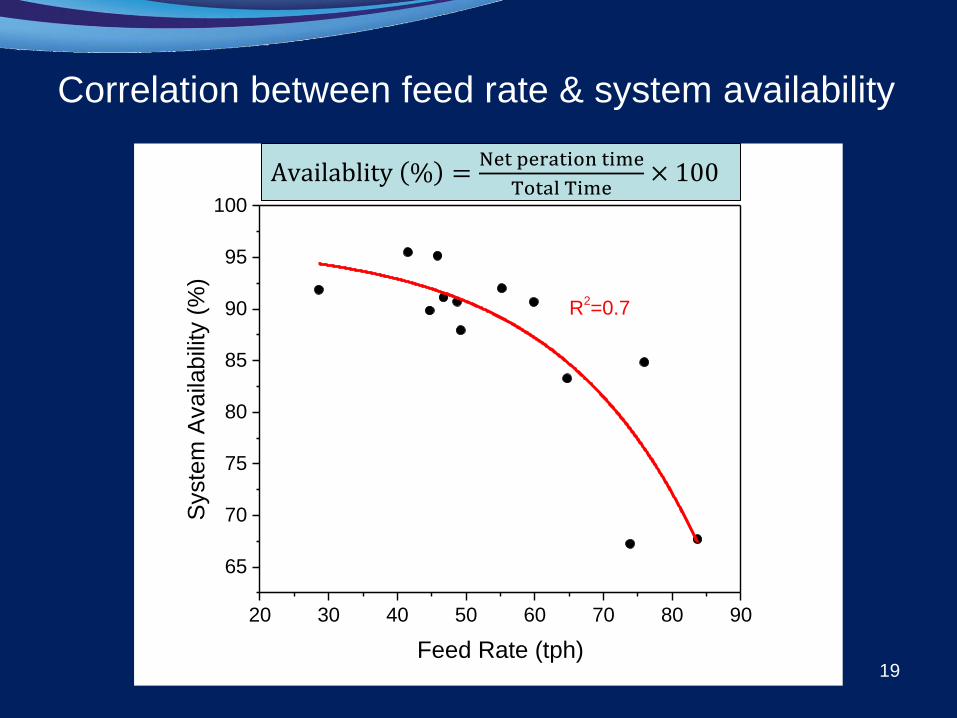
20 30 40 50 60 70 80 90
65
70
75
80
85
90
95
100S
yste
m A
va
ilab
ility
(%
)
Feed Rate (tph)
R2=0.7
Correlation between feed rate & system availability
19
Availablity % =Net peration time
Total Time× 100
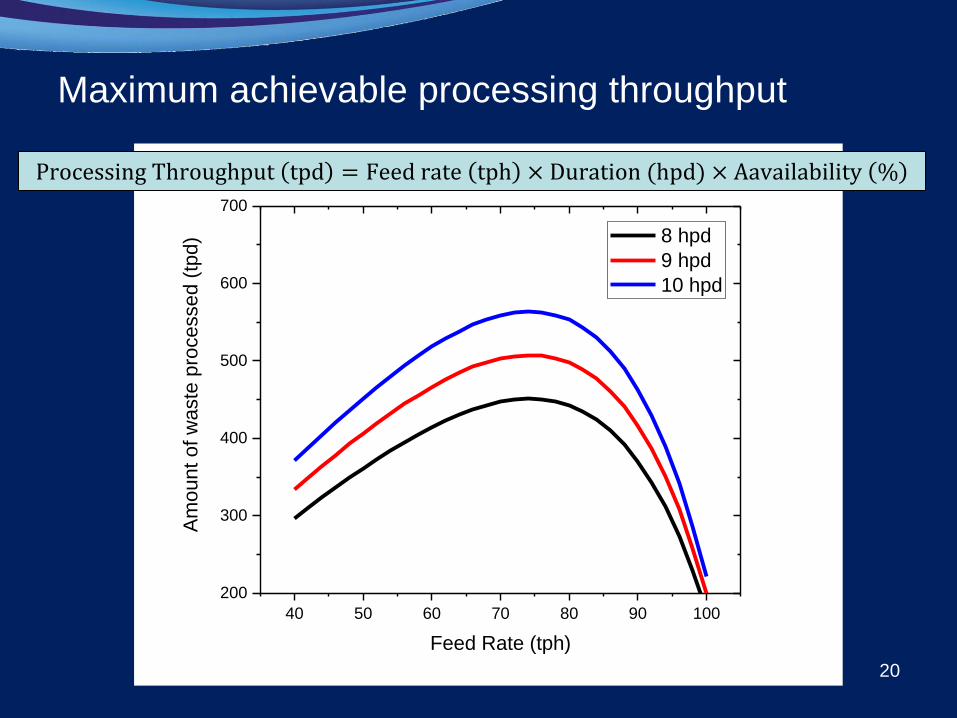
40 50 60 70 80 90 100
200
300
400
500
600
700A
mo
un
t o
f w
aste
pro
cesse
d (
tpd)
Feed Rate (tph)
8 hpd
9 hpd
10 hpd
Maximum achievable processing throughput
20
Processing Throughput tpd = Feed rate tph × Duration (hpd) × Aavailability %
Summary
• Challenges of studying at full-scale operation.
• Effectiveness of larger screen size vs. lower feed rate
on screening performance
– Larger screen more consistent screening
– Lower feed rate higher recovery ratios
• The practical feed rate to be applied was between 45
and 75 tph.
– What’s the objective? Priority?
• Concerns on quality of compost product
– Which facility to target?
21
Acknowledgements
22

Thank you!
Questions?
23