Embed Size (px)
DESCRIPTION
operation management lecture slids
Citation preview
Statistical Process ControlStatistical Process Control
Chapter 4Chapter 4
Yitbarek Takele (PhD, MBA , MA Econ)
College of Business & Economics
Department of ManagementAddis Ababa University
4-4-22
Lecture OutlineLecture Outline
Basics of Statistical Process ControlBasics of Statistical Process Control Control ChartsControl Charts Control Charts for AttributesControl Charts for Attributes Control Charts for VariablesControl Charts for Variables Control Chart PatternsControl Chart Patterns SPC with ExcelSPC with Excel Process CapabilityProcess Capability
4-4-33
Basics of Statistical Basics of Statistical Process ControlProcess Control
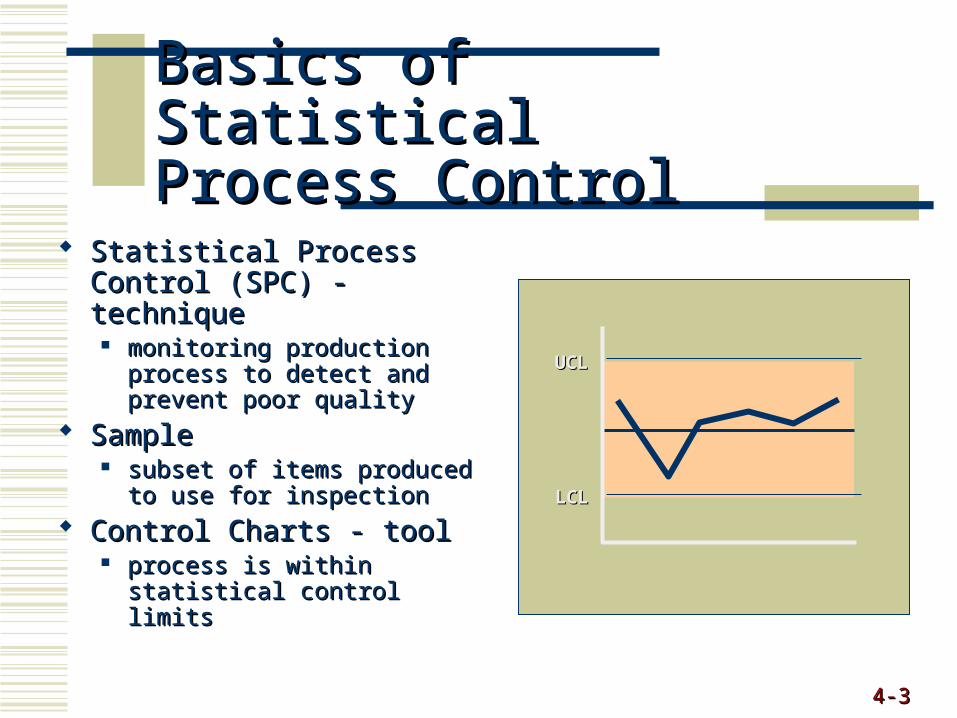
Statistical Process Control Statistical Process Control (SPC) - technique(SPC) - technique monitoring production process monitoring production process
to detect and prevent poor to detect and prevent poor qualityquality
SampleSample subset of items produced to subset of items produced to
use for inspectionuse for inspection Control Charts - toolControl Charts - tool
process is within statistical process is within statistical control limitscontrol limits
UCLUCL
LCLLCL
4-4-44
VariabilityVariability
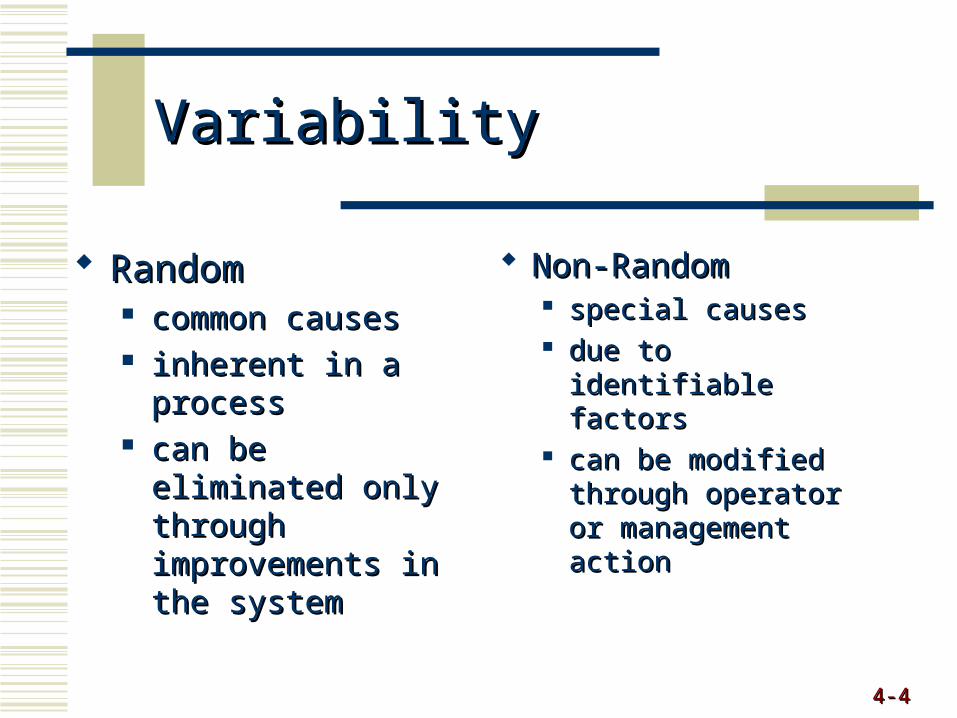
RandomRandom common causescommon causes inherent in a processinherent in a process can be eliminated can be eliminated
only through only through improvements in the improvements in the systemsystem
Non-RandomNon-Random special causesspecial causes due to identifiable due to identifiable
factorsfactors can be modified can be modified
through operator or through operator or management actionmanagement action
4-4-55
SPC in TQMSPC in TQM
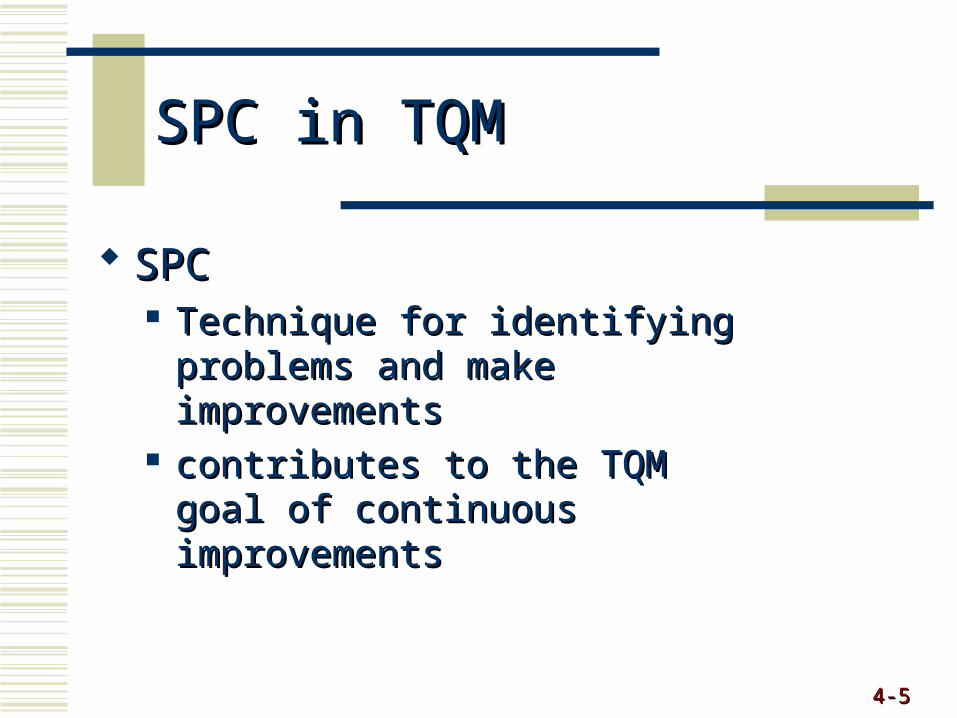
SPCSPC Technique for identifying Technique for identifying
problems and make problems and make improvementsimprovements
contributes to the TQM goal of contributes to the TQM goal of continuous improvementscontinuous improvements
4-4-66
Quality MeasuresQuality Measures
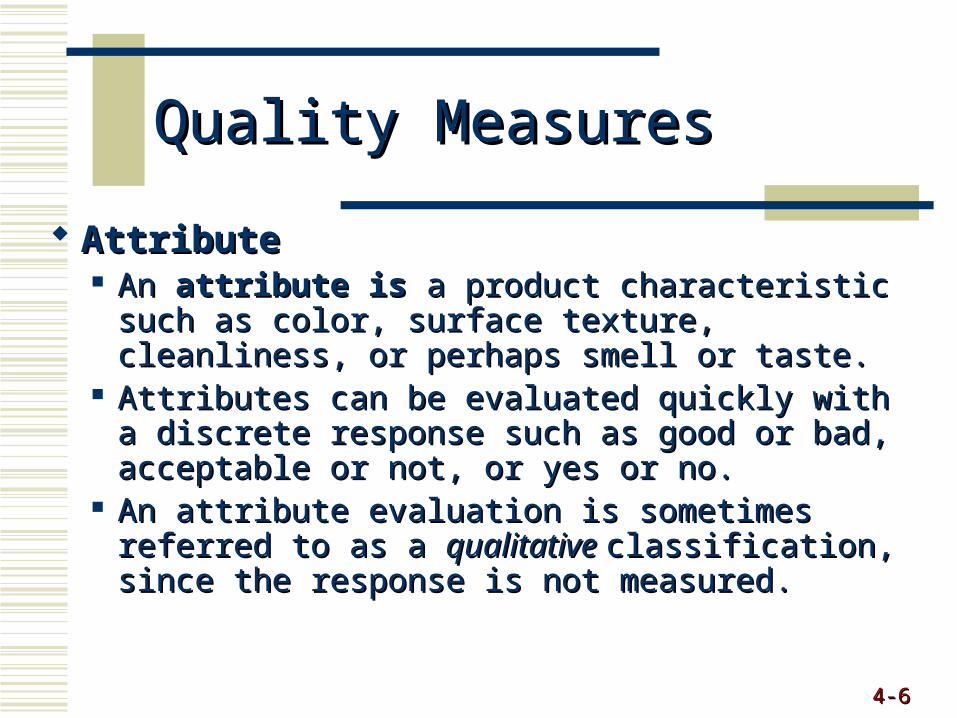
AttributeAttribute An An attribute is attribute is a product characteristic such as a product characteristic such as
color, surface texture, cleanliness, or perhaps color, surface texture, cleanliness, or perhaps smell or taste. smell or taste.
Attributes can be evaluated quickly with a Attributes can be evaluated quickly with a discrete response such as good or bad, discrete response such as good or bad, acceptable or not, or yes or no. acceptable or not, or yes or no.
An attribute evaluation is sometimes referred to An attribute evaluation is sometimes referred to as a as a qualitative qualitative classification, since the response classification, since the response is not measured.is not measured.
4-4-77
Quality MeasuresQuality Measures
AttributeAttribute Even if quality specifications are complex and Even if quality specifications are complex and
extensive, a simple attribute test might be used extensive, a simple attribute test might be used to determine whether or not a product or to determine whether or not a product or service is defective. service is defective.
For example, an operator might test a light bulb For example, an operator might test a light bulb by simply turning it on and seeing if it lights. If it by simply turning it on and seeing if it lights. If it does not, it can be examined to find out the does not, it can be examined to find out the exact technical cause for failure, but for SPC exact technical cause for failure, but for SPC purposes, the fact that it is defective has been purposes, the fact that it is defective has been determined.determined.
4-4-88
Quality MeasuresQuality Measures
VariableVariable A A variable measure variable measure is a product characteristic is a product characteristic
that is measured on a continuous scale such as that is measured on a continuous scale such as length, weight, temperature, or time. length, weight, temperature, or time.
For example, the amount of liquid detergent in a For example, the amount of liquid detergent in a plastic container can be measured to see if it plastic container can be measured to see if it conforms to the company’s product conforms to the company’s product specifications. Or the time it takes to serve a specifications. Or the time it takes to serve a customer at McDonald’s can be measured to customer at McDonald’s can be measured to see if it is quick enough. see if it is quick enough.
4-4-99
Quality MeasuresQuality Measures
VariableVariable Since a variable evaluation is the result of some Since a variable evaluation is the result of some
form of measurement, it is sometimes referred form of measurement, it is sometimes referred to as a to as a quantitative classification method.quantitative classification method.
Because it is a measurement, a variable Because it is a measurement, a variable classification typically provides more classification typically provides more information about the product—the weight of a information about the product—the weight of a product is more informative than simply saying product is more informative than simply saying the product is good or bad.the product is good or bad.
4-4-1010
Nature of defect is different in servicesNature of defect is different in services Service defect is a failure to meet Service defect is a failure to meet
customer requirementscustomer requirements Monitor times, customer satisfactionMonitor times, customer satisfaction
Applying SPC to Applying SPC to ServiceService
4-4-1111
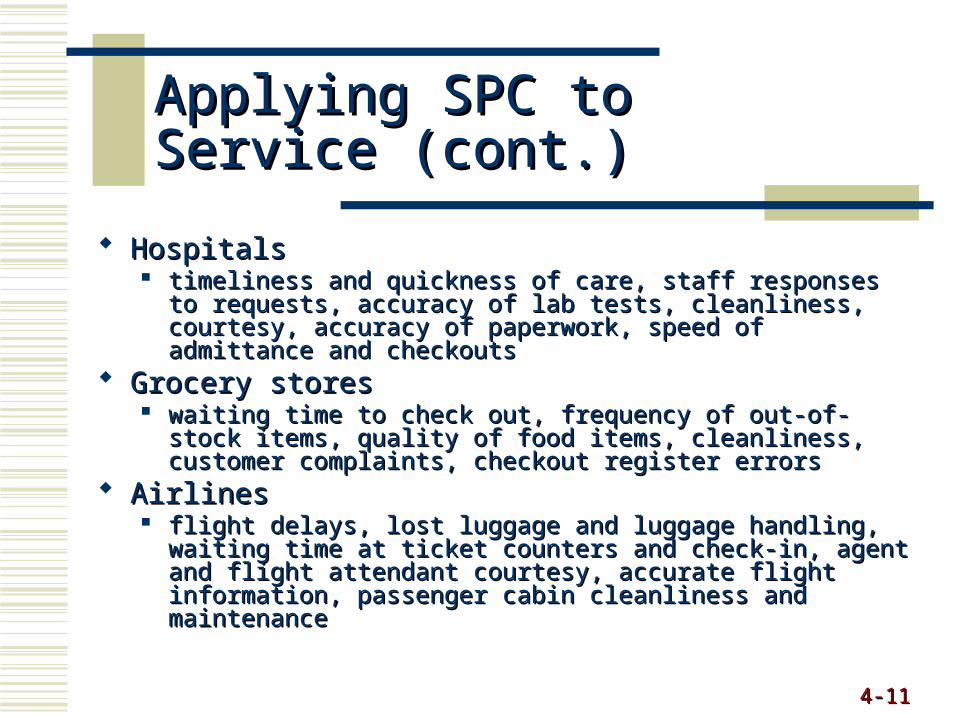
Applying SPC to Applying SPC to Service (cont.)Service (cont.)
HospitalsHospitals timeliness and quickness of care, staff responses to requests, timeliness and quickness of care, staff responses to requests,
accuracy of lab tests, cleanliness, courtesy, accuracy of accuracy of lab tests, cleanliness, courtesy, accuracy of paperwork, speed of admittance and checkoutspaperwork, speed of admittance and checkouts
Grocery storesGrocery stores waiting time to check out, frequency of out-of-stock items, waiting time to check out, frequency of out-of-stock items,
quality of food items, cleanliness, customer complaints, quality of food items, cleanliness, customer complaints, checkout register errorscheckout register errors
AirlinesAirlines flight delays, lost luggage and luggage handling, waiting time flight delays, lost luggage and luggage handling, waiting time
at ticket counters and check-in, agent and flight attendant at ticket counters and check-in, agent and flight attendant courtesy, accurate flight information, passenger cabin courtesy, accurate flight information, passenger cabin cleanliness and maintenancecleanliness and maintenance
4-4-1212
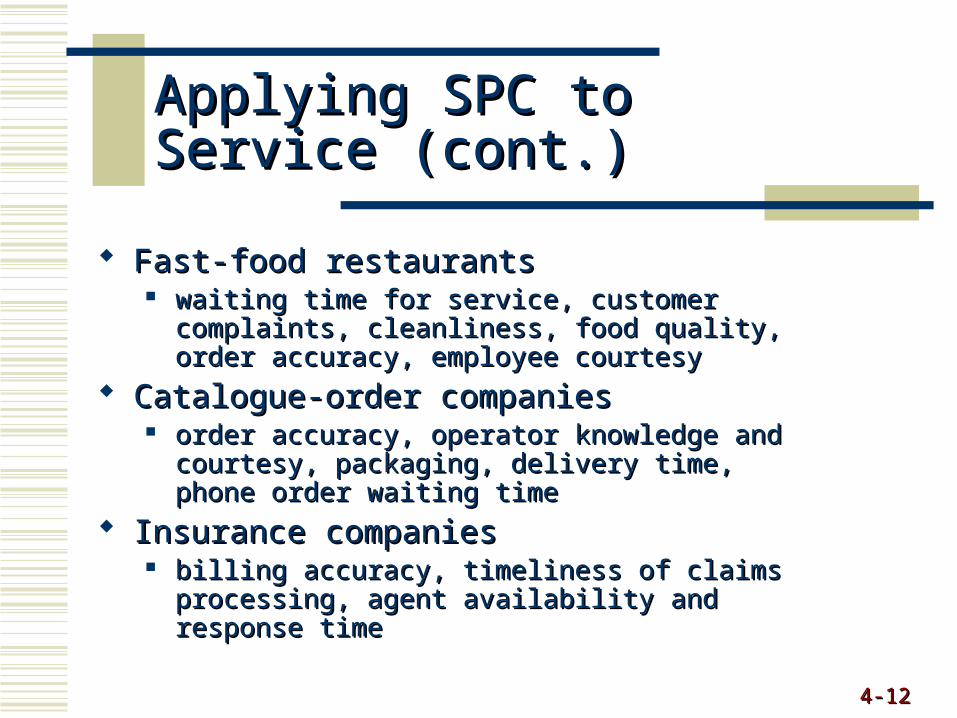
Applying SPC to Applying SPC to Service (cont.)Service (cont.)
Fast-food restaurantsFast-food restaurants waiting time for service, customer complaints, waiting time for service, customer complaints,
cleanliness, food quality, order accuracy, employee cleanliness, food quality, order accuracy, employee courtesycourtesy
Catalogue-order companiesCatalogue-order companies order accuracy, operator knowledge and courtesy, order accuracy, operator knowledge and courtesy,
packaging, delivery time, phone order waiting timepackaging, delivery time, phone order waiting time Insurance companiesInsurance companies
billing accuracy, timeliness of claims processing, billing accuracy, timeliness of claims processing, agent availability and response timeagent availability and response time
4-4-1313
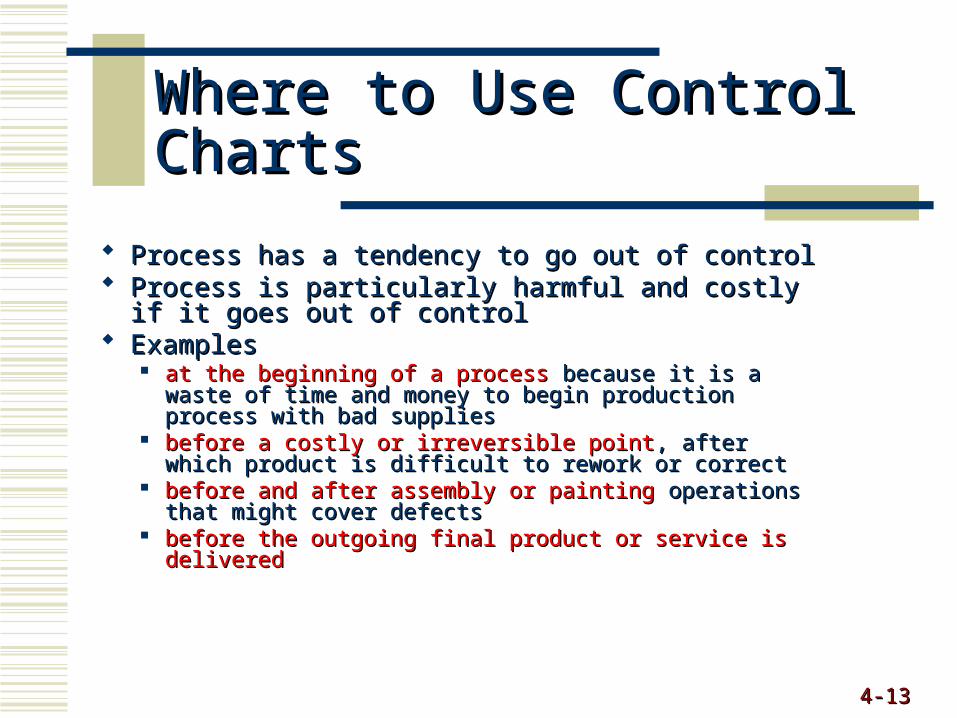
Where to Use Control ChartsWhere to Use Control Charts
Process has a tendency to go out of controlProcess has a tendency to go out of control Process is particularly harmful and costly if it Process is particularly harmful and costly if it
goes out of controlgoes out of control ExamplesExamples
at the beginning of a process at the beginning of a process because it is a waste of because it is a waste of time and money to begin production process with bad time and money to begin production process with bad suppliessupplies
before a costly or irreversible pointbefore a costly or irreversible point, after which product , after which product is difficult to rework or correctis difficult to rework or correct
before and after assembly or paintingbefore and after assembly or painting operations that operations that might cover defectsmight cover defects
before the outgoing final product or service is deliveredbefore the outgoing final product or service is delivered
4-4-1414
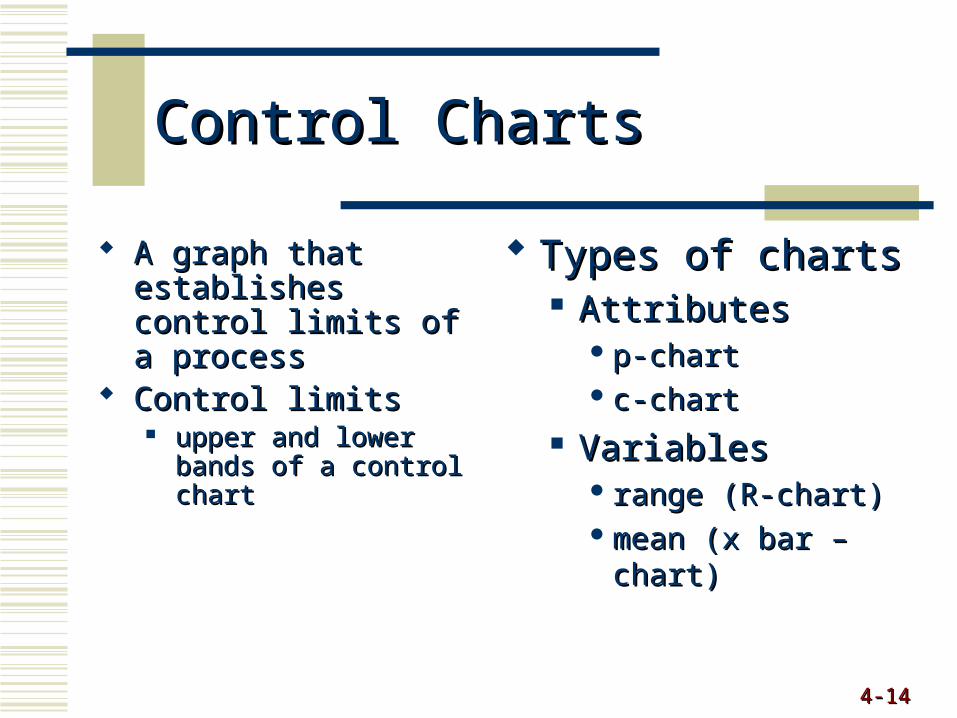
Control ChartsControl Charts
A graph that establishes A graph that establishes control limits of a control limits of a processprocess
Control limitsControl limits upper and lower bands of upper and lower bands of
a control charta control chart
Types of chartsTypes of charts AttributesAttributes
p-chartp-chart c-chartc-chart
VariablesVariables range (R-chart)range (R-chart) mean (x bar – chart)mean (x bar – chart)
4-4-1515
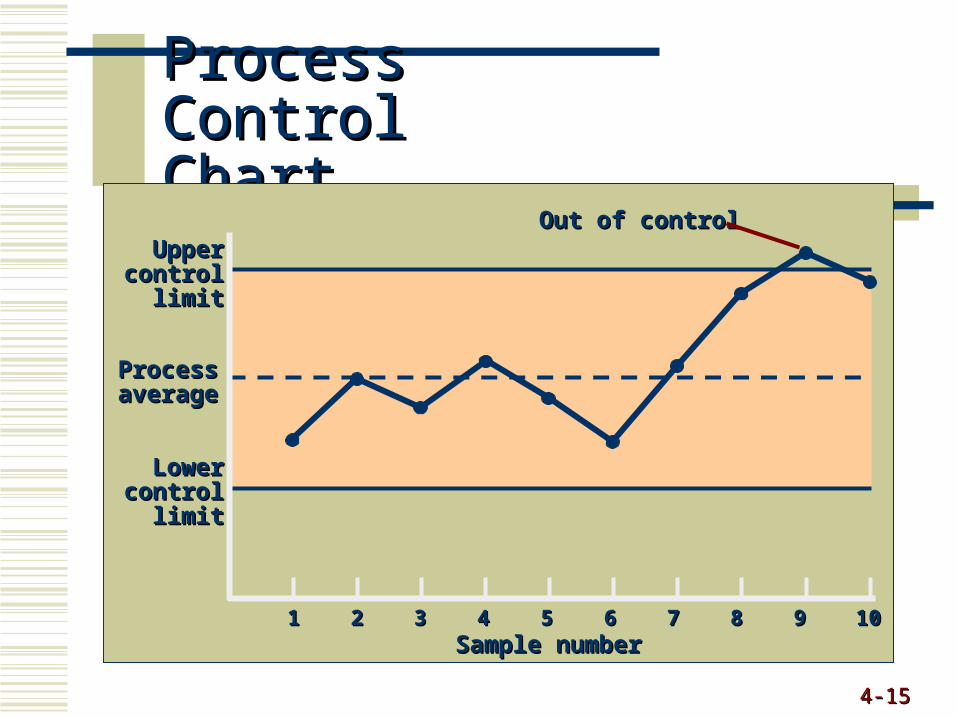
Process Control Process Control ChartChart
11 22 33 44 55 66 77 88 99 1010Sample numberSample number
UpperUppercontrolcontrol
limitlimit
ProcessProcessaverageaverage
LowerLowercontrolcontrol
limitlimit
Out of controlOut of control
4-4-1616
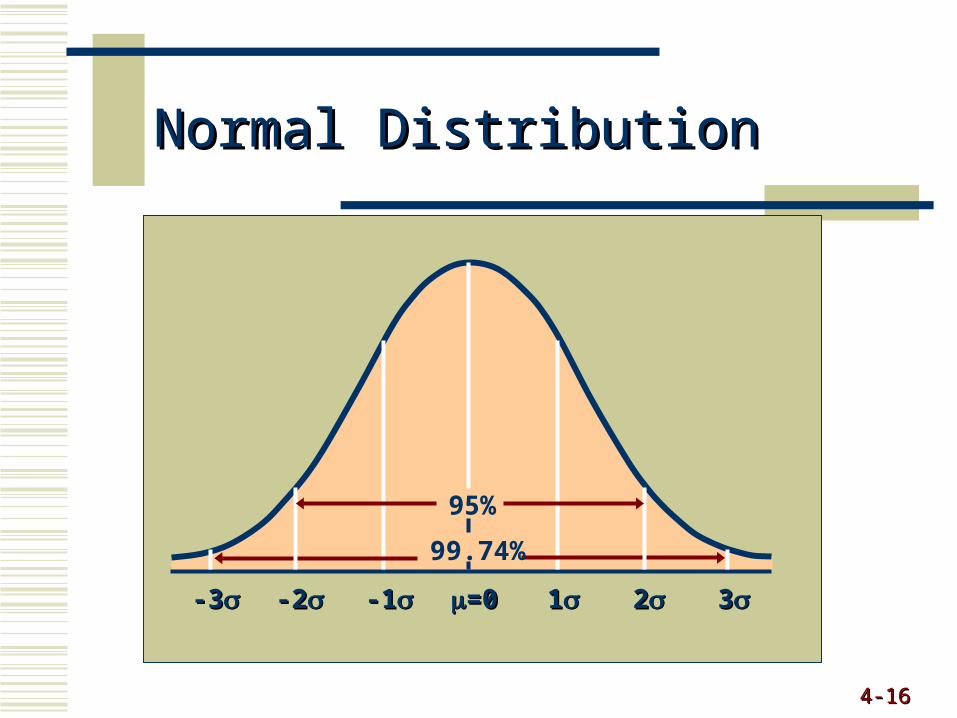
Normal DistributionNormal Distribution
=0=0 11 22 33-1-1-2-2-3-3
95%
99.74%
4-4-1717
Sigma LimitsSigma Limits
Occasionally, Occasionally, z is equal to 2.00 but most frequently is z is equal to 2.00 but most frequently is 3.00. A z value of 2.00 corresponds to 3.00. A z value of 2.00 corresponds to an overall normal an overall normal probability of 95%, and probability of 95%, and z 3.00 corresponds to a normal z 3.00 corresponds to a normal probability of 99.73%.probability of 99.73%.
The smaller the value of The smaller the value of z, the more narrow the control z, the more narrow the control limits are and the more sensitive the limits are and the more sensitive the chart is to changes chart is to changes in the production process. in the production process.
Control charts using Control charts using z 2.00 are often referred to z 2.00 are often referred to as as having 2-sigma (2) limits (referring to two standard having 2-sigma (2) limits (referring to two standard deviations), whereas deviations), whereas z 3.00 means z 3.00 means 3-sigma (3) limits.3-sigma (3) limits.
4-4-1818
A Process Is in A Process Is in Control If …Control If …
1. … no sample points outside limits
2. … most points near process average
3. … about equal number of points above and below centerline
4. … points appear randomly distributed
4-4-1919
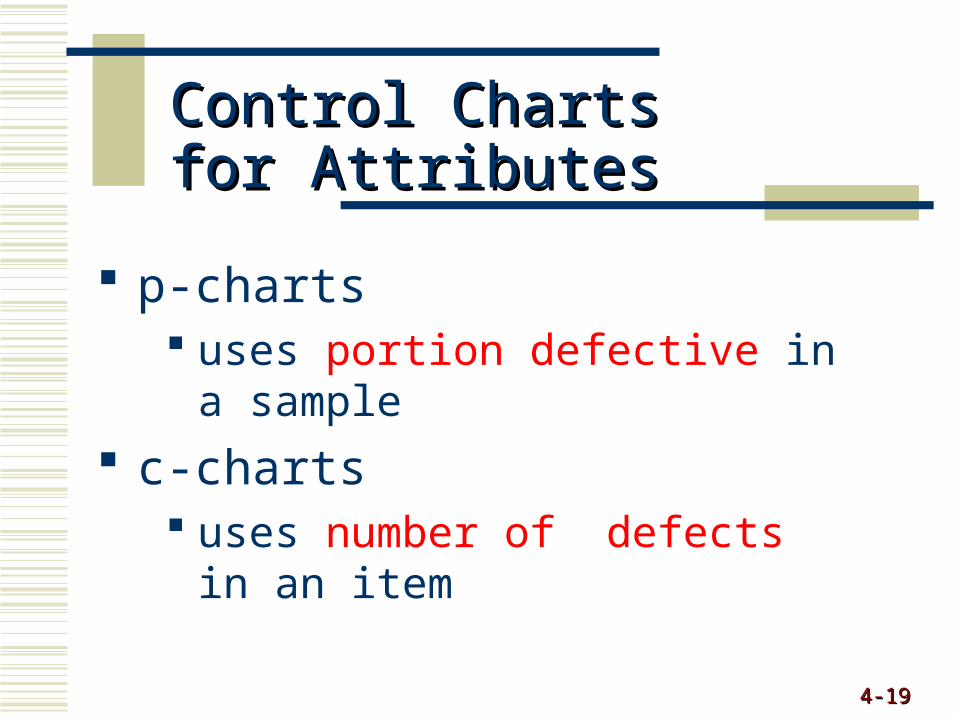
Control Charts for Control Charts for AttributesAttributes
p-charts uses portion defective in a sample
c-charts uses number of defects in an item
4-4-2020
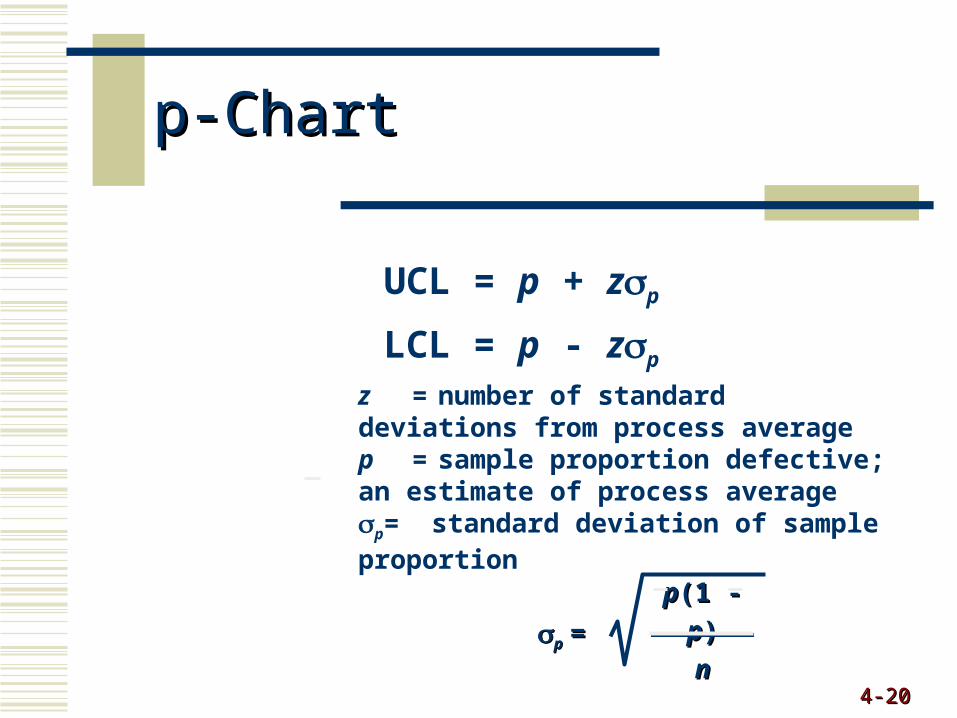
p-Chartp-Chart
UCL = p + zp
LCL = p - zp
z = number of standard deviations from process averagep = sample proportion defective; an estimate of process averagep= standard deviation of sample proportion
pp = = pp(1 - (1 - pp))
nn
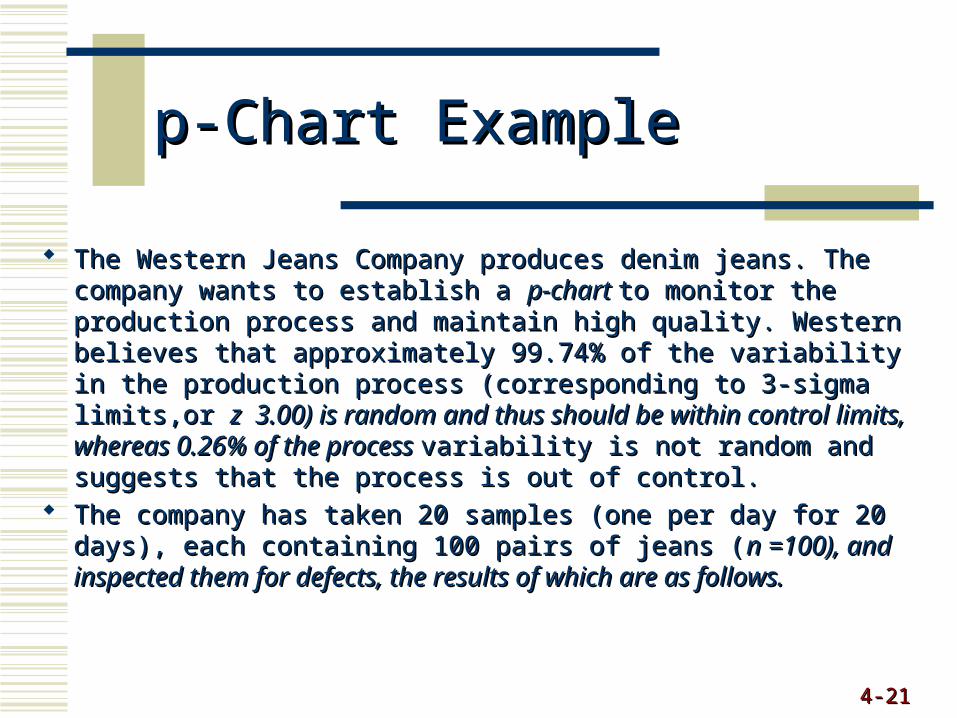
p-Chart Examplep-Chart Example
The Western Jeans Company produces denim jeans. The The Western Jeans Company produces denim jeans. The company wants to establish a company wants to establish a p-chart p-chart to monitor the production to monitor the production process and maintain high quality. Western believes that process and maintain high quality. Western believes that approximately 99.74% of the variability in the production approximately 99.74% of the variability in the production process (corresponding to 3-sigma limits,or process (corresponding to 3-sigma limits,or z 3.00) is random z 3.00) is random and thus should be within control limits, whereas 0.26% of the and thus should be within control limits, whereas 0.26% of the process process variability is not random and suggests that the process variability is not random and suggests that the process is out of control.is out of control.
The company has taken 20 samples (one per day for 20 days), The company has taken 20 samples (one per day for 20 days), each containing 100 pairs of jeans (each containing 100 pairs of jeans (n =100), and inspected n =100), and inspected them for defects, the results of which are as follows.them for defects, the results of which are as follows.
4-4-2121
4-4-2222
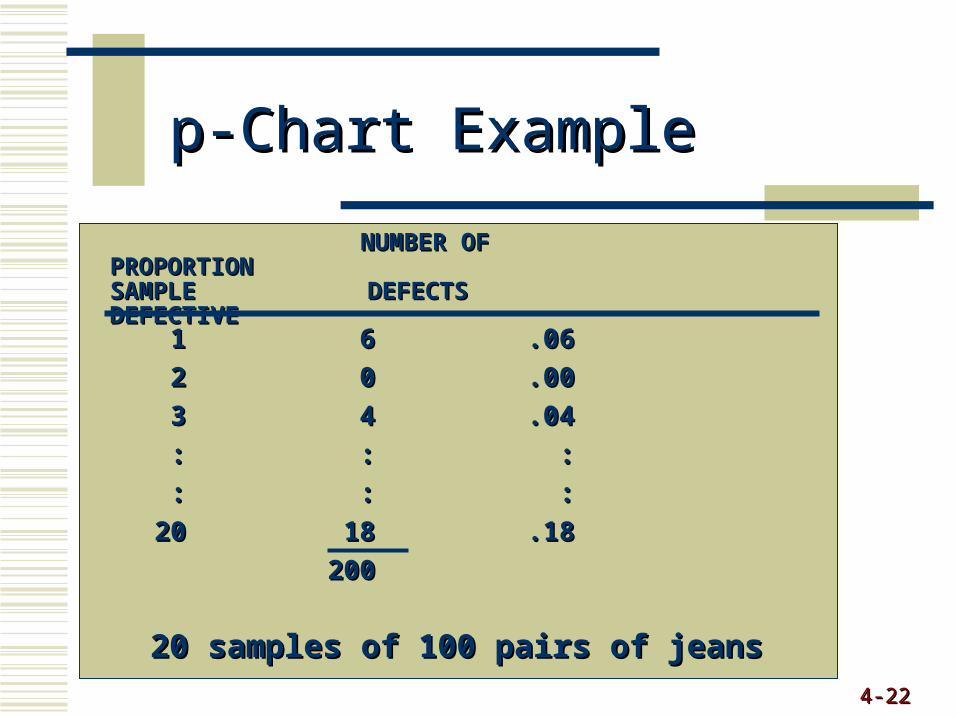
p-Chart Examplep-Chart Example
20 samples of 100 pairs of jeans20 samples of 100 pairs of jeans
NUMBER OFNUMBER OF PROPORTION PROPORTIONSAMPLESAMPLE DEFECTS DEFECTS DEFECTIVE DEFECTIVE
11 66 .06.06
22 00 .00.00
33 44 .04.04
:: :: ::
:: :: ::
2020 1818 .18.18
200200
p-Chart Examplep-Chart Example
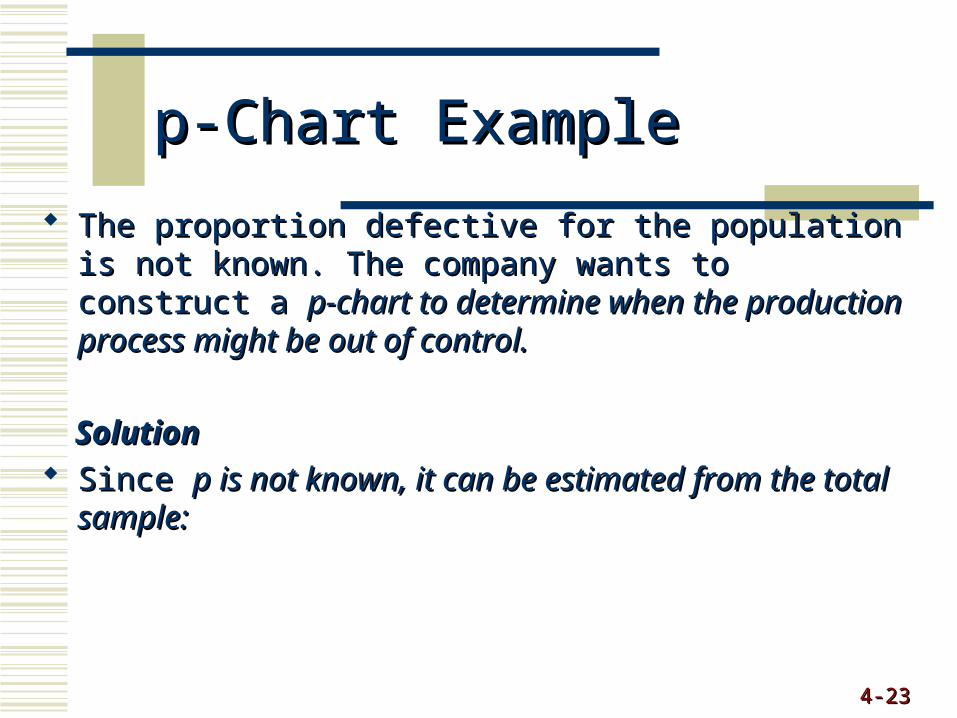
The proportion defective for the population is not known. The proportion defective for the population is not known. The company wants to construct a The company wants to construct a p-chart to determine p-chart to determine when the production process might be out of control.when the production process might be out of control.
SolutionSolution Since Since p is not known, it can be estimated from the total p is not known, it can be estimated from the total
sample:sample:
4-4-2323
4-4-2424
p-Chart Example (cont.)p-Chart Example (cont.)
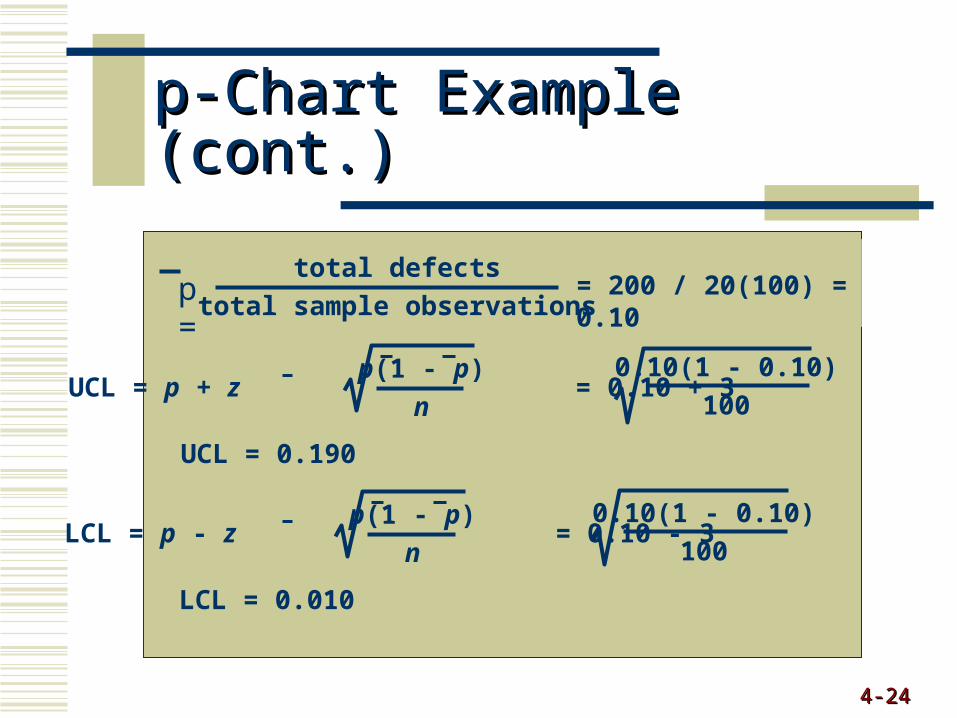
UCL = p + z = 0.10 + 3p(1 - p)
n
0.10(1 - 0.10)
100
UCL = 0.190
LCL = 0.010
LCL = p - z = 0.10 - 3p(1 - p)
n
0.10(1 - 0.10)
100
= 200 / 20(100) = 0.10total defects
total sample observationsp =
4-4-2525
0.020.02
0.040.04
0.060.06
0.080.08
0.100.10
0.120.12
0.140.14
0.160.16
0.180.18
0.200.20
Pro
po
rtio
n d
efec
tive
Pro
po
rtio
n d
efec
tive
Sample numberSample number22 44 66 88 1010 1212 1414 1616 1818 2020
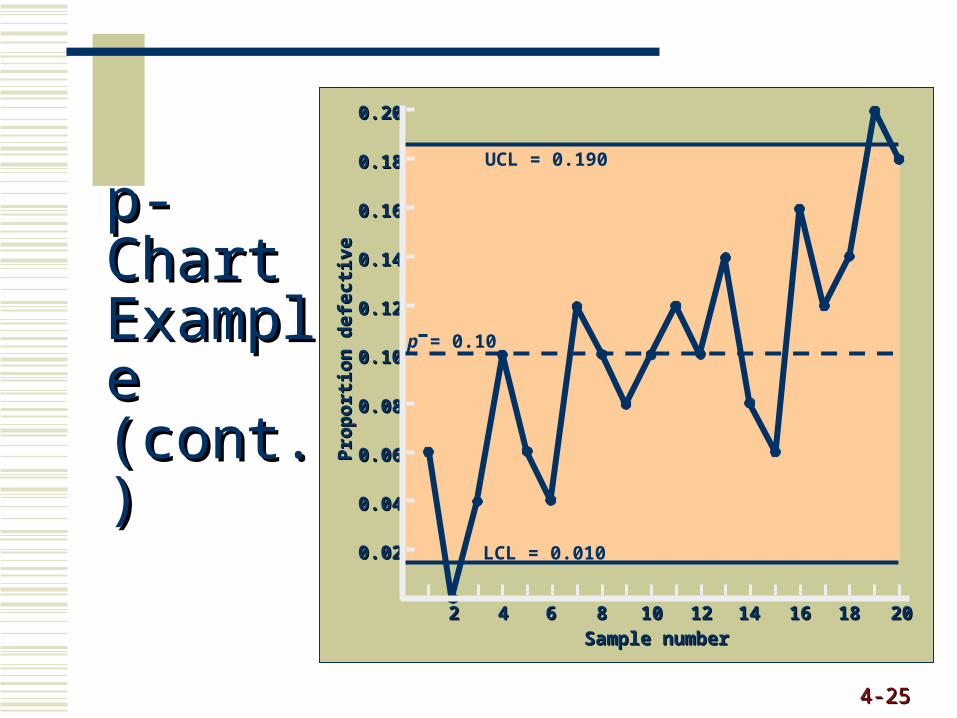
UCL = 0.190
LCL = 0.010
p = 0.10
p-Chart p-Chart Example Example (cont.)(cont.)
p-Chart Examplep-Chart Example
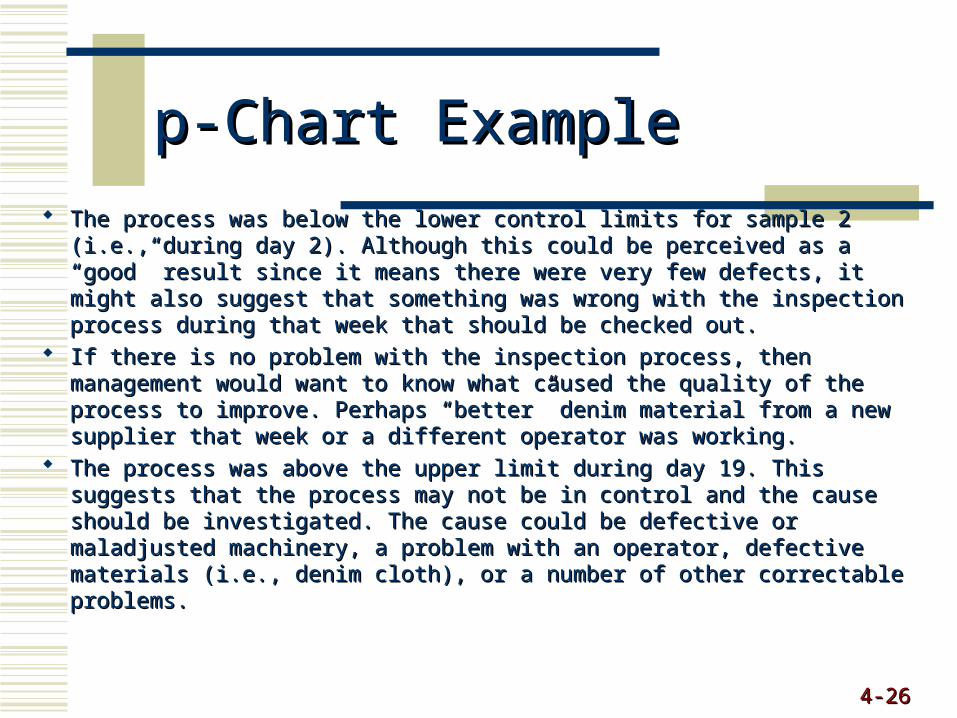
The process was below the lower control limits for sample 2 (i.e., during The process was below the lower control limits for sample 2 (i.e., during day 2). Although this could be perceived as a “good” result since it day 2). Although this could be perceived as a “good” result since it means there were very few defects, it might also suggest that something means there were very few defects, it might also suggest that something was wrong with the inspection process during that week that should be was wrong with the inspection process during that week that should be checked out.checked out.
If there is no problem with the inspection process, then management If there is no problem with the inspection process, then management would want to know what caused the quality of the process to improve. would want to know what caused the quality of the process to improve. Perhaps “better” denim material from a new supplier that week or a Perhaps “better” denim material from a new supplier that week or a different operator was working.different operator was working.
The process was above the upper limit during day 19. This suggests that The process was above the upper limit during day 19. This suggests that the process may not be in control and the cause should be investigated. the process may not be in control and the cause should be investigated. The cause could be defective or maladjusted machinery, a problem with The cause could be defective or maladjusted machinery, a problem with an operator, defective materials (i.e., denim cloth), or a number of other an operator, defective materials (i.e., denim cloth), or a number of other correctable problems. correctable problems.
4-4-2626
p-Chart Examplep-Chart Example
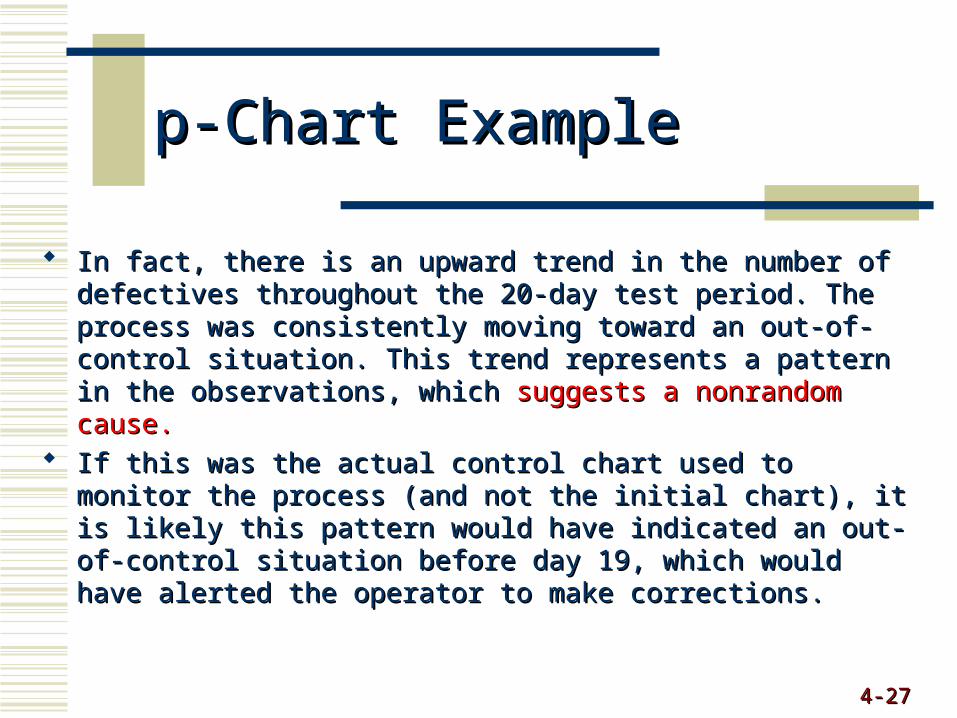
In fact, there is an upward trend in the number of defectives In fact, there is an upward trend in the number of defectives throughout the 20-day test period. The process was consistently throughout the 20-day test period. The process was consistently moving toward an out-of-control situation. This trend represents a moving toward an out-of-control situation. This trend represents a pattern in the observations, which pattern in the observations, which suggests a nonrandom cause. suggests a nonrandom cause.
If this was the actual control chart used to monitor the process (and If this was the actual control chart used to monitor the process (and not the initial chart), it is likely this pattern would have indicated an not the initial chart), it is likely this pattern would have indicated an out-of-control situation before day 19, which would have alerted the out-of-control situation before day 19, which would have alerted the operator to make corrections.operator to make corrections.
4-4-2727
4-4-2828
c-Chartc-Chart
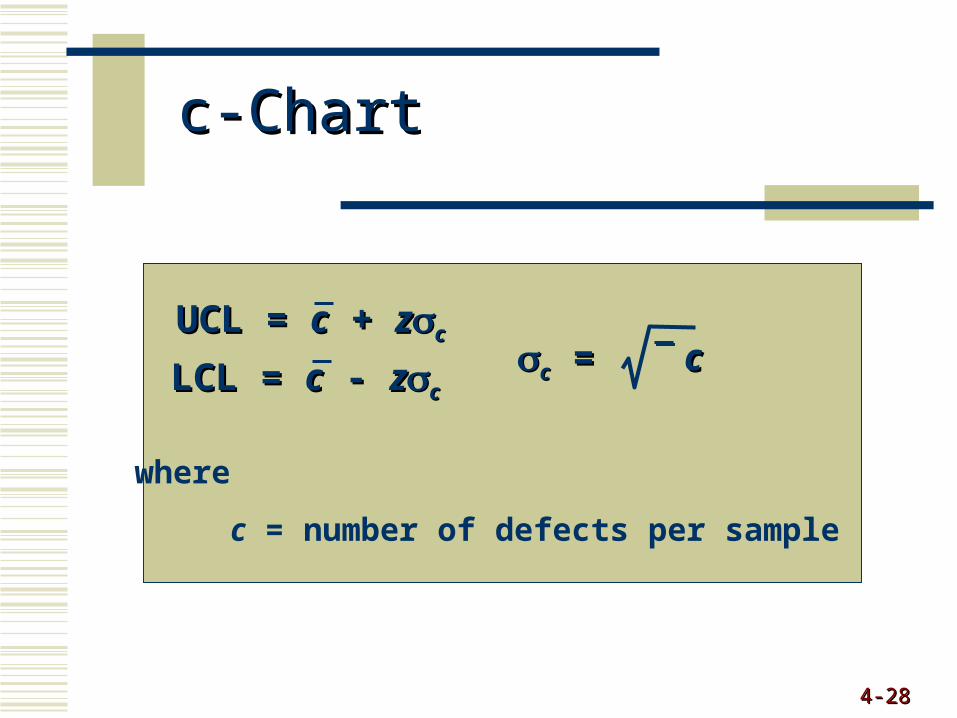
UCL = UCL = cc + + zzcc
LCL = LCL = cc - - zzcc
where
c = number of defects per sample
cc = = cc
c-Chart Examplec-Chart Example
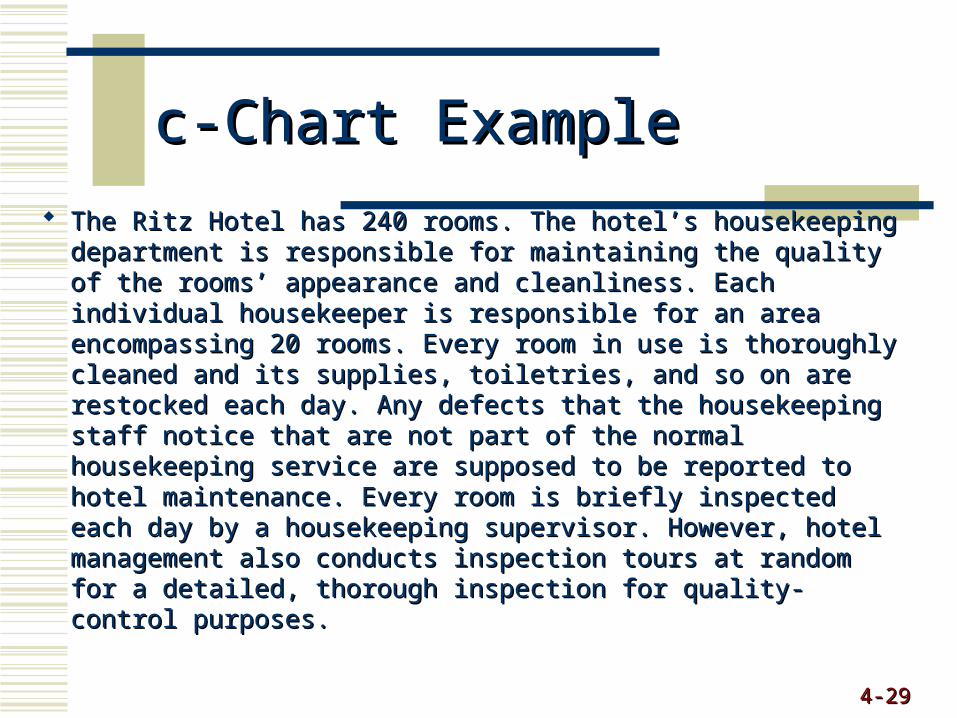
The Ritz Hotel has 240 rooms. The hotel’s housekeeping The Ritz Hotel has 240 rooms. The hotel’s housekeeping department is responsible for maintaining the quality of the department is responsible for maintaining the quality of the rooms’ appearance and cleanliness. Each individual rooms’ appearance and cleanliness. Each individual housekeeper is responsible for an area encompassing 20 housekeeper is responsible for an area encompassing 20 rooms. Every room in use is thoroughly cleaned and its rooms. Every room in use is thoroughly cleaned and its supplies, toiletries, and so on are restocked each day. Any supplies, toiletries, and so on are restocked each day. Any defects that the housekeeping staff notice that are not part of defects that the housekeeping staff notice that are not part of the normal housekeeping service are supposed to be reported the normal housekeeping service are supposed to be reported to hotel maintenance. Every room is briefly inspected each day to hotel maintenance. Every room is briefly inspected each day by a housekeeping supervisor. However, hotel management by a housekeeping supervisor. However, hotel management also conducts inspection tours at random for a detailed, also conducts inspection tours at random for a detailed, thorough inspection for quality-control purposes. thorough inspection for quality-control purposes.
4-4-2929
c-Chart Examplec-Chart Example
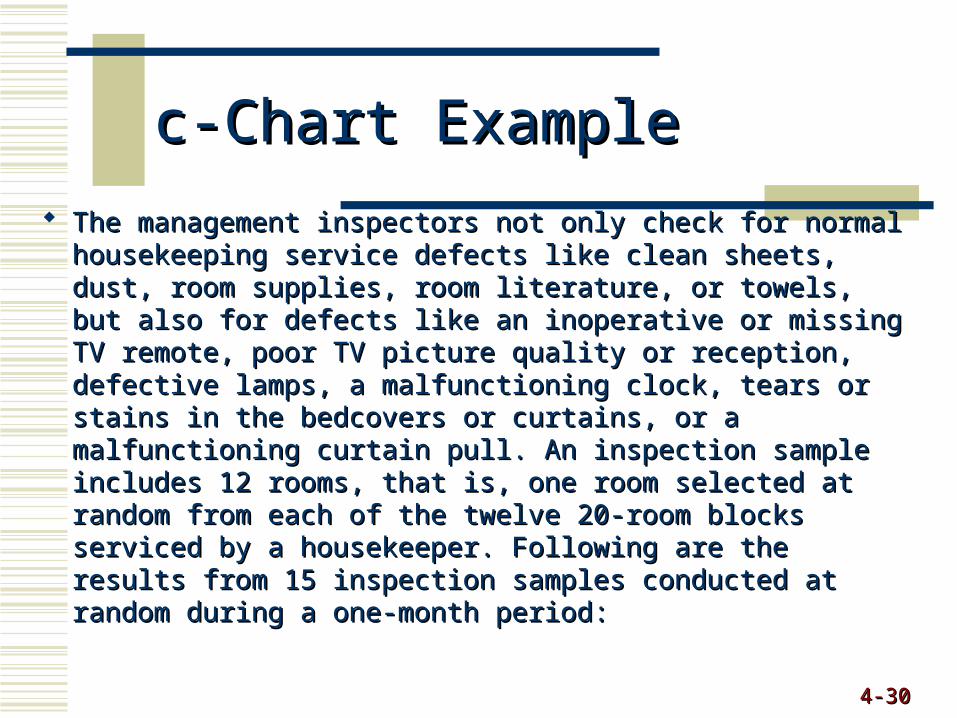
The management inspectors not only check for normal The management inspectors not only check for normal housekeeping service defects like clean sheets, dust, room housekeeping service defects like clean sheets, dust, room supplies, room literature, or towels, but also for defects like supplies, room literature, or towels, but also for defects like an inoperative or missing TV remote, poor TV picture an inoperative or missing TV remote, poor TV picture quality or reception, defective lamps, a malfunctioning quality or reception, defective lamps, a malfunctioning clock, tears or stains in the bedcovers or curtains, or a clock, tears or stains in the bedcovers or curtains, or a malfunctioning curtain pull. An inspection sample includes malfunctioning curtain pull. An inspection sample includes 12 rooms, that is, one room selected at random from each 12 rooms, that is, one room selected at random from each of the twelve 20-room blocks serviced by a housekeeper. of the twelve 20-room blocks serviced by a housekeeper. Following are the results from 15 inspection samples Following are the results from 15 inspection samples conducted at random during a one-month period:conducted at random during a one-month period:
4-4-3030
c-Chart Examplec-Chart Example
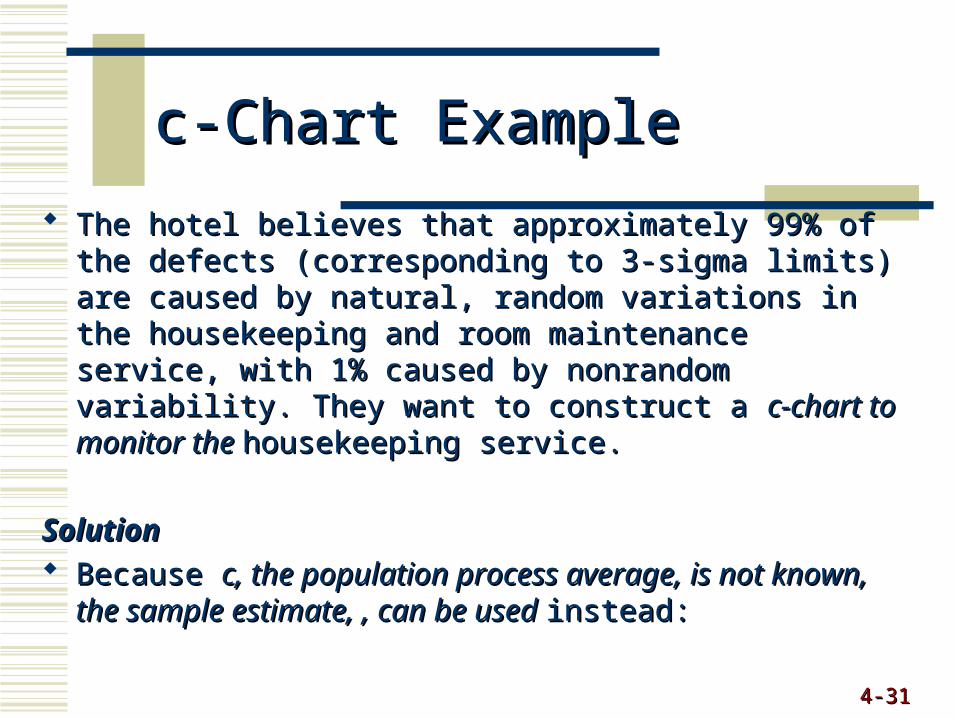
The hotel believes that approximately 99% of the defects The hotel believes that approximately 99% of the defects (corresponding to 3-sigma limits) are caused by natural, (corresponding to 3-sigma limits) are caused by natural, random variations in the housekeeping and room random variations in the housekeeping and room maintenance service, with 1% caused by nonrandom maintenance service, with 1% caused by nonrandom variability. They want to construct a variability. They want to construct a c-chart to monitor the c-chart to monitor the housekeeping service.housekeeping service.
SolutionSolution Because Because c, the population process average, is not known, c, the population process average, is not known,
the sample estimate, , can be used the sample estimate, , can be used instead:instead:
4-4-3131
4-4-3232
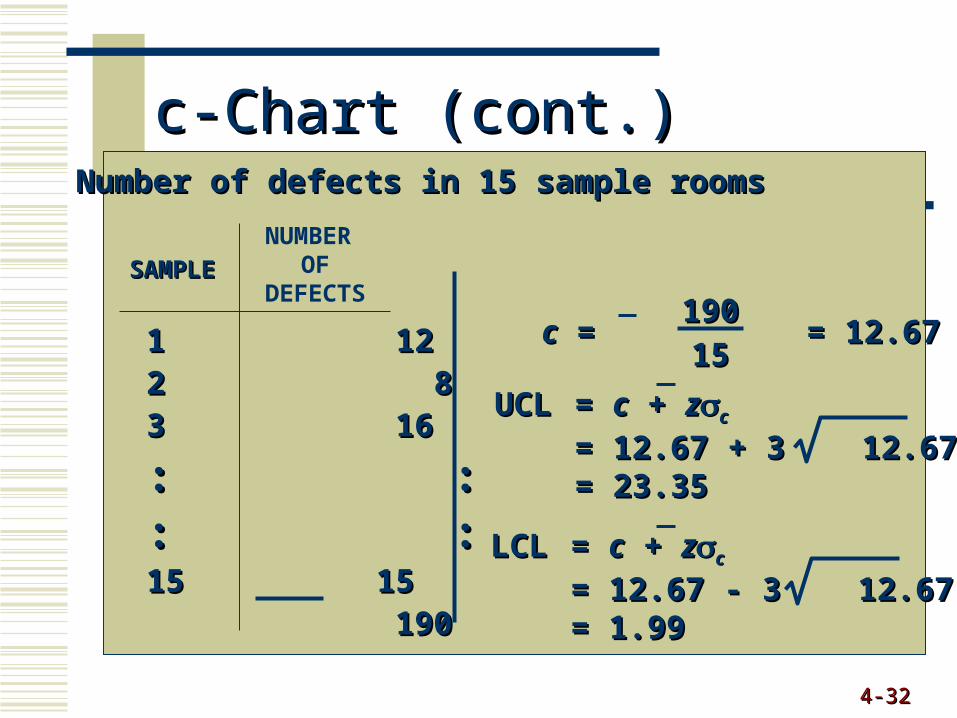
c-Chart (cont.)c-Chart (cont.)Number of defects in 15 sample roomsNumber of defects in 15 sample rooms
1 121 122 82 83 163 16
: :: :: :: :15 1515 15 190190
SAMPLESAMPLE
cc = = 12.67 = = 12.67190190
1515
UCLUCL = = cc + + zzcc
= 12.67 + 3 12.67= 12.67 + 3 12.67= 23.35= 23.35
LCLLCL = = cc + + zzcc
= 12.67 - 3 12.67= 12.67 - 3 12.67= 1.99= 1.99
NUMBER OF
DEFECTS
4-4-3333
33
66
99
1212
1515
1818
2121
2424
Nu
mb
er o
f d
efec
tsN
um
ber
of
def
ects
Sample numberSample number
22 44 66 88 1010 1212 1414 1616
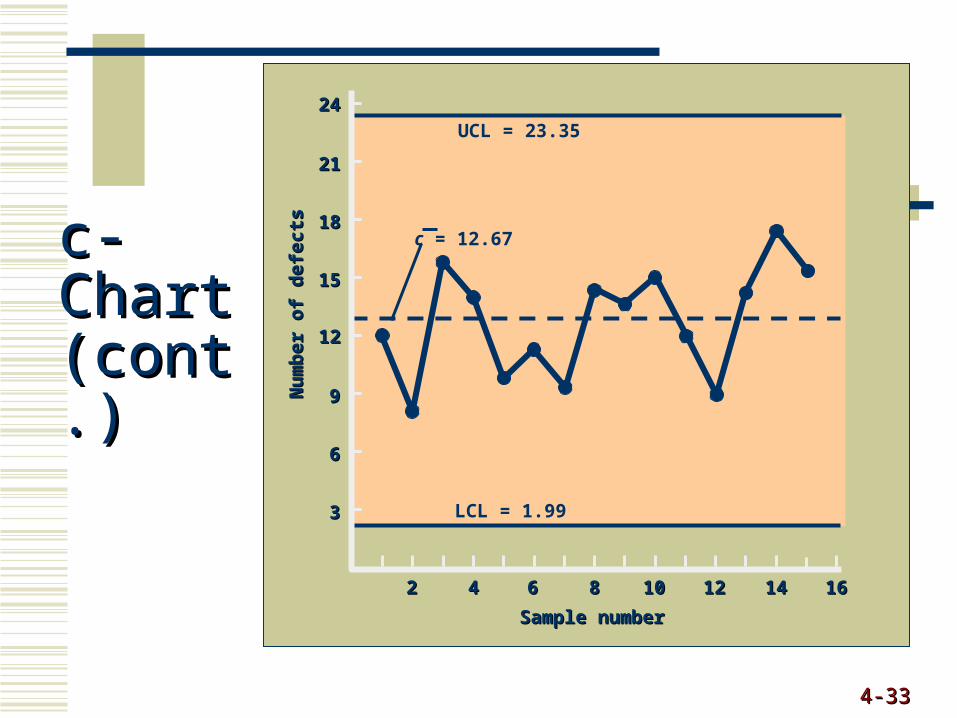
UCL = 23.35
LCL = 1.99
c = 12.67
c-Chart c-Chart (cont.)(cont.)
c-Chart Examplec-Chart Example
All the sample observations are within the control limits, All the sample observations are within the control limits, suggesting that the room quality is in control. This chart suggesting that the room quality is in control. This chart would be considered reliable to monitor the room quality in would be considered reliable to monitor the room quality in the future.the future.
4-4-3434
4-4-3535
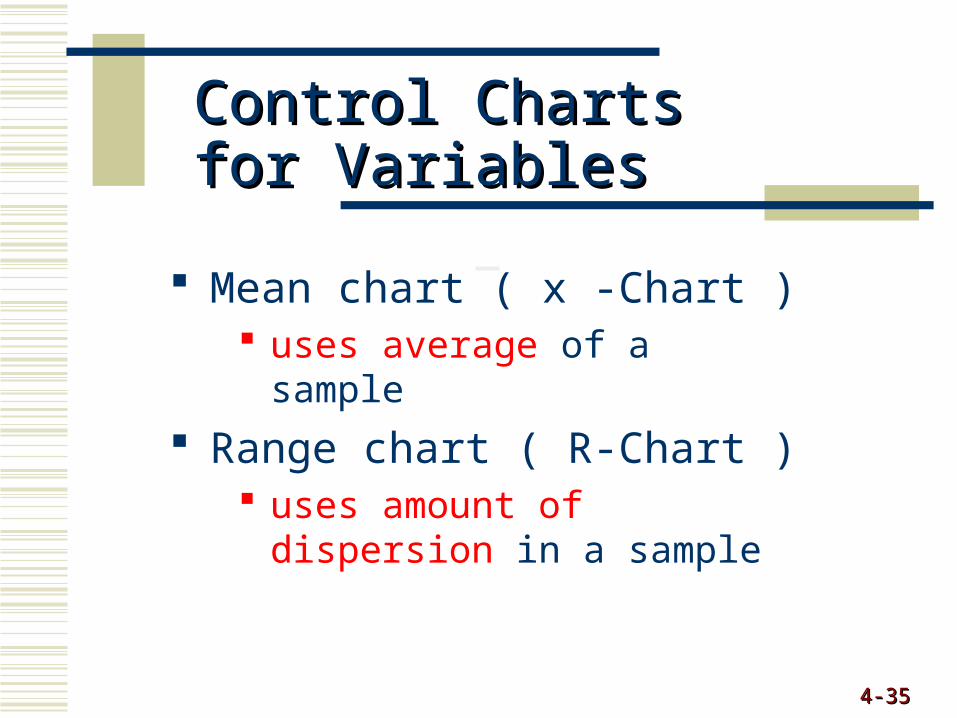
Control Charts for Control Charts for VariablesVariables
Mean chart ( x -Chart ) uses average of a sample
Range chart ( R-Chart ) uses amount of dispersion in a
sample
4-4-3636
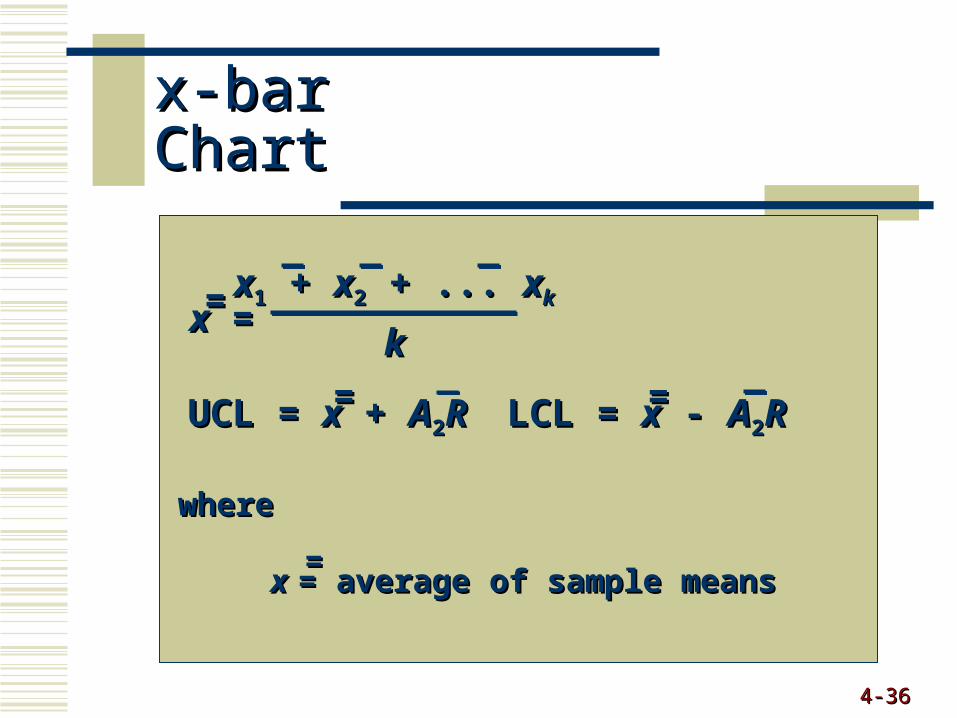
x-bar Chartx-bar Chart
xx = = xx11 + + xx22 + ... + ... xxkk
kk==
UCL = UCL = xx + + AA22RR LCL = LCL = xx - - AA22RR== ==
wherewhere
xx = average of sample means= average of sample means==
x- bar Chart Examplex- bar Chart Example
The Goliath Tool Company produces slip-ring bearings, The Goliath Tool Company produces slip-ring bearings, which look like flat doughnuts or washers. They fit around which look like flat doughnuts or washers. They fit around shafts or rods, such as drive shafts in machinery or shafts or rods, such as drive shafts in machinery or motors. At an early stage in the production process for a motors. At an early stage in the production process for a particular slip-ring bearing, the outside diameter of the particular slip-ring bearing, the outside diameter of the bearing is measured. Employees have taken 10 samples bearing is measured. Employees have taken 10 samples (during a 10-day period) of 5 slip-ring bearings and (during a 10-day period) of 5 slip-ring bearings and measured the diameter of the bearings. The individual measured the diameter of the bearings. The individual observations from each sample (or subgroup) are shown observations from each sample (or subgroup) are shown as follows:as follows:
4-4-3737
4-4-3838
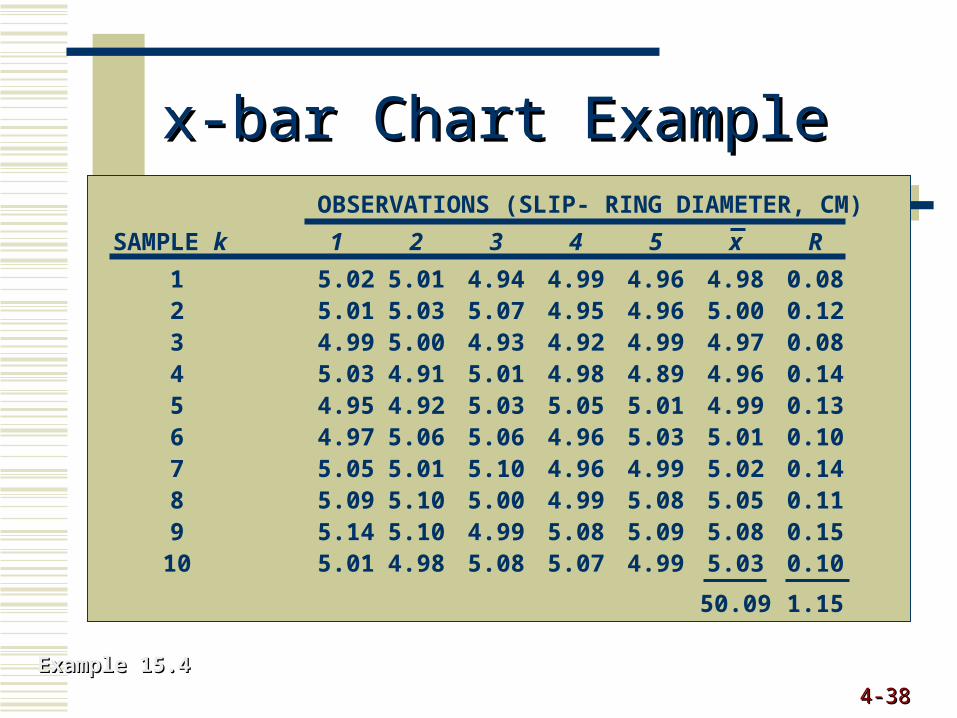
x-bar Chart Examplex-bar Chart Example
Example 15.4Example 15.4
OBSERVATIONS (SLIP- RING DIAMETER, CM)
SAMPLE k 1 2 3 4 5 x R
1 5.02 5.01 4.94 4.99 4.96 4.98 0.082 5.01 5.03 5.07 4.95 4.96 5.00 0.123 4.99 5.00 4.93 4.92 4.99 4.97 0.084 5.03 4.91 5.01 4.98 4.89 4.96 0.145 4.95 4.92 5.03 5.05 5.01 4.99 0.136 4.97 5.06 5.06 4.96 5.03 5.01 0.107 5.05 5.01 5.10 4.96 4.99 5.02 0.148 5.09 5.10 5.00 4.99 5.08 5.05 0.119 5.14 5.10 4.99 5.08 5.09 5.08 0.15
10 5.01 4.98 5.08 5.07 4.99 5.03 0.10
50.09 1.15
4-4-3939
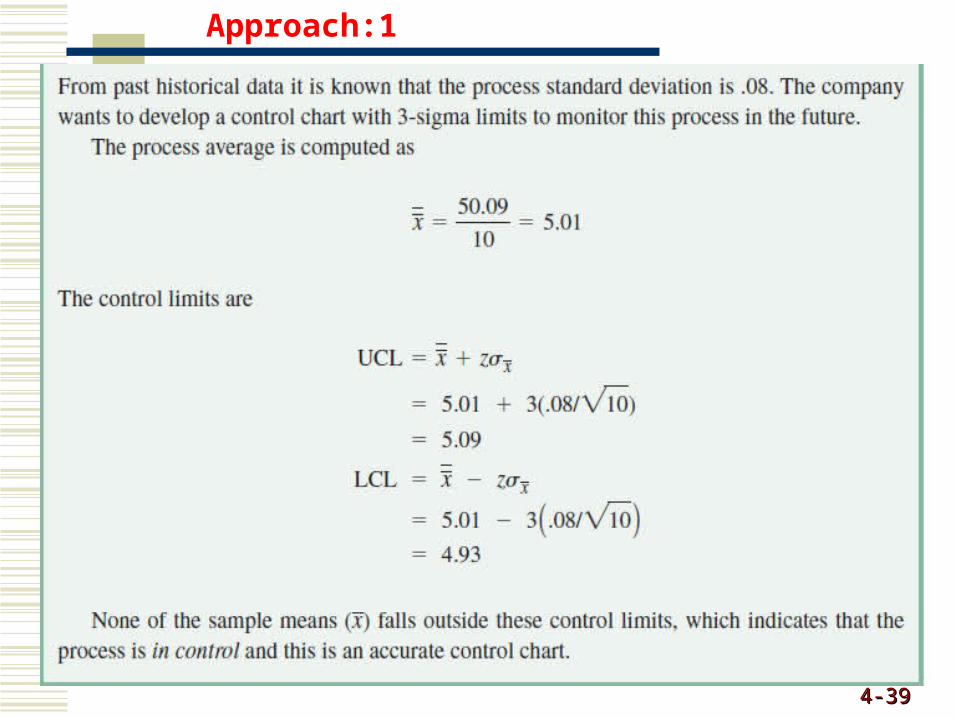
Approach:1
x- bar Chart Examplex- bar Chart Example
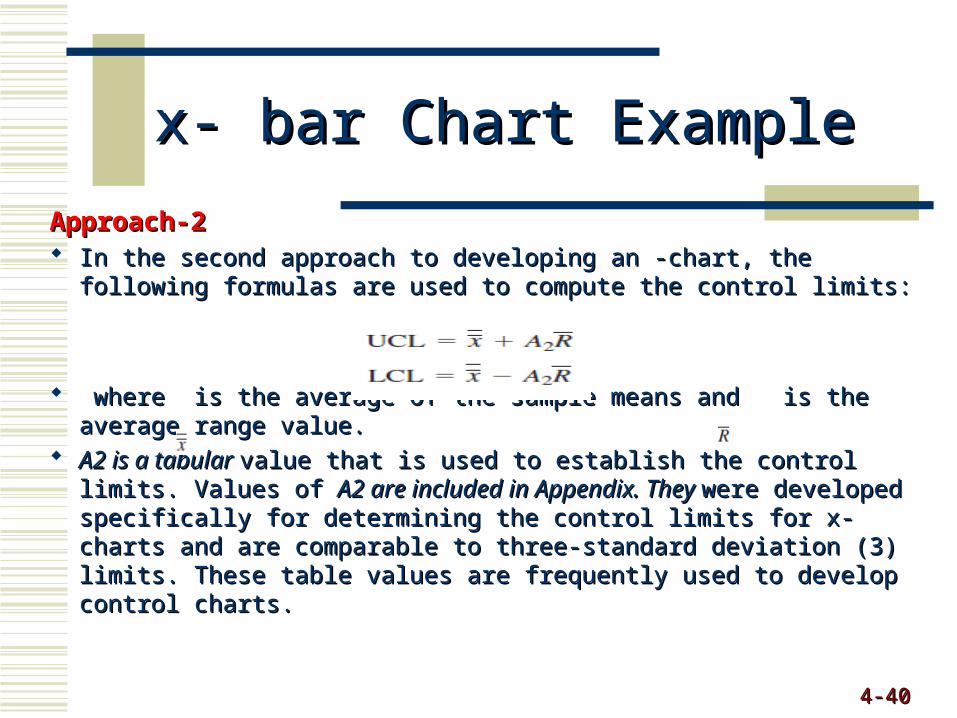
Approach-2Approach-2 In the second approach to developing an -chart, the following In the second approach to developing an -chart, the following
formulas are used to compute the control limits:formulas are used to compute the control limits:
where is the average of the sample means and is the average where is the average of the sample means and is the average
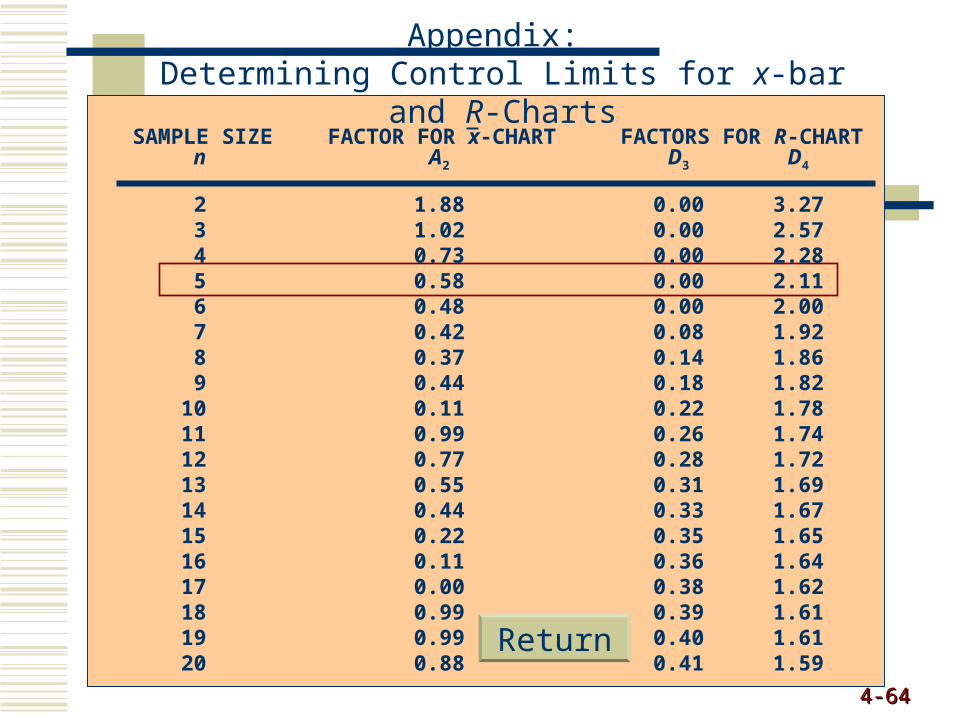
range value.range value. A2 is a tabular A2 is a tabular value that is used to establish the control limits. value that is used to establish the control limits.
Values of Values of A2 are included in Appendix. They A2 are included in Appendix. They were developed were developed specifically for determining the control limits for x-charts and are specifically for determining the control limits for x-charts and are comparable to three-standard deviation (3) limits. These table values comparable to three-standard deviation (3) limits. These table values are frequently used to develop control charts.are frequently used to develop control charts.
4-4-4040
4-4-4141
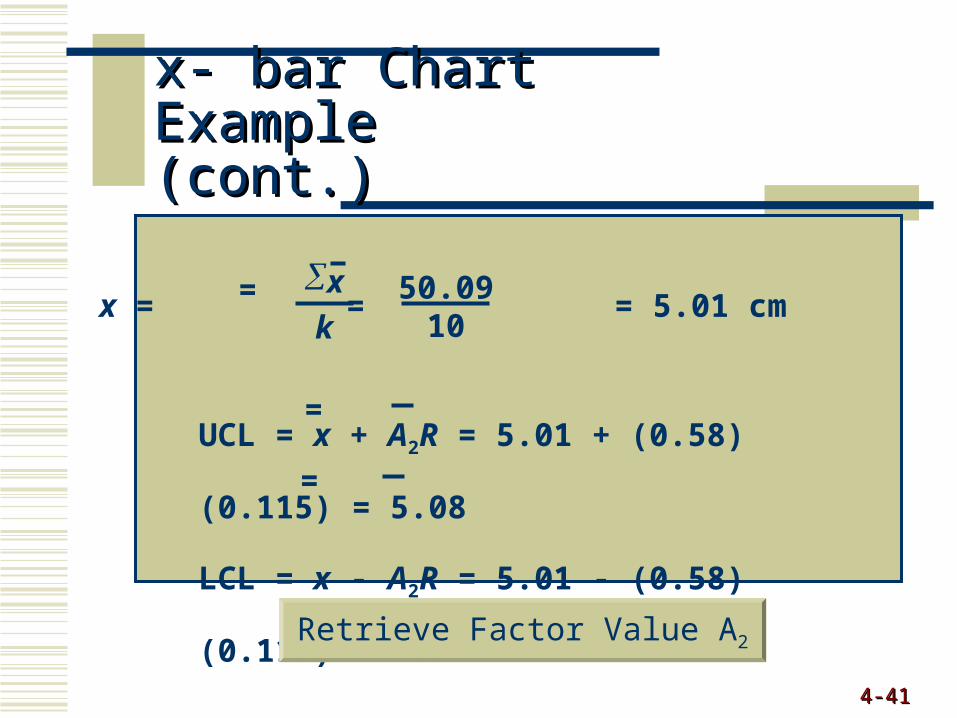
UCL = x + A2R = 5.01 + (0.58)(0.115) = 5.08
LCL = x - A2R = 5.01 - (0.58)(0.115) = 4.94
=
=
x = = = 5.01 cm= x
k50.09
10
x- bar Chart x- bar Chart Example (cont.)Example (cont.)
Retrieve Factor Value A2
4-4-4242
x- bar x- bar Chart Chart Example Example (cont.)(cont.)
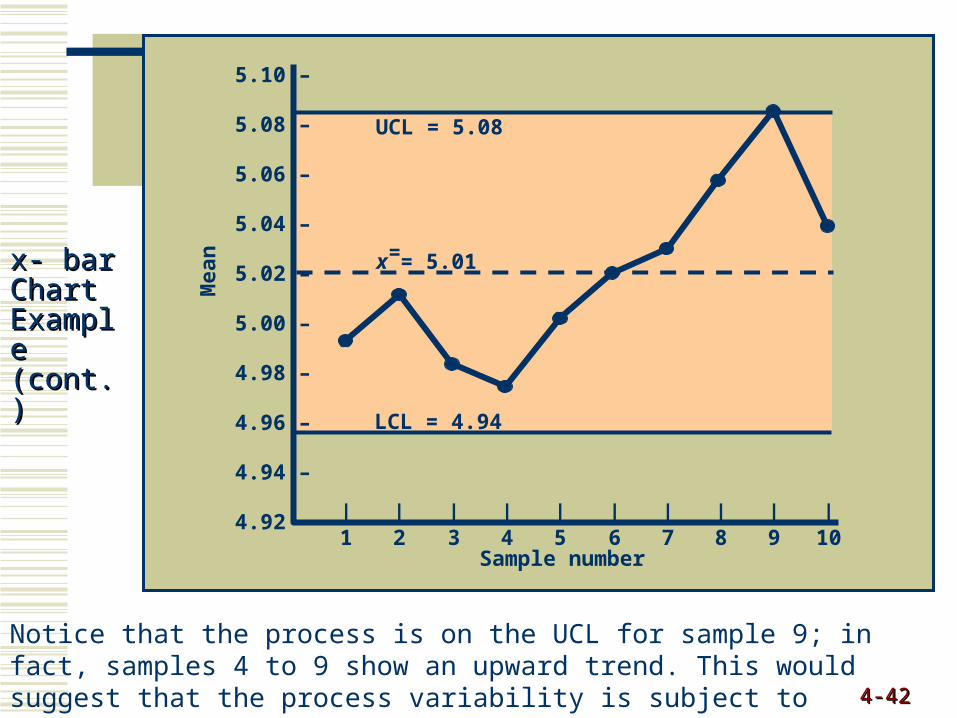
UCL = 5.08
LCL = 4.94
Mea
n
Sample number
|1
|2
|3
|4
|5
|6
|7
|8
|9
|10
5.10 –
5.08 –
5.06 –
5.04 –
5.02 –
5.00 –
4.98 –
4.96 –
4.94 –
4.92 –
x = 5.01=
Notice that the process is on the UCL for sample 9; in fact, samples 4 to 9 show an upward trend. This would suggest that the process variability is subject to nonrandom causes and should be investigated.
4-4-4343
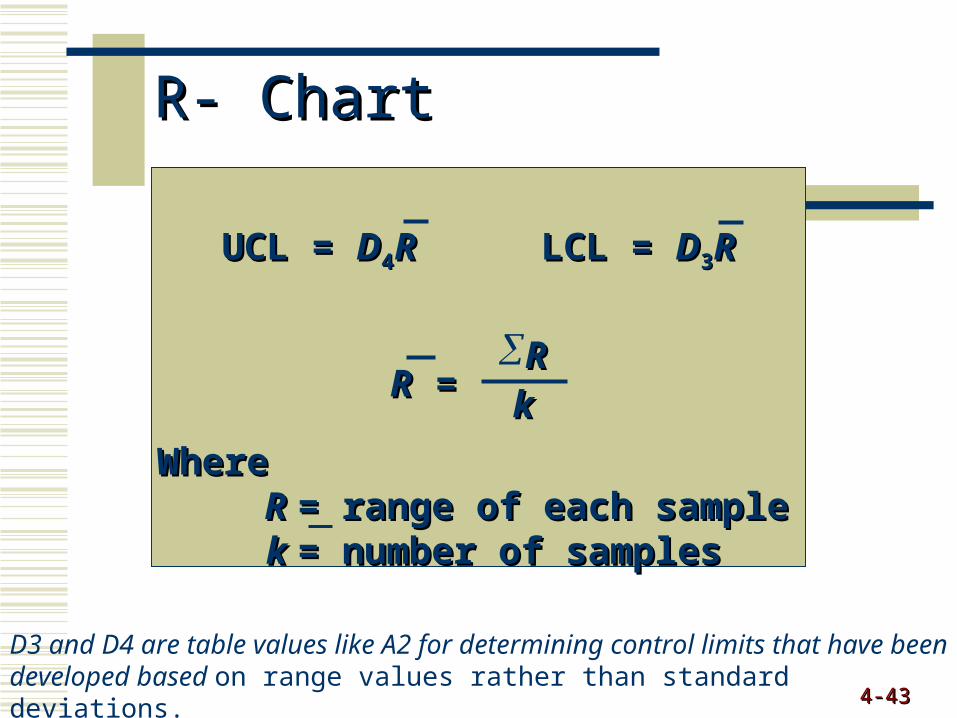
R- ChartR- Chart
UCL = UCL = DD44RR LCL = LCL = DD33RR
RR = = RRkk
WhereWhereRR = range of each sample= range of each samplekk = number of samples= number of samples
D3 and D4 are table values like A2 for determining control limits that have been developed based on range values rather than standard deviations.
4-4-4444
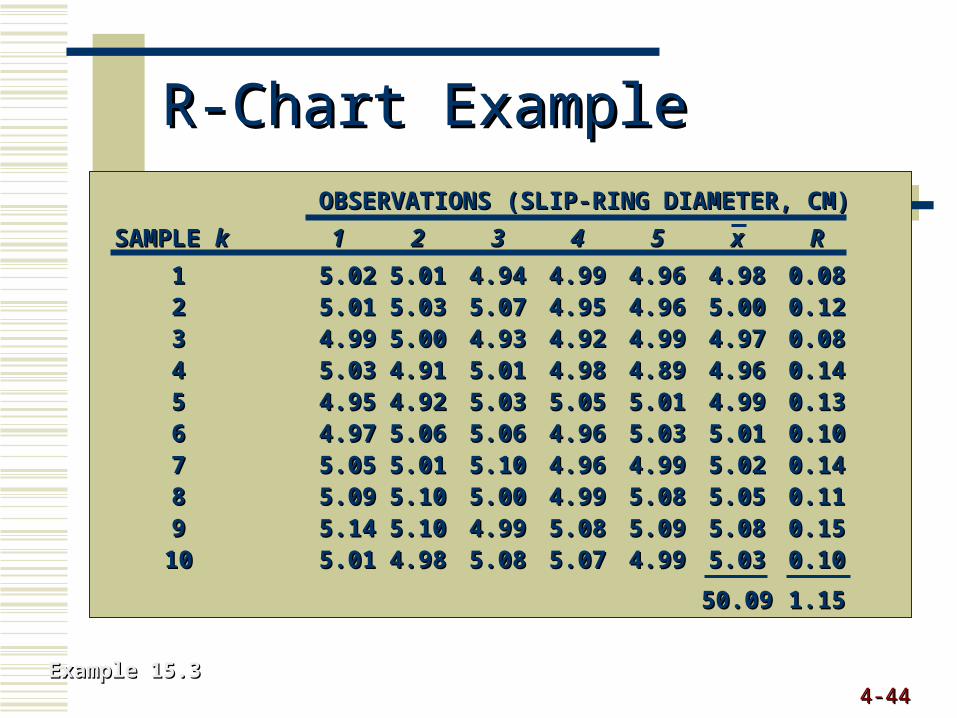
R-Chart ExampleR-Chart Example
OBSERVATIONS (SLIP-RING DIAMETER, CM)OBSERVATIONS (SLIP-RING DIAMETER, CM)
SAMPLE SAMPLE kk 11 22 33 44 55 xx RR
11 5.025.02 5.015.01 4.944.94 4.994.99 4.964.96 4.984.98 0.080.0822 5.015.01 5.035.03 5.075.07 4.954.95 4.964.96 5.005.00 0.120.1233 4.994.99 5.005.00 4.934.93 4.924.92 4.994.99 4.974.97 0.080.0844 5.035.03 4.914.91 5.015.01 4.984.98 4.894.89 4.964.96 0.140.1455 4.954.95 4.924.92 5.035.03 5.055.05 5.015.01 4.994.99 0.130.1366 4.974.97 5.065.06 5.065.06 4.964.96 5.035.03 5.015.01 0.100.1077 5.055.05 5.015.01 5.105.10 4.964.96 4.994.99 5.025.02 0.140.1488 5.095.09 5.105.10 5.005.00 4.994.99 5.085.08 5.055.05 0.110.1199 5.145.14 5.105.10 4.994.99 5.085.08 5.095.09 5.085.08 0.150.15
1010 5.015.01 4.984.98 5.085.08 5.075.07 4.994.99 5.035.03 0.100.10
50.0950.09 1.151.15
Example 15.3Example 15.3
4-4-4545
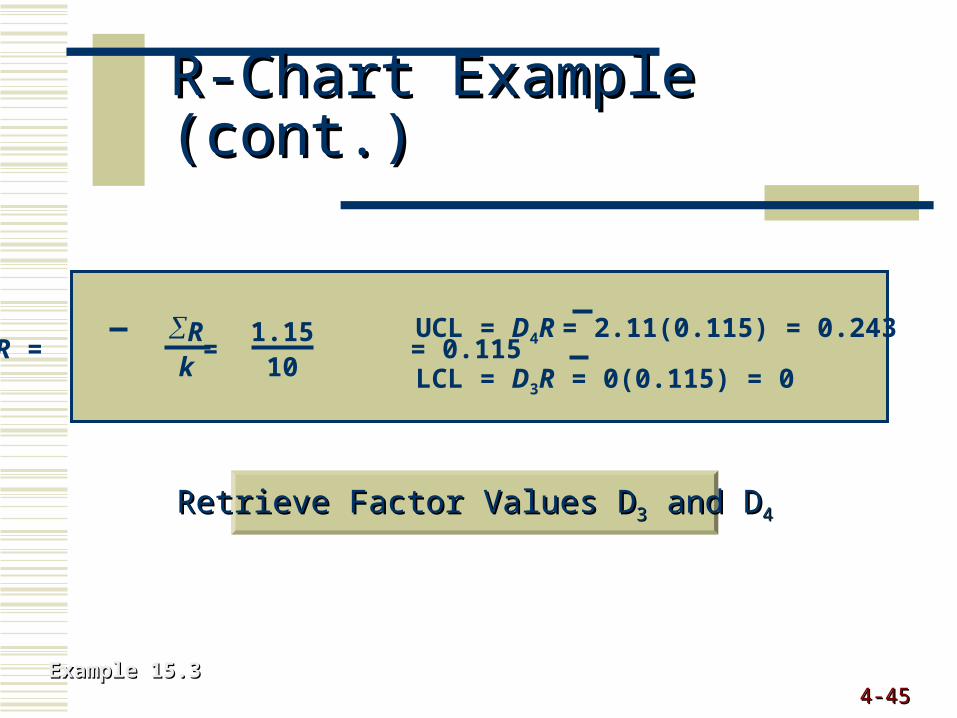
R-Chart Example (cont.)R-Chart Example (cont.)
Example 15.3Example 15.3
Rk
R = = = 0.115 1.1510
UCL = D4R = 2.11(0.115) = 0.243
LCL = D3R = 0(0.115) = 0
Retrieve Factor Values DRetrieve Factor Values D33 and D and D44
4-4-4646
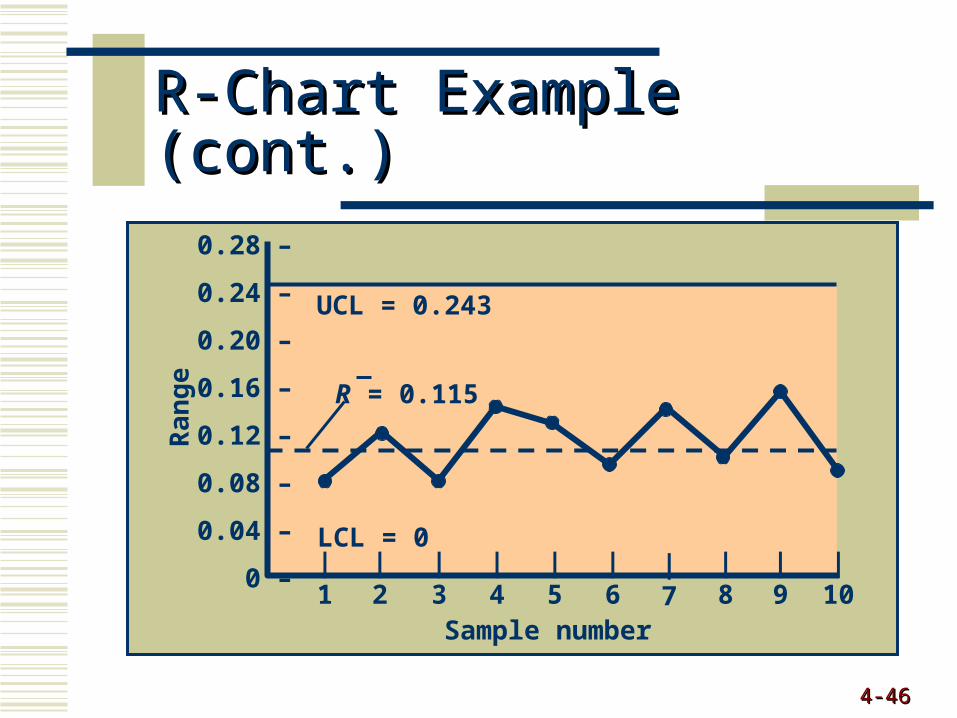
R-Chart Example (cont.)R-Chart Example (cont.)
UCL = 0.243
LCL = 0
Ra
ng
e
Sample number
R = 0.115
|1
|2
|3
|4
|5
|6
|7
|8
|9
|10
0.28 –
0.24 –
0.20 –
0.16 –
0.12 –
0.08 –
0.04 –
0 –
4-4-4747
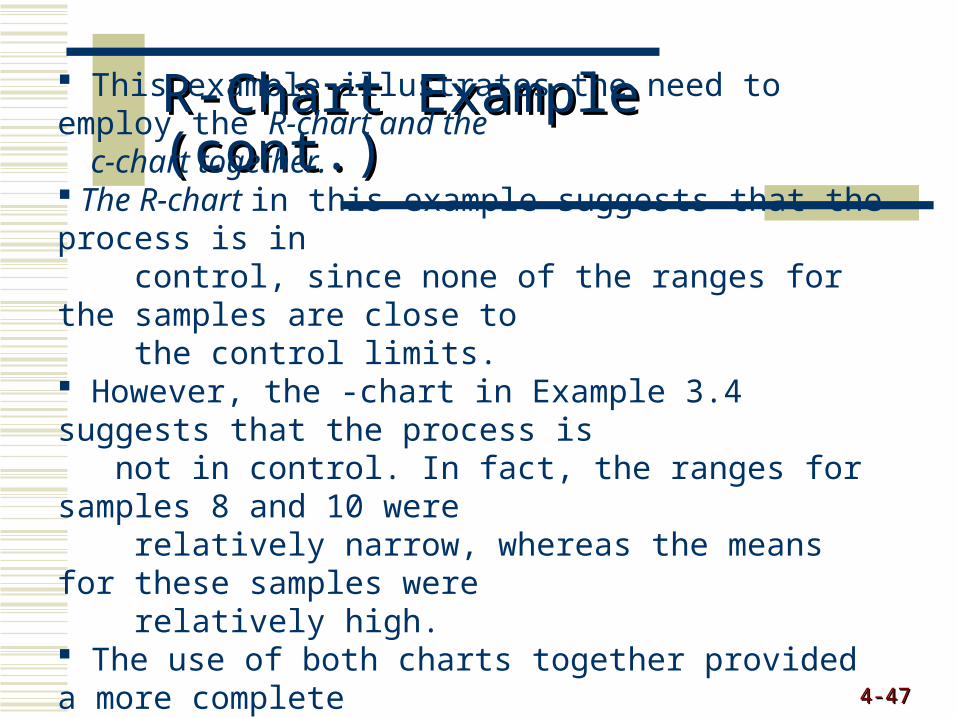
R-Chart Example (cont.)R-Chart Example (cont.)
This example illustrates the need to employ the R-chart and the c-chart together. The R-chart in this example suggests that the process is in control, since none of the ranges for the samples are close to the control limits. However, the -chart in Example 3.4 suggests that the process is not in control. In fact, the ranges for samples 8 and 10 were relatively narrow, whereas the means for these samples were relatively high. The use of both charts together provided a more complete picture of the overall process variability.
4-4-4848
Using x- bar and R-Charts Using x- bar and R-Charts TogetherTogether
Process average and process variability must be in control
It is possible for samples to have very narrow ranges, but their averages is beyond control limits
It is possible for sample averages to be in control, but ranges might be very large
4-4-4949
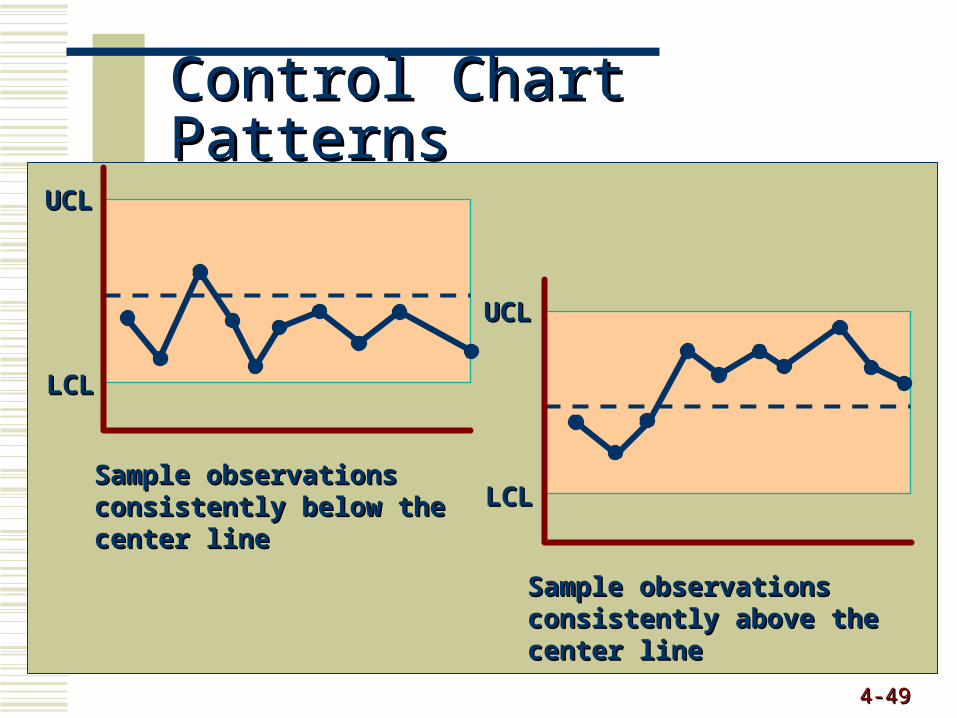
Control Chart PatternsControl Chart Patterns
UCLUCL
LCLLCL
Sample observationsSample observationsconsistently above theconsistently above thecenter linecenter line
LCLLCL
UCLUCL
Sample observationsSample observationsconsistently below theconsistently below thecenter linecenter line
4-4-5050
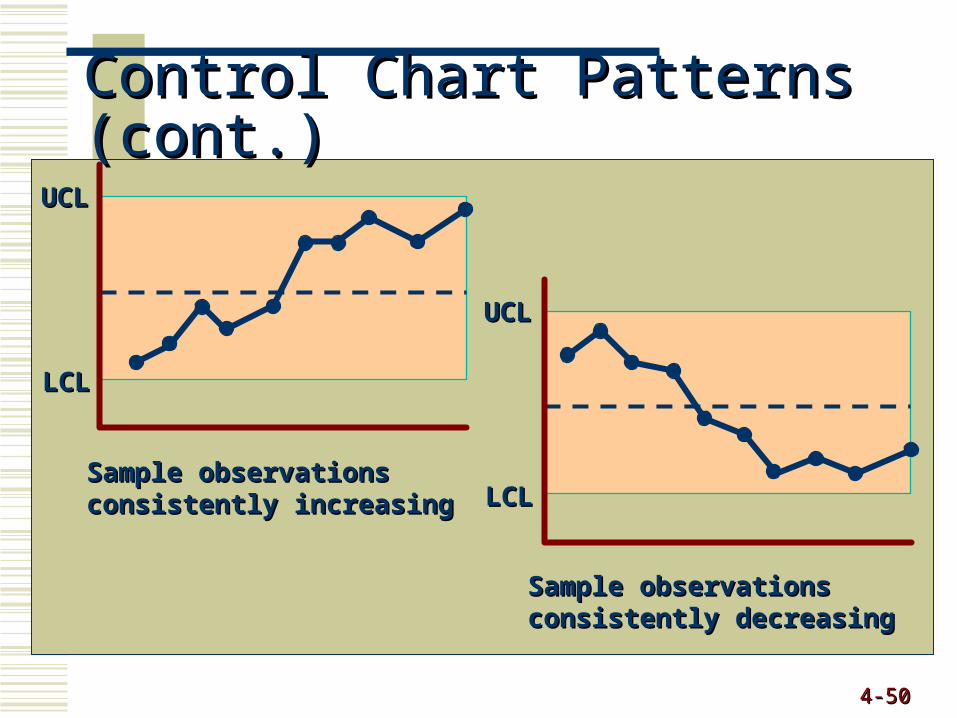
Control Chart Patterns (cont.)Control Chart Patterns (cont.)
LCLLCL
UCLUCL
Sample observationsSample observationsconsistently increasingconsistently increasing
UCLUCL
LCLLCL
Sample observationsSample observationsconsistently decreasingconsistently decreasing
4-4-5151
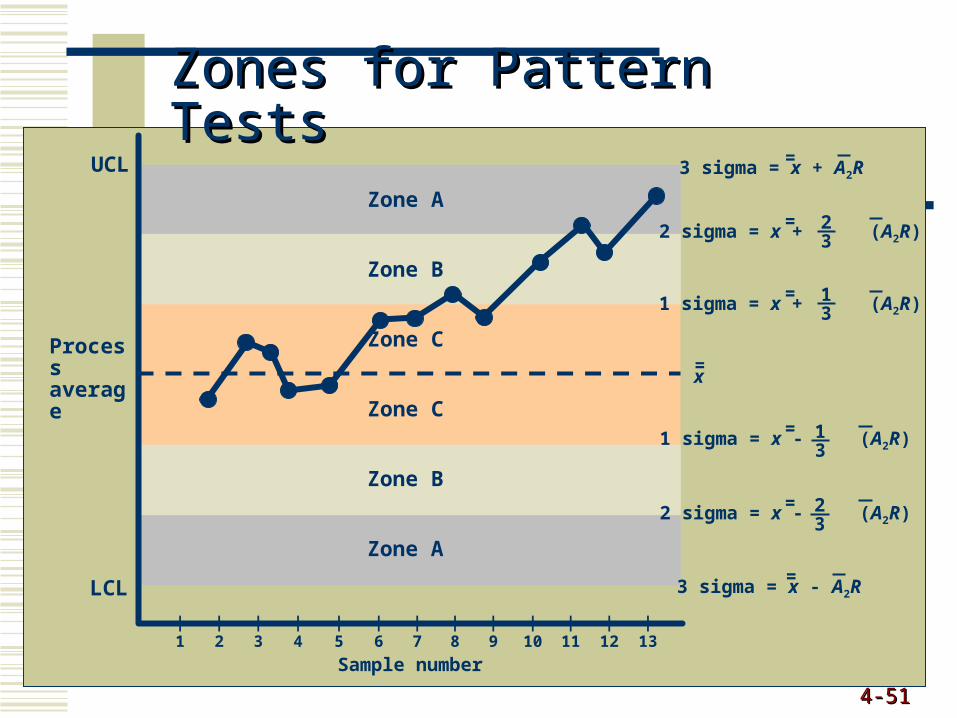
Zones for Pattern TestsZones for Pattern TestsUCL
LCL
Zone A
Zone B
Zone C
Zone C
Zone B
Zone A
Process average
3 sigma = x + A2R=
3 sigma = x - A2R=
2 sigma = x + (A2R)= 23
2 sigma = x - (A2R)= 23
1 sigma = x + (A2R)= 13
1 sigma = x - (A2R)= 13
x=
Sample number
|1
|2
|3
|4
|5
|6
|7
|8
|9
|10
|11
|12
|13
4-4-5252
Control Chart PatternsControl Chart Patterns
8 consecutive points on one side of the center line 8 consecutive points up or down across zones 13 points alternating up or down 2 out of 3 consecutive points in zone A but still
inside the control limits 4 out of 5 consecutive points in zone A or B
4-4-5353
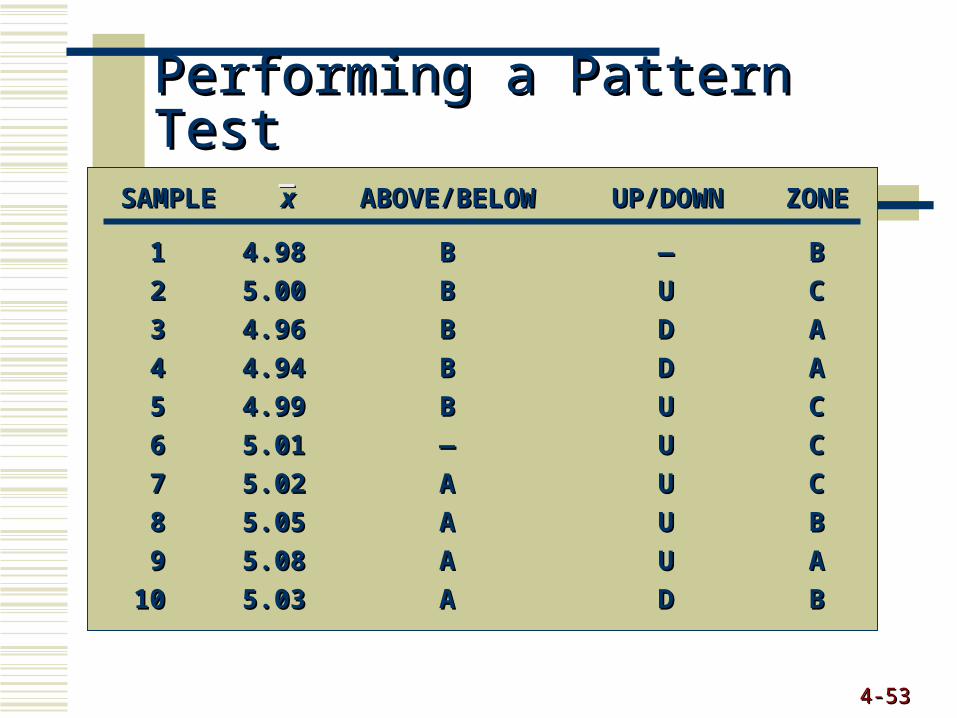
Performing a Pattern TestPerforming a Pattern Test
11 4.984.98 BB —— BB
22 5.005.00 BB UU CC
33 4.964.96 BB DD AA
44 4.944.94 BB DD AA
55 4.994.99 BB UU CC
66 5.015.01 —— UU CC
77 5.025.02 AA UU CC
88 5.055.05 AA UU BB
99 5.085.08 AA UU AA
1010 5.035.03 AA DD BB
SAMPLESAMPLE xx ABOVE/BELOWABOVE/BELOW UP/DOWNUP/DOWN ZONEZONE
4-4-5454
Sample SizeSample Size
Attribute charts require larger sample sizes 50 to 100 parts in a sample
Variable charts require smaller samples 2 to 10 parts in a sample
4-4-5555
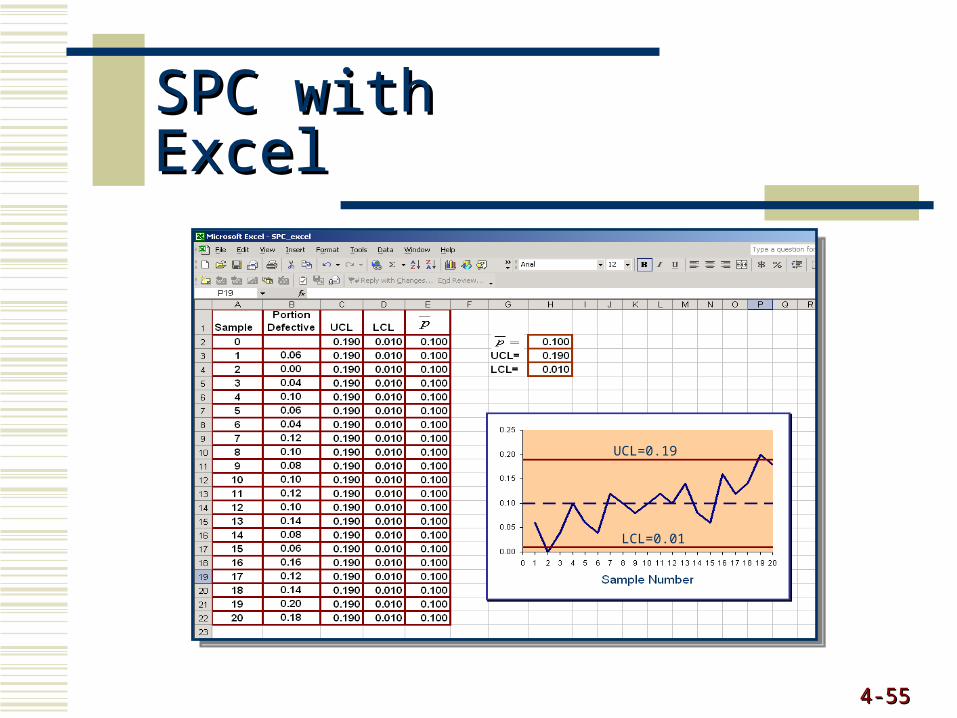
SPC with ExcelSPC with Excel
UCL=0.19
LCL=0.01
4-4-5656
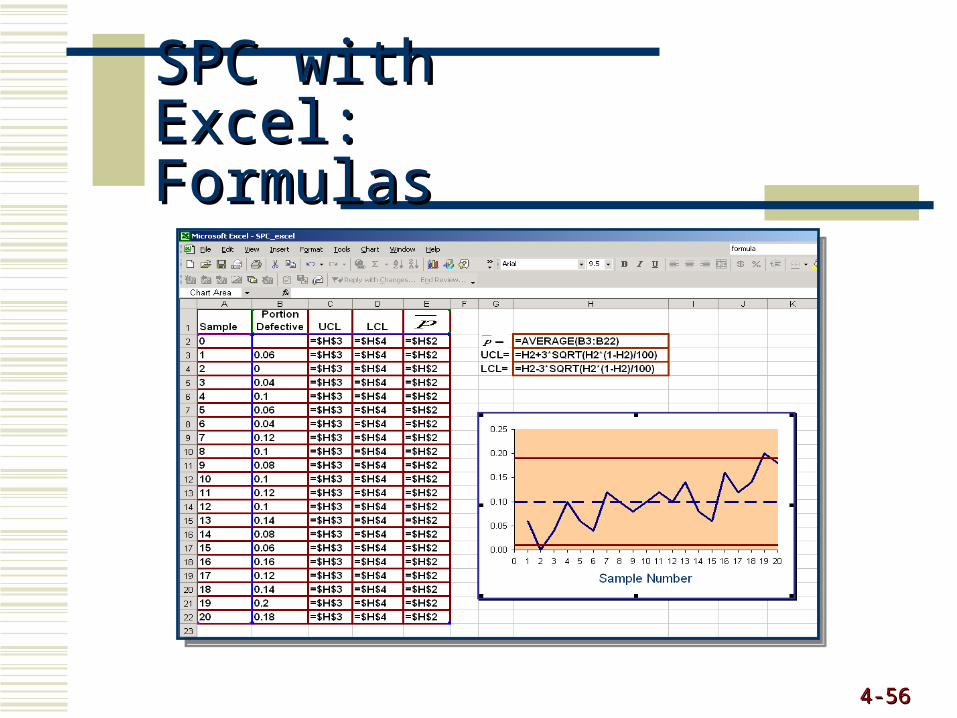
SPC with Excel: SPC with Excel: FormulasFormulas
4-4-5757
Process CapabilityProcess Capability
TolerancesTolerances design specifications reflecting product design specifications reflecting product
requirementsrequirements
Process capabilityProcess capability range of natural variability in a process what range of natural variability in a process what
we measure with control chartswe measure with control charts
4-4-5858
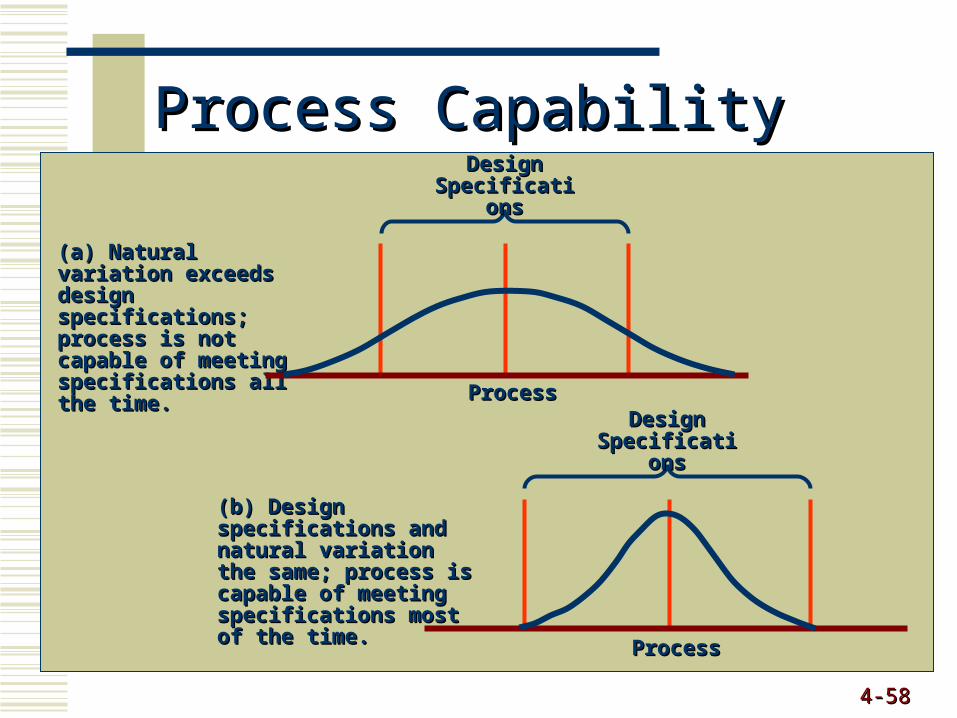
Process CapabilityProcess Capability
(b) Design specifications (b) Design specifications and natural variation the and natural variation the same; process is capable same; process is capable of meeting specifications of meeting specifications most of the time.most of the time.
Design Design SpecificationsSpecifications
ProcessProcess
(a) Natural variation (a) Natural variation exceeds design exceeds design specifications; process specifications; process is not capable of is not capable of meeting specifications meeting specifications all the time.all the time.
Design Design SpecificationsSpecifications
ProcessProcess
4-4-5959
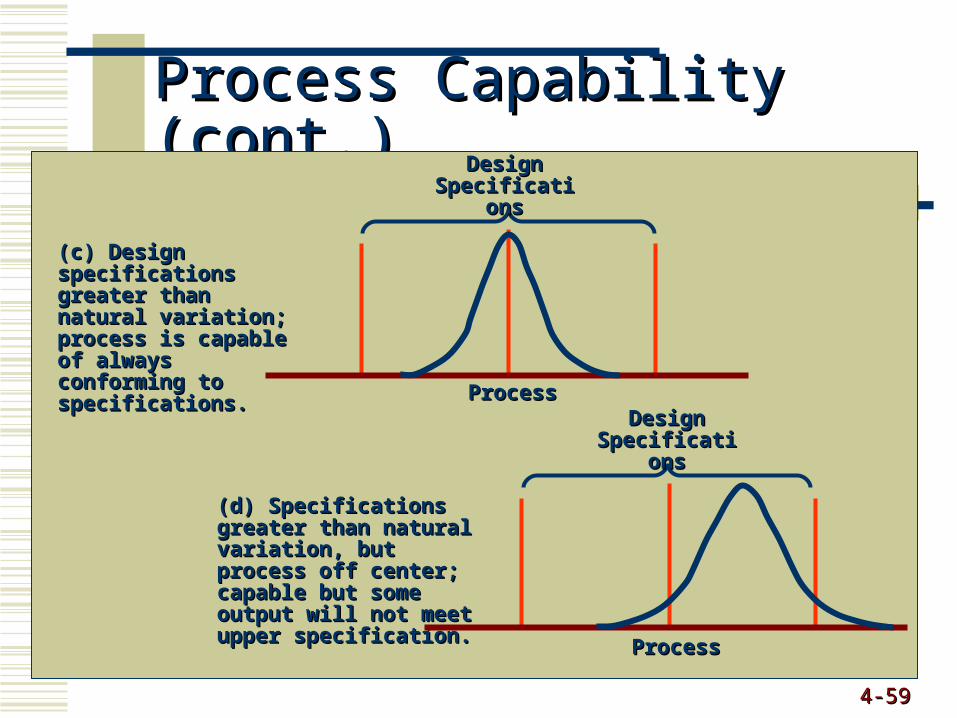
Process Capability (cont.)Process Capability (cont.)
(c) Design specifications (c) Design specifications greater than natural greater than natural variation; process is variation; process is capable of always capable of always conforming to conforming to specifications.specifications.
Design Design SpecificationsSpecifications
ProcessProcess
(d) Specifications greater (d) Specifications greater than natural variation, but than natural variation, but process off center; process off center; capable but some output capable but some output will not meet upper will not meet upper specification.specification.
Design Design SpecificationsSpecifications
ProcessProcess
4-4-6060
Process Capability MeasuresProcess Capability Measures
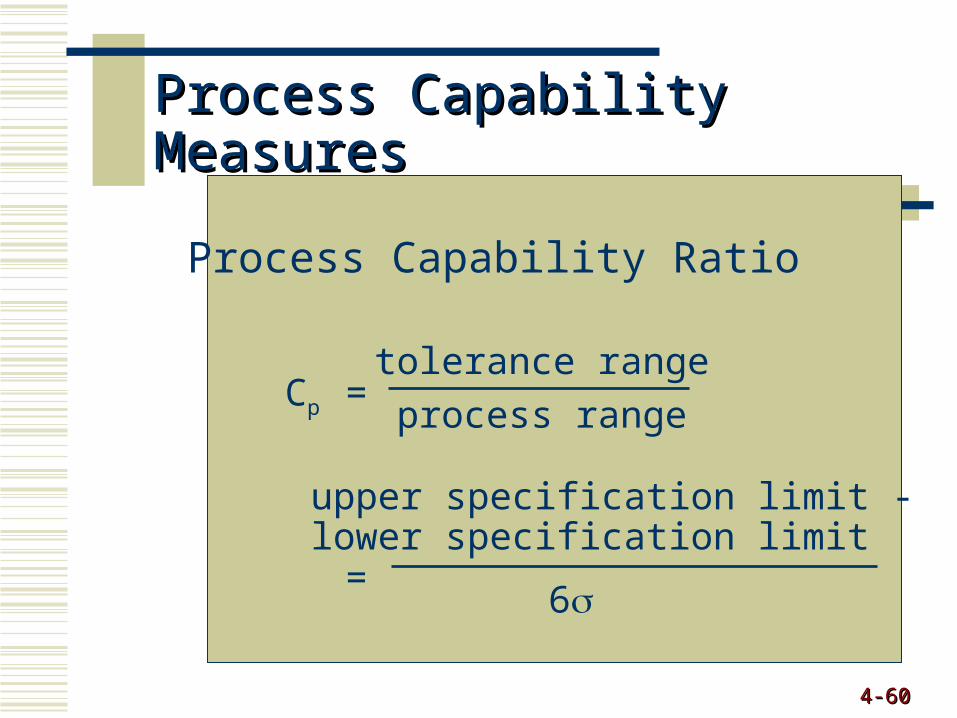
Process Capability Ratio
Cp =
=
tolerance range
process range
upper specification limit - lower specification limit
6
4-4-6161
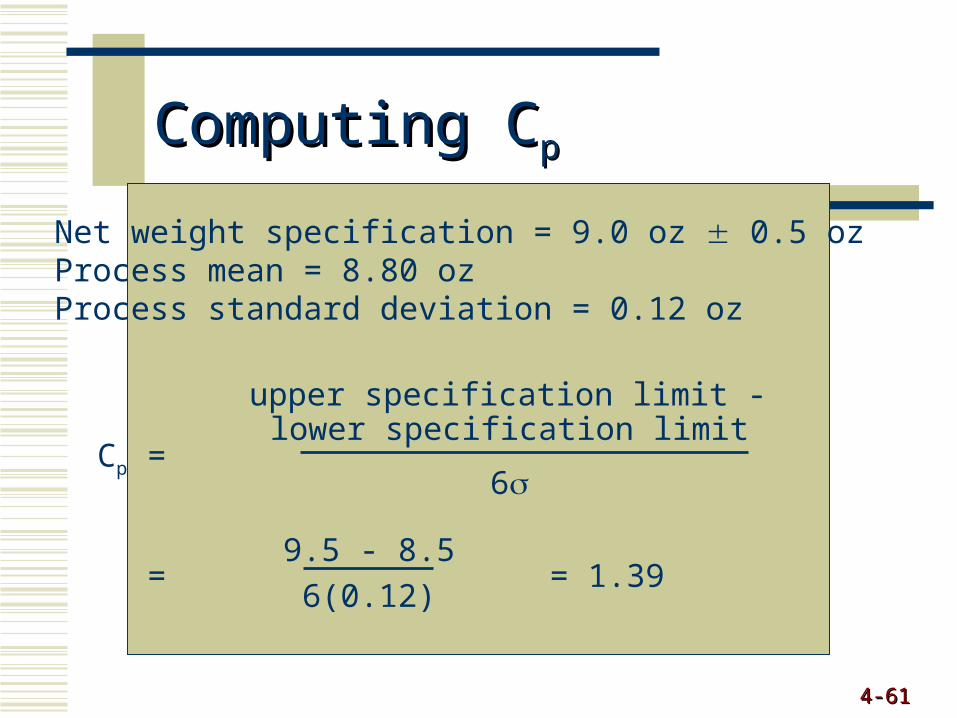
Computing CComputing Cpp
Net weight specification = 9.0 oz 0.5 ozProcess mean = 8.80 ozProcess standard deviation = 0.12 oz
Cp =
= = 1.39
upper specification limit - lower specification limit
6
9.5 - 8.5
6(0.12)
4-4-6262
Process Capability MeasuresProcess Capability Measures
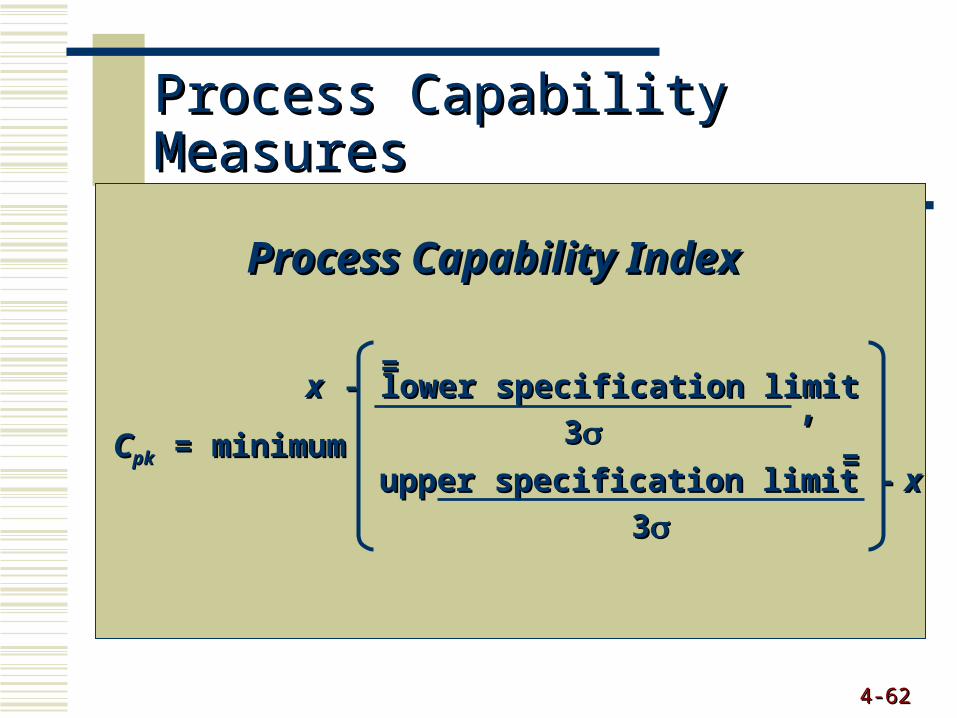
Process Capability IndexProcess Capability Index
CCpkpk = minimum = minimum
xx - lower specification limit - lower specification limit
33
==
upper specification limit -upper specification limit - x x
33
==
,,
4-4-6363
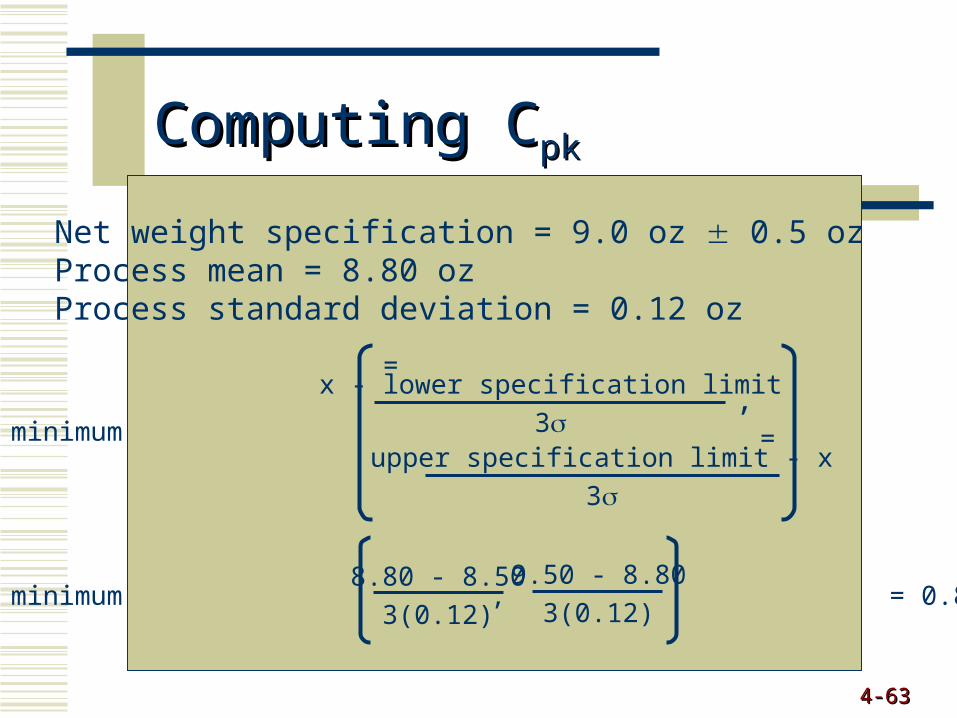
Computing CComputing Cpkpk
Net weight specification = 9.0 oz 0.5 ozProcess mean = 8.80 ozProcess standard deviation = 0.12 oz
Cpk = minimum
= minimum , = 0.83
x - lower specification limit
3
=
upper specification limit - x
3
=
,
8.80 - 8.50
3(0.12)
9.50 - 8.80
3(0.12)
4-4-6464
FactFactorsors
n A2 D3 D4
SAMPLE SIZE FACTOR FOR x-CHART FACTORS FOR R-CHART
2 1.88 0.00 3.273 1.02 0.00 2.574 0.73 0.00 2.285 0.58 0.00 2.116 0.48 0.00 2.007 0.42 0.08 1.928 0.37 0.14 1.869 0.44 0.18 1.82
10 0.11 0.22 1.7811 0.99 0.26 1.7412 0.77 0.28 1.7213 0.55 0.31 1.6914 0.44 0.33 1.6715 0.22 0.35 1.6516 0.11 0.36 1.6417 0.00 0.38 1.6218 0.99 0.39 1.6119 0.99 0.40 1.6120 0.88 0.41 1.59
Appendix: Determining Control Limits for x-bar and R-Charts
Return
Session