Embed Size (px)
Citation preview
MARSHALL ISLANDS FILE TRACKING DOCUMENT
Record Number:
File Name (TITLE):
Document Nu,mber (ID): h / / - / 31
/
Previous Location (FROM): L?/e -
AUTHOR:
Addditional Information:
.F 0 OrMIbox: ,
CyMBox: /z.
WT-1311 (EX) EXTRACTED VERSlOh
OPERATION REDWING
Project 2.2 --L_/ Gamma Exposure Rate Versus Time
Pacific Proving Grounds May - July 1956
Headquarters Field Command Defense Atomic Support Agency Sandia Base, Albuquerque, New Mexico
January 18, 1960
NOTICE
This is an extract of WT-1311, Operation REDWING, Project 2.2, which remains classified SECRET/FORMERLY RESTRICTED DATA as of this date.
Extract version prepared for:
Director
DEFENSE NUCLEAR AGENCY
Washington, D.C. 20305
15 May 1981
,-
I I i L
: ..-. _I _I.Y _
~, c”,\,, y CL*\:11 1c*itci* or THIS I’ALL I?>.” C.,. L” I.,. d, - --- -- --------- .~ -______ _______.-.~__
_. - - REPORT D3CU\!EH-l-A-lIO)-( PAGE
~*~~~T-;tiYrerR .--__ ---..--A 1 COVT *cccs~Iow MC
WT-1311 (EX) - __.c__ -.-_ _li __---____ ,, T,TLE f.-.d Lbflfla)
Operation REDWING - Project 2.2 Gama Exposure Rate Versus Time
~iXiZZ9J
P. Brown G. Carp
8. Markow R. Marmiroli
---
-- ,. ,-ERFORUING ORGANIZATION NAUE *NO ADDRESS
U.S. Army Signal Research and Develop Laboratory Fort Monmouth, New Jersey
-- .__--.-- _..__~.__ ._--- ,_ C~HTROLLIWG OFFICE NAUE AN0 ADDRESS
Headquarters Field Command Defense Atomic Support Agency Sandia Base, Albuquerque, New Mexico
.__ ._._______ .--- -~-___- 6. DISTRIBUTION STATEMENT (or rhl. R.port)
Approved for public release; unlimited distribution.
__-.-- -------- READ IKSTRUCTIONS
tiEFORE CCAIPLE.7 INC FORU ----- .-_- __ 1. RECIPIINT’S CATALOG NUNBLR --
S. TYPE OF REPORT L PERIOD COVERED
-.-- - L. PERFoRuIWC ORG. REPORT HUUBER
WT-1311 (EX) 1. CONT.%ACT OR GRANT NIJMBCR(~J -
-~ -. IO. PROGRAM ELEMENT. PROJECT. TASK
AREA b WORK UNIT NUMBERS
12. REPORT DATE
January 18, 1960 - .__-_ --.- 13. NUMBER OF PAGES
IS. SECURITY CLASS. (of rhl. r.pwfJ
Unclassified ~_~ 15a. OECLASSIFICATION~OO~NGRAOlNG
SCHEDULE
~_ _~______.. ----.- ___._.~~ .- --. -.--~_____._ __ 1. DISTRII~UTION STATEMENT (of Ihe .brtr.cl .r:tr,rd In Dltick 70. II diflcrml lrom R.porr)
~.. . . _..~_ .__ .__ ..___ ___ .._. --- 8. SUPPLCUENTAR’~ HOTES
[his report has had the classified information ren:oved and has been republished in unclassified forin for public release. This work was performed by Kaman Tempo under sontract DNAOOl-79-C-0455 with the close cooperation of the Classification 'lanarJcment Division of the Defense Nuclear Agency.
_~ .~ _.~ - ~- _ 9 r(f_Y vo,‘“S (Conlinu. on ,C\.,)rC .id. ,I,,r<r...v .~>b:dcr;,//y Ly Llock nu:t.r\
Operation REDWING Initial-Gamma Radiation Residual-Gamma Radiation Hydrodynamic Effect
- ----- _-______ _____________ -_.- ------- ---- ------ -- ~. -___- '3D LOITIOW OF 1 HOV LS IS CkSOCLTE
. ._- U'lCLASSIFIED -- _____ .__.. -~__~__.._____--.~-
.
FORERORD
This report has had classified material removed in order to . make the information available on an unclassified, open
publication basis, to any interested parties. This effort to declassify this report has been accomplished specifically to support the Department of Defense Nuclear Test Personnel Review (I;TPR) Program. The objective is to facilitate studies of the low levels of radiation received by scme individuals during the at;;iospheric nuclear test program by r;;cking as much information as pcssible availzble to all interested parties.
The rr:aterial k:hich has been deleted is all currently classified as Restricted Dita or Fcrmerly Restricted Data under the provision .of the Atomic Energy Act of 1354, (as azended) or is I\'ztional Security Inforr7,ation.
This report has been reproduced directly from available ccpies of the original material. The locations from which ;;aterial has been deleted is generally obvious by the spacings 2nd "iloles" in the text. Thus the context of the material deleted is identified to assist the reader in the determination of ;;hether the deleted information is germane to his study.
It is the belief of the individuals klho have participated in pt-c-paring this t-c-port by deleting the c'lassified material end of l_he Defense Kucleur Agency that the report accurately portrays the contents of the original and that the deleted r;,aterial is of little or no significance to studies into the c;sounts or types of radiation received by any individuals curing the atmospheric nuclear test program.
SUMMARY OF SHOT GATA.OF'ERATIOh REDWl!&
c
----5----- I .
u 33 29 56% 21 18
ll 37 2L 162 19 I.3
3.l 37 I+1 162 21 52
ll ?C 3: l62 I.3 01
u /.r 52
165 23 l.3
ll 33 ac 162 21 93
u 37 21 162 19 32
u 32 ka 162 21 39
xl 37 53 16218 o/.
II 40 22 165 4 l3
ll 37 39 162 ie ~9
11 C\ 17 162 li 01
n 39 ba 165 23 u
ll LO 26 l65 20 22
u .G 19 I62 12 09
Atrukll)l cnmc Alruklruu Peter
Aomosn George
Arrtlkan Yoke
Blglren Ibg-er Blklnl Bow
i 6 . I
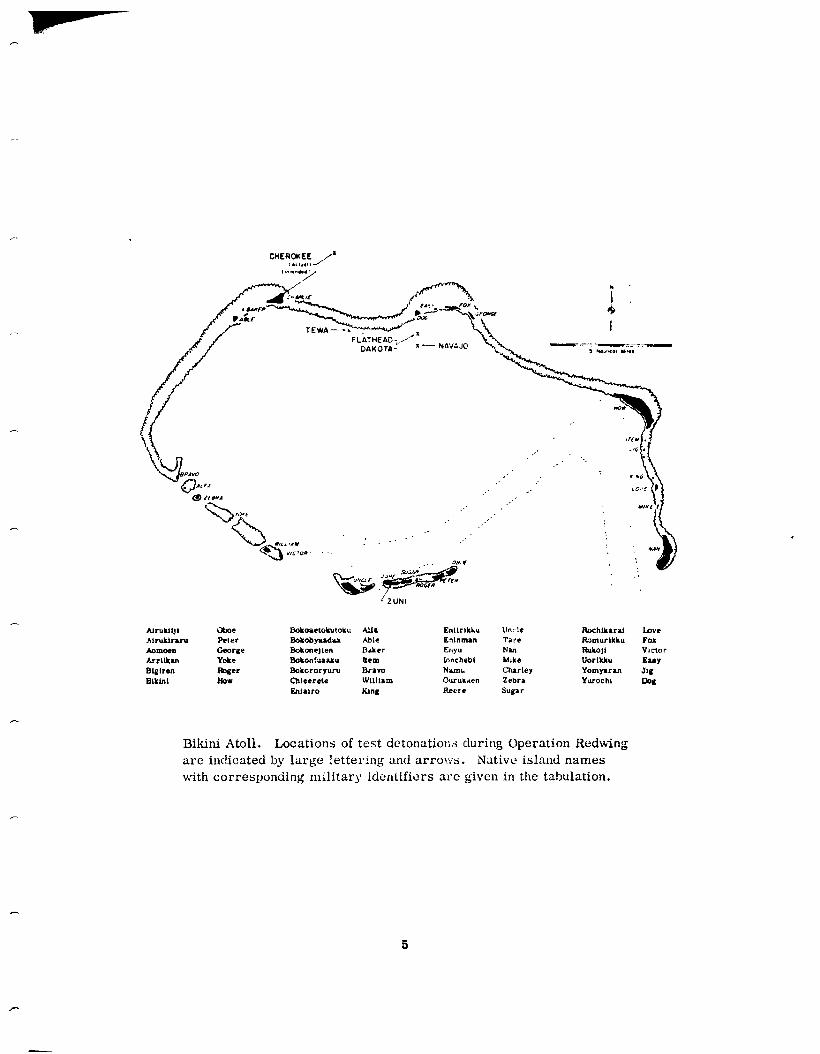
Bikini Atoll. Locations of test dctonatiol- ,.s during Operation Redwing are indicated by large !ettering and arro??:s. Native island names with corresponding military identifizs arc given in the tabulation.
5
KICKAPOO
YUYA
War7 Kat.
Eltwr wllms lrrla
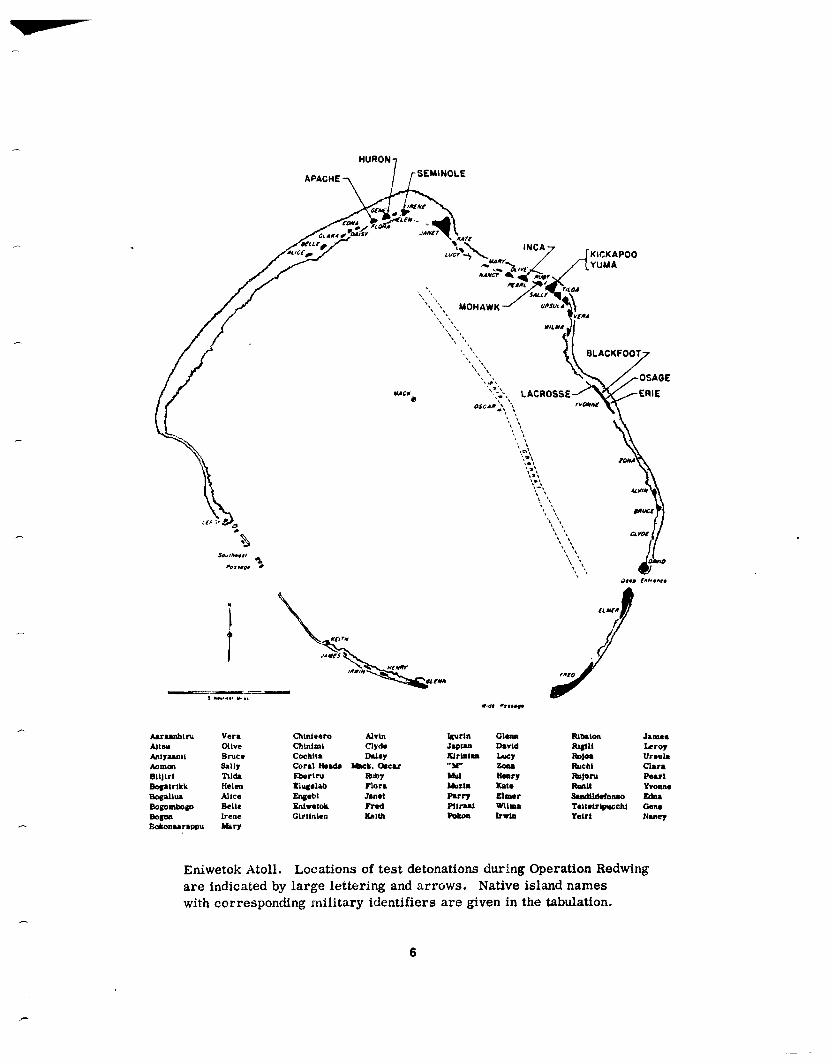
Eniwetok Atoll. Locations of test detonations during Operation Redwing are indicated by large lettering and arrows. Native island names with corresponding military identifiers are given in the tabulation.
6
.-
The primary objective of Project 2.2 was to measure initiai- and residual-gamma- exposure rates as a function of time at various distances from high-yield-thermonuclear detonations. Secondary objectives were to measure the residual gamma-exposure rate at the lip of the crater from a high-yield, land-surface shot; and to field test a protot_ype thermal detector to be used in a radiological-defense-warning system.
The residuul-gamma radiation was detected by an unsaturated-ion chamber, whose output determined the frequency of pulses that v.:ere recorded 011 electro-sensitive paper. Most of the initial-gamma-radiation stations consisted of scintillation detectors whose output determined the frequency of pulses that were recorded on magnetic tape. Some initial-gamma instruments were similar to those used during Operation Castle. The exposure rate near the crater was measured with a detector-telemeter unit dropped from a helicopter.
Residual-gamma-exposure rate versus time was obtained after Shots Zuni, Flathead, Navajo, and Tewa. The observed average-decay exponents for these events were 1.1 for Zuni and Tcwa, 1.2 for Flathead, and 1.3 for PLvajo. In some cases, the effect of rain- fall in leaching the activity dccrensed the exposure rate by a factor of two.
Records from Shot Flathead at 7,730 fecr and from Shot Navajo at 13,870 feet indicated that at these locations about 2/3 of the tot:11 initial-gamma e,xposure was delivered after the arrival of the shock front.
The crater-lip measurements indicated that the method was a feasible one; however, no usable data was obtained.
The thermal-radiation detector res;)on:!ed satisfactority to a detonation at a distance of 20 miles.
This report presents the final results of one of the projects participating in the military- effect programs of Operation Redwing. Overall information about #is and the other military-effect projects can be obtained from WT - 1344, the “Summary Report of the Commander, Task Lnlt 3.” This technical summary includes: (1) tables listing each detonation with its yield, type, environment, meteorological conditions, etc.; (2) maps showing shot locations; (3) discussions of results by programs; (4) summaries of objec- tives, procedures, results, etc., for 311 projects; and (5) a listing of project reports for the military-effect programs.
^
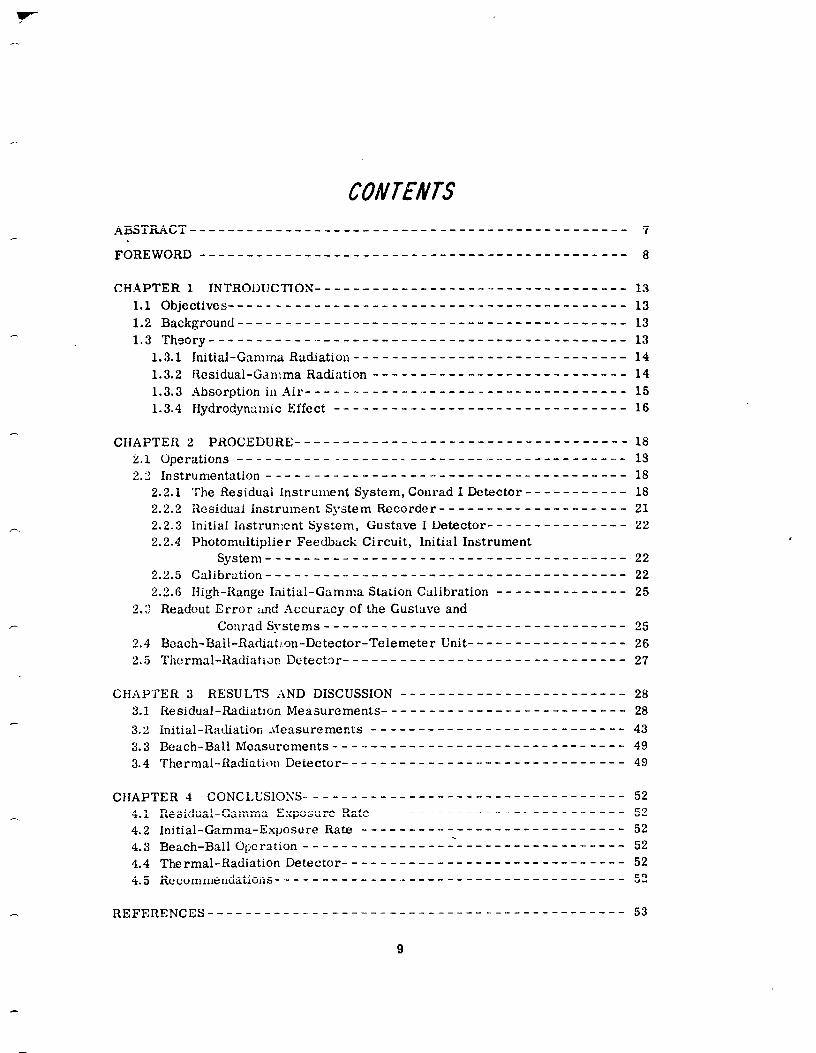
ABST~CT____________________________-__----------_-___ 7
CB_@TER 1 INTRODUC~O~___________ _______.- -______ _______ 13 1.1 Objectives____________________________-----_-_______ 13
1.2 Background_________-_______________________________ 13 1.3 Thsory___________~__________________-___-_________ 13
1.3.1 Initial-Gamma Radiation _ I _ _ _ _ _ _ _ _ _ _ _ _ _ _ _ _ _ _ _ _ _ _ _ _ _ _ _ 14 1.3.2 Residual_Gdn:ma Radiation _ _ _ _ _ _ - _ _ _ _ _ _ _ _ _ _ _ _ _ _ _ _ _ _ _ _ 14 1.3.3 Absorption in _Jir- _ _ _ - _ - _ _ _ _ _.__ _ _ __ _ _ _ __ __ _ __ _ __ _ _ _ 15 1.3.4 Bydrodynynt:mic Effect ___I______ _____________________ 16
CHAPTER 2 PR~~~~~UR~-____~_~-~~-~~~~~~~~~~--~------~~~~ 16 2.1 Operations -___-_-_--_-- _______ _____- _--__ ___________ 16 2.2 Instrumentation -___- ______ _ _______ ___________________ 18
2.::
2.4
2.5
2.2.1 The Residual instrument System, Courad I Detector - - - - - - - - - - - 18 2.2.2 Residual lnstrument System Recorder - - - - - - - - - - - - - - - - - - - - 21 2.2.3 Initial Instrument System, Gustave I Detector- - - - - - - - - - - - - - - 22 2.2.4 Photomultiplier Feedback Circuit, lnitial Instrument
2.2.5 2.2.6
~y~~~~~-~~_____-~__~~_~~_~~~-~~~~--~-~~---~-~ 22
~~~~~~-~~~~~~~~~~~~~~-~~~~~--~~~---~-------------- 22
Righ-Range Initial-Gatnma Station Calibration - - - - - - - - - - - - - - 25 Readout Error tid Accuracy of the Gustave and
ConradSystems _________ _ _____ ________-________ 25
Beach-Ball-Radiation-Detector-Telemeter Unit- - - - - - - - - - - - - - - - - 26 Thermal_RadiatianDctector __-___ -___________________---- 27
CHAPTER 3 RESULTS XND DISCUSSION ------------------------- 28 3.1 Residual-Radiation Measurements- - - - - - - - - - - - - - - - - - - - - - - - - - 28
3.2 Initial-Radiation 9easurements - - - - - - - - - - - - - - - - - - - - - - - - - - - 43 3.3 Beach-Ball Measurements__-____-_- _____ ____-__-_____-__ 49 3.4 Thermal-Raifiatlc,n Detector- - _ - _ _ _ _ _ _ - _ _ _ __ _ _ _ _ _ _ _ _ _ _ _ _ __ _ 49
CHAPTER 4 CONC~,~S1O~S..___-_-__--___-----___---____-____ 52
4.1 Residual-Gamma-Exposure Rate- - - - - - - - - - - - - - - -- - - - - - - - - - - 52 4.2 Initial_Gamma-Exposure Rate ______ ___-_ _____ _____ _______ 52 4.3 Beach-Ball Operation _ _ _ _ _ _ _ _ _ _ _ _ _ _ _ _‘_ _ _ _ _ _ _ _ _ _ _ _ _ _ _ _ _ _ 52
4.4 Thermal-RadiationDetector_----__ ____ __- ________ ________ 52 4.5 Recommendations ---_______ ___.________________________ 52
R~~E~~N~~S__-__---_____---_-_-------_--__----_--_--_-- 53
9
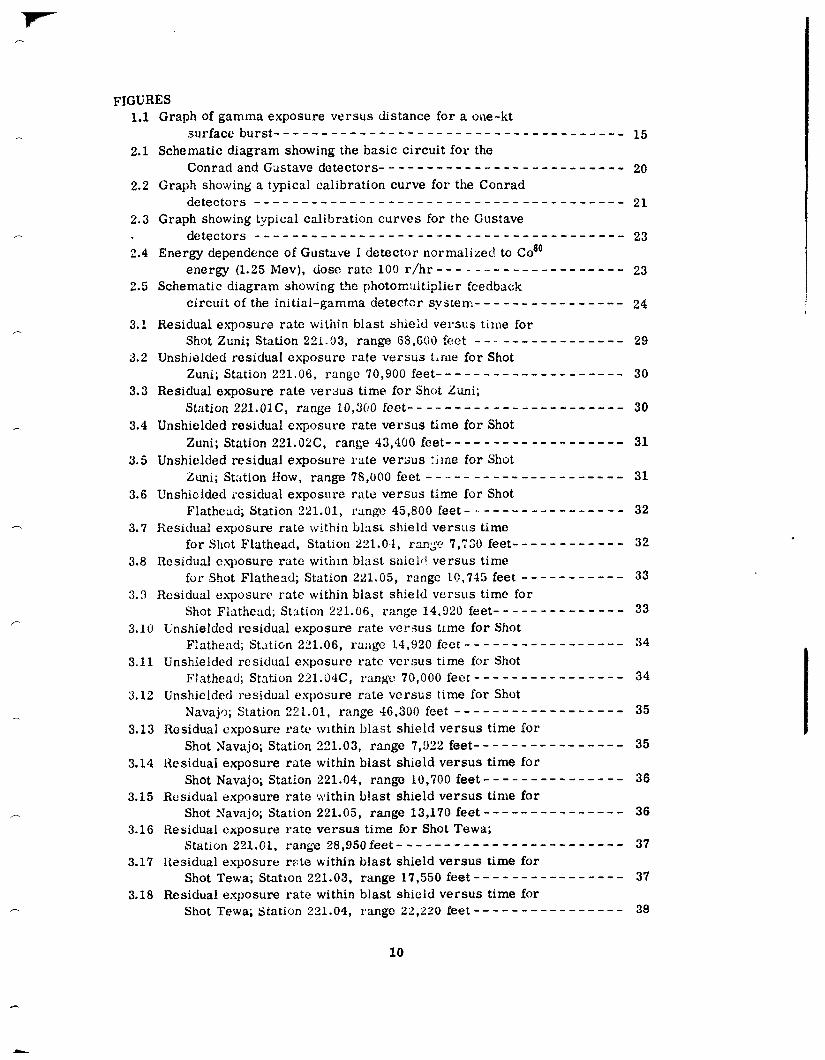
FIGURES 1.1 Graph of gamma exposure versus distance for a one-kt
surfaceburst_----_---------_--___________________ 15
2.1 Schematic diagram showing the basic circuit for the Conrad and Gustave detectors-------------------------- 20
2.2 Graph showing a typica! calibration curve for the Conrad detectors __ ____ __ __-_-- ---_ ____ _________________ 21
2.3 Graph showing typical calibration curves for the Gustave detectors __________-____-- ______ ________________ 23
2.4 Energy dependence of Gustave I detector normalized to Co6’ energy (1.25 Mev), dose rate 100 r/hr - - - - - .- - - - - - - - - - -- - - - 23
2.5 Schematic diagram showing the photomuitiplier feedback circuit of the initial-gamma detector system- - - - - - - - - - - - - - - - 24
3.1 Residual exT0sm.e rate within blast shield versus time for Shot Zuni; Station 22L.03, range 68,GOO feet __.. _____________ 29
3.2 Unshielded residua1 esposure rate versus t&me for Shot Zuni; Station 221.06, range 70,900 feet- - - - - - - - - - - - - - - - - - - - 30
3.3 Residual exposure rate versus time for Shot Euni; Station 221.01C, range 10,300 feet----------------------- 30
3.4 Unshielded residual e?cposure rate versus time for Shot Zuni; Station 22l.O2C, range 43,400 feet- - - - - - - - - - - - - - - - - - - 31
3.5 Unshielded residual exposure rate versus rime for Shot Zuni; Stlltion How, range 78,OOO feet --------------------- 31
3.6 Unshielded residual exposure rate versus time for Shot Flathead; Station 321.01, r~ngc 45,800 feet - - - - - - - - - - - - - - - - - 32
3.7 Residual exposure rate within bl:ist shield versus time for Shot Fiathead, Station Z21.0.4, range 7,730 feet- - - - - - - - - - - - 32
3.8 Residual c.xposure rate within blast sniclf! versus time for Shot Flathead; Station 2X1.05, range IO,735 feet - - - - - - - - - - - 33
XI) Residual exposure rate within blast shield versus time for Shot Flathead; Station 221.06, range 14.920 feet- - - - - - - - - - - - - - 33
3.10 Unshielded residual exposure rate versus time for Shot Flathead; SLition 221.06, rang0 14,920 feet - - - - - - - - - - - - - - - - - 34
3.11 Unshielded residual exposure rate versus time for Shot Flathead; Station 22l.O4C, range 70,000 feot - - - - - - - - - - - - - - - - 34
3.12 Unshielded residual exposure rate versus time for Shot Navajo; Station 221.01, range 46,300 feet - - - - - - - - - - - - - - - - - - 35
3.13 Residual exposure rate within blast shield versus time for Shot Navajo; Station 221.03, range 7,O22 feet- - - - - - -- - -- - - - - - 35
3.14 Residual exposure rate within blast shield versus time for Shot Navajo; Station 221.04, range 10,700 feet - - - - - - - - - - - - - - - 36
3.15 Residual exposure rate within blast shield versus time for Shot Navajo; Station 221.05, range 13,170 feet - - - - - - - - - - - - - - - 36
3.16 Hesidual exposure rate versus time for Shot Tewa; Station 221.O1, range 28,95Ofeet------------------------ 37
3.1’7 Residual exposure r’sic within blast shield versus time for Shot Tewa; Station 221.03. range 17,550 feet - - - - - - - - - - - - - - - - 37
3.18 Residual exposure rate within blast shield versus time for Shot Tewa; Station 221.04, range 22,220 feet - - - - - - - - - - - - - - - - 39
10
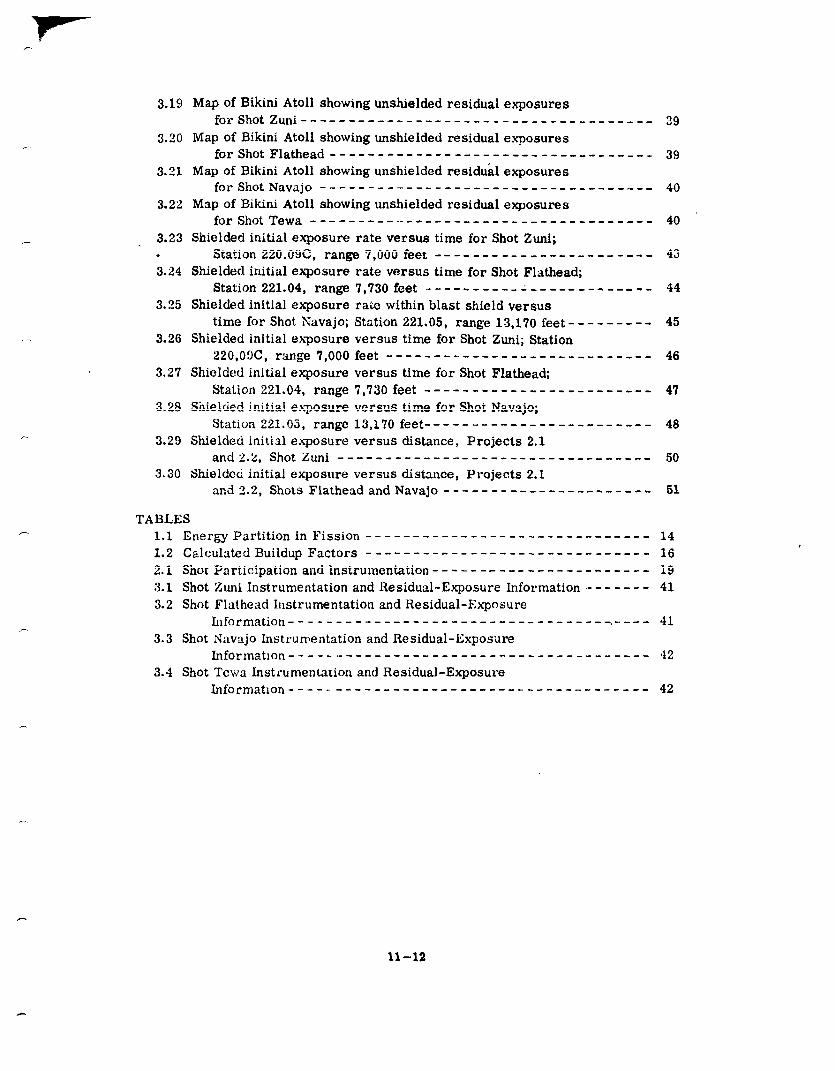
3.19 Map of Bikini Atoll showing unshielded residual exposures forShotZuni---_----------- _____ _____ ____ ________
3.20 Map of Bikini Atoll showing unshielded residual elcposures for Shot Fla~ead~-_-------~~--~_~~~~~_-~___~______
3.21 Map of Bikini Atoll showing unshielded residual exposures forShotNax,rajo -___---- -____ ___________________.___
3.22 Nlap of Bikini Atoll showing unshielded residual exposures forShotTewa --___--_--__ ____ ____________________
3.23 Shielded initial exposure rate versus time for Shot Zuni; . . Station 220.096, range 7,000 feet ----------------------- 3.24 Shielded initial exposure rate versus time for Shot Flathead;
Station 221.04, range 7,730 feet -------,-_~,---,,--,-,--
3.25 Shielded initial exposure rate within blast shield versus time for Shot Navajo; Station 221.05, range 13,170 feet - - - - - - - - -
3.26 Shielded initial exposure versus time for Shot Zuni; Station 220,03C, rage 7,000 feet ----------__-_-_--_-_----_--
3.27 Shielded initial exposure versus time for Shot Flathead; Station 221.04, range 7,730 feet - - - - - - - - - - - - - - - - - - - - - - - -
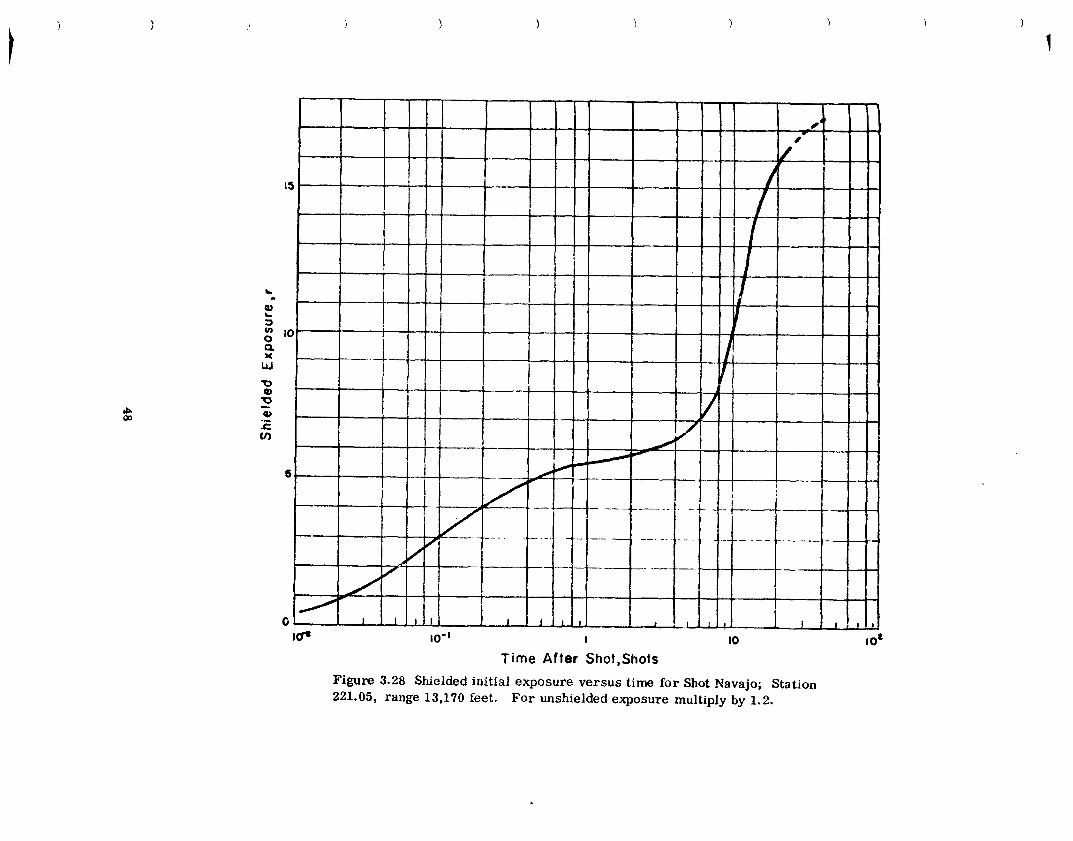
3.28 Shielcied jnitial exposure versus time for Shot Navajo; Station221.05, range 13,r7Ofeet----__-----_--_-_-__-_-_
3.29 Shielded initial exposure versus distance, Projects 2.1 and 2.2, Shot Zuni ____________________~~~~~~~~~~~~~
3.30 Shield& initial exposure versus distance, Projects 2.1 and3.2, Shots FlatheadandNavajo----------------------
39
39
40
40
43
44
45
46
47
48
50
51
TABLES 1.1 Energy Partition in Fission -____-_---___--_~_~_~~~~~~~~~~ 14 1.2 CalculatedBuildup Factors -__-----_------_-__-_---_----- 16
2.1 Shot Particfpation and Instrumentation - - - - - - - - - - - - - - - - - - - - - - - 19 3.1 Shot Zuni Instrumentation and Residual-Exposure Information - - - - - - - 41 3.2 Shot Flathead Instrumentation and Residual-Exposure
~~~ormat~~n_--~--~--~~~--~----------~-----~~~-~~~ 41
3.3 Shot Navajo Instrumentation and Residual-Exposure ~for~~at~~n_~-~~~~-~~~---~~-----~---~----~----~~~ 42
3.4 Shot Tcwa Instrumentation and Residual-Exposure Information_---_-- __________ -_____ ____ - _____ -____ 42
11-12
Chapter /
INTRODIICTION
1.1 OBJECTIVES
The primary objectives of Project 2.2 \:‘cre: (1) to measure the initial-gamma-exposure rate as a function of time from the detonation of high-yield-thermonuclear devices; and (2) to measure the residual-gamma-exposure rate 2s a ftmction of time at :and fallout stations. Secondary objectives were: (1) to measure residual radiation at early times on the crater lip of a high-yield, land-surface shot; and (2) to field test a prototype thermal- radiation detector to be used in a radiological-defense-warning system.
1.2 BACKGROUND
LOS Alamos Scientific Laboratory (LXX) measured initial-gamma-exposure rate versus time for high-yield devices durmg Operation Ivy (Reference 1). It was found that high-yield devices did not follo\i the relatively simple scaling laws of low-yield devices. Gamma radiation at a particular distance scales linearly with yield for devices up to about 100 kt. For megaton-range devices, gamma radiation scales higher with in-
creasing yield. This enhancement of initial-g:mima radiation was attributed largely to the hydrodynamic effect (Section 1.3.4). U. S. Army Signal Research and Development Laboratory (USASRDL) obtained several gamma-exposure-rate-versus-time data points from high-yield devices durin, e Operation Castle (Reference 2). The data obtained by USASRDL were lower by a factor of 10 or more than the Super-Effects Handbook predic- tions (Reference 3).
One of the purposes of Project 2.2 was to resolve the initial-gamma-radiation-scaling laws for high-yield devices. Of pnrticular intcrcst was a high-yie!d air burst, since it would allow correlation of the hydrodynamic effect from an airburst with that from a surface burst. IYSASRDL made measurements of residual-gamma-e.xposure rates from high-yield devices during Operation CXZIC (Reference 2 ). Only bmited data were obtained because of a high loss of instruments early in the oiJc!ration. These data indicated that the decay exponent for the residual activity varied with the type of nuclear device. Another purpose of Project 2.2 was to determine accurate decay exponents for residual activity.
The thermal-rac!iation detector, part of an early-warning system for nuc!ear detona- tions, was ,ested :vith !ov.-yield devices during Operation Teapot (Reference 4). The tests were successful. The detector showed a capability far in excess of the requirements. it was decided to determine the response of this detector to megaton-range devices during Operation Redwing in order to complete the testing.
1.3 THEORY
The gamma radiation emitted from a nuclear cictonation may be divided into two por-
tions: Initial radiation and residual radiation. The residual radiation may include radi- ation from both fallout and neutron-induced activity.
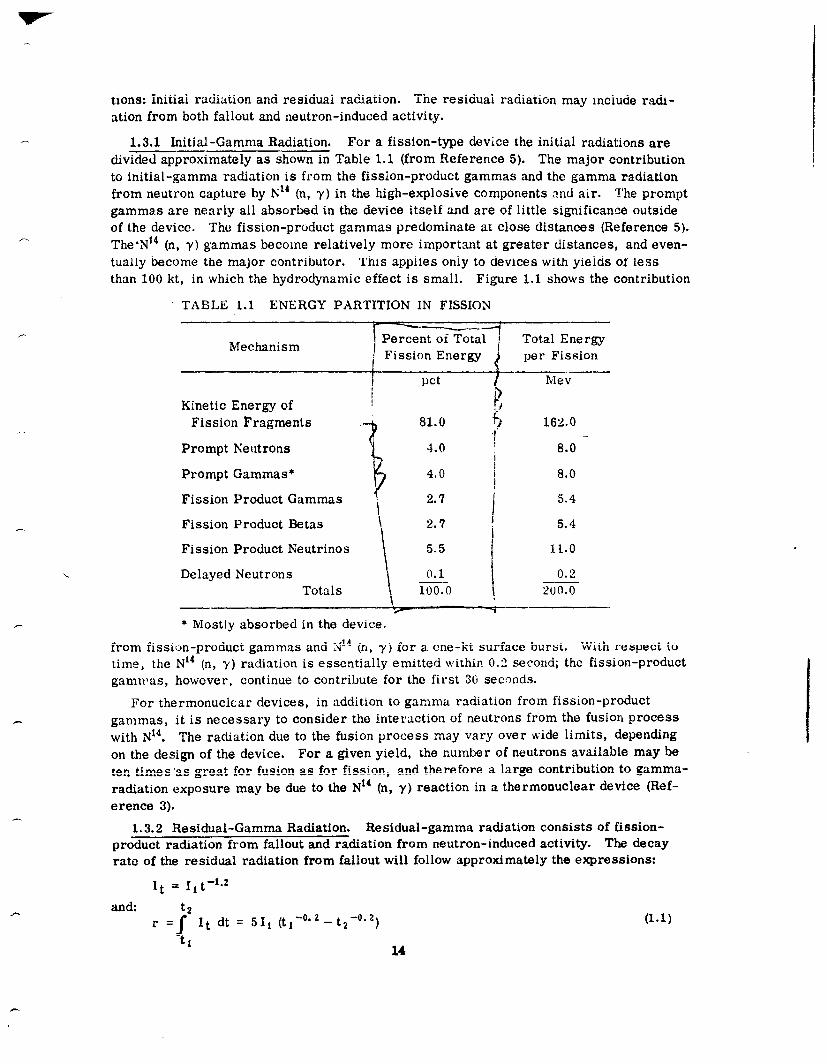
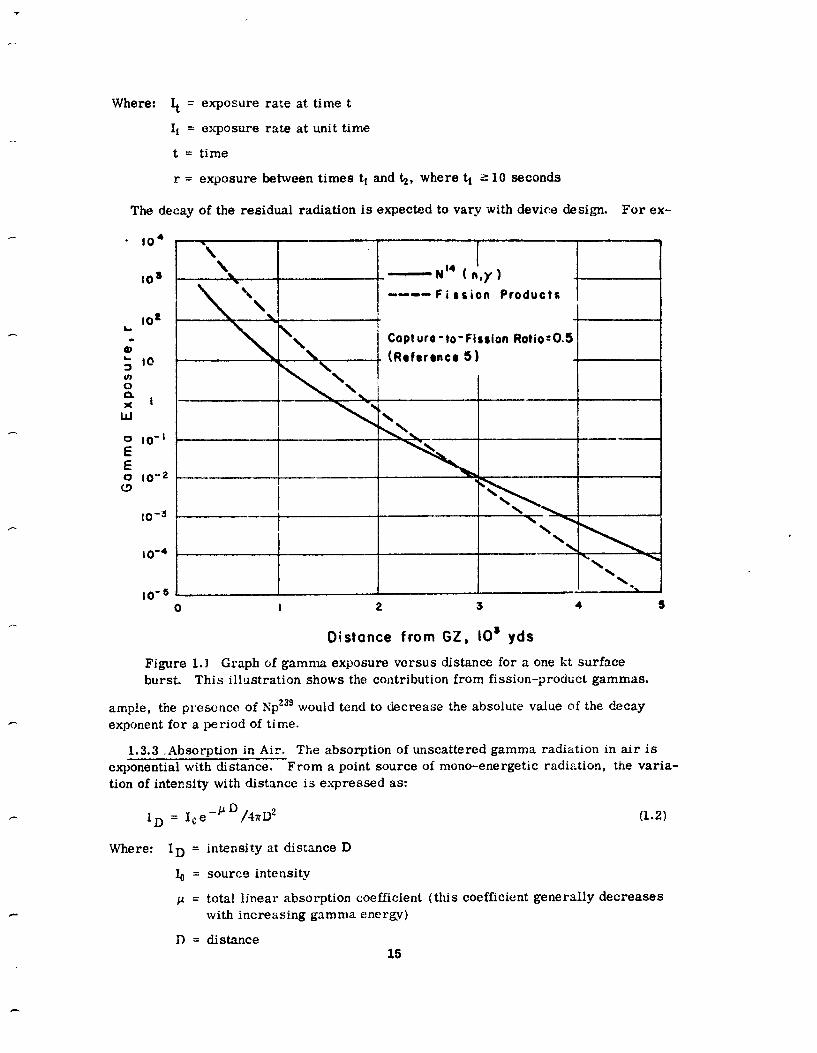
1.3.1 Initial-Gamma Radiation. For a fission-type device the initial radiations are divided approximately as shown in Table 1.1 (from Reference 5). The major contribution to initial-gamma radiation is from the fission-product gammas and the gamma radiation from neutron capture by &la (n, y) in the high-explosive components nnd air. The prompt gammas are nearly all absorbed in the device itself and are of little significance outside of the device. The fission-product gammas predominate at close distances (Reference 5). The*N” (n, y) gammas become relatively more important at greater distances, and even- tually become the major contributor. This applies only to devices with yields of less than 100 kt, in which the hydrodynamic effect is small. Figure 1.1 shows the contribution
TABLE 1.1 ENERGY PARTITION IN FISSION -_
---
Mechanism nt oi Totaq Total Energy
Fission Energy per Fission
1 pet
Kinetic Energy of 1 k
-- Mev
Fission Fragments .
Prompt Neutrons
5
81.0 rp 162.0
4.0 I
8.0 ~_
Prompt Gammas* 4.0 t
8.0
Fission Product Gammas
Fission Product Betas
Fission Product Neutrinos
z::: j :::
5.5 1
11.0
Delayed Neutrons 0.1 I
0.2 ~- -- Totals 100.0 ! 2UO.O
* Mostly absorbed in the device.
from fission-product gammas and Xl4 (n, y) for a cne-kt surface burst. With respect to time, the N’* (n, y) radiation is essentially emitted within 0.2 second; the fission-product gammas, however, continue to contribute for the first 36 secnnds.
For thermonuclear devices, in addition to gamma radiation from fission-product gammas, it is necessary to consider the interaction of neutrons from the fusion process with N14. The radiation due to the fusion process may vary over Kide limits, depending
on the design of the device. For a given yield, the number of neutrons available may be
ten times’as great for fusion as for fission, and therefore a large contribution to gamma- radiation exposure may be due to the N14 (n, y) reaction in a thermonuclear device (Ref- erence 3).
1.3.2 Residual-Gamma Radiation. Residual-gamma radiation consists of fission- product radiation from fallout and radiation from neutron-induced activity. The decay
rate of the residual radiation from fallout will follow approximately the expressions:
It = 11t-‘-2
and: t2
r = /
It dt = 511 (t,-0’2-t~-o~2) (1.1)
t1 14
Where: It = exposure rate at time t
I1 = exposure rate at unit time
t = time
r = exposure between times tl and b, where ti ;r 10 seconds
The decay of the residual radiation is expected to vary with device design. For ex-
Copture-to-Fission Roti0:O.S
. (Reference 5)
10-S - ! r\
_-
\
- 454
\ 10-d
'. '.
10-5 0 I 2 3 4 5
Oistonce from GZ, IO’ yds
Figure 1.1 Graph of gamma exposure versus distance for a one kt surface burst. This illustration shows the contribution from fission-product gammas.
ample, the prescnco of N,:P~~’ would tend to decrease the absolute value of the decay exponent for a period of time.
1.3.3 .Absorption in Air. The absorption of unscattered gamma radiation in air is exponential with distance. From a point source of mono-energetic radiation, the varia- tion of intecsity with distance is eqressed as:
ID = IceBPD/4rrD2 (1.2)
Where: ID =
IO=
cr=
D=
intensity at distance D
source intensity
total linear absorption coefficient (this coefficient generally decreases with increasing gamma entrgv)
distance 15

The absorption coefficient p in Equation 1.2 is applicable for narrow-beam geometry, and a correction shoult! be made for field conditions where the detector is approximately a 2~ sensing element. This is done by adding a buildup factor B to Equation 1.2 to ac- count for the scattered radiation that will be detected. Buildup factors for different energies and distances have been calculated (Reference 6), and some values are shown in Table 1.2. For omnidirectional detectors, the expression is:
ID = I0 BeaD/4aD2 (1.3)
1.3.4 Hydrodynamic Effect. As shown in Section 1.3.3, the attenuation of gamma radiation is highly dependent on the amount of absorber between the source and the de- tector. For devices of less than lOO-kt yield, essentially all of the initial-gamma radia- tion is emitted before the shock front can produce an appreciable change in the effective
TABLE 1.2 CALCULATED BUILDUP FACTORS
The buildup factor (B) given here is the factor B, &D, E,,) as computed by Nuclear Development Associates for AFSWP (Reference 6).
Energy CEO) B
1,000 1.500 3,000
Mev Yds yds yds
1 16.2 29.3 85.0
3 3.85 5.35 10.2
4 2.97 4.00 7.00
10 1.70 2.01 2.90
absorption of the air between source and detector. For high-yield devices, the velocity of the shock front is sufficiently high to produce a strong enhancement of a large per- centage of the initial-gamma radiation (Reference 7). The higher the yield, the larger is this percentage. A simplified treatment of the hydrodynamic effect follows.
Assume a sphere that has a volume V. and radius R. and is filled with a gas of density p. and mass M. Then,
M = v, p. = 4aR3 PO/~ (1.4)
Let the gas be compressed into a shell with thickness AR (R remaining constant). The new gas volume is expressed as Vr (Vi = 4nR2 AR) with a density of ~1. The mass has not changed; thus,
M= VOPO ; 4rR*nRp, (AR <<R)
4nR3po/3 & 4aR2 ARp, (1.5)
16
(1.6)
Equation 1.6 indicates that a ray originating in the center of the sphere would traverse only l/s of the mass in the shell model that it would in the homogeneous model. The re- sult would be an enhancement of radiation. Once the shell of material in the shock front passes the detector, an even greater enhancement results.
As previously stated, the N” (n, Y) component of initial radiation is essentially emit- ted within 0.2 second. Since it takes at least one second for the shock front to reach a detector at a distance of 7,000 feet (even for devices in the order of 6 Mt), the N” (n, y) component is not significantly enhances. The fission-product gammas contmue to con- tribute during the first 30 seconds; therefore, this radiation is strongly enhanced by the shock wave.
17
Chapter 2
?/?ocEW?E
2.1 OPERATIOXS
Table 2.1 lists shot participation and instrumentation. The instrument stations were placed in previously prepared positions at the latest practicnble time prior to each shot and were recoverd postshot as soon as Had-Safe LonAtions permitted. The residual stations were activated ui,On placement. Their 5-day ouerating period aliowod for 2 days of data-recorcl;11& and three l-day shot delays. For the surface bursts, the initial statlons were activated by a minus-l-mi;lute-timing signal for warmup, and a minus- 15-second sig:lnl to start the recorder. Shot Zuni was an esception; only a minus-l- second signal was :;vaiI,lble to start the recorder. Timing signals were necessary on the initial stations beI:ause of the limited recording time available (Cook Research Laboratory MR 33 recorders, 4 minutes; Sanborn recorders, 15 minutes). For Shot Cherokee, the recorders were noL started until after the device release.
2.2 INSTRUMESTATION
In designing Ir-~s~ri~lnentation for this project, there were two objectives: (1) to design instrumen:s to best fuifill the requiremcntu; and ‘2) LO design flexible instruments read- ily ad:lpt:lble to L wide vzriety ibf field IiieasUrenl~!nt:~. In view of this dusl objective, the instruments ~vt?re designed to be compact, drift-free, reliable, wide in dynamic-range coverage, and io\v in cost. The basic circuit evolved mensured di!;creLe increments of
charge. Essentially, this circuit could be used with any sensing element that had an out- put which was ;1 known function oi the radiation field. Thus, the circuit was equally applicable to icon Thambers, scintillation detectors, or photo-conductive crystals.
In operat!on, the charge on Ci (Figure 2.1) held tube T, well beyond cutoff. The output current of the sensing elemcM discharged C1 at a rate dependent upon the radiation level. When the volt:lgc at the grid of T, reached the grid base, T1 conducted, fed a negative sig- nal to the grid cf T,, a11cl initintcd a re;zcncratlvc action :vhlch rapidly cut aff Tz. Then C1 charged to a potcntlal equal to B-plus+ less the cathode volkge and the grid-to-cathode drop through the diode action of the grid of T1. When C, it’,ls completely charged, the circuit returned to its normal condition of Tz conducting 2n.i Tt cutoff. The circuit remained in this condition until Ci was once more discharged by the output of the sensing element. The output of this circuit consisted of pulses that had a repetition rate propor- tional to the outpur current of the sensing elcmcnt.
2.2.1 The Residual Instrument System, Conrad I Detector. In general, decay of the --- gamma-exposure rate from Miout contamination is given by:
I = I, t-X (2.1)
Where: I = the gamma-exposure rate at time t
I, = the gamma-exposure rate at unit time
x = the decay constant (given as 1.2 for gross fission products)
18
-
TABLE 2.1 SHOT PARTRXPATK3)J AN0 INSTRUMENTATION
Shot station
Number Locar1m Ranga from Ground Zero bwtrument3Uun
n
Chrolu. 121.01 221.02 221.03 221.04
221.06
29,400 Ip, Is. R 20.694 Ip, 18. R 16,370 R 20.062 R 24,922 R
221.06
220.01c
220.01c
221.020
POrtablO
?Oo;
G8orp
YOb NiUl
30,207
86,432
76,310
83,120 -
Zunl 221.oa
221.06
220.01c 220.06C 220.09c
Dg 000r#W Unck ame Roger
Peter W1111am Yoke
Alla HOW
Love
N&Ill
66,600 R 70.90Q R 10.300 R 16,270 1~. R
1,000 1~. Ig, R
226.14C 221.01c
221.02c 221.04 Portable
Portable Portable
11.270 R 10,320 R 43,400 R 56.570 R 7R,OOO R 72,000 R 69,000 11
Flatbead 221.01 Able 46.8on R
221.03 &I 4,432 lp. lg. R 221.04 Easy 7,730 Ip, lg. II 221.05 Fox to,745 II,. R 221.06 Gorge 14.920 H
220.06C ch-e 59.RRJ R 22o.rl9c Roger 63,165 II
220.14c Pele I 62,344 11
221.n1c 'Al!llrm 40,907 R 221.0x Yoko 9,068 R
221.OQC
Portable Portable
Porlable
Alh HOW
Love
Nan
7O.000
60,000 75,000
85,000
R I1
Ii H
Nava]o 221.01 Able 48.000 Ii 221.03 %J 7.922 IP, lg. R 221.04 Eaey lO.?OO 1% R 221.05 Fox 13.170 lg. R 221.06 Guorge lG.180 II?* R
22o.oec Oboe 66.341 R
22O.OlC Uncle 5R,?R2 a
221.OlC Wllll.~m 36,006 H
221.02c Yoke 15,582 R
Portable HOW 66,000 R
Portnblc love 72.000 R
Portnblc Nnn R.l.don R
Tcwa 221.01 Able “4,Q50 R
221.03 Doll 17,550 IP, lg. R 221.04 r.;,tly 12,200 R
221.05 Fox ‘4.711 R
220.06C oboe 54.266 R -- MM2 5.960 II
221.OlC W1111am 51.179 R 221.02C Yoke 37.631 R Port&c How 70,000 It
-
19
hleasurements of the decay constant require good (short) time resolution at eariy
times (t small, I large) when the changes in gamma-exposure rate are most rapid. At
later times it large, I small), the rate of change of the gamma-exposure rate of the gamma radiation is much smaller, and the instrument system need not have such good
time resolution. The instrument for the measurement of residual-gamma radiation was
designed to cover a range from 1 r/hr with a time resolution of 5 minutes, to 104 r/hr with a time reSOiUtiOn Of 0.05 minutes. The basic circuit is shown In Figure 2.1, where
-~
l- + - T-
I I- _____ -_---_I
I
i --T-- ;\-----------l
/ 0 u T ~-..a____._. i I I r- 15 v
I
I ?
22 K i i .__J-__.-._.__
22’/, v
22&v
Figure 2.1 Schematic diagram showir?g the basic circuit for the Conrad and Gustave detectors. The Conrad detector used an unsattirated ion chamber as the sensing element, whereas the Gustave detector used 8 scintl!lation detector.
the sensing element is an unsaturated ion chamber. The ion chamber was designed to have a current output proportional to the square root of the gamma-exposure rate. The overall detector response is given by:
f = krq2 (2.2)
Where: f = the output frequency
r = the gamma-exposure rate in r/hr
k = a parameter chosen to meet specific design objectives
In laboratory calibrations on a 250-kv X-ray beam, these detectors showed a preci-
20
sion of better than two percent, including drift effects, over a three-week period. The completed detector head, including ion chamber and electronics, was encapsulated in Hysol 6020 casting resin. A t,ypical calibration curve for these detectors is given in Figure 2.2.
2.2.2 Residual Instrument System Recorder. The two-channel recorder used with this system consisted of an Esterline-Angus-chart drive to supply the time base and
IO l $ , 0 = 7 February
0 = 8 February
A = 21 February
Frequency, pulselmin Figure 2.2 Graph showing a typical calibration curve for the Conrad detectors. These detectors were calibrated with the l00-curie CO” source and the 250-kv X-ray gen- erator.
tivo electric styluses writin, a on Teledeltos paper charts. The output from the detector head was fed through an amplifier directly to Stylus NO. 1, which produced a mark for each detector-output pulse. In addition, the detector output was fed to a scale-of-11 counter, thence to Stylus No. 2. Thus, Stylus No. 2 produced one mark for each 11 out- put pulses from the detector. In this manner, a chart speed slow enough for the required five-day operating period could be used while maintaing resolution of the fast,est antic- ipated pulse-repetition rate. In operation, the record from Stylus No. 1 was used until
21
the pulse-repetition rate was so great that the recorded marks overlapped and could not be resolved. At that time, Stylus No. 2 would be used, with each mark representing 11 pulses from the detector head. The chart drive that supplied the time base was calibrated with a Watchmaster before each event. By means of the Watchmaster, the chart drive could be set to have a maximum error of 1 minute in 24 hours, or ho.069
percent. This was not the optimum recording system for use with this detector but rather a compromise forced by a lack of funds and time.
2.2.3 Initial Instrument Sysmrn, Gustave I Detector. For the high-range, fast- _-- r&solution detector, the basic czcuit of Figure 2.1 was used with a scintillation detector as the sensing element. The latter consisted of an RCA 929 phototube and a National Radian Scintillon Branch plastic phosphor mounted in an electron-equilibrium thickness of bakelite to provide an air-equivalent res:)onae (Reference 8). The purpose of the electron-equilibrium layer was to present a source of electrons that might be #scattered into the crystal to replace those electrons produced by radiation absorbed near the crys- tal surfaces and lost without being detected. These detectors were constructed to cover three ranges: 10’ to lo6 r/hr, lo3 to 10’ r/hr, and lo4 to lo* r/hr.
The overall detector response is given approximately by:
f = kr (2.3)
Where: f = the pulse repetition rate
r = the gamma-exposure rate in r//hi
k = a parameter chosen to meet specific design objectives
The maximum pulse-repetition rate of these instruments was 1,000 pulses/set, the maximum rate that could be resolved by the recorder (a Cook Research Laboratory MR-33 eight-channel magnetic-tape recordor). Typical calibrations for these detectors are shown in Figure 2.3. Figure 2.4 shows the energy dependence of the Scintillon- phosphor Gustave I detector, relative to Co6’ gamma radiation at a rate of 100 r/hr. To reduce the errors due to flutter and wow, a 1,000-cycle-time base was recorded on the tape simultaneously with the gamma-exposure-rate dam. An American Time Prod- ucts transistorized-frequency :,!:andard with an accuracy of f 0.02 percent was used to provide the time base.
2.2.4 Photomultiplier Feedback Circuit, Initial Instrument System. This system was -- essentially the same as that used during Operation Castle (Rzerence 2). The detecting element, a Scintillon phosphor 2.75 inches in diameter by 0.5 inch m height mounted in a bakelite block for electron cquilibri!tm, was placed inside a blast-resistant housing at the top of a light pipe. The output of the crystal after passing through the light pipe was detected by-an RCA 6199 photomultiplier tube. The photomultiplier tube was used in a lOO-percent-feedback circuit which held the photo-multiplier-tube-anode current nearly constant, regardless of the incident light flux, by reducing the dynode voltage (Figure 2.5). The gain of a photomultiplier tube with constant anode current was approx- imately proportional to the antilog of the dynode voltage. In this manner, a useful dynamic range of about a factor of 10’ was realized.
2.2.5 Calibration. Three raldiation sources (a 250-kv X-ray generator, a 2.5-Mev Van de Graaff generator, and a ,200 curie Co6’ source) were used in the calibration of
22
c
; 0.6
Q
.1 0.4
0 0 = 0.2
Gamma Exposure Ratr,r/hr
Fqure 2.3 Graph showing typical calibration curves for the Gustave detectors. These detectors were calibrated with the 250&v X-ray generator and the 2.5Mev Van de Graaff generator.
I
-_
C
IO IO'
Energy, kev
Figure 2.4 Energy dependence of Gustave I detector normalized to Co@ energy (1.25 Mev). dose rate 100 r/hr.
2s
.-
the Project 2.2 instruments. The Conrad detectors were calibrated with the 200~curie Co”’ source and the 2504~ X-ray generator. The initial-gamma instruments. the Gustaves and the photomultiplier feedback-circuit detectors, were calibrated with the 250-kv X-ray and the 2.5-Mev Van de Graaff generator.
The 250-kv X-ray machine was operated at an applied potential of 250 kv, and lo-ma current. The X-ray beam was hardened with 1 mm of cadmium filtration to give an effective energy of 190 kev. The instrument response to this beam was the same as For Co6’, since the instrument response was fiat to below 1% !iev. The maximum
IM
IM
IM
IM
IM
IM
IM
IM
2.2 M
I 1001
5.7 M
5.7 M
5.7 NI
c .5.7 M
82K
00.1 MA
-
‘Phosphor
Figure 2.5 Schematic diagram showing the photomultiplier feedback circuit of the initial-gamma detector system.
usable-exposure rate attainable ,with this X-ray generator (consistent with good geom- etry) was 6,400 r/hr.
The Van de Graaff generator was operated at 1.0, 1.5, and 2.0 Mev, resulting in a maximum rate of 10’ r/hr.
The 200-curie field calibrator was specifically designed for operation under EPG weather conditions. The main components were the source container and the control trailer. The source container was made of stainless steel and the plug-and-rise-tube assembly of Monel metal. The source, inclosed in a double-walled Monel capsule, was raised and lowered pneumatically and was supported by three spring-loaded pins, one of which actuated a microswitch to indicate when the source was up.
The Coso was in pellet form and filled a space 0.39 inch in diameter and 1.58 inches in length. The Monel metal shielding (capsules and rise tube) was 0.33 inch. The
24
.
I
c
P
source was calibrated in the field over the exposure-rate region used with a set of Victoreen r-meters calibrated at National Bureau of Standards (NBS) in March 1956.
2.2.6 High-Range Initial-Gamma Station Calibration. There were no sources avail- able for direct gamma-radiation calibration up to the maximum ranges of the initial- gamma instruments. Because of this lack, scintillation detectors were used, thereby enabling calibration with a light source. In practice, the instruments were directly cal- ibrated by the use of the 200-curie Cod0 source in the field and a Van de Graaff generator in the laboratory to the limit of the available radiation rates. The calibration was then extended to the maximum range through the use of a light calibration, which was normal- ized to the radiation calibratio:n.
The light calibrator consisted of a light source filtered to provide a beam having approximately the same spectral quality as the light output of the scintillator, and a series of neutral-density filters that varied the light output in known discrete steps. Errors due to the direct response of the circuit elements to gamma radiation were in- troduced into the calibration; however, these errors were shown to be small in the ranges where the light and radiation calibrations overlapped. There were no reasons why the relative error should have increased beyond the range of dual calibration.
2.3 READOUT ERROR AND ACCURACY OF THE GUSTAVE AND CONRAiD SYSTEMS
In general, the output of the Gustave and Conrad detectors may be given as:
r = kt” (2.4)
Where: r = gamma exposure rate
t = time between output pulses
n, k = design parameters
If the error in reading time between pulses (i. e. time base) is At, then:
r + Ar = k (t + At)”
Ar = k C (t + At)” - tn
1
Ar -= (t + At)” - tn. r
t”
At For t << 1, this formula reduces to the definition of differentials.
Ar . n4t - =- r t
(2.5)
(2.6)
Where: Ar - = the relative error in gamma-exposure rate due to errors in the time r
measurement
At - = the relative time-measurement error t
25
For the Conrad I detector, n = -2, and:
c1’ = - . -2At
r t (2.7)
.-
In practice, at high-pulse-repetition rates, a number of pulses N over a period ‘I’
were used to read out the data. Hence, from equation 2.5:
Ar . (Nt + At)” - (Nt!” -- 5. - r
i xtp
Ar . (T + At)“ - (T)” -=- - r .n 1
. nAt = .-_ r
(2.8)
M!here: At now includes all errors in reading the time interval T.
The time-base error for the Conrad recorders was f 0.069 percent; therefore, the
readout error was negligible, and the errors of the Conrad I system (of the order of
10 percent) could be attributed to the detector itself.
For the Gustave I system, n A -1, and:
Ar . -AtI -- =- r T (2.9)
Hence the Gustave I: system error was essentially that of the detector (the time-base
error f 0.02 percent), and was of the order of 10 percent.
2.4 BEACH-BALL-RADIATION-DETECTOR-TELEMETER UNIT
To attain the objective of measuring the residual-exposure rate on the crater of a land-surface burst, a droppable radiation-detector-telemeter unit was devised. A
Gustave I detector system was connected to key a ‘h-watt VHF tra.nsm&er that had
been constructed in the field. The detector and transmitter were mounted in a poly- ethylene bottle suspended at the center of an air-inflated, 5-foot, plastic beach ball. The beach ball was attached to a 27-pound lead brick by means of a 6-foot line. This made it possible to drop the system from a helicopter mar= accurately with a minimum of impact shock to the instrumentation. The lead brick hit the ground first snd allowed the beach ball to slow down over the 6-foot distance before hitting the ground. In ad- dition, the beach ball itself acted as a good impact absorber. Once the beach ball was released. the helicopter could go a short distance away and orbit in a radiologically safe region, while receiving the data transmitted from the beach-ball unit.
26
2.5 THERMAL-RADIATION DETECTOR
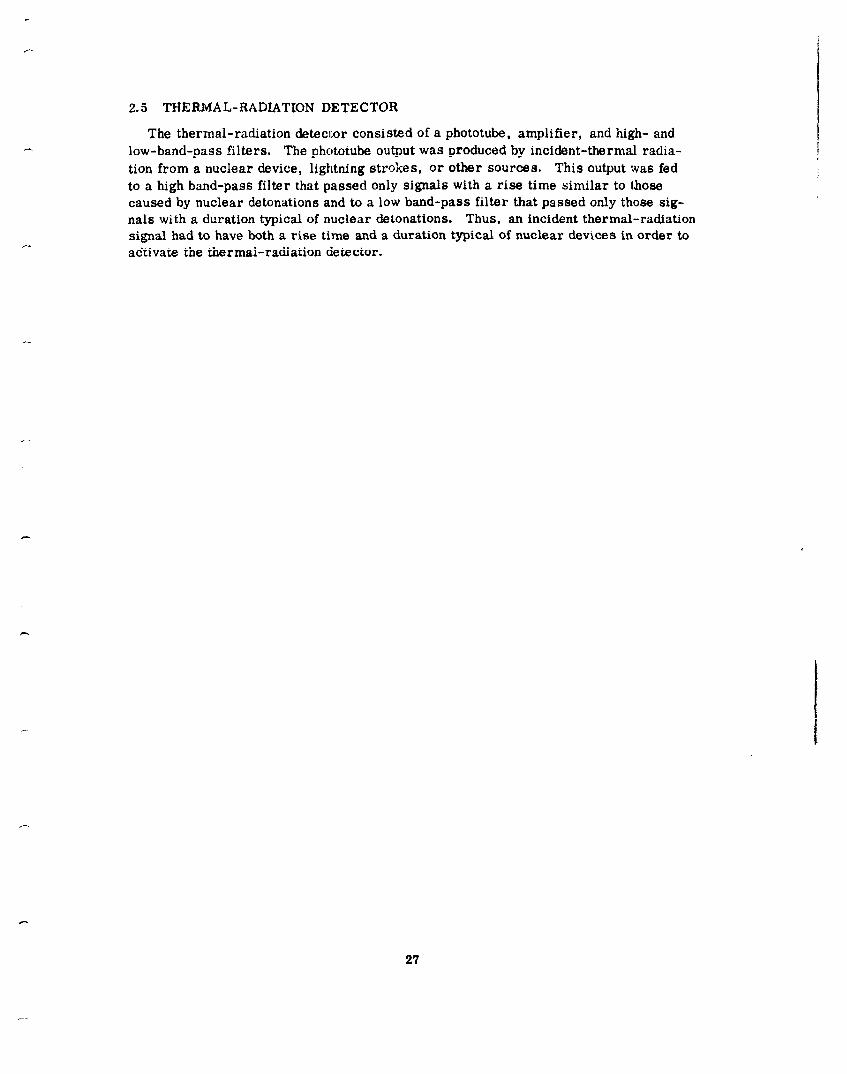
The thermal-radiation detector consisted of a phototube, amplifier, and high- and low-band-pass filters. The phototube output was produced by incident-thermal radia- tion from a nuclear device, lightning strokes, or other sources. This output was fed to a high band-pass filter that passed only signals with a rise time similar to those caused by nuclear detonations and to a low band-pass filter that passed only those sig- nals with a duration typical of nuclear detonations. Thus. an incident thermal-radiation signal had to have both a rise time and a duration typical of nuclear devices in order to activate the thermal-radiation cietector.
27

Chupfer 3
RESUaL 7-s and Dmuss~ON
3.1 RESIDUAL-RADIATION XLEXSUREMESTS
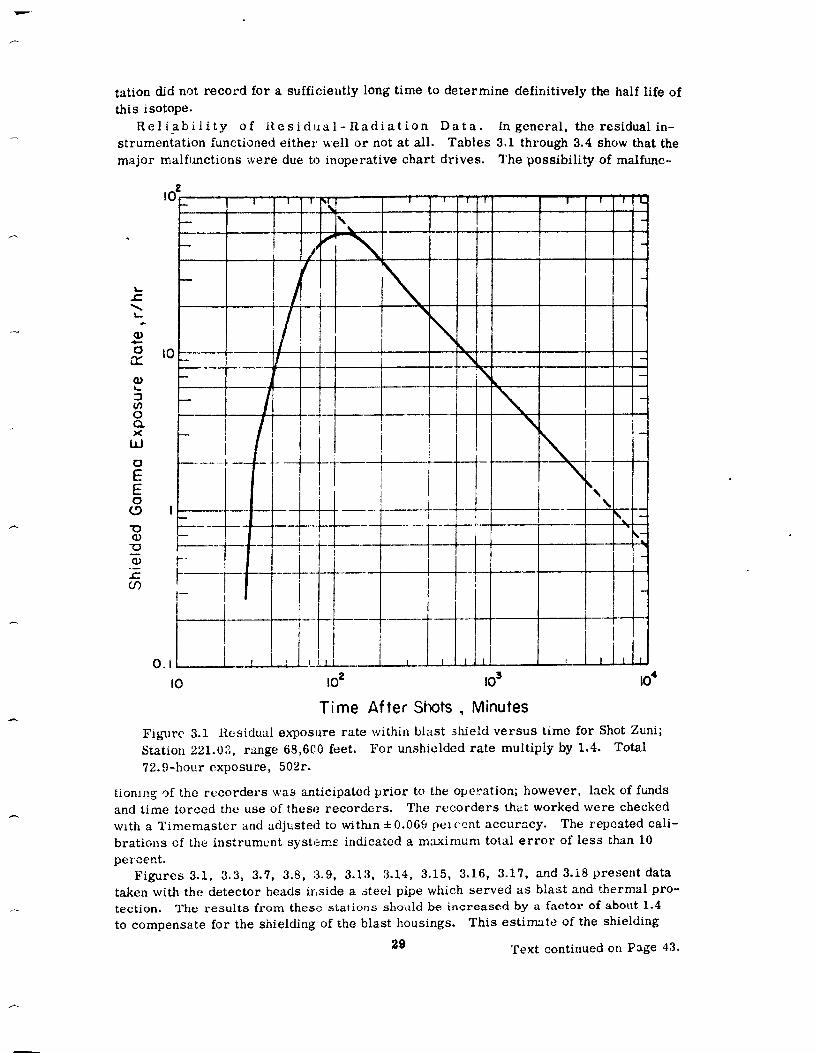
The data obtained from the residual-radiation stations are shown in Figures 3.1 through 3.18 in the form of log-log plots f9r convenience of presentation and for ease of determination of the decay exponent. The dec:ly exponent was equal to the slope of a straight line drawn through the data points that were conslderecl to be related to each other only by radioactive decay. All residual data was analyzed in detail for this re- port. The instruments for those stations ?epreterlted b:; Ftg-dres 3.3, 3.11, and 3.12 were operating at ievels belcjw their high-resolution region ‘md did not yield the essen- tially continuous curves shown in the remainder of the groUlJ of Figures 3.1 through 3.15. On Figures 3.1 through 3.18 the slopes are shown as dashed lines which were drawn through the linear yorticn of the curves. In drawing these dashed lines, early times were avoidell when the concentration of gamma-ray sources was still building up because of continuing deposition. of failout material, and other data points were ignored in cases where rain or wind had redistributed the fallout m:+.tcrial and caused pertur- bations in the decay curve.
Measured residual-gamma-radiation doses for each of the four shots are plotted on maps of Bikini Atoll in Figures 3.19 through 5.22. Free-field exposures shown on these figures were extrapolated to infinite time using Equation 1.1, Section 1.3.2, of this report.
Tables 3.1 through 3.4 summarize the data on residual -s!dtion locations, time of arrival of fallout, maximum-observed-exposure rate, roiai exposure, and decay expo- nent. The average decay exponent was found to be 1.1 for Shots Zuni and Tewa,
Ineglect,n:; the results from Station 221.04C, which received too iittlc?FZj,j,jE%r ac:curate evaluation). In the many cases where there was early rain leaching, the slope indicated by the data points taken after rain had ceased was used to heip det’urmine the best-fit straight lmc.
In these curves, the gamma-exposure rate after rainfall H as approximately half of that expected if the normal radioactive decay wtire tile only cause of change of exposure rate.
In Figures 3.3 and 3.18, the :buildup of the exposure rate was apparently more com- plex than the monotonic buildup presented by most of the other figures. It appears that fallout ceased to arrive for a short period at 60 minutes (in Figure 3.18) and then began to arrive again.
Slope changes are evident in the curves in Figures 3.9 ::nd 3.10 after about i-500 minutes. This effect was probably not due to instrumentation errors because these curves represented the data frorn two independent instruments located at the same sta- tion. A possible explanation of these slope changes wds the presence of one (or more than one) radioactive isotope whose half life was such that the decay was slower than the combined fission fragment deca:y of t -I* ‘, and the decay slope was dominated by this isotope from about e 500 minutes until the end of the record. However, the instrumen-
28
-
tation did not record for a sufficiently long time to determine definitively the half life of
this isotope. Reliability of Residual-Radiation Data. fn general, the residual in-
strumentation functioned either well or not at all. Tables 3.1 through 3.4 show that the major malfunctions were due to inoperative chart drives. The possibility of malfunc-
I I I III\ I I I I I I I I I-l
0
-_ v-- _+_i_+__+__ _. f_ f ; ) ’ ! -‘.
t
-+__ ’ _+ t
L t. --/ - J-
---I 1 !- --
t-
-- -
i-
ti 1 $ ,c ,,, , ,,,‘I r Y--- ‘_._
I t- ._I_ 1::
LL&_L I * I i t
.I L!-LL---
IO IO2 IO3 IO4
Time After Shots , Minutes
Figure 3.1 Residual exposure rate within blast 3 -meld versus time for Shot Zuni;
Station 221.03, range 68,600 feet. For unshioldcd rate multiply by 1.4. Total
‘72.9-hour exposure, 502r.
tiomng of the recorders was anticipated prior to the operation; however, lack of funds and time torced the use of these recorders. The recorders that worked were checked
with a Timemaster and adjusted to withm *to.069 perc’cnt accuracy. The repeated cali-
brations cf the instrument system, = indicated a maximum total error of less than 10 percent.
Figures 3.1, 3.3, 3.7, 3.8, L3.9, 3.13, 3.14, 3.15, 3.16, 3.17, and 3.i8 present data taken with the detector heads inside a Aecl pipe which served as blast and thermal pro- tection. The results from these stations shoicld be increased by a factor of about 1.4 to compensate for the shielding of the blast housings. This estimate of the shielding
29 Text continued on Page 43.
Time After Shot , Minutes
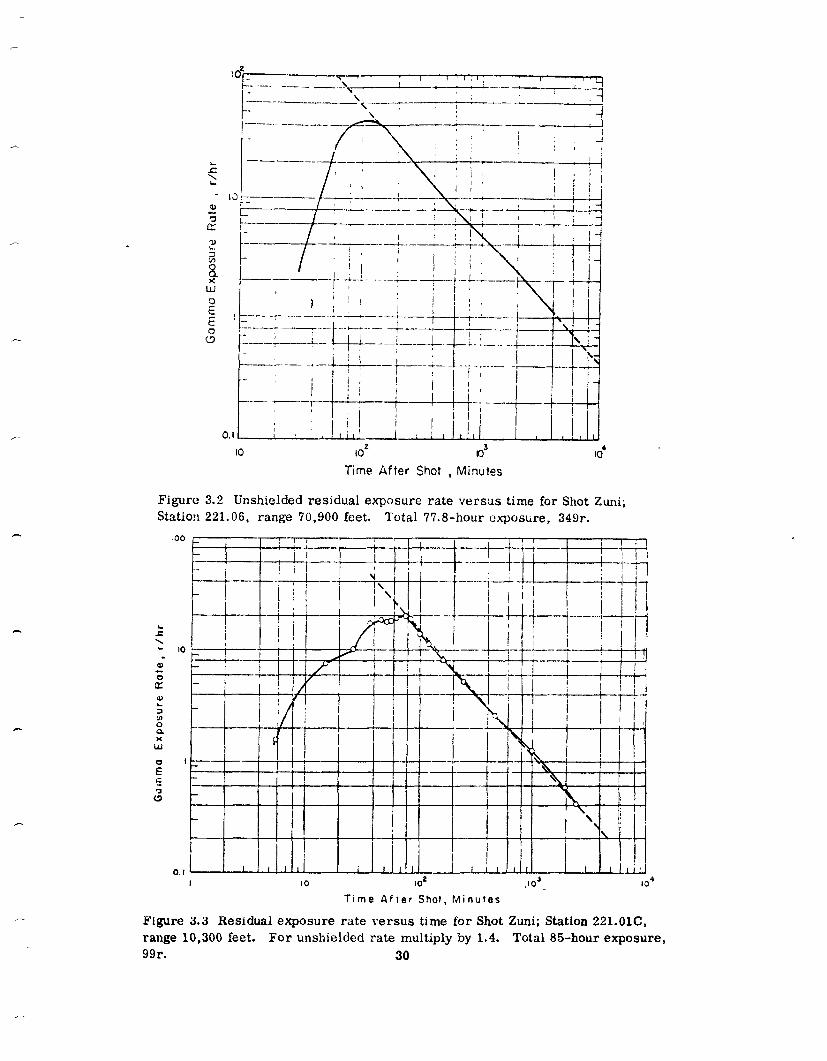
Figure 3.2 Unshielded residual exposure rate versus time for Shot Zuni; Station 221.06, range 70,!900 feet. Total 77.8-hour exposure, 349r.
.oo
I IO IO2 .lO’ IO4 Time Afrer Shot, Minutes
Figure 3.3 Residual exposure rate versus time for Shot Zuni; Station 22LOlC, range 10,300 feet. For unshielded rate multiply by 1.4. Total 8%hour exposure, 99r. 30
c
I
--
t
7 -
-
-
-
-
-
-
-
+I -
L
Time After Shot , Minutes
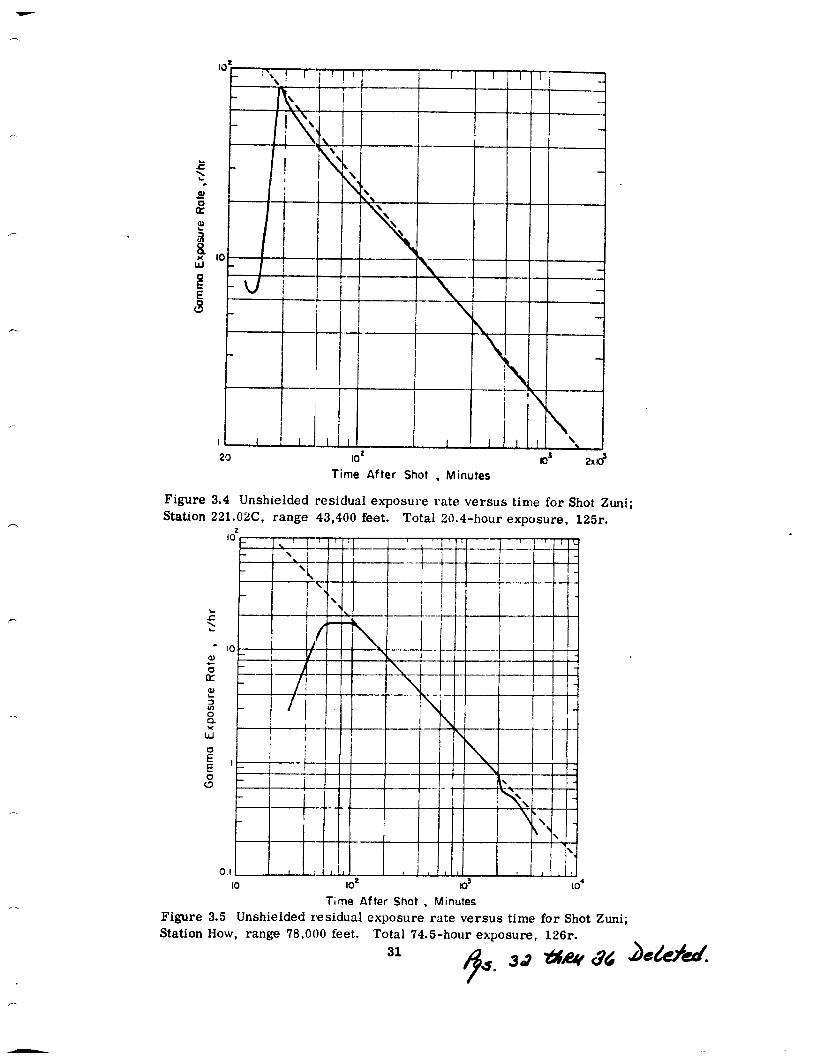
Figure 3.4 Unshielded .residual exposure rate versus time for Shot Zuni; Station 221.0X, range 43,400 feet. Total 20.4-hour exposure, 125r.
IO IO2 IO’ IO’
Time After Shot , Minutes
Figure 3.5 Unshielded residual exposure rate versus time for Shot Zuni; Station How, range 78,000 feet. Total ‘74.5-hour exposure, 126r.
31
-.
IO * I
/ r \
\- I
6- III II \
L I I II I Ilr, IO IO2 IO3 IO'
Time After Shot , Minutes Figure 3.16 Residual exposure rate versus time for Shot Tewa; Station 221.01, range 28,950 feet. For unshielded rate, multiply by 1.4. Total ‘74.8-hour exposure, 3,u55r.
4
Time After Shot , Minutes Figure 3.17 Residual exposure rate within blast shield versus time for Shot Tewa; Station 221.03, range 17,550 feet. For unshielded rate, multiply by 1.4. Total 5%hour exposure, 948r.
37
--J----
.--&!I--
/I --
I
---i---
l
.--
---
-.-
I
-I-
-.
--
-l-
i I __ -
T -
L
-
-
-
-
-
-
-
I
-----l-- j I --
-I I-- -
t II I I
IO2 IO3
Time After Shot, Minutes
-..L_
Figure 3.18 Residual exposure rate within blast shield versus time for Shot Tewa; Station 221.04, range 22,220 feet. For unshielded rate, multiply by 1.4. Total ?3-hour exposure, 814r.
.-
128,6r(t=(0) ,’ ,;’ _I
,, ” ,’
Figure 3.19 Map of Bikini Atoll showing unshielded residual exposures fot Shot Zuni. This illustration gives exposures at Islands Dog, George, How, Uncle, and Yoke. See Tat-& 3.1 fsr references to station desjgnations, distances fro-m ground zero, arrival times, and maximum exposure rates.
428r(t=74hr)
Figure 3.20 !!%ap of Rikini Atoll showing unshielded residual exposures for Shot Flathead. This illustration gives exposures at Islands Able, Alfa, Easy, Fox, and George (a and b). See Table 3.2 for references to station designations, distances from ground zero, arrival times, and maximum exposurse rates.
39
-
291.6r(t=cD)
_ 288.4r (t=47hr;
Figure 3.21 Map of Bikini Atoll showing u:ishielded residual exposures for Shot Navajo. This
illustrxtion gives exposures at Islands Able, Dog, Easy, and Fox. See Table 3.3 for references to station designations, distances from ground zero, arrival times, and maximum e.xposurc rates.
n
4277r (t=75hrb
L 1145r (1=00) -7 I140r(t=73 hr)
_. .,F3
I ~l33&w\rtwl
1327r(t=55hrl
Figure 3.22 Map of Bikini Atoll showing unshielded residual exposures for Shot Tewa. This illustration gives exposures at Islands Able, Dog, and Easy. See Table 3.4 for references to station designations, distances from ground zero, arrival times, and maximum exposure rates.
40
TABLE 3.1 SHOT ZUNI INSTRUMENTATION AND RESIDUAL-EXPOSURE INFORhlATION
Island station Azimuth
From Ground Zero
Distance From
Ground Zero
Arrival Time
Maximum Rate*
Total Elcposure+
Decay Exponent
w
George now Uncle Yoke
Nan Charlie Love Oboe
Peter Roger William Alfa
221.03 221.06 Portable 221.OlC 221.02c
Portable 221.02 Portable 220.08C
220.14C 220.09c 221.01c 221.04C
degree
5.5 17.1 60
268.8 292.2
ft minute r/hr
68,600 27.7 81.2 70,5no 31 42 78,000 28.0 17 10,300 26 28 43,400 25.3 80
Ko fallout Drive inoperative Stylus and drive inoperative Drive xoperative
Styills inoperative Stylus and drive inoperative Drive inoperative Drive inoperative
.- r
703 (72.9 hr) 1.07 349t77.8 hr) 1.07 126t74.5 hr) 1.04 139(85 hr) 1.1 125t2o.4 hr) 1.18
l Corrected to free-field values.
41
TABLE 3.4 SHOT TEWA INSTRUMENTATION AND RESIDUAL-EXPOSURE INFORMATION .___
Island Station Azimuth
From Ground Zero
Distance From
Ground Zero
Arrival Tlma
Maximum Rate*
Total Exposure+
Decay Ihponcnl
_---____- ----- dcgrcc It nunutc
Able 221.01 260.6 28,!)50 17.5 Dog 221.03 76.7 17,550 44.7 Easy 221.04 75.2 22.220 15.3
Oboe 22o.oac No fallout How Portable Stylus inoperative Fox 221.05 Drive inoperative Willlam 221.01c Drive inoperative Yoke 221.02c Drive inoperative
l Corrected to free-field values.
-. --- r/hr r
1,078 4.277(74.6 hr) 1.03 140 1,327 (55 hr) 1.29 105 1.139.6 (73 hr) 1.11
--

factor was derived from the field measurements at station 221.06, Shot Flathead, where
one detector was inside and the other was outside the blast housings. On the other hand,
Figures 3.2, 3.4, 3.5, 3.6, 3.10, 3.11, and 3.12 present data from detector heads with-
out blast shields. These detectors were calibrated for free-field conditions (Co*‘) and
gave free-field data.
3.2 INITIAL-RADIATION MEASUREMENTS
The results from the initial-gamma stations arc shown in Figures 3.23, 3.24, and
3.25. The initial-gamma station for Shot Zurti (Station 220.09C) was destroyed by the
Time After Shot, Seconds Figure 3.23 Shielded initial e_xposure rate versus time for Shot Zuni; Station 220.09C, range 7,000 feet. For tinshielded rate multiply by 1.2.
shock wave, and the data from this station were available only to shock arrival and are given in Figure 3.23. Figures 3.26, 3.27, and 3.28 present the total-initial-gamma ex- posure as a function of time.
The initial-gamma-e.xposure-rate data presented are subject to uncertainty in abso- lute magnitude. Data reduction indicated a strong possibility that the wiring of the magnetic-tape recorders might not have tJef?n the same as previously presumed and
that the association of a particu1.x recorder channel wrth a particular-detector-
sensitivity range might have been incorrect. The wiring could not be checked i.n the
laboratory because the equipment had been disassembled at the termination of the field
phase of the cperation. Subsequent analysis of the recorded pulse shapes has led to the
association assumed for the initial-gamma data presented herein, and the derived total-exposurr values agreed reasonably well with those measured by Operation Redwing
c
I I
I 1
auab+
uaO
&~
‘a
JnSO
~d
x3 O
u~um~
paplays
0 '0
0 0 0
0 0
J’ amso
dx
3 p
apla!q
s
C
47
1’ arnsodx3
papia!qS
-_
48
Project 2.1 (Reference 9). However, there is still some uncertainty on this point, and the curves presented may be off in absolute magnitude, although the shape of the curves as a function of time is probably correct.
The initial-gamma values given represent those observed at the detector and should be multiplied by a factor of approximately 1.2 to correct for station shielding. This factor of 1.2 is a measured value of the attenuation of the blast shield forC06’ radiation; the attenuation is a function of the energy of the incident radiation. Time is a factor only in that after one minute there is little gamma radiation in this energy range ( > 1 Mev). . Figures 3.23 through 3.28 should be multiplied by 1.2 to give free-field values.
The data in Figure 3.26 is in reasonable agreement with similar data in Reference 9. especially after the data of Figure 3.26 has been extrapolated to a time equivalent to that reported by Operation Redwing Project 2.1.
Figures 3.27 and 3.28 show that approximately “/s of the total-initial exposure for Shot Flathead 221.04 and Shot Navajo 221.05 was delivered after the arrival of the shock front. Most of this exposure W;LS due to the enhancement caused by the hydrodynamic effect because the exposure rate was dec;iyAg rapidly before the arrival of ,the shock front.
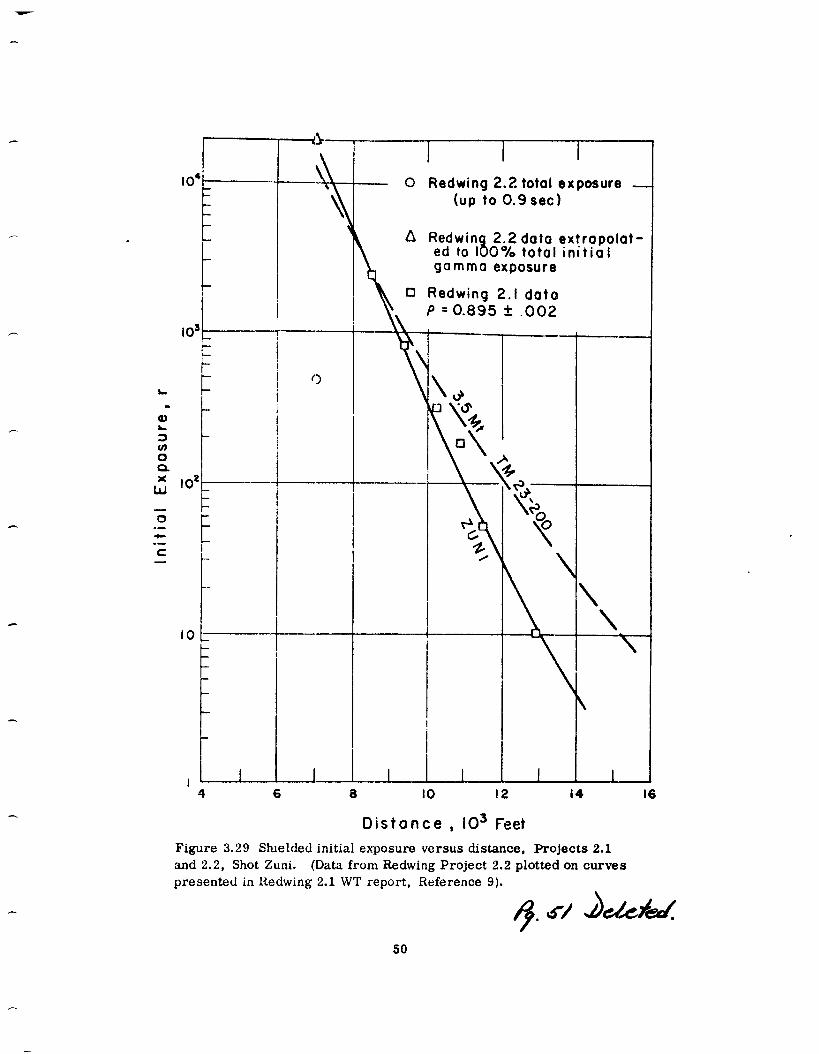
Reference 9 compares measured-init!nl-g::n;nin exposure-versus-distance curves with curves computed from TM 23-290. For the purpose of comparison with published data, integrated-initial-gamma-rate data from Figures 3.26, 3.27, and 3.28 of this report have been plotted on t!?e corresponding curves from Reference 9. In addition, extrapolation of Project 2. 2 measu:ed data (integrated-initial-gamma rate) to include initial-gamma dose delivered lfter the end of project records has been made using information and methods in Referonce I U. ilxltosure received prior to start of project records has been neglected, since the e:.posurc: 1va.s relative!y insignificant. The above- mentionecl plots for Shot Zuni. arc\ fnr,L!:n In Figure 3.29 and for Shots Fiathead and Navajo in Figure 3.30.
3.3 BEACH-BALL MEXSUREhIL?:TS
The objective of mcasurmg thti esposurc rate at the 11p of the crater from Shot Zuni was assumed by Project 2.2 :Lt .L late stage :I: 5~’ 1,r::porations for Operation Redwing. The beach-ball instrument \v:?s dropped onto the Shot Zuni crater lip at H + 6 hours. The fall apparently caused a change in the c.t11 b:~tiol; of the system, because the re- ceived data indicated an exposure r::te a- high as 50,Ci’O r/hr at this late time. Further- more, rotor interference made reception of t!ie transmitted signal Gifficuit.
3.4 THERM.4L-Hr~DIATIi)N DETECTOR
The thermal-radiation detector ‘A’>s instnilc i ! ‘III S*te Nan for Shot Tewa at a range of approximately 70 miles, and the dctonatit>n \V;IS s:ltisfactorily detected.
49
s--
I0’i Tf 1 \ . t
I I I - 0 Redwing 2.2 total exposurct -
(up to 0.9sec)
A Redwin \ ed to I 8
2.2data extrapolat- 0% total initial
gamma exposure
0 Redwing 2.1 data P = 0.895 + .002
-l-i-
\
\
\
i
I- 4 6 8 IO 12 14 16
Distance, IO3 Feet
Figure 3.29 Sbelded initial exposure versus distance, Projects 2.1 and 2.2, Shot Zuni. (Data from Redwing Project 2.2 plotted on curves
presented in Redwing 2.1 WT report, Reference 9).
Chupfef 4
4.1 RESIDU.~L-CA~IhlA-EXPOSURE RATE
The results of the residual-gamma-exposure-rate measurements showed that for some devices tne decay exl)onsnt varied with both the type of device and the station locstion- The decay exponent ‘was f:cirly uniform for different station locations for Shot Zuni (I.04 to 1.18) :tnd r;lther variabie for various station locations for Shot Navajo (1.07 to 1.39). Althougn no special significance was attached, the spread of values for the 11ecay exponent seemed to be greater when the average value was high and smaller when the average value was low.
The residual-instrumentation system performed at about 50 percent of its Ioapability. This was explained by the i&lure of the recorders, which were not designed as field instruments and were used rocause no others were available. There were no known failures of the Conrad detectors.
4.2 INITIAL-CARIMA-EXPOSURE RATE
Figures 3.27 ant! 3.28 show that approximately “/a of the total -initial-gamma expo- sure was delivered after the arrival of the shock front. Insufficient initial-gamma rate or dose data was available to allow independent comparison with published scaling laws. Figures 3.29 and 3.30 indic:tte reasonable agreement of both Redwing Projects 2.1 and 2.2 data points with TM 23-290; howeves, measured dose-versus-distance curves ex- hibit a steepor slope than shown on Figure 4-3, page 4-12 of TM 23-200, thus indicating
substantial oeviations at short and very long ranges.
4.3 BEACH-BALL OPERATK?N
This experiment demonstrated the operational feasibility of using the beach-ball techmque to drop a radiological telemeter onto a contaminated area.
4.4 THERMAL-RADIATION DETECTOR
The thermal-racliatioa detector operated satisfactorily for a 5-Mt detonation at a d-stancp of 20 miles. 1 4
4.5 RECOMMENDXTIGNS
Because of experience gained by Project 2.5 during Operation Plumbbob, it is rec- ommended that this experiment, with improved instrumentation. be repeated on other high-yield events, especially high-yieid air bursts.
4
52
1. J. S. Malik; “ Gamma Radiation Versus Time” ; Projects 5.1 and 5.2, Gperation Ivy, WT-634, November 1952; Los Alamos Scientific Laboratory, Los Aiamos, New Mexico; Secret Restricted Data.
2. P. Brown and G. Carp; “Gamma Rate Versus Time”; Project 2.2, Operation Castle, ITR-913, May 1954; Signal Corps Engineering Laboratories, U. S. Army, Fort Monmouth, New Jersey; Secret Restricted Data.
3. Super-Effects Handbook; AFSWP 351, May 1952; Secret Restricted Data..
4. T. E. Petriken; “Evaluat.ion of a Radiological Defense Warning System (Project Cloudburst)“; Project 6.1.lb, Gperation Teapot, WT-1112, August 1957; Evans Signal Laboratory, Fort Monmouth, New Jersey; Secret Restricted Data.
5. M. G. Schorr and E. S. Gilfillan; “Predicted Scaling of Radiological Effects to Operational Weapons”; Project 2.0, Operation Jangle, WT-391, 15 June 1952,; Tech- nical Operations Incorporated, Arlington, Massachusetts; Secret Restrict&d Data.
6. D. C. Borg and C. Eisenhauer; “Spectrum and Attenuation of Initial Gamma Radiation from Nuclear Weapons, hFSWP 502B, January 1955”; Weapons Effects Division; Secret Restricted Dat:i.
7. J. S. Maiik; “Summary of Information on Gamma Radiation from Atomic Weapons; LA-1620, January 1954; Los Alamos Scientific Laboratory, Los Alamos, New Mexico; Secret Restricted Data.
8. R. T. Carr and G. J. Him?; “Gamma Ray Dosimetry with Organic Scintillators”; Nucleonics, November 1953; Unclassified.
9. P. Brown and others; “Giamma Exposure Versus Distance”; Project 2.1, Operation Redwing, Draft manuscript WT-1310, July 1957; U. S. Army Signal Research and Development Laboratory, Fort Monmouth, New Jersey; Secret Restricted Data.
10. “ The Nuclear Radiation Handbook”, AFSWP-1100, 25 March 1957; Nuclear Development Corporation of Amsrica, White Plains, New York; Secret Restricted Data.
63-54