Embed Size (px)
Citation preview
Tenth USA/Europe Air Traffic Management Research and Development Seminar (ATM2013)
Operational Evaluation of Dynamic Weather Routes at American Airlines
David McNally, Kapil Sheth, Chester Gong, and Paul Borchers
NASA Ames Research Center Moffett Field, California, USA
Jeff Osborne, Desmond Keany, Brennan Scott, and Steve Smith
American Airlines Fort Worth, Texas, USA
Scott Sahlman, Chuhan Lee, and Jinn-Hwei Cheng
University Affiliated Research Center Moffett Field, California, USA
Abstract - Dynamic Weather Routes (DWR) is a search engine that continuously and automatically analyzes in-flight aircraft in en route airspace and proposes simple route amendments for more efficient routes around convective weather while considering sector congestion, traffic conflicts, and active Special Use Airspace. NASA and American Airlines (AA) are conducting an operational trial of DWR at the AA System Operations Center in Fort Worth, Texas. The trial includes only AA flights in Fort Worth Center airspace. Over the period from July 31, 2012 through October 31, 2012, 45% of routes proposed by DWR and evaluated by AA users (air traffic control coordinators and flight dispatchers) were rated as acceptable as proposed or with some modifications. The wind-corrected potential flying time savings for these acceptable routes totaled 470 flying min. DWR identified reroutes offering an additional 4,066 min of potential flying time savings for AA flights, but these routes were not evaluated due to staffing limitations. A sector congestion analysis shows that in only three out of 83 DWR routes rated acceptable by AA staff were the flights predicted to fly through a congested sector inside of 30 min downstream of present position. This shows that users considered sector congestion data provided by DWR automation and in nearly all cases did not accept routes through over-capacity sectors.
Keywords – convective weather avoidance, air traffic management, trajectory automation, operational testing.
I. INTRODUCTION Adverse weather is the leading cause of delay in the US
National Airspace System, and convective weather accounts for 60% of weather related delays [1]. In 2007, delayed flights consumed 740 million additional gallons of jet fuel at a cost of $1.6 billion, and 20% of total domestic flight time was wasted in delay [2]. Airline flight dispatchers must file flight plans 45 min before push-back from the gate using their best available weather forecasts. FAA traffic managers at the Air Traffic Control System Command Center (ATCSCC) and at local Air Route Traffic Control Centers (ARTCCs, or Centers) assess the impact of weather on traffic flows, and, when necessary, implement standard reroutes for groups of flights, e.g., playbook routes and coded departure routes. Given the uncertainty in weather, standardized reroutes may result in
large buffers between flight routes and forecast weather. Weather changes as flights progress along planned routes, and because airline dispatchers and FAA traffic managers are busy, especially during weather events, they may miss workable opportunities for more efficient routes around weather.
The Dynamic Weather Routes (DWR) system is a search engine that continuously and automatically analyzes in-flight aircraft in en route airspace and proposes time- and fuel-saving corrections to current weather avoidance routes [3]. DWR finds flights with large course changes in their en route Center flight plan routes. Using trajectory automation with current and forecast weather models, DWR tries to find more efficient routes around weather while considering wind-corrected flying time, downstream sector congestion, and traffic conflicts. Users are alerted when a reroute is identified that could save a flight more than an adjustable amount of flying time, e.g., 5 min. All proposed reroutes are of the form direct to a downstream flight plan fix via up to two auxiliary waypoints. DWR is configurable so that auxiliary waypoints may be defined in fix-radial-distance (FRD) format, or in “snap-to-named-fix” format where any FRD waypoints are replaced by the closest nearby named fix or fixes that do not cause the DWR trajectory to conflict with modeled weather. Interactive automation enables users to quickly visualize proposed routes, modify them if necessary, and evaluate key parameters including proximity to weather, flying time savings (or delay), sector congestion, traffic conflicts, and active Special Use Airspace (SUA). Laboratory analysis of 14 hours of archived traffic over five convective weather days in Fort Worth Center (ZFW) shows an average potential savings of about 10 min per flight for 171 flights [3].
DWR is based on the integrated real-time operation of the Center/TRACON Automation System (CTAS), the Future ATM Concepts Evaluation Tool (FACET), the Corridor Integrated Weather System (CIWS), the Convective Weather Avoidance Model (CWAM), and the weather and traffic autoresolver algorithm in the Advanced Airspace Concept (AAC) software suite. Reference [3] includes a complete description of the DWR system. Reference [4] includes an
updated description of the autoresolver algorithm used in DWR to compute routes around modeled weather.
Related research includes work by Taylor and Wanke (2012) who define a method that generates operationally acceptable reroutes for flights predicted to request deviation from their current routes for weather [5]. The method considers many factors including route deviation distance, conformance of reroute to historically flown routes, weather impact on current route, sector congestion, and ATC factors including required point-outs and inter-facility coordination. Stewart, et al. (2012) describe a concept for an En Route Flow Planning Tool (EFPT) that helps traffic managers proactively build, coordinate, and execute efficient reroutes around weather for flights that are predicted to request a deviation for weather [6]. The concept assumes the use of CIWS and CWAM weather modeling for weather detection and reroute generation, and incorporates route acceptability factors described in [5]. The EUROCONTROL Concept of Flexible Use of Airspace (2002) [7] includes defined Conditional Routes which may be planned and used by airspace users under specified conditions. Daily messages notify users as to the availability of Conditional Routes and may include short-notice messages to maximize the use of Conditional Routes when they become available. The Integrated Departure Route Planning (IDRP) Tool helps traffic managers and airline dispatchers proactively select reroutes for departing flights prior to take-off (2011) [8]. IDRP combines forecast weather along departure route options and predicted traffic demand on departure fixes to identify candidate flights for departure reroutes. DWR focuses on tactical route corrections for in-flight aircraft, and increases the number of eligible flights by searching for opportunities for more efficient weather-avoidance routes regardless of the weather status on the current route.
DWR, in the implementation described here, assumes that airline ATC coordinators, dispatchers, and pilots request reroutes, and that factors not modeled in DWR automation are worked out between the airline and air traffic control using today’s procedures.
This paper describes the operational testing of the DWR system at the American Airlines (AA) System Operations Center (SOC) in Fort Worth, Texas from July through October 2012. The objectives were to a) validate the DWR automation, operating concept, and benefit mechanisms under operational conditions in an airline operations center, b) uncover operational issues, and c) assess additional benefits that could be achieved through streamlined operations and coordination.
II. SYSTEM ARCHITECTURE AND OPERATING PROCEDURES
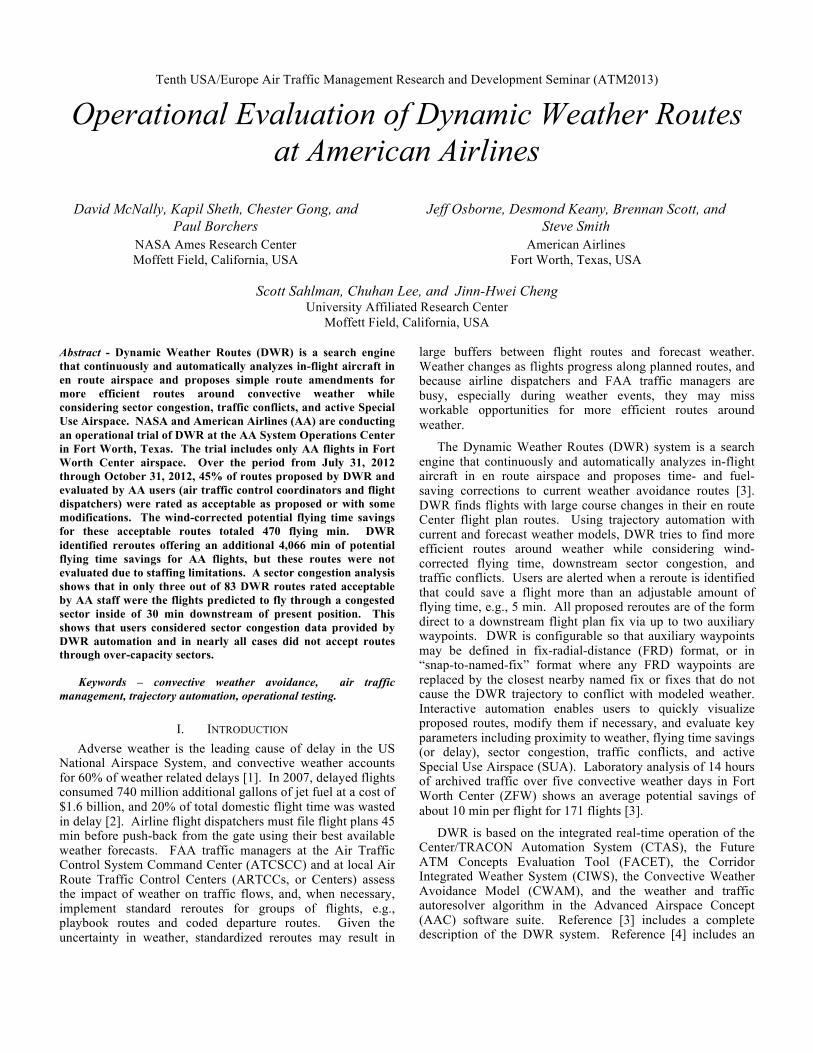
A. System Architecture The system architecture for the trial is shown in Fig. 1. All
software components run under the Linux operating system on one single high performance rack-mounted processor. DWR software components include the CTAS trajectory automation configured for DWR, a display system (monitor, keyboard, mouse) configured for users at the AA SOC, a display system
configured for the ZFW Traffic Management Unit (TMU), and two instances of the FACET trajectory automation (one for each user display). The TMU display was not used during the trial but was available to show how DWR might be used in a Center TMU.
All the display systems were run using Virtual Network Computing (VNC) enabling the software to reside on the high performance processor at NASA’s North Texas Research Station (NTX) reducing maintenance and deployment time. NTX is co-located on site at the Fort Worth ARTCC, which is near the AA SOC. A microwave link between NTX and the AA SOC transmits DWR data between the facilities. This isolates the NASA system from AA’s network, and the use of VNC allows full DWR functionality at the AA SOC while keeping the processing secure at NTX. Small Linux processors, attached to the back of the AA user displays, minimize the desk space required by DWR. The VNC system also allows remote desktop maintenance, monitoring, and recording of DWR with insignificant delays.
Fig. 1. DWR system architecture
B. Operating Procedures On July 17, 2012 a DWR display running with live traffic
was installed in a weather planning area adjacent to the main SOC operations floor. NASA staff and collaborators from MIT-Lincoln Laboratory demonstrated the DWR system with live and recorded traffic feeds for 20 members of the AA SOC including senior managers, training managers, flight dispatchers, air traffic control coordinators, representatives from the flight dispatchers union, and automation staff. AA feedback was positive and much of the discussion during the first week centered around the operating concept and equipment locations for transition from shadow testing to operational testing. The original plan was to conduct shadow testing in the weather planning area, but it was quickly realized that the display needed to be located at an air traffic control (ATC) coordination area on the operational floor so that users could effectively evaluate DWR routes while taking into account current operational conditions.
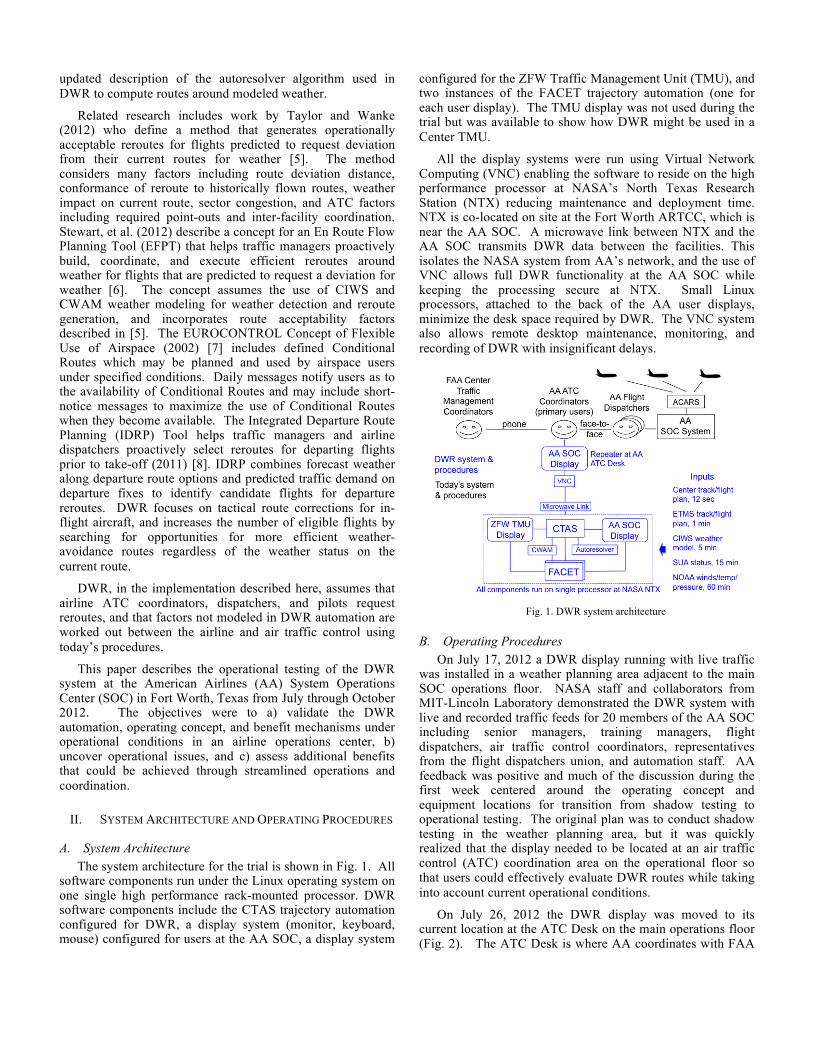
On July 26, 2012 the DWR display was moved to its current location at the ATC Desk on the main operations floor (Fig. 2). The ATC Desk is where AA coordinates with FAA
ATC facilities and is typically staffed by 2-3 ATC coordinators working at various display positions. Under the trial operating concept an ATC coordinator evaluates routes proposed by DWR, modifies them if necessary, and then alerts the dispatcher in charge of the flight when they find a route deemed workable and acceptable to AA. If the dispatcher concurs, he or she sends the DWR route to the flight crew; the flight crew evaluates and requests the route change, all using normal procedures. In some cases the ATC coordinator pre-coordinates a proposed reroute by calling the ZFW TMU before the dispatcher sends the proposed reroute to the flight crew.
Fig. 2. DWR at American Airlines, System Operations Center, Fort Worth, Texas: top) display location at ATC Desk, bottom) close-up of user display.
The initial plan was to have ATC coordinators and dispatchers evaluate DWR routes for 100 flights before attempting to implement actual operational reroutes. However, early in the trial AA coordinators and dispatchers found that some of the reroutes identified using DWR could be issued right away, and these routes were requested operationally. Throughout most of the evaluation, whenever a route was acceptable to the ATC coordinator and the dispatcher, and there was no other reason not to request a reroute, AA staff using normal procedures would send an ACARS message to the flight crew to request the reroute from the Center, and/or would coordinate a reroute via telephone coordination with the ZFW TMU or in some cases with neighboring Centers.
The following sequence of events describes the procedures used for evaluating and implementing DWR routes for each flight during the evaluation:
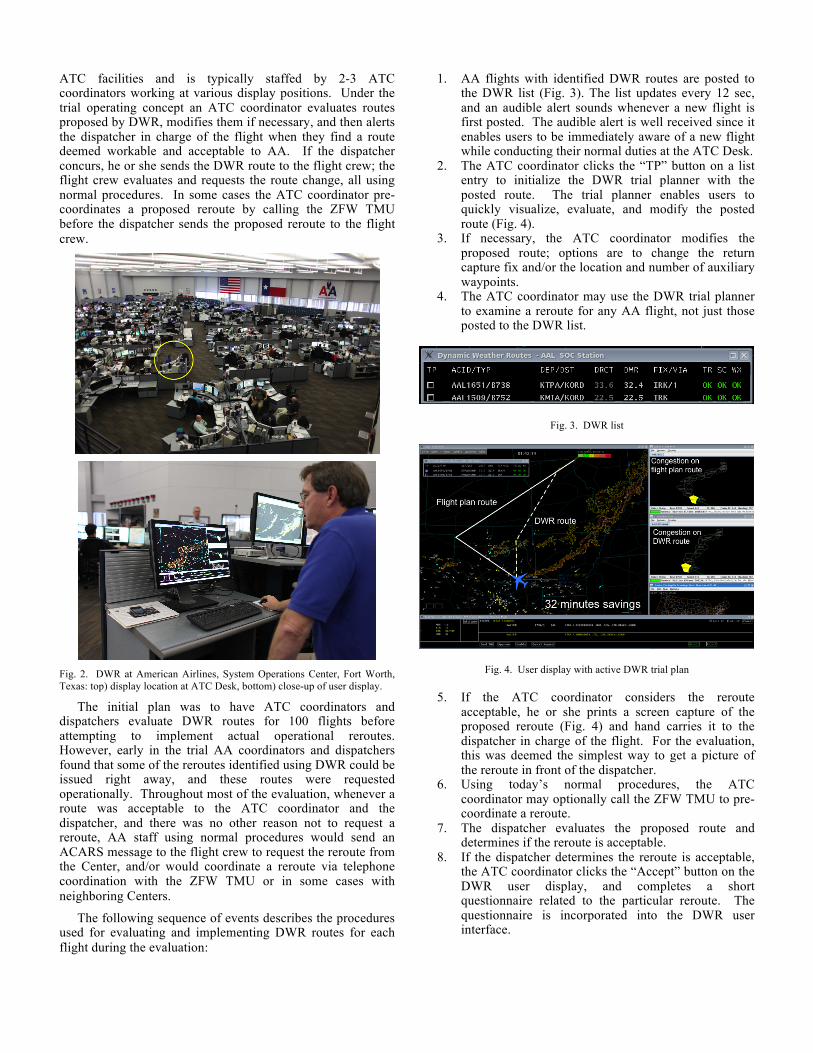
1. AA flights with identified DWR routes are posted to the DWR list (Fig. 3). The list updates every 12 sec, and an audible alert sounds whenever a new flight is first posted. The audible alert is well received since it enables users to be immediately aware of a new flight while conducting their normal duties at the ATC Desk.
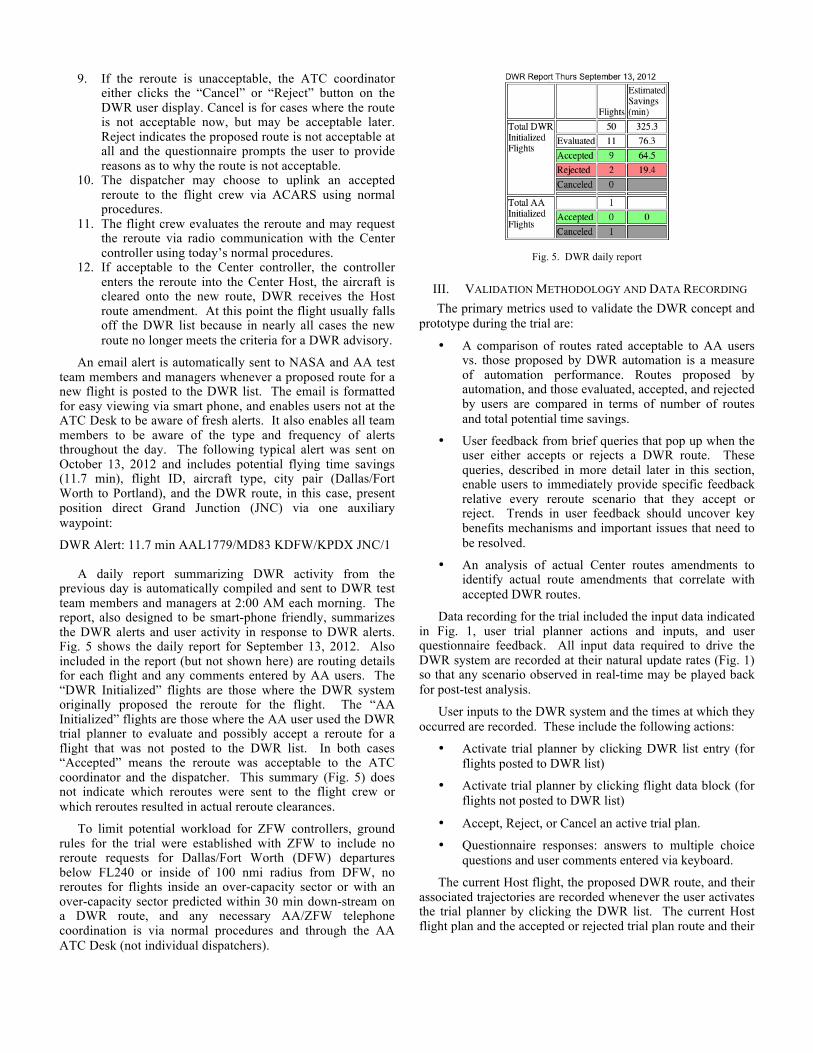
2. The ATC coordinator clicks the “TP” button on a list entry to initialize the DWR trial planner with the posted route. The trial planner enables users to quickly visualize, evaluate, and modify the posted route (Fig. 4).
3. If necessary, the ATC coordinator modifies the proposed route; options are to change the return capture fix and/or the location and number of auxiliary waypoints.
4. The ATC coordinator may use the DWR trial planner to examine a reroute for any AA flight, not just those posted to the DWR list.
Fig. 3. DWR list
Fig. 4. User display with active DWR trial plan
5. If the ATC coordinator considers the reroute acceptable, he or she prints a screen capture of the proposed reroute (Fig. 4) and hand carries it to the dispatcher in charge of the flight. For the evaluation, this was deemed the simplest way to get a picture of the reroute in front of the dispatcher.
6. Using today’s normal procedures, the ATC coordinator may optionally call the ZFW TMU to pre-coordinate a reroute.
7. The dispatcher evaluates the proposed route and determines if the reroute is acceptable.
8. If the dispatcher determines the reroute is acceptable, the ATC coordinator clicks the “Accept” button on the DWR user display, and completes a short questionnaire related to the particular reroute. The questionnaire is incorporated into the DWR user interface.
9. If the reroute is unacceptable, the ATC coordinator either clicks the “Cancel” or “Reject” button on the DWR user display. Cancel is for cases where the route is not acceptable now, but may be acceptable later. Reject indicates the proposed route is not acceptable at all and the questionnaire prompts the user to provide reasons as to why the route is not acceptable.
10. The dispatcher may choose to uplink an accepted reroute to the flight crew via ACARS using normal procedures.
11. The flight crew evaluates the reroute and may request the reroute via radio communication with the Center controller using today’s normal procedures.
12. If acceptable to the Center controller, the controller enters the reroute into the Center Host, the aircraft is cleared onto the new route, DWR receives the Host route amendment. At this point the flight usually falls off the DWR list because in nearly all cases the new route no longer meets the criteria for a DWR advisory.
An email alert is automatically sent to NASA and AA test team members and managers whenever a proposed route for a new flight is posted to the DWR list. The email is formatted for easy viewing via smart phone, and enables users not at the ATC Desk to be aware of fresh alerts. It also enables all team members to be aware of the type and frequency of alerts throughout the day. The following typical alert was sent on October 13, 2012 and includes potential flying time savings (11.7 min), flight ID, aircraft type, city pair (Dallas/Fort Worth to Portland), and the DWR route, in this case, present position direct Grand Junction (JNC) via one auxiliary waypoint:
DWR Alert: 11.7 min AAL1779/MD83 KDFW/KPDX JNC/1
A daily report summarizing DWR activity from the previous day is automatically compiled and sent to DWR test team members and managers at 2:00 AM each morning. The report, also designed to be smart-phone friendly, summarizes the DWR alerts and user activity in response to DWR alerts. Fig. 5 shows the daily report for September 13, 2012. Also included in the report (but not shown here) are routing details for each flight and any comments entered by AA users. The “DWR Initialized” flights are those where the DWR system originally proposed the reroute for the flight. The “AA Initialized” flights are those where the AA user used the DWR trial planner to evaluate and possibly accept a reroute for a flight that was not posted to the DWR list. In both cases “Accepted” means the reroute was acceptable to the ATC coordinator and the dispatcher. This summary (Fig. 5) does not indicate which reroutes were sent to the flight crew or which reroutes resulted in actual reroute clearances.
To limit potential workload for ZFW controllers, ground rules for the trial were established with ZFW to include no reroute requests for Dallas/Fort Worth (DFW) departures below FL240 or inside of 100 nmi radius from DFW, no reroutes for flights inside an over-capacity sector or with an over-capacity sector predicted within 30 min down-stream on a DWR route, and any necessary AA/ZFW telephone coordination is via normal procedures and through the AA ATC Desk (not individual dispatchers).
Fig. 5. DWR daily report
III. VALIDATION METHODOLOGY AND DATA RECORDING The primary metrics used to validate the DWR concept and
prototype during the trial are:
• A comparison of routes rated acceptable to AA users vs. those proposed by DWR automation is a measure of automation performance. Routes proposed by automation, and those evaluated, accepted, and rejected by users are compared in terms of number of routes and total potential time savings.
• User feedback from brief queries that pop up when the user either accepts or rejects a DWR route. These queries, described in more detail later in this section, enable users to immediately provide specific feedback relative every reroute scenario that they accept or reject. Trends in user feedback should uncover key benefits mechanisms and important issues that need to be resolved.
• An analysis of actual Center routes amendments to identify actual route amendments that correlate with accepted DWR routes.
Data recording for the trial included the input data indicated in Fig. 1, user trial planner actions and inputs, and user questionnaire feedback. All input data required to drive the DWR system are recorded at their natural update rates (Fig. 1) so that any scenario observed in real-time may be played back for post-test analysis.
User inputs to the DWR system and the times at which they occurred are recorded. These include the following actions:
• Activate trial planner by clicking DWR list entry (for flights posted to DWR list)
• Activate trial planner by clicking flight data block (for flights not posted to DWR list)
• Accept, Reject, or Cancel an active trial plan.
• Questionnaire responses: answers to multiple choice questions and user comments entered via keyboard.
The current Host flight, the proposed DWR route, and their associated trajectories are recorded whenever the user activates the trial planner by clicking the DWR list. The current Host flight plan and the accepted or rejected trial plan route and their
associated trajectories are recorded whenever the user selects “Accept” or “Reject” for an active trial plan.
To gain user feedback into the conditions leading to the acceptance, modification, or rejection of the suggested reroutes, and capture anecdotal comments related to the concept, prototype system, and particular routes, brief queries were incorporated within the DWR interface. The completion of an accepted, modified or rejected reroute action via the user interface triggered a pop-up panel for the users to input feedback. This method of collecting data was used in lieu of post-shift questionnaires in an attempt to gather as much user feedback as possible, immediately after a rerouting decision was made, with a minimal amount of disruption to their use of DWR.
The questions were posed to gain a high-level understanding of the usefulness of DWR in finding a better route and the user’s estimate of confidence that a recommended reroute would, in fact, be implemented. In cases where the user modified a proposed reroute, users were asked to check from a list of possible factors contributing to the decision to modify the DWR route. In the case that a modification was due to concerns over weather avoidance, additional weather-specific sub-questions were listed for the user to select the effects influencing the modification. A similar set of sub-questions were posed when traffic conditions were indicated as a major factor in modifying a DWR. Finally, users who rejected a DWR advisory were also asked to supply reasons for the rejection, and weather avoidance and traffic condition sub-questions were posed.
IV. RESULTS DWR has been in continuous operation (24 hrs/day, 7
days/week) at the AA ATC Desk since it was first installed on July 26, 2012. The period from July 31, 2012 through October 31, 2012 is selected for this analysis because it is within the typical convective weather season in ZFW.
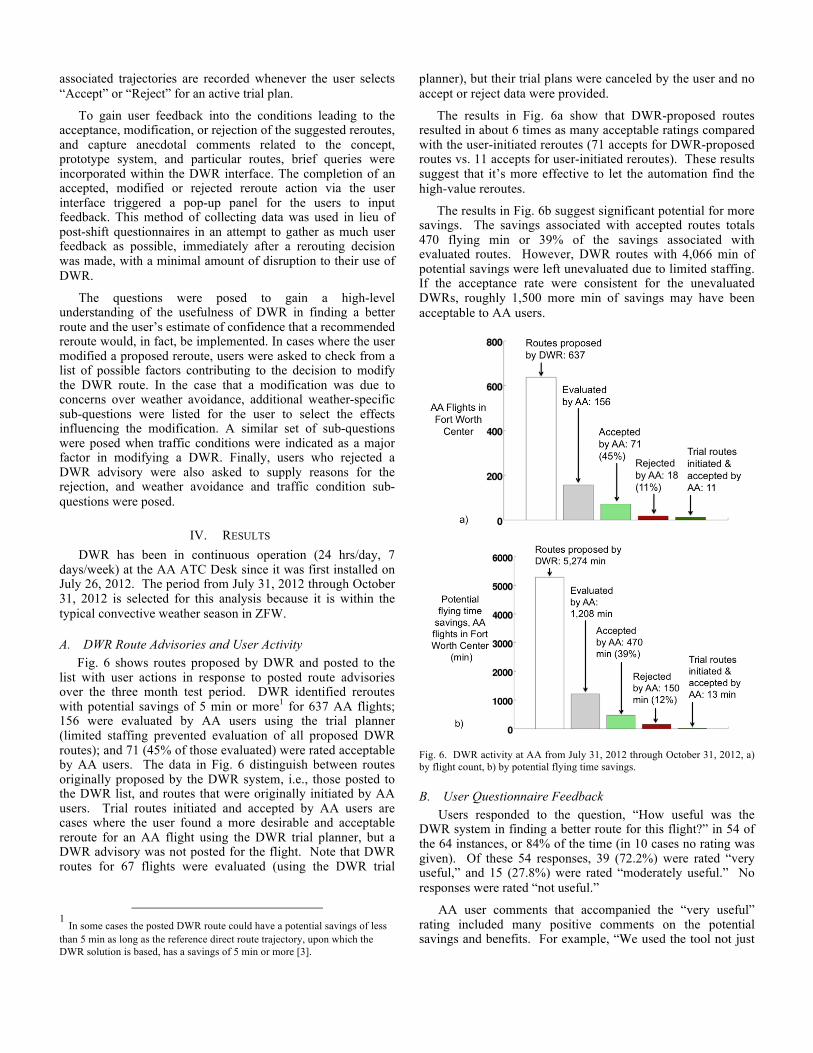
A. DWR Route Advisories and User Activity Fig. 6 shows routes proposed by DWR and posted to the
list with user actions in response to posted route advisories over the three month test period. DWR identified reroutes with potential savings of 5 min or more1 for 637 AA flights; 156 were evaluated by AA users using the trial planner (limited staffing prevented evaluation of all proposed DWR routes); and 71 (45% of those evaluated) were rated acceptable by AA users. The data in Fig. 6 distinguish between routes originally proposed by the DWR system, i.e., those posted to the DWR list, and routes that were originally initiated by AA users. Trial routes initiated and accepted by AA users are cases where the user found a more desirable and acceptable reroute for an AA flight using the DWR trial planner, but a DWR advisory was not posted for the flight. Note that DWR routes for 67 flights were evaluated (using the DWR trial
1 In some cases the posted DWR route could have a potential savings of less than 5 min as long as the reference direct route trajectory, upon which the DWR solution is based, has a savings of 5 min or more [3].
planner), but their trial plans were canceled by the user and no accept or reject data were provided.
The results in Fig. 6a show that DWR-proposed routes resulted in about 6 times as many acceptable ratings compared with the user-initiated reroutes (71 accepts for DWR-proposed routes vs. 11 accepts for user-initiated reroutes). These results suggest that it’s more effective to let the automation find the high-value reroutes.
The results in Fig. 6b suggest significant potential for more savings. The savings associated with accepted routes totals 470 flying min or 39% of the savings associated with evaluated routes. However, DWR routes with 4,066 min of potential savings were left unevaluated due to limited staffing. If the acceptance rate were consistent for the unevaluated DWRs, roughly 1,500 more min of savings may have been acceptable to AA users.
Fig. 6. DWR activity at AA from July 31, 2012 through October 31, 2012, a) by flight count, b) by potential flying time savings.
B. User Questionnaire Feedback Users responded to the question, “How useful was the
DWR system in finding a better route for this flight?” in 54 of the 64 instances, or 84% of the time (in 10 cases no rating was given). Of these 54 responses, 39 (72.2%) were rated “very useful,” and 15 (27.8%) were rated “moderately useful.” No responses were rated “not useful.”
AA user comments that accompanied the “very useful” rating included many positive comments on the potential savings and benefits. For example, “We used the tool not just
for analysis but we coordinated with the dispatcher and then with TMU at both ZFW and ZKC to give us a re-route. Approximately 1,600 lbs fuel savings. A great tool that we need to do analysis nationwide, not just in ZFW.”
There were also comments describing coordination with the Air Traffic Control System Command Center triggered by DWR advisories. For example, “After three other requests on other AA flights we were able to request the command center to coordinate with ZFW and ZHU to come off the re-route in place. This probably saved 40-45 min of unnecessary re-routes for future flights as the weather moved far enough east.”
There were several comments related to the reduction in savings due to the time required to coordinate and implement a reroute. For example, “Requested from ZFW. Approved and granted. Savings went from 2.9 minutes to 1.2 by the time it was implemented,” and “Might be usable. Unable to get graphic picture to dispatcher in a timely fashion.” Two improvements are under way to streamline coordination and implementation of DWR routes.
An adjustable maneuver start point, i.e., a maneuver execution delay, has been incorporated into the DWR trajectory modeling. This enables proposed DWR routes to account for expected coordination delay, and enables users to interactively evaluate the effect of maneuver execution delay on savings, proximity to weather, traffic conflicts and other factors. A DWR route around weather might be different, maybe significantly different, if its start point is three or five min downstream of present position. The function also enables DWR routes to be computed and users to be alerted prior to the flight reaching any predetermined start point limits. For example, a flight departing DFW may nominally not be able to start a reroute maneuver before reaching the high altitude airspace (FL240 and above), but a user should have the ability to visualize and plan the route as soon as possible so they are better able to complete any required coordination and realize maximum savings.
A network connection between the DWR display at the ATC Desk and the individual dispatcher stations is also being investigated. This would eliminate Step 5 described above under Operating Procedures. A “Send Dispatcher” button on the DWR display activated by the ATC Coordinator would automatically send DWR routing information to the appropriate dispatcher display, and thereby significantly reduce the time required to get DWR routing information in front of the dispatcher in charge of the flight.
With the “moderately useful” ratings, AA users pointed out DWR routes conflicting with arrival flows into Dallas, conflicts with Command Center Traffic Management Initiatives, specifically Playbook Routes or Coded Departure Routes, and conflicts with over-capacity sectors. Also noted were difficulties in getting reroute information to the dispatcher in a timely fashion. The primary reasons users gave for “Reject” ratings were arrival stream conflicts, Playbook or Coded Departure Route conflicts, routes too close to weather, and sector congestion.
An arrival stream conflict is where a proposed DWR route takes an aircraft through one of the sectors where arrivals to
DFW or Dallas Love Field are merging and descending in preparation for landing. Current DWR automation intentionally does not filter such cases because during some periods arrival flows are sparse and a DWR route through an arrival sector may be acceptable to Center controllers. The presence of rejects due to arrival stream conflicts clearly indicates AA users know when these routes would not be acceptable for the Center and therefore should not be requested. Future work will examine how DWR routes through busy arrival sectors may be filtered so that likely unacceptable routes are not posted to the DWR list, while likely workable routes through arrival sectors are posted to the DWR list.
In order to reduce the number of DWR advisories that could be considered too close to weather, the DWR weather detection and resolution software has been recently modified to detect proposed trajectories through narrow weather gaps and reject solutions where gaps are narrower than parameter nmi, e.g., 25 nmi.
In order to address the concern about Command Center Traffic Management Initiatives (TMIs), the DWR software has been recently modified to identify in real-time flights that are currently subject to route TMIs. Using the real-time framework described by Rios, et al. [9], users are made aware of active route TMIs for any flight on the DWR list or any flight being trial planned.
These questionnaire responses provide an initial indication of the issues surrounding the DWR concept and the usefulness and workability of the suggested reroutes. The ability to immediately gather input after a DWR action via the DWR user interface gave the researchers the opportunity to gain much more specific immediate feedback on possible reroutes and problems encountered than might have been possible had users been queried for their input at the end of a shift or at the end of a day. The detailed anecdotal results are being used to guide future follow-on research and software upgrades. Future DWR evaluations may expand on this data collection in order to enable more rigorous statistical analysis.
C. Actual DWR Reroutes for AA Flights Given that some of the accepted DWR routes resulted in
requests to the Center for reroutes, a key question is how many flights were rerouted as a result of DWR, and what were their actual flying time savings? Here we attempt to correlate actual reroutes with accepted DWR routes using AA user comments, actual Host route amendments and track data, and elapsed time between an accepted DWR and an observed Host amendment. Since some flights receive route amendments under today’s operations without DWR, care is taken to distinguish between amendments resulting from DWR and amendments given to flights without the aid of DWR.
First, the user comments for all accepted DWR routes are analyzed to determine which ones were followed by a request to ZFW Center (or a neighboring Center) for a reroute, either an uplink to the crew via ACARS or a call to ZFW Center from the AA ATC Desk. Of the 71 accepted DWR routes, 19 had user comments indicating a reroute was either sent to the crew or coordinated with the Center.
Secondly, and independent of the user comment analysis, the Center Host flight plan data for ZFW and its neighboring Centers (Memphis, Houston, Albuquerque, and Kansas City) are examined to determine if a route amendment occurred near the time of an accepted DWR route for the flight. Route amendments that meet the following criteria are considered to be potentially correlated with DWR: a) the amendment occurs during the period starting 5 min before the accepted DWR route and ending 20 min after the accepted DWR, and b) the amendment either matches the accepted route or there is a reasonably close correlation between the accepted route and the observed Host amendment. In at least one case a Host amendment was observed before the ATC coordinator got back to the DWR display to click the “Accept” button. In this case the AA user clearly states in the comments that he coordinated with the Center and the ATCSCC to take the aircraft off of weather route that was no longer necessary.
Cases where actual route clearances and their associated Host amendments do not exactly match accepted DWR routes are fully expected. Several cases like this occurred during the trial. For example, a controller might issue a clearance that closely follows the DWR, and realizes similar savings or even more savings, but has a different return capture fix, maybe one further downstream.
The actual flying time savings associated with an observed route amendment is estimated by comparing the wind-corrected flying time to a common point on the route for the trajectory immediately before and immediately after the observed route amendment. The estimated actual savings is equal to the time to fly along the original trajectory (just before the amendment) minus the time to fly along the updated trajectory that incorporates the new route.
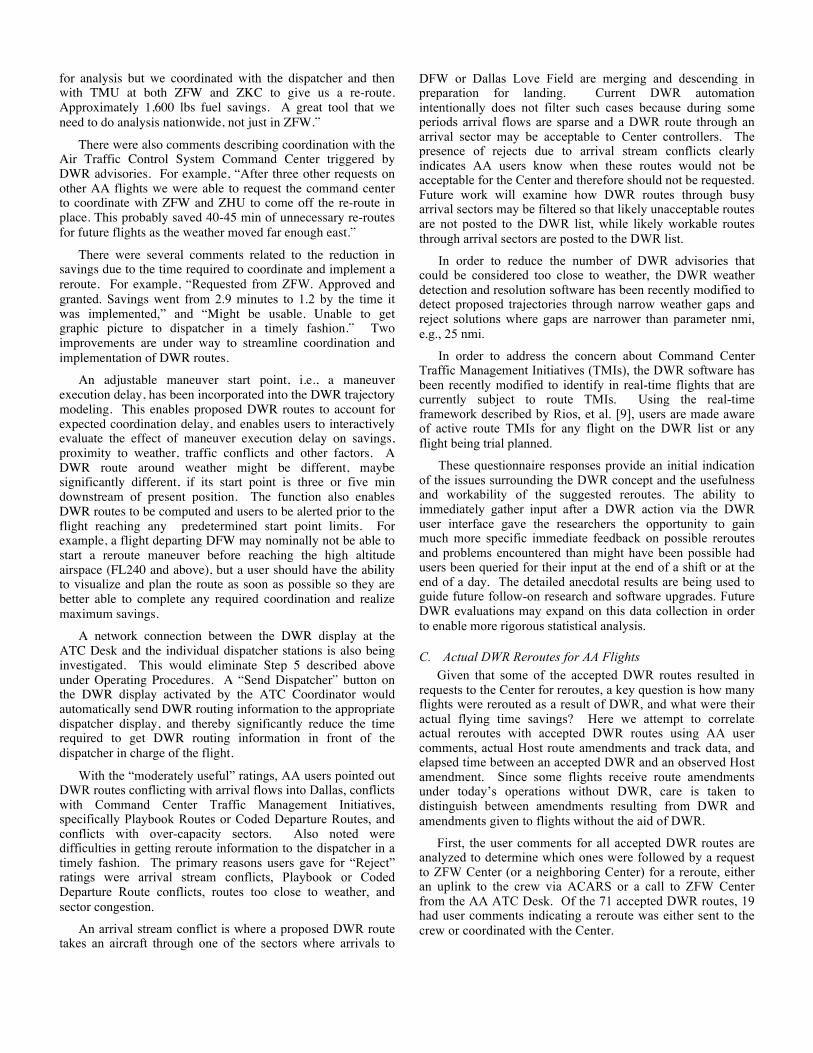
Fig. 7 (top) shows the accepted (left bars) and actual (right bars) flying time savings for that subset of flights for which DWR routes were accepted by AA users and where either the user comments indicate the route was requested or where a Host route amendment was observed. Accepted DWR routes for 33 flights meet these criteria. A blue (dark) bar on the left tallies cases where the user comments indicate the accepted DWR route was followed by a route request. The difference between accepted and actual savings is due to execution delay and/or any difference between the accepted route and the cleared route.
Execution delay, shown in Fig. 7 (bottom), is the elapsed time between the accepted DWR and the time of the observed Host amendment. If there is no entry in Fig. 7 (bottom), then no actual route amendment was found for this flight. Execution delay is important because potential DWR savings usually decreases with elapsed time. Note that flight 17 has a very small execution delay (0.6 min) and the accepted and actual savings are nearly equal at about 23 min flying time. Flights 1 and 20 have execution delays of 6 and 3 min respectively, and actual savings in these cases is about 2-3 min lower than the accepted savings. There were no observed amendments for flights 7, 8, 16, 18, 19, 22, and 33.
Fig. 7. top) Flying time savings for accepted DWR routes and observed Host route amendments, bottom) elapsed time between accepted route and Host amendment.
In this analysis we assume that if a route was accepted by AA users, and the user comments suggest a route was requested, and a Host route amendment is observed, then the route amendment is attributable to DWR automation. These are the cases where both blue and green bars are shown on the top of Fig. 7. Analysis of the accepted DWR routes, user comments, and Host amendments combined indicate that 11 AA flights were rerouted as a result of DWR automation for a total savings of 78 flying min. Additional flights may have been rerouted due to DWR (e.g., 4, 5, 11, 12, 29 in Fig. 7), but AA user comments do not confirm a reroute request was made, and some reroutes with savings similar to DWR savings are issued under today’s operations.
Since the initial August through October 2012 trial period usage of DWR at AA has increased. Work is ongoing to identify on a daily basis actual Host route amendments that correlate with accepted DWR routes.
D. Cost of Coordination Delay For any given flight on the DWR list the maximum
potential flying time savings is usually when the flight first appears on the list. After the first posting, the flying time savings generally decreases with elapsed time as the flight progresses along its current route of flight. In a few cases variations in routing and weather geometry result in more efficient solutions around weather at points downstream of the first DWR solution.
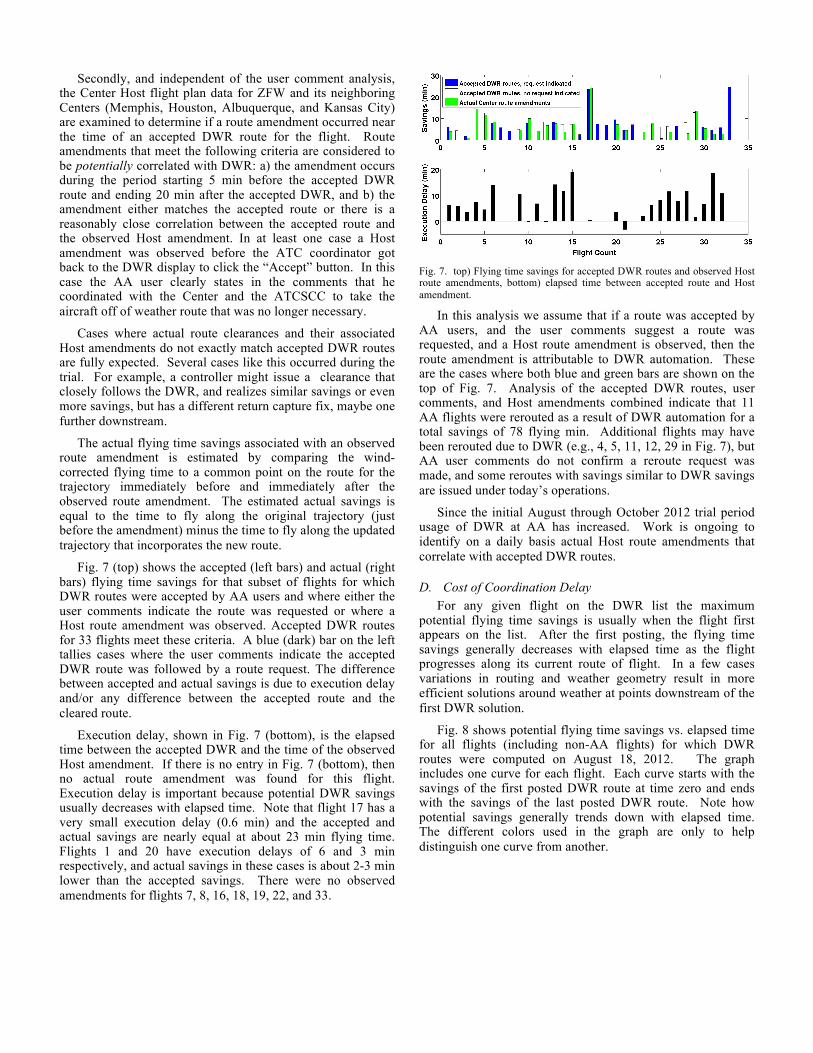
Fig. 8 shows potential flying time savings vs. elapsed time for all flights (including non-AA flights) for which DWR routes were computed on August 18, 2012. The graph includes one curve for each flight. Each curve starts with the savings of the first posted DWR route at time zero and ends with the savings of the last posted DWR route. Note how potential savings generally trends down with elapsed time. The different colors used in the graph are only to help distinguish one curve from another.
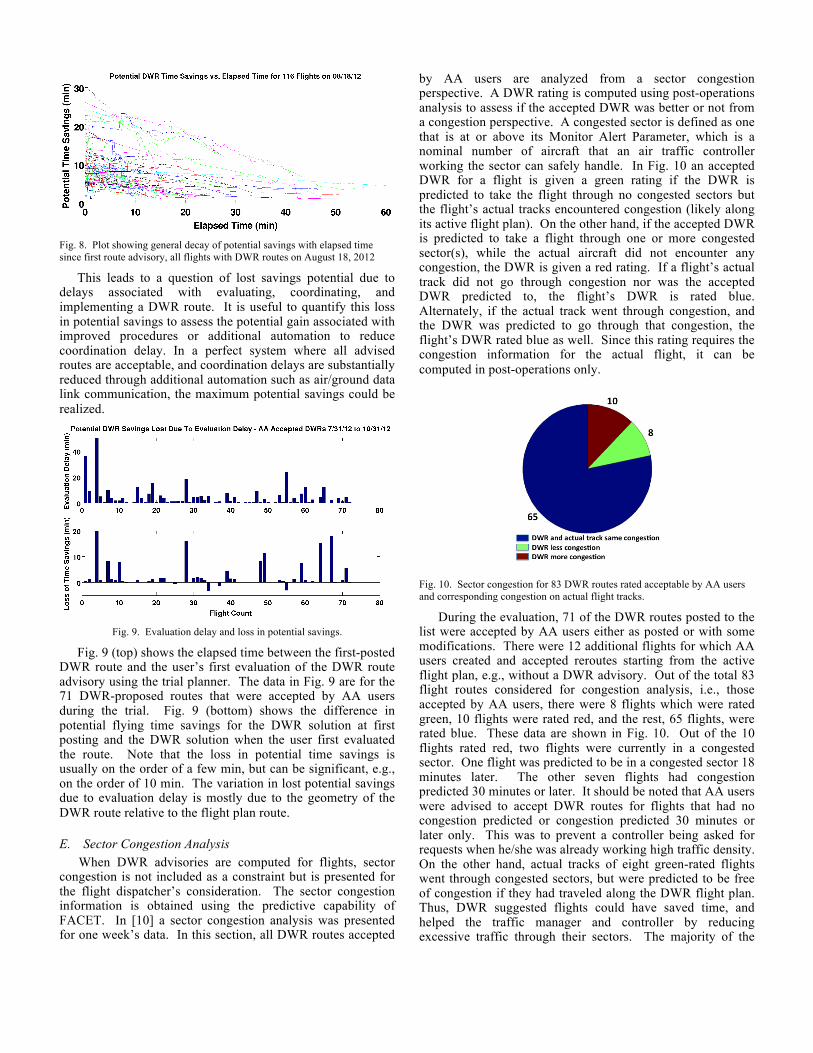
Fig. 8. Plot showing general decay of potential savings with elapsed time since first route advisory, all flights with DWR routes on August 18, 2012
This leads to a question of lost savings potential due to delays associated with evaluating, coordinating, and implementing a DWR route. It is useful to quantify this loss in potential savings to assess the potential gain associated with improved procedures or additional automation to reduce coordination delay. In a perfect system where all advised routes are acceptable, and coordination delays are substantially reduced through additional automation such as air/ground data link communication, the maximum potential savings could be realized.
Fig. 9. Evaluation delay and loss in potential savings.
Fig. 9 (top) shows the elapsed time between the first-posted DWR route and the user’s first evaluation of the DWR route advisory using the trial planner. The data in Fig. 9 are for the 71 DWR-proposed routes that were accepted by AA users during the trial. Fig. 9 (bottom) shows the difference in potential flying time savings for the DWR solution at first posting and the DWR solution when the user first evaluated the route. Note that the loss in potential time savings is usually on the order of a few min, but can be significant, e.g., on the order of 10 min. The variation in lost potential savings due to evaluation delay is mostly due to the geometry of the DWR route relative to the flight plan route.
E. Sector Congestion Analysis When DWR advisories are computed for flights, sector
congestion is not included as a constraint but is presented for the flight dispatcher’s consideration. The sector congestion information is obtained using the predictive capability of FACET. In [10] a sector congestion analysis was presented for one week’s data. In this section, all DWR routes accepted
by AA users are analyzed from a sector congestion perspective. A DWR rating is computed using post-operations analysis to assess if the accepted DWR was better or not from a congestion perspective. A congested sector is defined as one that is at or above its Monitor Alert Parameter, which is a nominal number of aircraft that an air traffic controller working the sector can safely handle. In Fig. 10 an accepted DWR for a flight is given a green rating if the DWR is predicted to take the flight through no congested sectors but the flight’s actual tracks encountered congestion (likely along its active flight plan). On the other hand, if the accepted DWR is predicted to take a flight through one or more congested sector(s), while the actual aircraft did not encounter any congestion, the DWR is given a red rating. If a flight’s actual track did not go through congestion nor was the accepted DWR predicted to, the flight’s DWR is rated blue. Alternately, if the actual track went through congestion, and the DWR was predicted to go through that congestion, the flight’s DWR rated blue as well. Since this rating requires the congestion information for the actual flight, it can be computed in post-operations only.
Fig. 10. Sector congestion for 83 DWR routes rated acceptable by AA users and corresponding congestion on actual flight tracks.
During the evaluation, 71 of the DWR routes posted to the list were accepted by AA users either as posted or with some modifications. There were 12 additional flights for which AA users created and accepted reroutes starting from the active flight plan, e.g., without a DWR advisory. Out of the total 83 flight routes considered for congestion analysis, i.e., those accepted by AA users, there were 8 flights which were rated green, 10 flights were rated red, and the rest, 65 flights, were rated blue. These data are shown in Fig. 10. Out of the 10 flights rated red, two flights were currently in a congested sector. One flight was predicted to be in a congested sector 18 minutes later. The other seven flights had congestion predicted 30 minutes or later. It should be noted that AA users were advised to accept DWR routes for flights that had no congestion predicted or congestion predicted 30 minutes or later only. This was to prevent a controller being asked for requests when he/she was already working high traffic density. On the other hand, actual tracks of eight green-rated flights went through congested sectors, but were predicted to be free of congestion if they had traveled along the DWR flight plan. Thus, DWR suggested flights could have saved time, and helped the traffic manager and controller by reducing excessive traffic through their sectors. The majority of the
other flights did not encounter congestion in actual tracks nor would have traversed congested sectors along accepted DWR routes.
F. Four AA Flights on Same Route An interesting scenario involving four AA flights over a
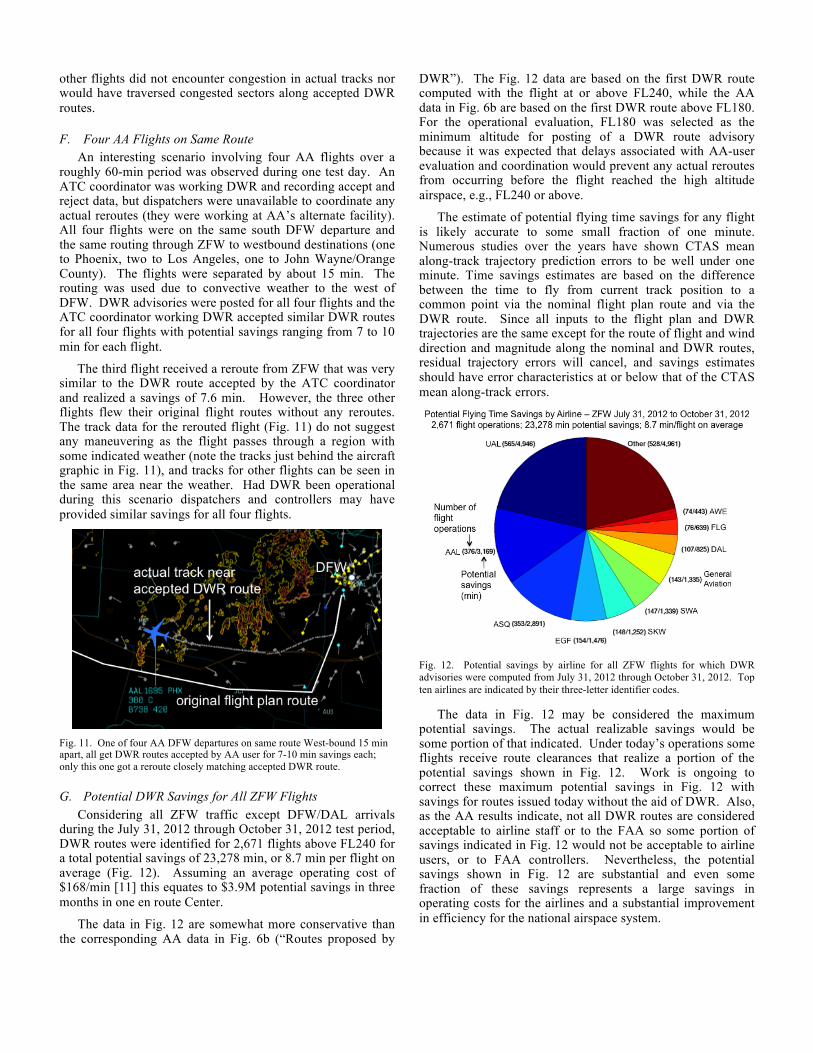
roughly 60-min period was observed during one test day. An ATC coordinator was working DWR and recording accept and reject data, but dispatchers were unavailable to coordinate any actual reroutes (they were working at AA’s alternate facility). All four flights were on the same south DFW departure and the same routing through ZFW to westbound destinations (one to Phoenix, two to Los Angeles, one to John Wayne/Orange County). The flights were separated by about 15 min. The routing was used due to convective weather to the west of DFW. DWR advisories were posted for all four flights and the ATC coordinator working DWR accepted similar DWR routes for all four flights with potential savings ranging from 7 to 10 min for each flight.
The third flight received a reroute from ZFW that was very similar to the DWR route accepted by the ATC coordinator and realized a savings of 7.6 min. However, the three other flights flew their original flight routes without any reroutes. The track data for the rerouted flight (Fig. 11) do not suggest any maneuvering as the flight passes through a region with some indicated weather (note the tracks just behind the aircraft graphic in Fig. 11), and tracks for other flights can be seen in the same area near the weather. Had DWR been operational during this scenario dispatchers and controllers may have provided similar savings for all four flights.
Fig. 11. One of four AA DFW departures on same route West-bound 15 min apart, all get DWR routes accepted by AA user for 7-10 min savings each; only this one got a reroute closely matching accepted DWR route.
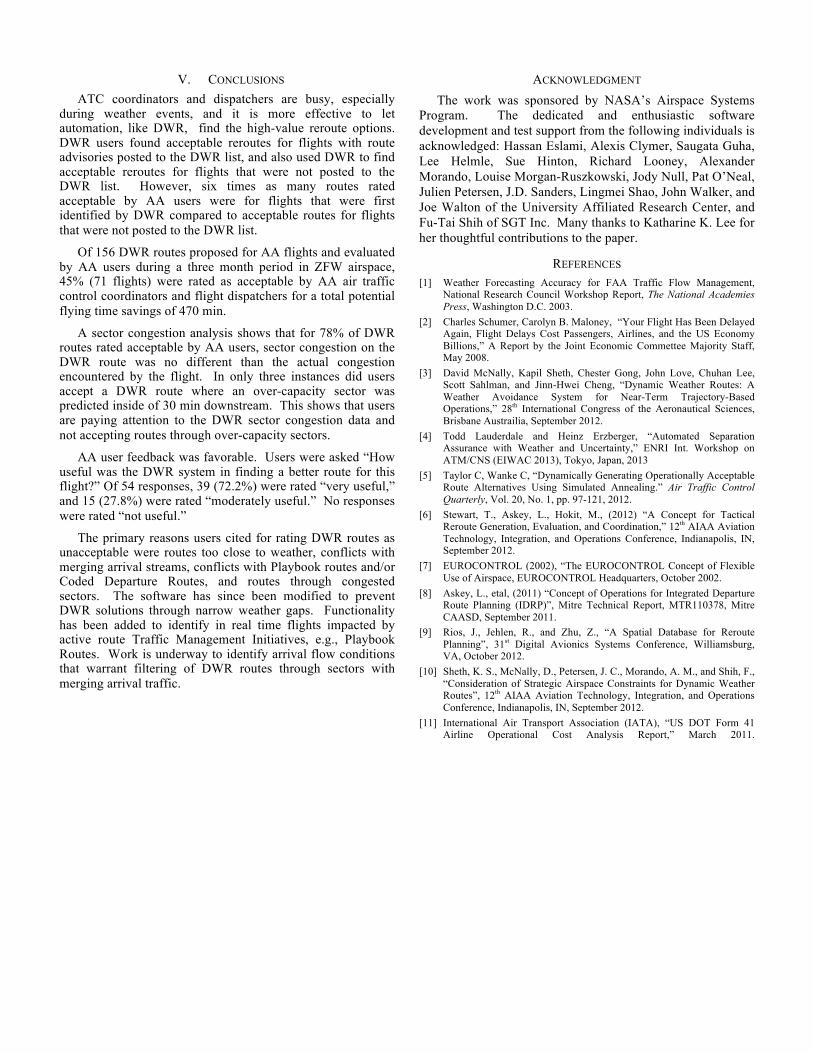
G. Potential DWR Savings for All ZFW Flights Considering all ZFW traffic except DFW/DAL arrivals
during the July 31, 2012 through October 31, 2012 test period, DWR routes were identified for 2,671 flights above FL240 for a total potential savings of 23,278 min, or 8.7 min per flight on average (Fig. 12). Assuming an average operating cost of $168/min [11] this equates to $3.9M potential savings in three months in one en route Center.
The data in Fig. 12 are somewhat more conservative than the corresponding AA data in Fig. 6b (“Routes proposed by
DWR”). The Fig. 12 data are based on the first DWR route computed with the flight at or above FL240, while the AA data in Fig. 6b are based on the first DWR route above FL180. For the operational evaluation, FL180 was selected as the minimum altitude for posting of a DWR route advisory because it was expected that delays associated with AA-user evaluation and coordination would prevent any actual reroutes from occurring before the flight reached the high altitude airspace, e.g., FL240 or above.
The estimate of potential flying time savings for any flight is likely accurate to some small fraction of one minute. Numerous studies over the years have shown CTAS mean along-track trajectory prediction errors to be well under one minute. Time savings estimates are based on the difference between the time to fly from current track position to a common point via the nominal flight plan route and via the DWR route. Since all inputs to the flight plan and DWR trajectories are the same except for the route of flight and wind direction and magnitude along the nominal and DWR routes, residual trajectory errors will cancel, and savings estimates should have error characteristics at or below that of the CTAS mean along-track errors.
Fig. 12. Potential savings by airline for all ZFW flights for which DWR advisories were computed from July 31, 2012 through October 31, 2012. Top ten airlines are indicated by their three-letter identifier codes.
The data in Fig. 12 may be considered the maximum potential savings. The actual realizable savings would be some portion of that indicated. Under today’s operations some flights receive route clearances that realize a portion of the potential savings shown in Fig. 12. Work is ongoing to correct these maximum potential savings in Fig. 12 with savings for routes issued today without the aid of DWR. Also, as the AA results indicate, not all DWR routes are considered acceptable to airline staff or to the FAA so some portion of savings indicated in Fig. 12 would not be acceptable to airline users, or to FAA controllers. Nevertheless, the potential savings shown in Fig. 12 are substantial and even some fraction of these savings represents a large savings in operating costs for the airlines and a substantial improvement in efficiency for the national airspace system.
V. CONCLUSIONS ATC coordinators and dispatchers are busy, especially
during weather events, and it is more effective to let automation, like DWR, find the high-value reroute options. DWR users found acceptable reroutes for flights with route advisories posted to the DWR list, and also used DWR to find acceptable reroutes for flights that were not posted to the DWR list. However, six times as many routes rated acceptable by AA users were for flights that were first identified by DWR compared to acceptable routes for flights that were not posted to the DWR list.
Of 156 DWR routes proposed for AA flights and evaluated by AA users during a three month period in ZFW airspace, 45% (71 flights) were rated as acceptable by AA air traffic control coordinators and flight dispatchers for a total potential flying time savings of 470 min.
A sector congestion analysis shows that for 78% of DWR routes rated acceptable by AA users, sector congestion on the DWR route was no different than the actual congestion encountered by the flight. In only three instances did users accept a DWR route where an over-capacity sector was predicted inside of 30 min downstream. This shows that users are paying attention to the DWR sector congestion data and not accepting routes through over-capacity sectors.
AA user feedback was favorable. Users were asked “How useful was the DWR system in finding a better route for this flight?” Of 54 responses, 39 (72.2%) were rated “very useful,” and 15 (27.8%) were rated “moderately useful.” No responses were rated “not useful.”
The primary reasons users cited for rating DWR routes as unacceptable were routes too close to weather, conflicts with merging arrival streams, conflicts with Playbook routes and/or Coded Departure Routes, and routes through congested sectors. The software has since been modified to prevent DWR solutions through narrow weather gaps. Functionality has been added to identify in real time flights impacted by active route Traffic Management Initiatives, e.g., Playbook Routes. Work is underway to identify arrival flow conditions that warrant filtering of DWR routes through sectors with merging arrival traffic.
ACKNOWLEDGMENT The work was sponsored by NASA’s Airspace Systems
Program. The dedicated and enthusiastic software development and test support from the following individuals is acknowledged: Hassan Eslami, Alexis Clymer, Saugata Guha, Lee Helmle, Sue Hinton, Richard Looney, Alexander Morando, Louise Morgan-Ruszkowski, Jody Null, Pat O’Neal, Julien Petersen, J.D. Sanders, Lingmei Shao, John Walker, and Joe Walton of the University Affiliated Research Center, and Fu-Tai Shih of SGT Inc. Many thanks to Katharine K. Lee for her thoughtful contributions to the paper.
REFERENCES [1] Weather Forecasting Accuracy for FAA Traffic Flow Management,
National Research Council Workshop Report, The National Academies Press, Washington D.C. 2003.
[2] Charles Schumer, Carolyn B. Maloney, “Your Flight Has Been Delayed Again, Flight Delays Cost Passengers, Airlines, and the US Economy Billions,” A Report by the Joint Economic Commettee Majority Staff, May 2008.
[3] David McNally, Kapil Sheth, Chester Gong, John Love, Chuhan Lee, Scott Sahlman, and Jinn-Hwei Cheng, “Dynamic Weather Routes: A Weather Avoidance System for Near-Term Trajectory-Based Operations,” 28th International Congress of the Aeronautical Sciences, Brisbane Austrailia, September 2012.
[4] Todd Lauderdale and Heinz Erzberger, “Automated Separation Assurance with Weather and Uncertainty,” ENRI Int. Workshop on ATM/CNS (EIWAC 2013), Tokyo, Japan, 2013
[5] Taylor C, Wanke C, “Dynamically Generating Operationally Acceptable Route Alternatives Using Simulated Annealing.” Air Traffic Control Quarterly, Vol. 20, No. 1, pp. 97-121, 2012.
[6] Stewart, T., Askey, L., Hokit, M., (2012) “A Concept for Tactical Reroute Generation, Evaluation, and Coordination,” 12th AIAA Aviation Technology, Integration, and Operations Conference, Indianapolis, IN, September 2012.
[7] EUROCONTROL (2002), “The EUROCONTROL Concept of Flexible Use of Airspace, EUROCONTROL Headquarters, October 2002.
[8] Askey, L., etal, (2011) “Concept of Operations for Integrated Departure Route Planning (IDRP)”, Mitre Technical Report, MTR110378, Mitre CAASD, September 2011.
[9] Rios, J., Jehlen, R., and Zhu, Z., “A Spatial Database for Reroute Planning”, 31st Digital Avionics Systems Conference, Williamsburg, VA, October 2012.
[10] Sheth, K. S., McNally, D., Petersen, J. C., Morando, A. M., and Shih, F., “Consideration of Strategic Airspace Constraints for Dynamic Weather Routes”, 12th AIAA Aviation Technology, Integration, and Operations Conference, Indianapolis, IN, September 2012.
[11] International Air Transport Association (IATA), “US DOT Form 41 Airline Operational Cost Analysis Report,” March 2011.