Embed Size (px)
Citation preview
Operational Reliability Assessment of a Remotely Controlled Siphon System for Draining Shallow Storage Ponds
Linlong Bian1; Vivek Verma2; Aditia Rojiali3; Dogukan Ozecik4; and Arturo S. Leon5
1Dept. of Civil and Environmental Engineering, Florida International Univ. Email: [email protected] 2Dept. of Civil and Environmental Engineering, Florida International Univ. Email: [email protected] 3Dept. of Civil and Environmental Engineering, Florida International Univ. Email: [email protected] 4Dept. of Civil and Environmental Engineering, Florida International Univ. Email: [email protected] 5Dept. of Civil and Environmental Engineering, Florida International Univ. Email: [email protected] ABSTRACT
This paper presents the operational reliability assessment of a remotely controlled siphon
system. The siphon system mostly consists of water level switches, air vents, bilge pumps, and an actuated butterfly valve. In this study, the reliability block diagram (RBD) model based on the ExtendSim software is employed to assess a remotely controlled siphon system’s operational reliability. The Monte Carlo simulation results from the RBD model demonstrate that the non-repairable siphon system’s operational availability can be enhanced from 0.683 to 0.855 within a 1-year life cycle by increasing the safety factor to 2 for the vulnerable components, such as the water level switch and the air vent. The value can increase to 0.999 when adopting an on-site maintenance strategy. Based on the analysis of multiple scenarios and maintenance strategies, a suitable architecture of the siphon system is proposed herein. INTRODUCTION
Operational reliability can be defined as the mean of the probability that a system is functioning adequately over any given time (Chen 2013). It is also defined as the average availability of a system, reflecting the system's ability to operate continuously (Trivedi 2012). The operational reliability index is widely used to optimize system design, performance, and operational strategy. The simulation approach is often employed to evaluate the operational reliability of the system (Raje 2000).
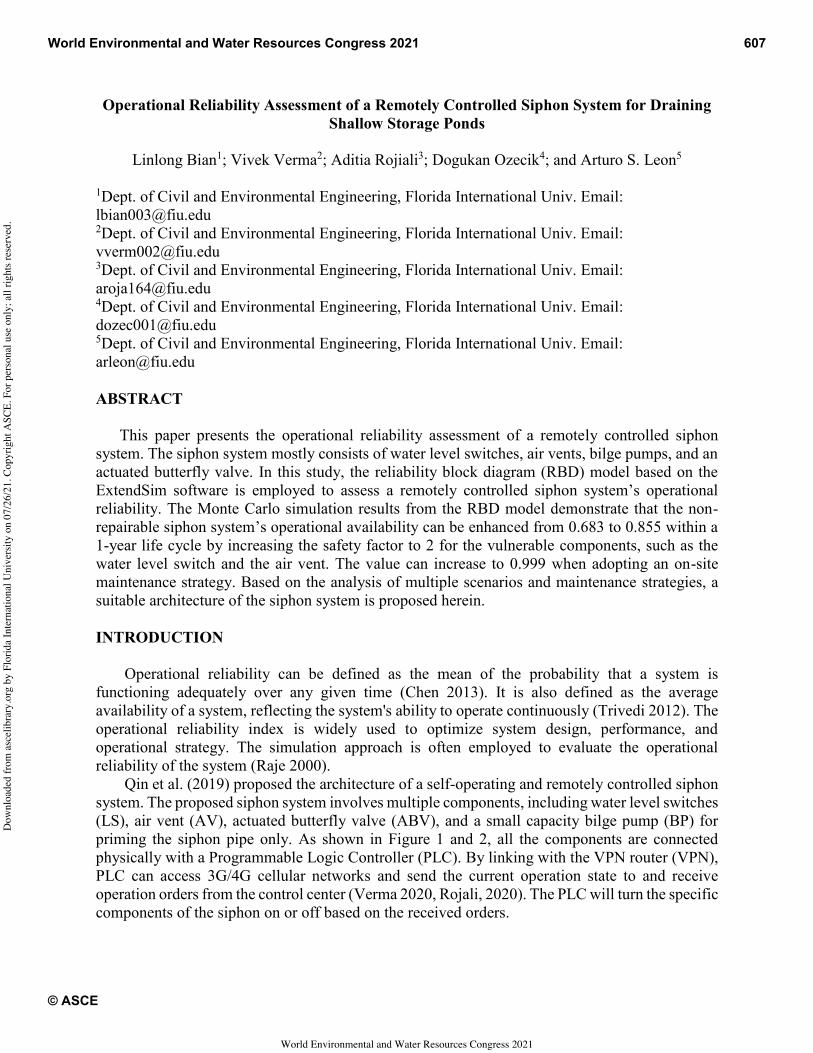
Qin et al. (2019) proposed the architecture of a self-operating and remotely controlled siphon system. The proposed siphon system involves multiple components, including water level switches (LS), air vent (AV), actuated butterfly valve (ABV), and a small capacity bilge pump (BP) for priming the siphon pipe only. As shown in Figure 1 and 2, all the components are connected physically with a Programmable Logic Controller (PLC). By linking with the VPN router (VPN), PLC can access 3G/4G cellular networks and send the current operation state to and receive operation orders from the control center (Verma 2020, Rojali, 2020). The PLC will turn the specific components of the siphon on or off based on the received orders.
World Environmental and Water Resources Congress 2021 607
© ASCE
World Environmental and Water Resources Congress 2021
Dow
nloa
ded
from
asc
elib
rary
.org
by
Flor
ida
Inte
rnat
iona
l Uni
vers
ity o
n 07
/26/
21. C
opyr
ight
ASC
E. F
or p
erso
nal u
se o
nly;
all
right
s res
erve
d.
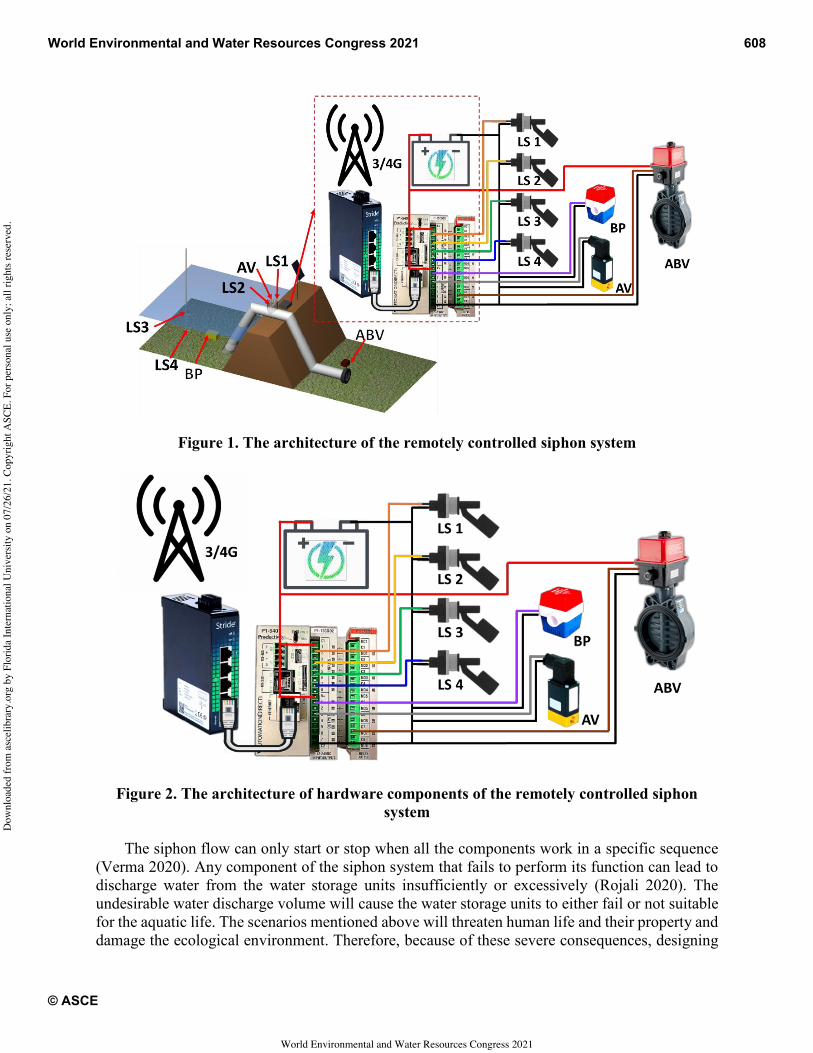
Figure 1. The architecture of the remotely controlled siphon system
Figure 2. The architecture of hardware components of the remotely controlled siphon system
The siphon flow can only start or stop when all the components work in a specific sequence
(Verma 2020). Any component of the siphon system that fails to perform its function can lead to discharge water from the water storage units insufficiently or excessively (Rojali 2020). The undesirable water discharge volume will cause the water storage units to either fail or not suitable for the aquatic life. The scenarios mentioned above will threaten human life and their property and damage the ecological environment. Therefore, because of these severe consequences, designing
World Environmental and Water Resources Congress 2021 608
© ASCE
World Environmental and Water Resources Congress 2021
Dow
nloa
ded
from
asc
elib
rary
.org
by
Flor
ida
Inte
rnat
iona
l Uni
vers
ity o
n 07
/26/
21. C
opyr
ight
ASC
E. F
or p
erso
nal u
se o
nly;
all
right
s res
erve
d.
a durable and reliable siphon system is necessary. However, most of the components are exposed in the natural environment in the practical application, thereby facing threats caused by plenty of uncertainties and unknown factors, such as short circuits, animal and insect bites, and chemical corrosion. These hazards are likely to cause the malfunction of the siphon components. Therefore, it is significant to comprehensively understand the siphon's operational reliability within the life cycle. Based on the evaluation of the remotely controlled siphon system's operational reliability, this study will help identify the vulnerable components, propose the siphon system's optimized architecture, and suggest reasonable maintenance strategies under the different working scenarios. METHODOLOGY RBD model based on ExtendSim
Many methods have been developed to analyze a system's reliability, and each method has its advantages and disadvantages. Traditional approaches, such as the Markov model (Trivedi 2001, Veeraraghavan 1994) and Petri nets (PNs) (Malhotra 1995) (Bobbio 2003), are based on an analytic solution. These methods need stringent assumptions about the system, such as the lifetime distribution of the system's components having to obey the exponential distribution, and the failure possibility has to be independent for all the components. However, in reality, many systems can hardly meet these strict conditions. Therefore, the above analytic approaches' application scope is limited in the case of the complex systems since the model is hard to obtain directly from the specifications or descriptions of a system (Distefano 2009) (Chen 2012). Such inconvenience led to the development of the conception of Reliability Block Diagrams (RBDs), Fault trees (FTs), and Reliability Graphs (RGs), which is more user-friendly.
As an efficient tool, RBD has been widely used in reliability engineering for many years (Guo 2007). Its significant advantage in evaluating a complex system's operational reliability is that RBD describes a concerned system graphically. Graphic blocks can connect all the system components by their functional logic or working relationship. Therefore, a complex system becomes intuitive and easy to be built and read in the form of RBDs (Wang 2004) (Distefano 2006) (Guo 2007). However, RBD is only used for the non-repairable system (Distefano 2007) (Rausand 2004).
According to this limitation, the Reliability Module based on ExtendSim software has been developed by Imagine That Company to achieve RBD application for both repairable and non-repairable systems. On ExtendSim software, a reliability model is built by different functional blocks that store in the Reliability Library. In addition to its intuitive and user-friendly advantage, the ExtendSim RBD can simulate the complex system's maintenance process. By applying the Monte Carlo method to repeat the simulation many times, the ExtendSim RBD model can provide the accurate results of the component reliability, the meantime to failure, and the operational reliability of both non-repairable and repairable system. The function of the main blocks used to develop an RBD model are described in Table 1(Krahl 2014). Operational reliability
In the RBDs, each graphic block represents one physical component in the system with an associated mathematical function or a simulation model. There are only two possible working states for all the components, a functioning state (UP) and a failed state (DOWN), which can be described as Equation 1.
World Environmental and Water Resources Congress 2021 609
© ASCE
World Environmental and Water Resources Congress 2021
Dow
nloa
ded
from
asc
elib
rary
.org
by
Flor
ida
Inte
rnat
iona
l Uni
vers
ity o
n 07
/26/
21. C
opyr
ight
ASC
E. F
or p
erso
nal u
se o
nly;
all
right
s res
erve
d.
Table 1. The declaration of RBD functional blocks
Block Library/Name Block Function
Reliability Start Node
Performs the RBD's essential tasks, manages the RBD's behavior over time, and can be thought of as the RBD brain. Can alternate between up and down states due to event cycles that have been defined in the Event Builder.
Reliability Component
Represent the system's component. Over time, components alternate between up and down states due to event cycles that have been defined in the Event Builder.
Reliability End Node End the RBD and reports its status.
Reliability Event Builder
Creates classes of event cycles for use by the Start Node and Component blocks to model and RBD's up and down states over time.
Reliability Distribution Builder
Creates, stores, and provides statistical distribution definitions for time-between-downs (TBD), time-to-down (TTD), and time-to-up (TTU) to be used in the Event Builder block
Item Executive Manages the events that have been scheduled by the Start Node.
X(t) = 1 0 if the component is functioning at time t
if the component is not functioning at time t 𝐸𝑞. 1
The two-parameter Weibull distribution is applied in this study to simulate all the components'
lifetime distribution due to its flexibility and widespread application in the reliability engineering industry (Xie 1996, Zhang 2007, Fu 2019).
Assume that a component enters in operation at time t = 0 and the time to failure (TTF) T is continuously distributed with the probability density function as shown in Equation 2 𝑡 ~ Weibull(훼, ), = 훽 , where 훼 is the shape parameter, and 훽 is a scale parameter, also called characteristic lifetime.
𝑓(𝑡) = 훼휆 𝑡 𝑒 ( )
0 𝑓𝑜𝑟 𝑡 > 0
𝑜𝑡ℎ𝑒𝑟푤𝑖𝑠𝑒𝐸𝑞. 2
The probability of the component to fail within the time interval (0, t) can be described by
Equation 3. Thus, the reliability of the component can be described as Equation 4, and the meantime to fail (MTTF) can be denoted by Equation 5.
𝐹(𝑡) = 𝑃𝑟(𝑇 ≤ 𝑡) = 𝑎휆 푥 𝑒 ( ) 𝑑푥 = 1 − 𝑒 ( ) 𝐸𝑞. 3
World Environmental and Water Resources Congress 2021 610
© ASCE
World Environmental and Water Resources Congress 2021
Dow
nloa
ded
from
asc
elib
rary
.org
by
Flor
ida
Inte
rnat
iona
l Uni
vers
ity o
n 07
/26/
21. C
opyr
ight
ASC
E. F
or p
erso
nal u
se o
nly;
all
right
s res
erve
d.
𝑅(𝑡) = 1 − 𝐹(𝑡) = 𝑒 ( ) 𝐸𝑞. 4
MTTF = R(t)∞
𝑑𝑡 =1휆
Г1훼
+ 1 𝐸𝑞. 5
According to this definition, Equation 6 's operational reliability can be expressed where OT
is the operational time or the life cycle time. For the reparable system, OT can be described by Equation 7.
𝑂𝑅 = A = min𝑀𝑇𝑇𝐹
𝑂𝑇, 1 𝐸𝑞. 6
OT = 𝑀𝑇𝑇𝐹 + 𝑀𝑇𝑇𝑅 𝐸𝑞. 7
Where 𝑀𝑇𝑇𝑅 indicates mean time to repair, which also can be assumed as a Weibull
distribution. Generally, there are two main types of connections for the components in a system. The
components can be configured in either series or parallel. It is necessary for all the series-connected components in a subsystem to be functioning for the subsystem to function. On the contrary, the components connected in parallel indicate redundancy. The safety factor can be increased by introducing redundancy of the vulnerable component. Redundancy can be introduced by adding identical components are connected in parallel with the vulnerable component. Since the traditional safety factor conception is not suitable for our study, we define that the safety factor equals the degree of redundancy plus 1. It should be noticed that our defined conception is only applied in the current study. The degree of redundancy equals the number of duplicated components. Only one of the parallel components needs to function for the subsystem to function. By applying this approach, any complex system can be expressed as a parallel-series system.
The subsystem reliability for all the non-repairable components with series connection is given by
𝑅 (𝑡) = 𝑅 (𝑡) 𝐸𝑞. 8
The subsystem reliability for all non-repairable components with parallel connection is given
by
𝑅 (𝑡) = 1 − 1 − 𝑅 (𝑡) 𝐸𝑞. 9
The above analysis shows that the system operational reliability depends on 1) the reliability
of the components of the system; 2) the configuration or topology (series or parallel), and 3) the system maintenance strategy (MTTR).
World Environmental and Water Resources Congress 2021 611
© ASCE
World Environmental and Water Resources Congress 2021
Dow
nloa
ded
from
asc
elib
rary
.org
by
Flor
ida
Inte
rnat
iona
l Uni
vers
ity o
n 07
/26/
21. C
opyr
ight
ASC
E. F
or p
erso
nal u
se o
nly;
all
right
s res
erve
d.
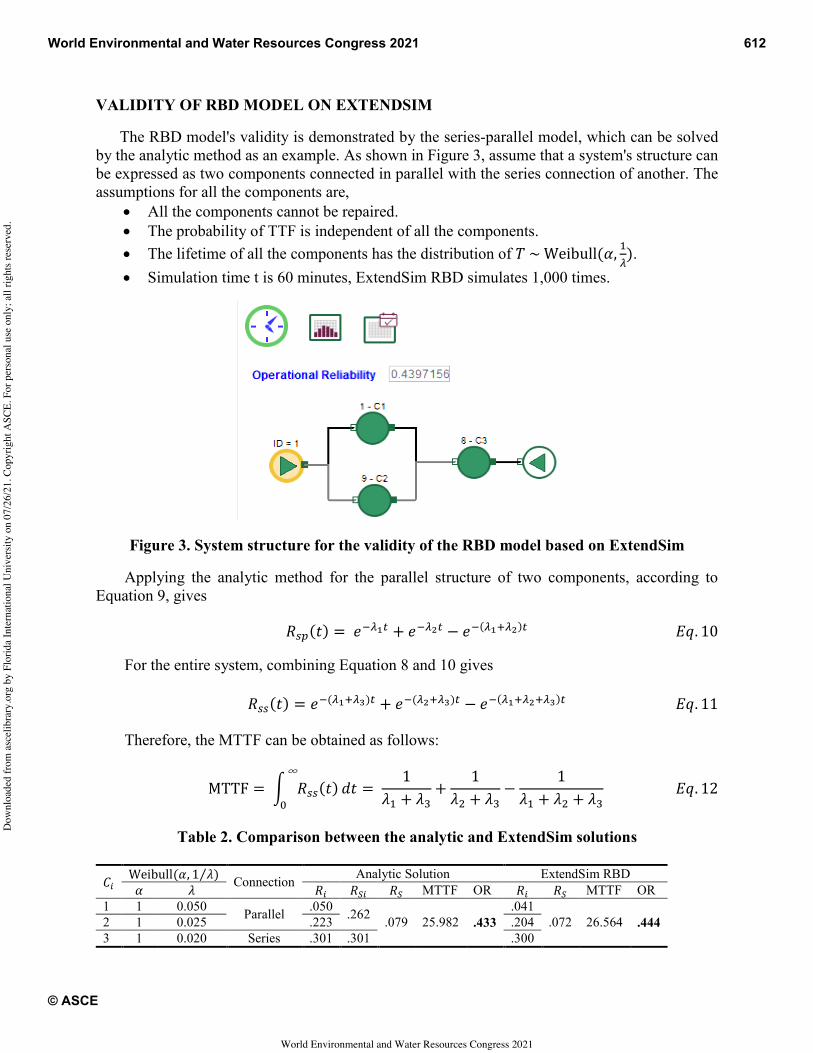
VALIDITY OF RBD MODEL ON EXTENDSIM
The RBD model's validity is demonstrated by the series-parallel model, which can be solved by the analytic method as an example. As shown in Figure 3, assume that a system's structure can be expressed as two components connected in parallel with the series connection of another. The assumptions for all the components are,
x All the components cannot be repaired. x The probability of TTF is independent of all the components. x The lifetime of all the components has the distribution of 𝑇 ~ Weibull(훼, ). x Simulation time t is 60 minutes, ExtendSim RBD simulates 1,000 times.
Figure 3. System structure for the validity of the RBD model based on ExtendSim
Applying the analytic method for the parallel structure of two components, according to Equation 9, gives
𝑅 (𝑡) = 𝑒 + 𝑒 − 𝑒 ( ) 𝐸𝑞. 10
For the entire system, combining Equation 8 and 10 gives
𝑅 (𝑡) = 𝑒 ( ) + 𝑒 ( ) − 𝑒 ( ) 𝐸𝑞. 11
Therefore, the MTTF can be obtained as follows:
MTTF = 𝑅 (𝑡)∞
𝑑𝑡 = 1
휆 + 휆+
1휆 + 휆
−1
휆 + 휆 + 휆𝐸𝑞. 12
Table 2. Comparison between the analytic and ExtendSim solutions
𝐶 Weibull(훼, 1 휆⁄ ) Connection Analytic Solution ExtendSim RBD
훼 휆 𝑅 𝑅 𝑅 MTTF OR 𝑅 𝑅 MTTF OR 1 1 0.050 Parallel .050 .262 .079 25.982 .433
.041 .072 26.564 .444 2 1 0.025 .223 .204
3 1 0.020 Series .301 .301 .300
World Environmental and Water Resources Congress 2021 612
© ASCE
World Environmental and Water Resources Congress 2021
Dow
nloa
ded
from
asc
elib
rary
.org
by
Flor
ida
Inte
rnat
iona
l Uni
vers
ity o
n 07
/26/
21. C
opyr
ight
ASC
E. F
or p
erso
nal u
se o
nly;
all
right
s res
erve
d.
As shown in Table 2, the operational reliability calculated by the analytic method and ExtendSim RBD is 0.433 and 0.444, respectively. The difference between them is only 2.5%.
According to the Monte Carlo theory, it has 𝑅 =∞
∑ 𝑋 (𝑗) ≅∞ , where 𝑁 is the number of
successful simulations and N the total number of simulations. For a sufficiently large N, this method is guaranteed to converge to the actual expected value due to the law of large numbers (Hockenberry 2004). The experiment has been performed 1,000 times; the results' accuracy is acceptable. Therefore, the results from ExtendSim RBD can be deemed reliable. RBD MODEL FOR THE SIPHON SYSTEM
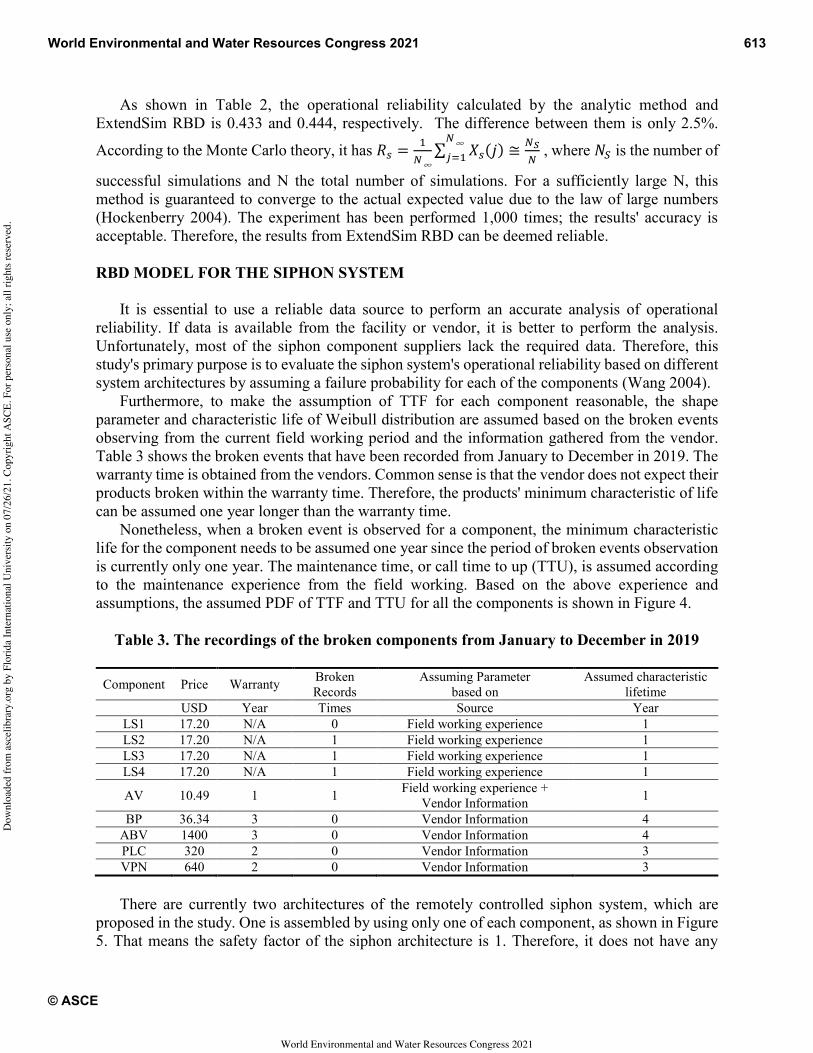
It is essential to use a reliable data source to perform an accurate analysis of operational reliability. If data is available from the facility or vendor, it is better to perform the analysis. Unfortunately, most of the siphon component suppliers lack the required data. Therefore, this study's primary purpose is to evaluate the siphon system's operational reliability based on different system architectures by assuming a failure probability for each of the components (Wang 2004).
Furthermore, to make the assumption of TTF for each component reasonable, the shape parameter and characteristic life of Weibull distribution are assumed based on the broken events observing from the current field working period and the information gathered from the vendor. Table 3 shows the broken events that have been recorded from January to December in 2019. The warranty time is obtained from the vendors. Common sense is that the vendor does not expect their products broken within the warranty time. Therefore, the products' minimum characteristic of life can be assumed one year longer than the warranty time.
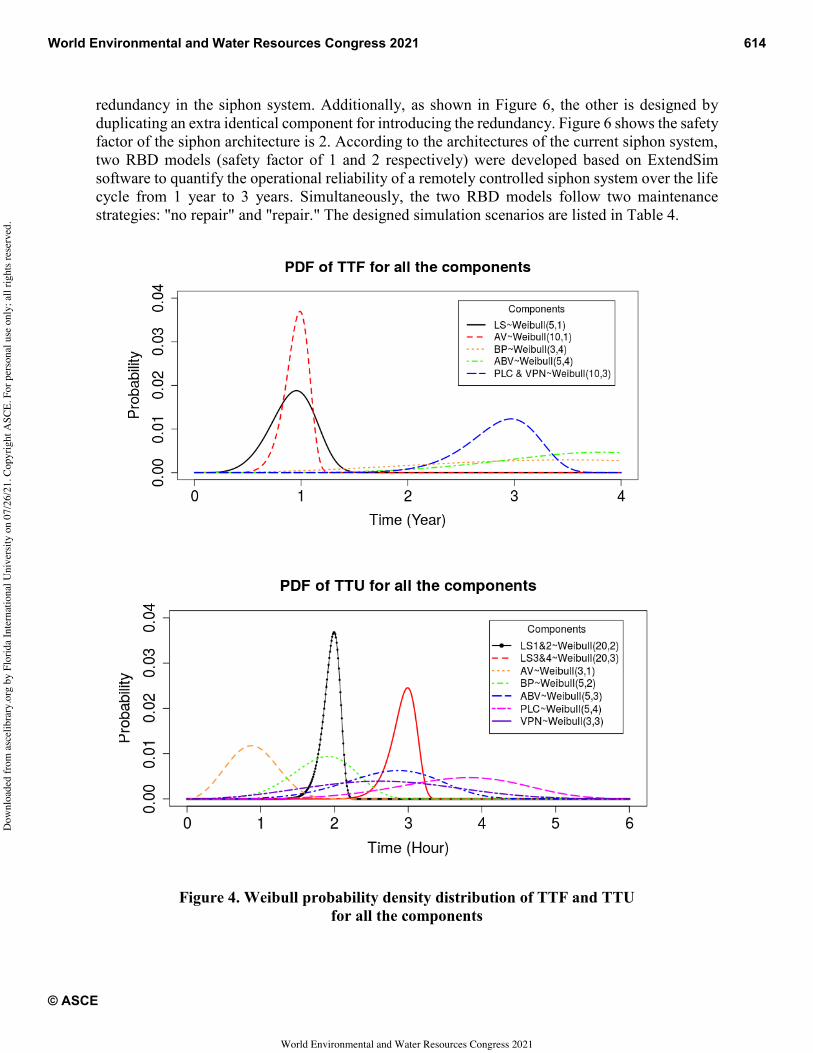
Nonetheless, when a broken event is observed for a component, the minimum characteristic life for the component needs to be assumed one year since the period of broken events observation is currently only one year. The maintenance time, or call time to up (TTU), is assumed according to the maintenance experience from the field working. Based on the above experience and assumptions, the assumed PDF of TTF and TTU for all the components is shown in Figure 4.
Table 3. The recordings of the broken components from January to December in 2019
Component Price Warranty Broken Records
Assuming Parameter based on
Assumed characteristic lifetime
USD Year Times Source Year LS1 17.20 N/A 0 Field working experience 1 LS2 17.20 N/A 1 Field working experience 1 LS3 17.20 N/A 1 Field working experience 1 LS4 17.20 N/A 1 Field working experience 1
AV 10.49 1 1 Field working experience + Vendor Information 1
BP 36.34 3 0 Vendor Information 4 ABV 1400 3 0 Vendor Information 4 PLC 320 2 0 Vendor Information 3 VPN 640 2 0 Vendor Information 3
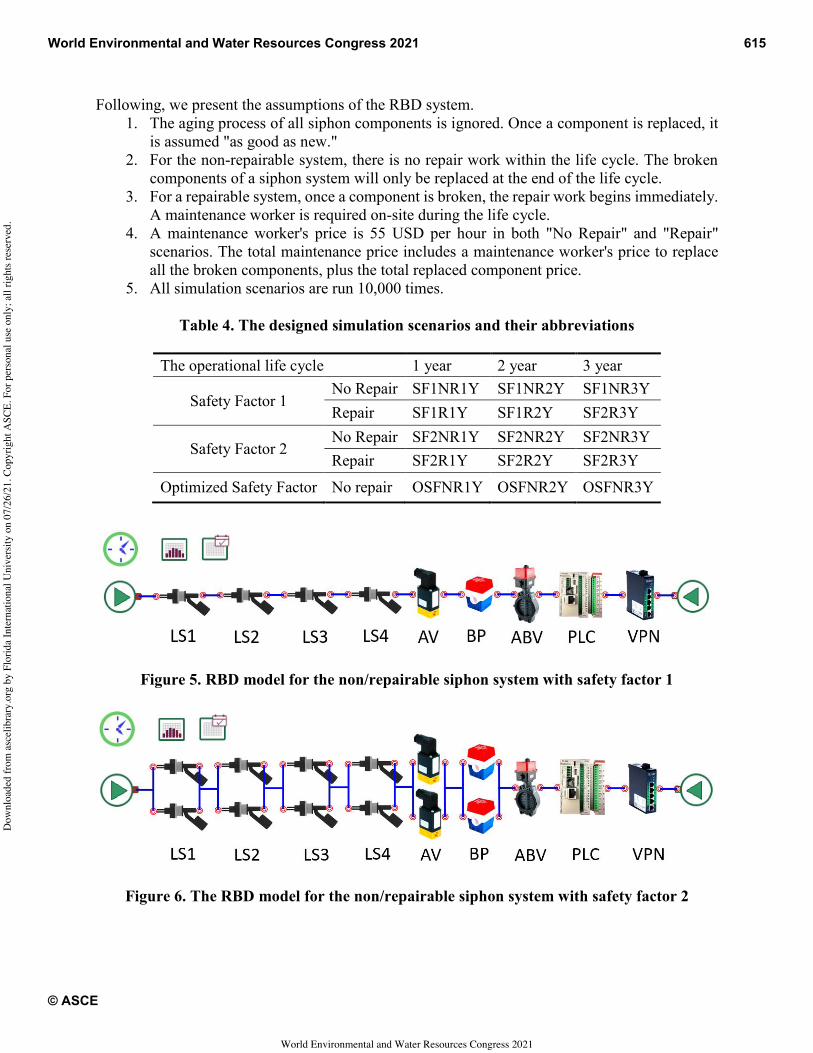
There are currently two architectures of the remotely controlled siphon system, which are
proposed in the study. One is assembled by using only one of each component, as shown in Figure 5. That means the safety factor of the siphon architecture is 1. Therefore, it does not have any
World Environmental and Water Resources Congress 2021 613
© ASCE
World Environmental and Water Resources Congress 2021
Dow
nloa
ded
from
asc
elib
rary
.org
by
Flor
ida
Inte
rnat
iona
l Uni
vers
ity o
n 07
/26/
21. C
opyr
ight
ASC
E. F
or p
erso
nal u
se o
nly;
all
right
s res
erve
d.
redundancy in the siphon system. Additionally, as shown in Figure 6, the other is designed by duplicating an extra identical component for introducing the redundancy. Figure 6 shows the safety factor of the siphon architecture is 2. According to the architectures of the current siphon system, two RBD models (safety factor of 1 and 2 respectively) were developed based on ExtendSim software to quantify the operational reliability of a remotely controlled siphon system over the life cycle from 1 year to 3 years. Simultaneously, the two RBD models follow two maintenance strategies: "no repair" and "repair." The designed simulation scenarios are listed in Table 4.
Figure 4. Weibull probability density distribution of TTF and TTU for all the components
World Environmental and Water Resources Congress 2021 614
© ASCE
World Environmental and Water Resources Congress 2021
Dow
nloa
ded
from
asc
elib
rary
.org
by
Flor
ida
Inte
rnat
iona
l Uni
vers
ity o
n 07
/26/
21. C
opyr
ight
ASC
E. F
or p
erso
nal u
se o
nly;
all
right
s res
erve
d.
Following, we present the assumptions of the RBD system. 1. The aging process of all siphon components is ignored. Once a component is replaced, it
is assumed "as good as new." 2. For the non-repairable system, there is no repair work within the life cycle. The broken
components of a siphon system will only be replaced at the end of the life cycle. 3. For a repairable system, once a component is broken, the repair work begins immediately.
A maintenance worker is required on-site during the life cycle. 4. A maintenance worker's price is 55 USD per hour in both "No Repair" and "Repair"
scenarios. The total maintenance price includes a maintenance worker's price to replace all the broken components, plus the total replaced component price.
5. All simulation scenarios are run 10,000 times.
Table 4. The designed simulation scenarios and their abbreviations
The operational life cycle 1 year 2 year 3 year
Safety Factor 1 No Repair SF1NR1Y SF1NR2Y SF1NR3Y Repair SF1R1Y SF1R2Y SF2R3Y
Safety Factor 2 No Repair SF2NR1Y SF2NR2Y SF2NR3Y Repair SF2R1Y SF2R2Y SF2R3Y
Optimized Safety Factor No repair OSFNR1Y OSFNR2Y OSFNR3Y
Figure 5. RBD model for the non/repairable siphon system with safety factor 1
Figure 6. The RBD model for the non/repairable siphon system with safety factor 2
World Environmental and Water Resources Congress 2021 615
© ASCE
World Environmental and Water Resources Congress 2021
Dow
nloa
ded
from
asc
elib
rary
.org
by
Flor
ida
Inte
rnat
iona
l Uni
vers
ity o
n 07
/26/
21. C
opyr
ight
ASC
E. F
or p
erso
nal u
se o
nly;
all
right
s res
erve
d.
RESULTS
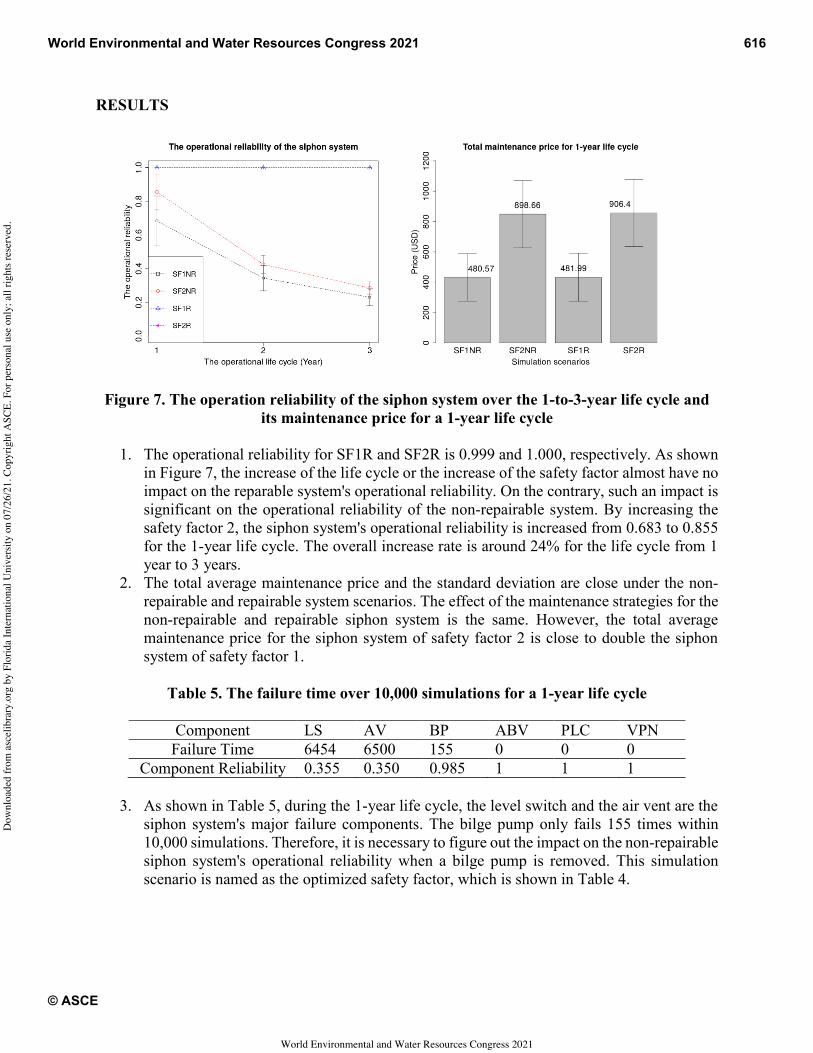
Figure 7. The operation reliability of the siphon system over the 1-to-3-year life cycle and its maintenance price for a 1-year life cycle
1. The operational reliability for SF1R and SF2R is 0.999 and 1.000, respectively. As shown
in Figure 7, the increase of the life cycle or the increase of the safety factor almost have no impact on the reparable system's operational reliability. On the contrary, such an impact is significant on the operational reliability of the non-repairable system. By increasing the safety factor 2, the siphon system's operational reliability is increased from 0.683 to 0.855 for the 1-year life cycle. The overall increase rate is around 24% for the life cycle from 1 year to 3 years.
2. The total average maintenance price and the standard deviation are close under the non-repairable and repairable system scenarios. The effect of the maintenance strategies for the non-repairable and repairable siphon system is the same. However, the total average maintenance price for the siphon system of safety factor 2 is close to double the siphon system of safety factor 1.
Table 5. The failure time over 10,000 simulations for a 1-year life cycle
Component LS AV BP ABV PLC VPN
Failure Time 6454 6500 155 0 0 0 Component Reliability 0.355 0.350 0.985 1 1 1
3. As shown in Table 5, during the 1-year life cycle, the level switch and the air vent are the
siphon system's major failure components. The bilge pump only fails 155 times within 10,000 simulations. Therefore, it is necessary to figure out the impact on the non-repairable siphon system's operational reliability when a bilge pump is removed. This simulation scenario is named as the optimized safety factor, which is shown in Table 4.
World Environmental and Water Resources Congress 2021 616
© ASCE
World Environmental and Water Resources Congress 2021
Dow
nloa
ded
from
asc
elib
rary
.org
by
Flor
ida
Inte
rnat
iona
l Uni
vers
ity o
n 07
/26/
21. C
opyr
ight
ASC
E. F
or p
erso
nal u
se o
nly;
all
right
s res
erve
d.
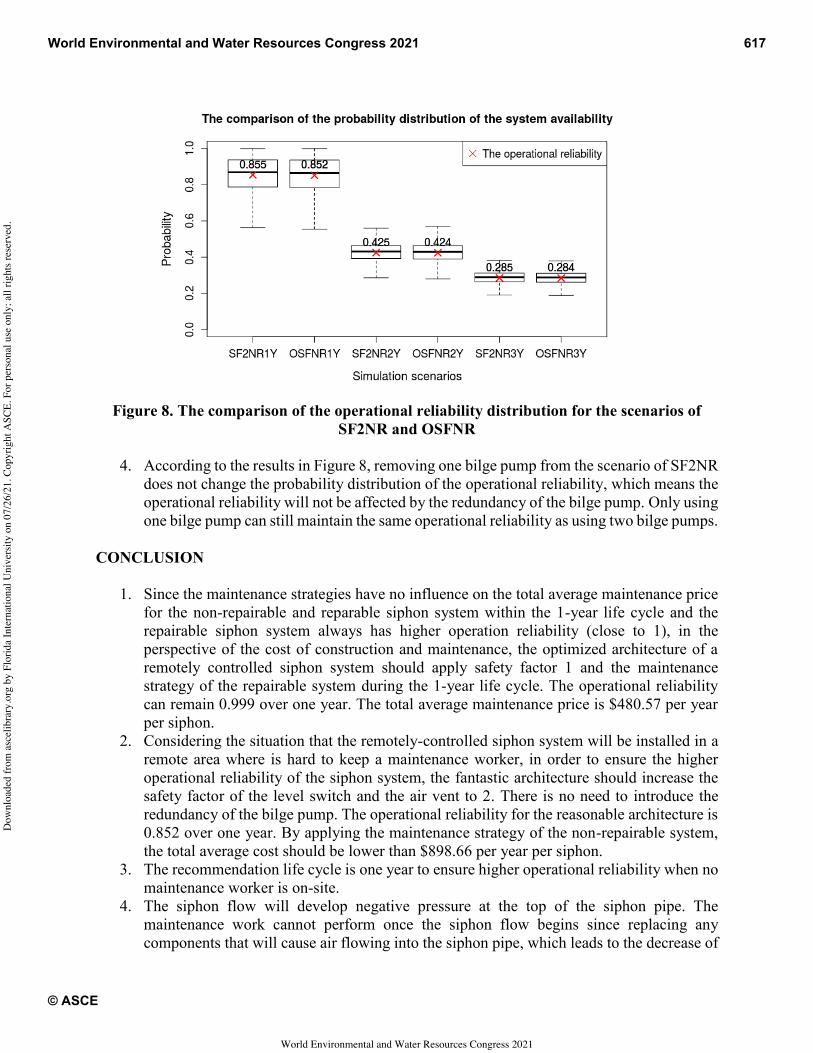
Figure 8. The comparison of the operational reliability distribution for the scenarios of SF2NR and OSFNR
4. According to the results in Figure 8, removing one bilge pump from the scenario of SF2NR
does not change the probability distribution of the operational reliability, which means the operational reliability will not be affected by the redundancy of the bilge pump. Only using one bilge pump can still maintain the same operational reliability as using two bilge pumps.
CONCLUSION
1. Since the maintenance strategies have no influence on the total average maintenance price for the non-repairable and reparable siphon system within the 1-year life cycle and the repairable siphon system always has higher operation reliability (close to 1), in the perspective of the cost of construction and maintenance, the optimized architecture of a remotely controlled siphon system should apply safety factor 1 and the maintenance strategy of the repairable system during the 1-year life cycle. The operational reliability can remain 0.999 over one year. The total average maintenance price is $480.57 per year per siphon.
2. Considering the situation that the remotely-controlled siphon system will be installed in a remote area where is hard to keep a maintenance worker, in order to ensure the higher operational reliability of the siphon system, the fantastic architecture should increase the safety factor of the level switch and the air vent to 2. There is no need to introduce the redundancy of the bilge pump. The operational reliability for the reasonable architecture is 0.852 over one year. By applying the maintenance strategy of the non-repairable system, the total average cost should be lower than $898.66 per year per siphon.
3. The recommendation life cycle is one year to ensure higher operational reliability when no maintenance worker is on-site.
4. The siphon flow will develop negative pressure at the top of the siphon pipe. The maintenance work cannot perform once the siphon flow begins since replacing any components that will cause air flowing into the siphon pipe, which leads to the decrease of
World Environmental and Water Resources Congress 2021 617
© ASCE
World Environmental and Water Resources Congress 2021
Dow
nloa
ded
from
asc
elib
rary
.org
by
Flor
ida
Inte
rnat
iona
l Uni
vers
ity o
n 07
/26/
21. C
opyr
ight
ASC
E. F
or p
erso
nal u
se o
nly;
all
right
s res
erve
d.
the negative pressure until the siphon flow stops. Therefore, the results of SF2R has no practical significance in the application. Therefore, applying the safety factor 2 and the repairable system's maintenance strategy is the most irrational choice.
SUMMARY AND FUTURE WORK
The RBD blocks developed by ExtendSim can quantify the operational reliability of the remotely controlled siphon system successfully and efficiently. RBD is an efficient tool, can decrease the difficulty of the modeling work, especially dealing with a complex system. Moreover, the powerful ExtendSim software can allow over 10,000 simulations to finish in a short time. Due to the flexibility and efficiency of ExtendSim software, the operational reliability of any complex system can be successfully evaluated.
The remotely controlled siphon's operational reliability can be increased easily by introducing the redundancy for the vulnerable components such as level switches and air vents. Alternatively, it also can be increased by using more durable components. The space limitation of the siphon cap constraints installation of two air vents, and thus the recommended solution is to use a more durable one. Moreover, in the construction perspective, level switch 3 and 4 is not easy to be installed in the wetland when they are using the architecture of safety factor 2. However, it is hard to find more durable level switches because of the industry's uniformity. Moreover, all the study's broken events are obtained from 2 siphons in the experiment field only. Therefore, the suggestion for future work should be,
1. Explore more durable air vents and observe their performance and broken events during the siphon operation.
2. Design a protective shield to the level switch 3 and 4. For example, the level switch can be fixed inside a 4 inches PVC pipe with many pores on the pipe walls. The pipe wall can perform as a protective shield so that the level switches will not be wrapped by the plants or weeds in the wetlands and still can detect the accurate water level since the pores can allow water flow inside and outside the PVC pipe.
3. Build more siphons, observe their working performance and record the broken events. This information will be used to change the Weibull distribution parameters, which can help improve the operational reliability results.
ACKNOWLEDGEMENT
The National Science Foundation supported this work through NSF/ENG/CBET under Award No. 1805417 and through NSF/DBI/BIO under Award No. 1820778.
The ExtendSim Software is sponsored by Image That Inc under the Academic Research Grants category. REFERENCES Bobbio, A., Franceschinis, G., Gaeta, R., and Portinale, L. (2003) “Parametric Fault Tree for the
Dependability Analysis of Redundant Systems and Its High-Level Petri Net Semantics,” IEEE Trans. Software Eng., 29(3), 270-287.
Chen, Z., Qi, H., and Yang, J. (2012). “Research on System Reliability Modeling Based on ExtendSim,” Fire Control & Command Control, 37(7), 128-130
World Environmental and Water Resources Congress 2021 618
© ASCE
World Environmental and Water Resources Congress 2021
Dow
nloa
ded
from
asc
elib
rary
.org
by
Flor
ida
Inte
rnat
iona
l Uni
vers
ity o
n 07
/26/
21. C
opyr
ight
ASC
E. F
or p
erso
nal u
se o
nly;
all
right
s res
erve
d.
Chen, Z., Yao, Y., and Yang, J. (2013). “Effective Availability Simulation Evaluation Research on Complex Ship System.” 2013 International Conference on Quality, Reliability, Risk, Maintenance, and Safety Engineering (QR2MSE), IEEE, Chengdu, 1271-1273,
Distefano, S., and Xing, L. (2006) “A New Approach to Modeling in the System Reliability: Dynamic Reliability Block Diagrams” RAMS '06. Annual Reliability and Maintainability Symposium, 189-195,
Distefano, S., and Puliafito, A. (2007). “Dynamic Reliability Block Diagrams VS Dynamic Fault Trees,” 2007 Annual Reliability and Maintainability Symposium, Orlando, 71-76, doi:
Distefano S., and Puliafito, A. (2009) “Dependability Evaluation with Dynamic Reliability Block Diagrams and Dynamic Fault Trees,” IEEE TRANSACTIONS ON DEPENDABLE AND DSECURE COMPUTING, 6(1), 4-17,
Fu, Q., Wang, H., and Yan, X. (2019) “Evaluation of the aeroengine performance reliability based on generative adversarial networks and Weibull distribution” Proceedings of the Institution of Mechanical Engineers. Part G: Journal Aerospace Engineering, 233 (15), 5717-5728.
Guo, H., and Yang, X. (2007). “A simple reliability block diagrams method for safety integrity verification,” Reliability Engineering and System Safety, 92(9), 1267-1273,
Hockenberry, R. J., and Lesieutre, C. B. (2004). “Evaluation of Uncertainty in Dynamic Simulations of Power System Models: The Probabilistic Collocation Methtod,” IEEE TRANSACTIONS ON POWER SYSTEMS, 19(3), 1483-1491.
Krahl, D., Nastasi, A., and Tolk, A. (2014) “Reliability Modeling With ExtendSim,” Proceedings of the 2014 Winter Simulation Conference, 4219-4225.
Leon, S. A., and Verma, V. (2019). “Towards Smart and Green Flood Control: Remote and Optimal Operation of Control Structures in a Network of Storage Systems for Mitigating Floods.” World Environmental and Water Resources Congress 2019: Watershed Management, Irrigation and Drainage, and Water Resources Planning and Management, 177-189.
Malhotra, M., and Trivedi, S. K. (1995). “Dependability Modeling Using Petr Nets,” IEEE Trans. Reliability, 44(3), 428-440.
Qin, L., Leon, S. A., Bian, L., Dong, L., Verma, V., and Yolcu, A. (2019). “A remotely-Operated Siphon System for Water Release From Wetlands and Shallow Ponds.” IEEE Access, 7, 157680-157687,
Raje, D. V., Olaniya, R. S., Wakhare, P. D., and Deshpande, A. W. (2000). “Availability assessment of a two-unit stand-by pumping system.” Reliability Engineering and System Safety, 68(3), 269-274,
Rojali, A., Verma, V., Bian, L., and Leon, A. S. (2020). Flood Forecasting for a Small Watershed: Case Study of Cypress Creek, Texas. In 100th American Meteorological Society Annual Meeting. AMS.
Rausand, M., and Hoyland, A. (2004) SYSTEM RELIABILITY THEORY Models, Statistical Methods, and Applications SECOND EDITION.
Trivedi, S. K. (2001). Probability and Statistics with Reliability, Queueing and Computer Science Applications, second ed. John Wiley & Sons.
Trivedi, S. K., Kim, D., and Ghosh, R. (2012). “System availability assessment using stochastic models.” Special Issue: Advanced Reliability and Maintenance Modeling (APARM 2010), 29(2), 94-109,
World Environmental and Water Resources Congress 2021 619
© ASCE
World Environmental and Water Resources Congress 2021
Dow
nloa
ded
from
asc
elib
rary
.org
by
Flor
ida
Inte
rnat
iona
l Uni
vers
ity o
n 07
/26/
21. C
opyr
ight
ASC
E. F
or p
erso
nal u
se o
nly;
all
right
s res
erve
d.
Veeraraghavan, M., and Trivedi, S. K. (1994). “A Combinatorial Algorithm for Performance and Reliability Analysis Using Multistate Model,” IEEE Trans. Computers, 43(2), 229-234.
Verma, V., Vutukuru, K. S., Bian, L., Rojali, A., Ozecik, D., and Leon, A. (2020). “Reliability and Robustness Evaluation of a Remotely Operated Siphon System for Flood Mitigation during Hurricanes,” World Environmental and Water Resources Congress 2020: Emerging and Innovative Technologies and International Perspectives,31-39).
Verma, V., Bian, L., Rojali, A., Ozecik, D., and Leon, A. (2020). “A Remotely Controlled Framework for Gravity-Driven Water Release in Shallow and Not Shallow Storage Ponds.” World Environmental and Water Resources Congress 2020, Proceedings, 12–22.
Wang, W., and Loman, M. J. (2004) “Reliability Block Diagram Simulation Techniques Applied to IEEE Std. 493 Standard Network” IEEE TRANSCATIONS ON INDUSTRY APPLICATIONS, 40(3), 887-895
Xie, M., and Lai, D. C. (1996). “Reliability analysis using an additive Weibull model with bathtub-shaped failure rate function,” Reliability Engineering and System Safety, 52(1) 87-93,
Zhang, T., and Xie, M. (2007). “Failure Data Analysis with Extended Weibull Distribution,” Communications in Statistics-Simulation and Computation, 579-592.
World Environmental and Water Resources Congress 2021 620
© ASCE
World Environmental and Water Resources Congress 2021
Dow
nloa
ded
from
asc
elib
rary
.org
by
Flor
ida
Inte
rnat
iona
l Uni
vers
ity o
n 07
/26/
21. C
opyr
ight
ASC
E. F
or p
erso
nal u
se o
nly;
all
right
s res
erve
d.