Embed Size (px)
Citation preview

Operationalizing Transformation to achieve
BIG FAST RESULTS


Most Governments have great strategies and plans but fail to operationalise them into detailed programme for implementation…

How do we operationalize transformation to achieve Big Fast Results?
• 3 Transformational Leadership Qualities
• 8 Step Methodology

3 Transformational Leadership Qualities

#1 Transformational Leaders who pursue the Game Of the Impossible

Transformational Leaders make “impossible” happen
• Stand-based future – managing the present from the future
• Set Olympic targets - very few precedence,
difficult to justify
• Conquer the fear of failure
• Create a game so large, it will consume you

93 – ‘02 2003 2004 2005
RM-1.4 bil
RM10 mil
RM265 mil
RM500 mil
Shell Middle Distillates: Game of the Impossible
Explosion!

93 – ‘02 2003 2004 2005
RM-1.4 bil
RM10 mil
RM265 mil
RM500 mil
Shell MDS: 6 months turnaround and record profits

#2 Transformational Leaders whose priorities are Anchored on True North

Anchoring on the True North and on the right Key Performance Indicators
• To achieve true north, sharp focus and ruthless prioritization of limited resources on what really matters
• In a corporate world, decompose the corporate P&L into the lowest segmented level e.g. product P&L, customer P&L, route P&L
• Identify profitability levers to turn around each of these segmented P&L
NUMBERS DO NOT LIE


MAS: Anchoring on Profitability
180 routes losing money
52 routes were profitable
110,000 flight P&L statements

RM-1.23 bil
2006 2005 2007 2008 2009 2010
RM-74 mil
RM840 mil
RM264 mil
RM491 mil
RM282 mil
MAS: 1 year turnaround to record profit
Record High Oil Price
Global Financial
Crisis

#3 Transformational Leaders who are “hands on operationally”

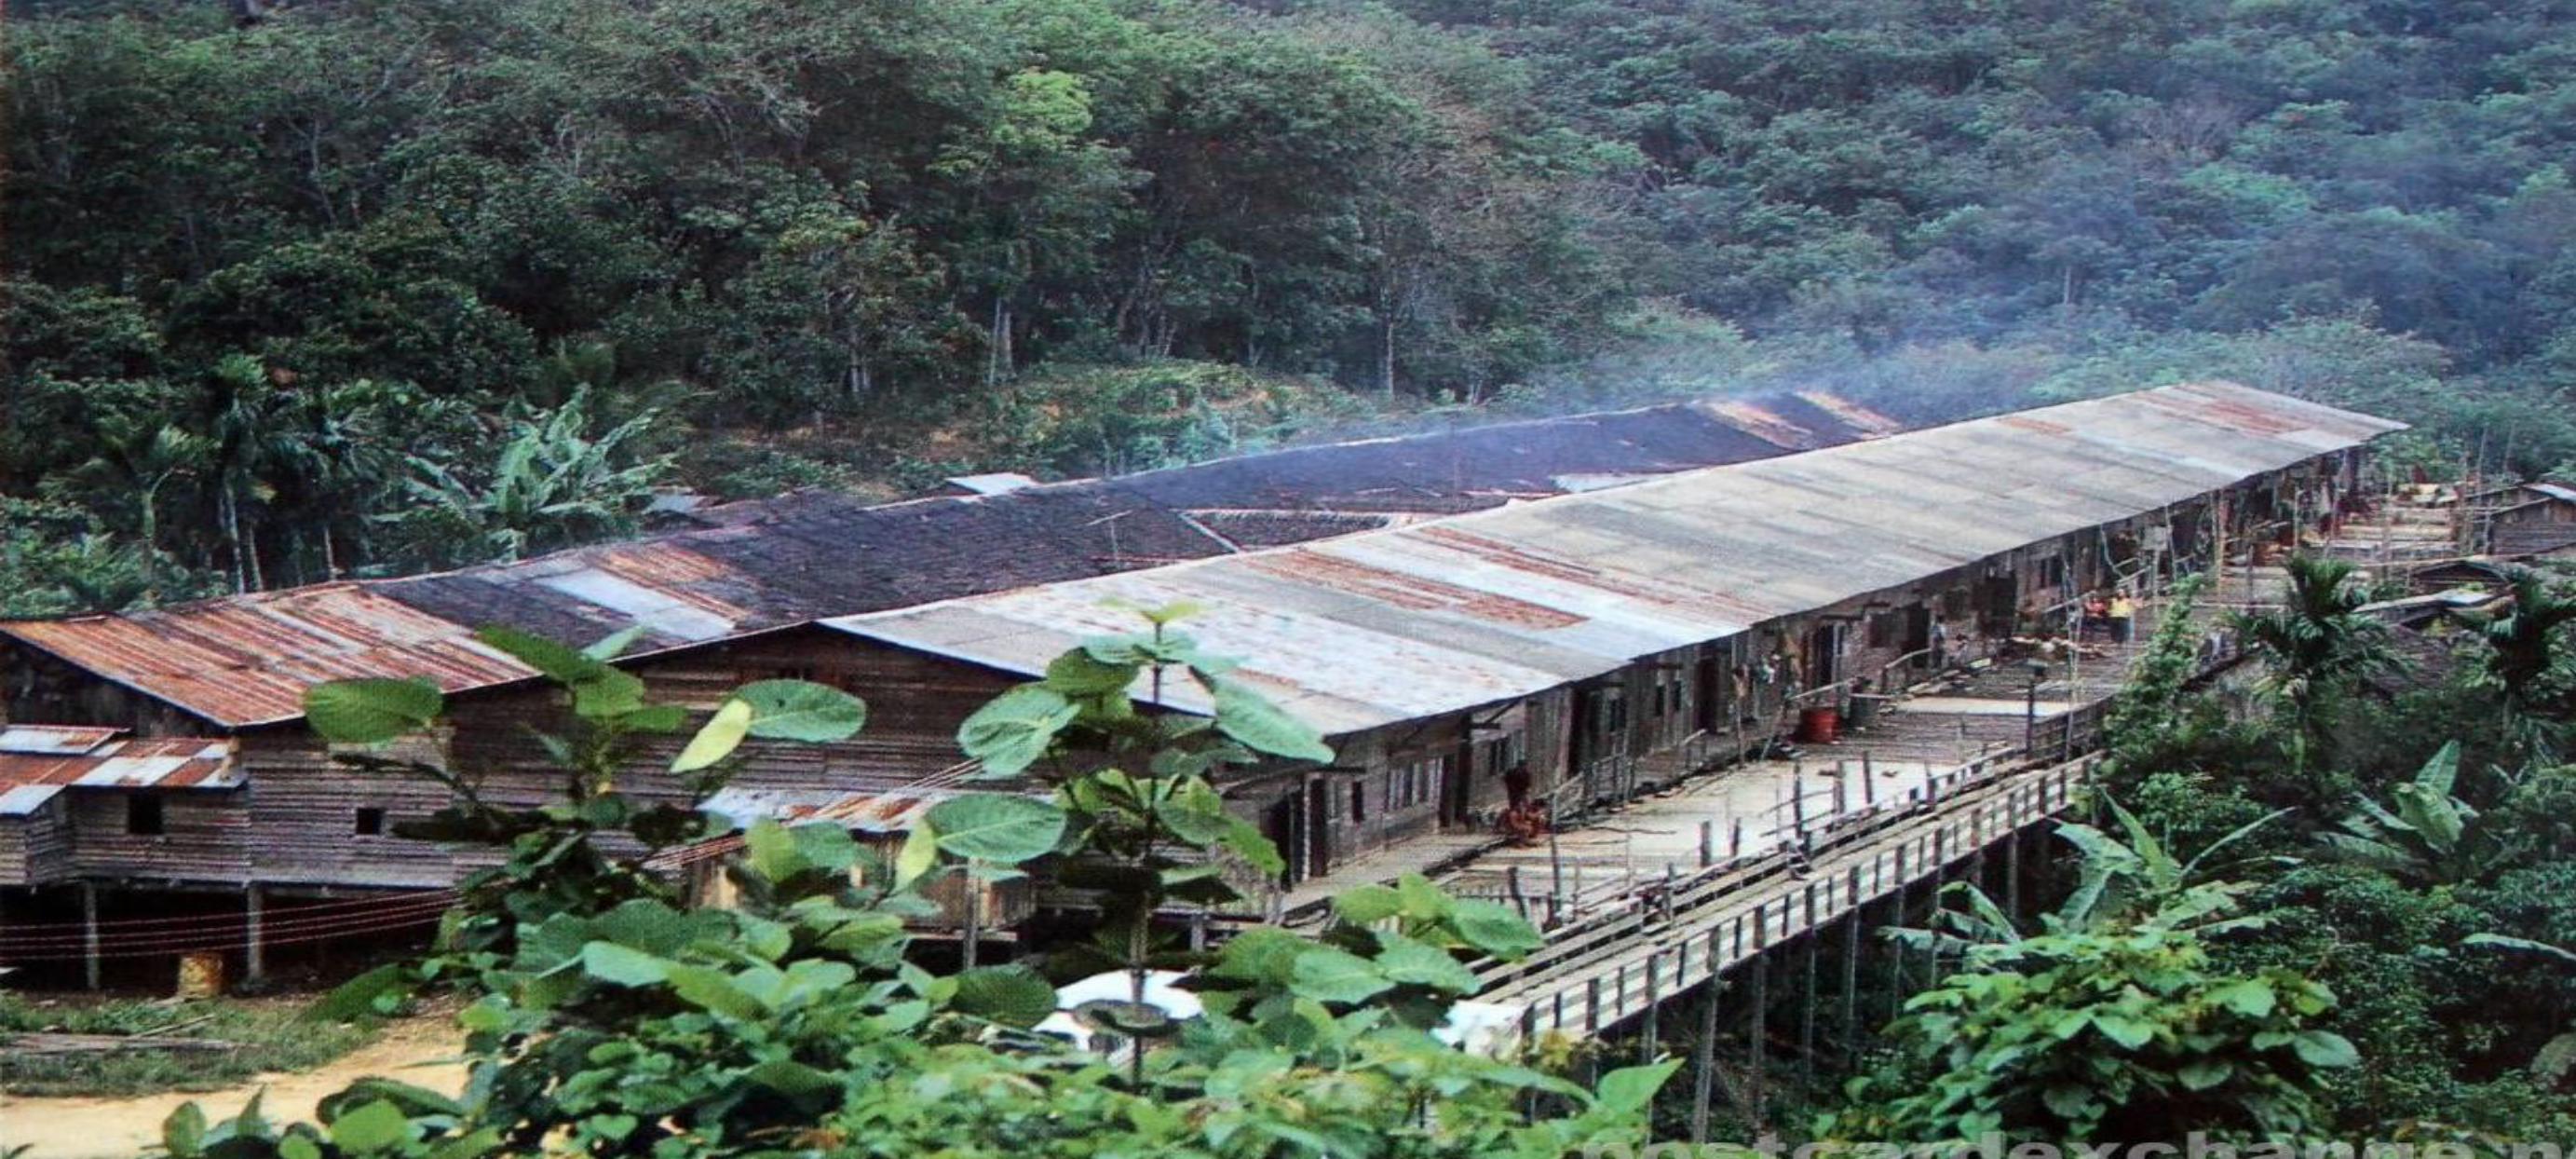
We built a house in 3 days for Ahmand bin Udin and family in Batang Kali

Results and Achievements: The Malaysian story
In 2010, PM launched our National Transformation Programme

3.3 million ADDITIONAL
JOBS
GNI
USD523b Per Capita USD15,000
INVESTMENT USD444b
92% Private 8% Public
73% DDIs 27% FDIs
ETP’s True North

Malaysia’s Vision 2020: New Economic Model
• High Income economy • Inclusive society • Sustainability • Quality of life

Malaysia is no longer “stuck in the middle income trap”
2010 2014
World Bank’s High-income threshold
Malaysia’s GNI per capita
33%
16%
USD 12,276
USD 8,200
USD 10,760
USD 12,736

2.5X growth in Private Investment
ETP Launch

We promise to create 3.3 million jobs in 10 years
To date, 1.8 million jobs

Steady Growth Amidst Low Inflation
Source: Central Bank of Malaysia
2015 GDP Forecast
4.5% - 5.5%
5,6%
6,3%
4,8%
-1,5%
7,4%
5,2% 5,6%
4,7%
6,0%
3,6%
2,0%
5,4%
0,6%
1,7%
3,2%
1,6%
2,1%
3,2%
-2,00%
-1,00%
0,00%
1,00%
2,00%
3,00%
4,00%
5,00%
6,00%
7,00%
8,00%
0
100
200
300
400
500
600
700
800
900
2006 2007 2008 2009 2010 2011 2012 2013 2014
GDP at Constant 2005 Prices Real GDP Growth Rates CPI
(RM bil)

Government Revenue Less Dependent On Oil Revenue
Source: Economic Report 2014/2015, Ministry of Finance
Note: 2014 figures are the revised estimates and 2015 figures are budget estimates
Global Financial Crisis
36,8% 36,5% 39,7% 40,3%
35,4% 35,8% 33,7% 31,2% 29,7%
26,3%
-80,00%
-60,00%
-40,00%
-20,00%
0,00%
20,00%
40,00%
0
10000
20000
30000
40000
50000
60000
70000
80000
90000
2006 2007 2008 2009 2010 2011 2012 2013 2014 revised est 2015 budget est Exploration (including MTJA and non MTJA) Export Duty Petroleum Royalty & Gas PETRONAS Dividen PITA % of Total Govt Revenue

Source: Ministry of Finance
(RM mil)
61.572 69.396
82.138 78.375 79.009
102.242 116.937 120.523
133.148 135.646 25.058
25.772
30.760 28.129 30.507
32.643
34.706 35.429
38.622 47.732
2006 2007 2008 2009 2010 2011 2012 2013 2014 Revised Estimate
2015 Budget Estimate
Direct Taxes Indirect Taxes
Government Revenue Increasing, Tax Collection is Up

We implemented inclusive measures for rural folks
5 million Rural people benefited from rural infrastructure projects

We implemented inclusive measures for low income people
6.8 million Low income households and individuals benefited from BR1M (cash transfer)
168,843 Individuals participate in the 1AZAM programme
2.9 million Lifted out of poverty due to minimum wage policy

We implemented inclusive measures for urbanites
455,728
Public transport AM Peak ridership increased to

-6,4%
-5,3%
-4,7% -4,3%
-3,8% -3,4% -3,2%
2009 2010 2011 2012 2013 2014 2015 2020
Still On Track To Fiscal Balance
Note: Based on GDP in 2010 prices
Source: Ministry of Finance, Economic Planning Unit
(% of GDP)
2020 TARGET Balanced Budget
2015 Revised Target

Malaysia is in the fiscal “safe zone”

OECD forecasts that Malaysia is ahead of other ASEAN countries, China and India in becoming high income country
Note: Based on World Bank’s criterion for classifying economies, high income countries are defined as having GNI per capita above USD12,000 in 2013. Growth prospects in this simulation are in line with MPF-2014
Best scenario simulation of estimated time required to become high income countries for selected Asian middle income countries (years)
India
Vietnam
Philippines
Indonesia
Thailand
China
Malaysia
in 2059
in 2058
in 2051
in 2042
in 2031
in 2026
in 2020

Malaysia’s international rankings have been steadily improving
Ease of Doing Business
OUT OF
189 2014
20(6*)
2016
18
World Competitiveness Yearbook
2012
14 OUT OF
60 2013
15 2014
12
Global Competitiveness Report
2012
25 /144
2013
24 /148
2015
18 /140
*Pre-DTF Methodology
2015
14
2015
18
2014
20 /144

8 Steps Methodology

Step 1: Strategic Direction Workshop
• Leadership commitment on “Game of Impossible”
• Agree the top 10 priorities

Malaysian Cabinet had multiple strategic workshops

Step 2: Conduct Labs on all agreed priority areas

INVESTMENT
USD444b 92% Private 8% Public
73% DDIs 27% FDIs
133 EPPS
USD247b
EPPs are catalytic in effect

ETP: Expected GNI contribution and job creation by project
39
Palm oil and rubber
Greater KL/KV
Oil, gas, energy
Financial services
MYR 230.9bn
MYR 190bn
MYR 131.4bn
MYR 121.5bn
Business Services MYR 78.7bn
Tourism
Communications
MYR 66.7bn
MYR 57.7bn
Wholesale and retail
Electrical and Electronics
MYR 55.4bn
MYR 54.4bn
Healthcare MYR 35.3bn
Education
Agriculture
MYR 33.6bn
MYR 28.9bn
41,600 jobs
320,000 jobs
52,300 jobs
275,400 jobs
245,000 jobs
49,000 jobs
43,162 jobs
454,190 jobs
157,000 jobs
181,000 jobs
535,000 jobs
109,335 jobs
Sector GNI contribution in 2020 Job creation
MYR 59.7bn
MYR 171.9bn
MYR 113.3bn
MYR 65.2bn
MYR 30.0bn
MYR 136.6bn
MYR 30.3bn
MYR 67.1bn
MYR 66.7bn
MYR 11.9bn
MYR 19.86bn
MYR 18.9bn
Investment

GREATER KL EPP4 Mass Rapid Transit (MRT) Line 1
Current Overall Progress: 62% Completed Expected Phase 1 Completion: December 2016
Expected Full Line Completion: July 2017

OIL, GAS & ENERGY EPP13 Pengerang Integrated Petrochemical Complex (PIPC) Creating Value-Added Downstream

PALM OIL & RUBBER Progress Upstream & Downstream
EPP5 • Encourage mills to install biogas facility in tandem with
environmental objectives. • 66 completed, 13 under construction and 150 under planning
EPP1 and 2 • 434,211 ha* replanted and new planted between 2011 – 2014 • 14% of 5.4 mil ha palm oil land in Malaysia belongs to independent
smallholders • 27.6% of total palm oil area has been certified with 1 or more
standards
EPP6 and 8 • RM3.1b commitment in oleo derivatives & food & health segments
up to 2014. • 12 clinical trials to expand palm-based food and health
applications & markets.
Downstream
Midstream
Upstream

PALM OIL: RM3.1 bil committed investment in donwstream
• Note: 434,221 ha of replanting and new planting = 6 X the size of Singapore Approximately 50 mil trees based on 120 trees per hectare
52,106,520 palm oil trees were planted
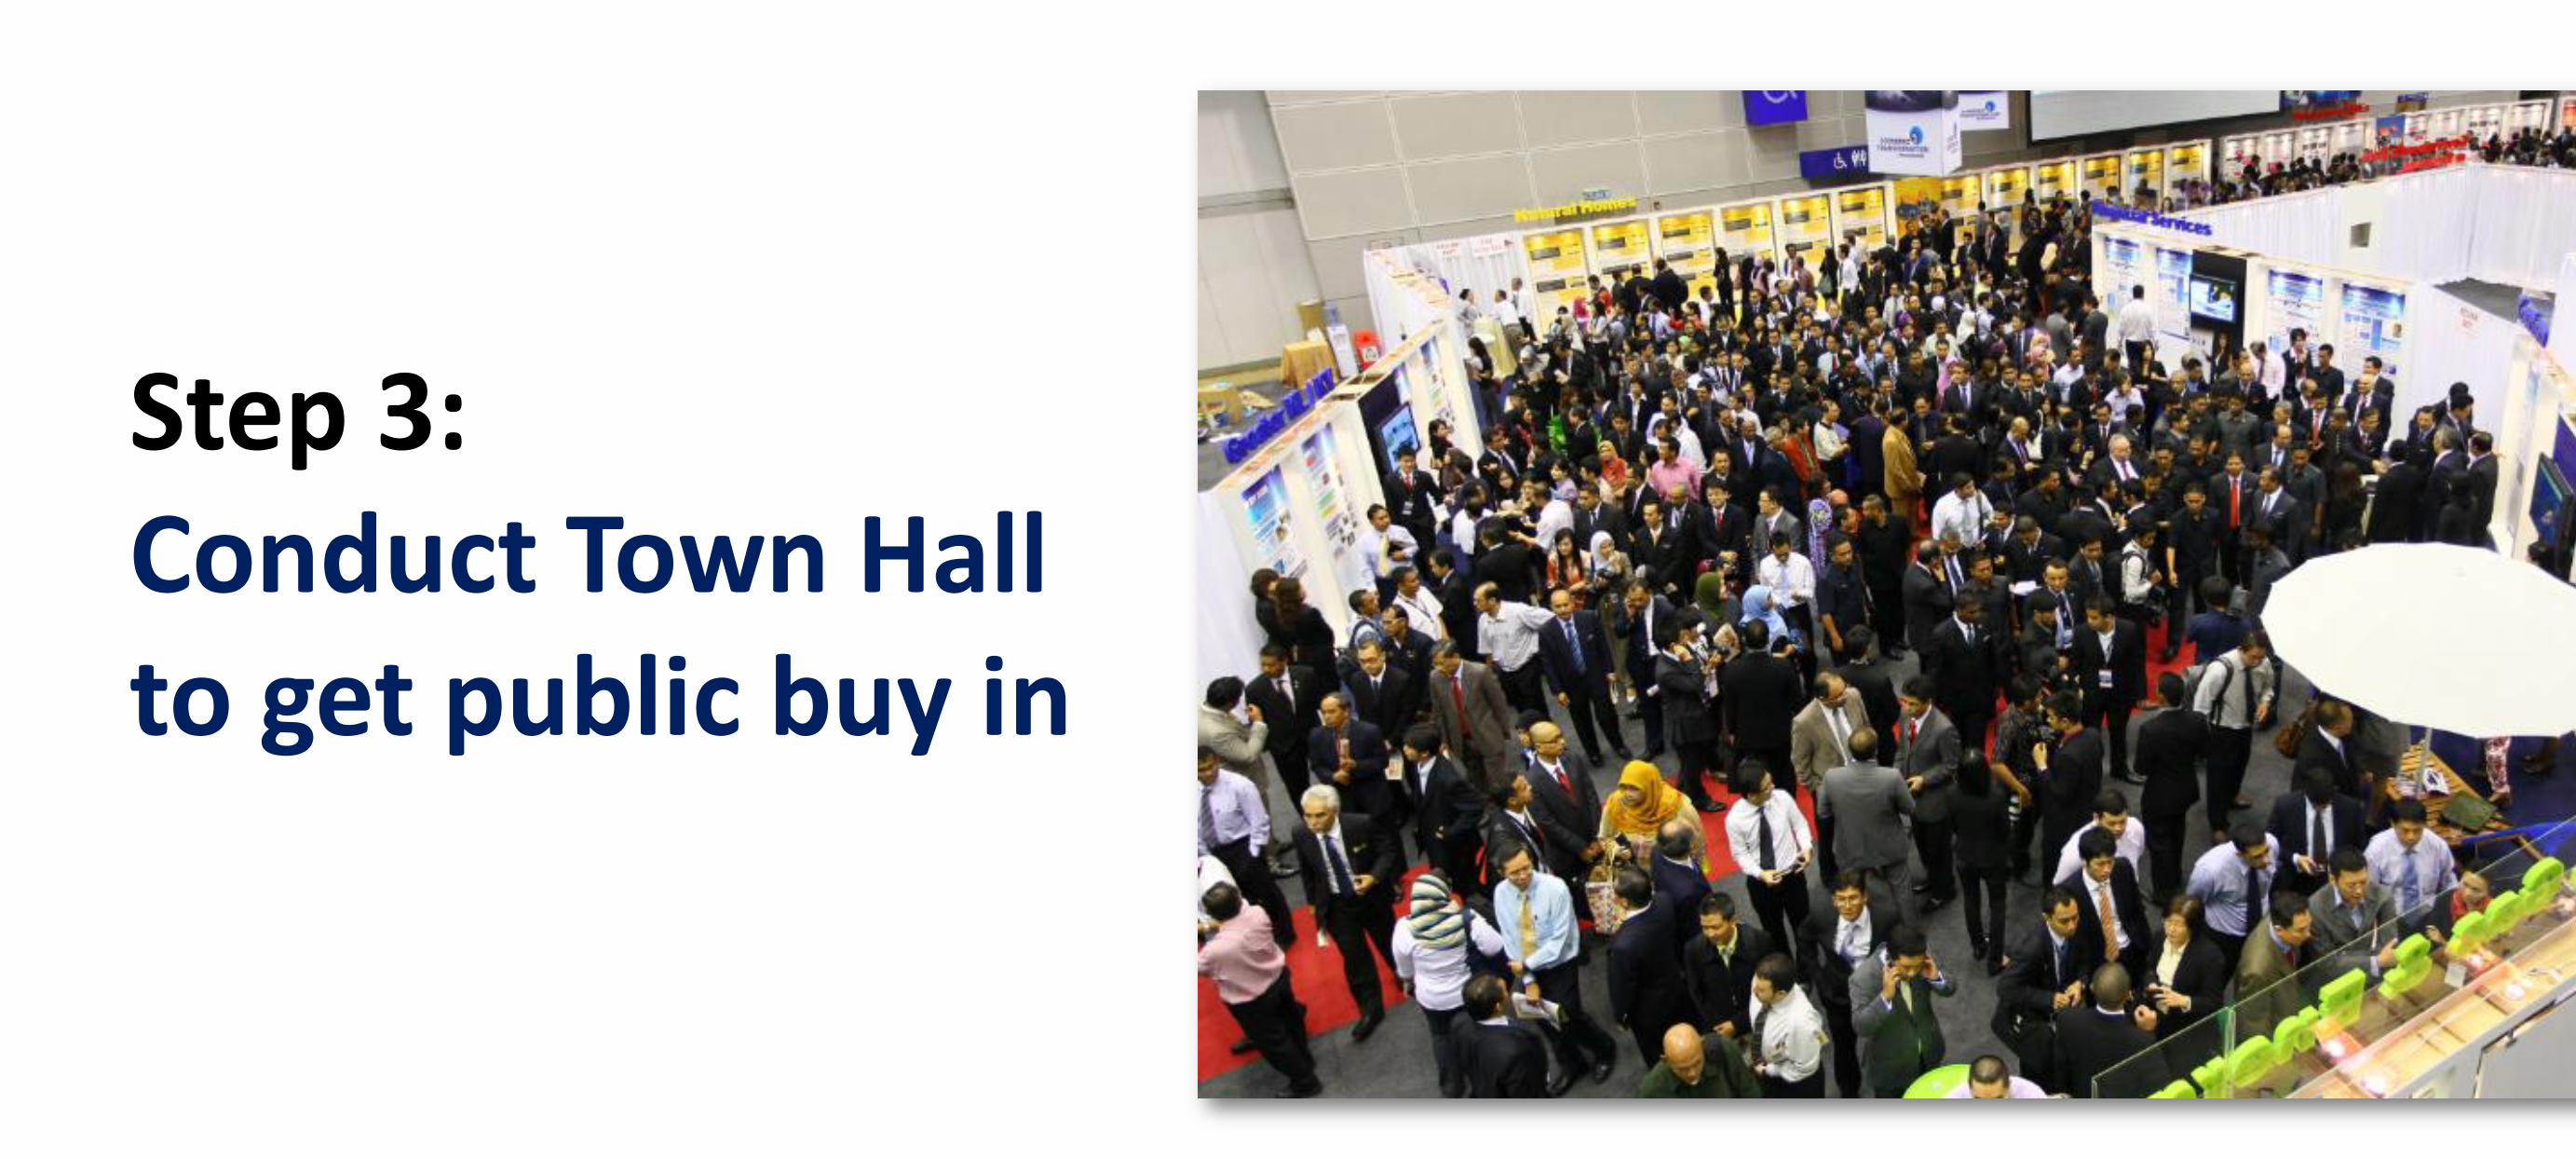
Step 3: Conduct Town Hall to get public buy in

Step 4: Publish transformation Roadmap

Step 5: Assign KPIs to leadership

Step 6: DMS Implementation
Do it relentlessly
Monitor it constantly
Solve problems recursively

Do it relentlessly Work on it “as if your life depends on it”

49
To achieve this KPI, the ministry TRANSFORMED immediately and as a result, Sabah achieved
SAIDI of 687 minutes in Dec 2010, surpassing the target set of 700 minutes
2005 2006 2007 2008 2009 2010
3,996 4,030
1,987 1,867
2,867
687
-76%
SAIDI in Sabah (2005 – 2010)

Monitor it constantly Weekly dashboard

Solve problems recursively Problem-solving meetings and Putrajaya Inquisition

Step 7: Validate and confirm results

Step 8: Assess performance of Ministers and Publish Annual Reports

Examples of 2014 ETP KPI results
96% 108% 103%

Thank you