Embed Size (px)
Citation preview

-j 3 0314 00023 6462TRANSPORTATION
3 0314 00023 6462
Report 97-10Number 97 10
OpESO;^
W10OF Tv ic-
LA~ ~ ~ A A A- - - -
v
Motor Carrier Compliance Reviews: Measuring Their Impacton Improved Safety Performance Among Interstate
Freight Motor Carriers Based in Minnesota_ _-0-0ý-%, ! -
-I
Minnesota Guidestar
CTSHE5634.M6C481997
r


Technical Report Documentation Page1. Report No. 2. 3. Recipient's Accession No.
MN/RC - 97/10
4. Title and Subtitle 5. Report Date
MOTOR CARRIER COMPLIANCE REVIEWS: MEASURING May 1997THEIR IMPACT ON IMPROVED SAFETY PERFORMANCEAMONG INTERSTATE FREIGHT MOTOR CARRIERSBASED IN MINNESOTA
7. Author(s) 8. Performing Organization Report No.
Vladimir Cherkassky and David Pagel
9. Performing Organization Name and Address 10. Project/Task/Work Unit No.
University of MinnesotaDepartment of Electrical Engineering4-178 EE/CSci 11. Contract (C) or Grant (G) No.
200 Union St. S.E. (C) 73597 TOC#192Minneapolis, Minnesota 55455
12. Sponsoring Organization Name and Address 13. Type of Report and Period Covered
Minnesota Department of Transportation Final Report 1996-1997395 John Ireland Boulevard Mail Stop 330 1 S
14. Sponsoring Agency CodeSt. Paul, Minnesota 55155
15. Supplementary Notes
16. Abstract (Limit: 200 words)
This study seeks to measure the safety performance of compliance reviews (CRs) conducted in Minnesota under theMotor Carrier Safety Assistance Program (MCSAP). This study employs data gathered by the Federal HighwayAdministration surrounding two MCSAP activities: compliance reviews and roadside inspections. It specificallyinvestigates the change in a carrier's annual out-of-service violation rate (OOS) in response to receiving a review or ahigher number of inspections.
A measurable reduction in a carrier's OOS rate occurs in the year after a CR, according to the data. The annual OOSrate appears to be a viable measure of the impact of a compliance review, given that a carrier's vehicles and drivers areadequately inspected in the year following a CR.
17. Document Analysis/Descriptors 18. Availability Statement
Commercial Motor Vehicle Compliance Review No restrictions. Document available from:Out of Service Violation Federal Motor Carrier National Technical Information Services,Roadside Inspection Safety Regulation Springfield, Virginia 22161
19. Security Class (this report) 20. Security Class (this page) 21. No. of Pages 22. Price
Unclassified Unclassified 50


Motor Carrier Compliance Reviews:Measuring Their Impact on Improved Safety Performance Among
Interstate Freight Motor Carriers Based in Minnesota
Final Report
Prepared by
Vladimir Cherkassky
Electrical Engineering DepartmentUniversity of MinnesotaMinneapolis, MN 55455
David Pagel
Minnesota Department of TransportationOffice of Motor Carrier Services
Mail Stop 4201110 Centre Pointe Curve
Mendota Heights, MN 55118
May 1997
Published by
Minnesota Department of TransportationOffice of Research Administration
Mail Stop 330117 University Avenue
St Paul Minnesota 55155
The opinions, findings and conclusions expressed in this publication are those of the authors and notnecessarily those of the Minnesota Department of Transportation or the Minnesota Department of PublicSafety.


Acknowledgments
For their guidance and assistance in gathering and understanding information, the authors wouldlike to acknowledge Mark Berndt, Chris Conway and Gerald McCord of the MinnesotaDepartment of Transportation Office of Motor Carrier Services; Ron Nieman of the FederalHighway Administration, Upper Midwest Regional Office; Captain Don Kunelius, Paul Schoenand Sue Sheehan of the Minnesota State Patrol, Commercial Vehicle Section; and Cathy Ericksonof the Minnesota Guidestar Office. We also thank research assistant Xuhui Shao for his researchefforts and programming.


TABLE OF CONTENTS
CHAPTER 1
CHAPTER 2
CHAPTER 3
CHAPTER 4
CHAPTER 5
REFERENCES
APPENDIXES
INTRODUCTION ..................................
B ackground .......................................
PROJECT GOALS ........... ............ ...........
Issue of Sim ilarity .....................................
D atasets U sed .................. ......................
Definition of Out-of-Service (OOS) Rate ...................
M E TH O D S .......................................
H ypothesis .................................... ....
Finding Groups of Similar Carriers ........................
D ata A nalysis ......................... ..............
Preliminary Data Analysis .........................
Model Construction and Hypothesis Testing ...........
R E SU L T S .................................. .......
D ata Analysis .................................. .....
Statistics for Roadside Inspections ...................
Statistics for CRs ...............................
Modeling the Effectiveness of CRs .......................
CONCLUSIONS AND RECOMMENDATIONS .............
Page
1
1
5
5
6
6
7
7
7
9
9
9
11
11
11
13
14
19
21


List of Tables
Page
For-hire Carriers (Size) ....................................... 14Table 4.1
Table 4.2
Table 4.3
Table 4.4
Table 4.5
Table 4.6
Table 4.7
Table 4.8
Table 4.9
Table 4.10
Table 4.11
15
15
16
16
16
17
17
17
18
18
D-3Table D-1 Comparison of OOS Rates at St Croix (MN) vs. Hudson (WI) Scales.
List of Figures
Categorical Separation Procedure 1 ...........................
Categorical Separation Procedure 2 ...........................
Site-based Inspection Date (Haul_distance groups) ..................
Page
8
8
D-2
For-hire Carriers (Haul_distance) .....................
Private Carriers (Size) .............................
Private Carriers (Haul_distance) .......................
Exempt Carriers (Size) .............................
Exempt Carriers (Haul_distance) .....................
For-hire/Private Carriers ..............................
Non-Hazmat/Unincorporated Carriers (Haul_distance) .......
Non-Hazmat/Incorporated Carriers (Haul_distance) .........
Hazmat/Incorporated Carriers (Haul_distance) .............
Hazmat/Unincorporated Carriers (Haul_distance) ...........
Figure 3.1
Figure 3.2
Figure D-1


EXECUTIVE SUMMARY
This study is concerned with measuring the safety performance of compliance reviews (CRs)
conducted in Minnesota under the Motor Carrier Safety Assistance Program (MCSAP). The
Motor Carrier Safety Assistance Program (MCSAP) was established under the Surface
Transportation Act of 1982, and is administered by the Federal Highway Administration (FHWA).
MCSAP provides grants to state and eligible territories to enforce the Federal Motor Carrier
Safety and Hazardous Materials Regulations (FMCSR and HMR).
This study employs data gathered by the Federal Highway Administration (FHWA) surrounding
two MCSAP activities: (1) compliance reviews (CRs) and (2) roadside inspections. This study's
goal is to use this historical data to: (1) test the hypothesis that CRs have a positive impact on
motor carrier safety practices in Minnesota, and (2) offer a performance measure of this impact
among similar types of carriers. The datasets included CR records from 1992-1994, roadside
inspections from 1992-1995 and characteristic data on Minnesota-based interstate freight carriers.
The adopted model attempts to measure safety outcomes and does not use a traditional approach
using accident data, since accident data can be problematic for reasons related to the sparseness of
accidents themselves and lack of data linking motor carriers to accident causation. Rather,
information discovered from roadside inspections is used as an indicator of a carrier's safety
practice. Specifically, the industry's response to a CR is measured using the occurrance of severe
violations from roadside inspections, namely, the frequency of out-of-service (OOS) violations or,
OOS rate. Here, the assumption is that OOS violations identify imminent dangers to highway
safety and a higher accident risk for the associated carrier. However, unlike previous utilization
of out-of-service rate, the focus is not on an individual carrier's response, but on the response of
specific segments of motor carrier industry. The adopted model compares the average OOS rate
of carriers that had a CR to the OOS rate of similar carriers that have not recently had a CR.
Similarity among carriers is determined by characteristics such as fleet size, average annual vehicle
mileage and average haul distance in addition to a carrier's classification as "authorized for-hire,"
"exempt for-hire," "private" and hazardous material carriers.

Results
The frequency of inspections for different types of carriers was examined. From roadside
inspection data, it was found that carriers with larger fleets, substantial long-haul operations or
hazardous material registration were most likely to be inspected at the roadside. Characteristics
that influenced a lower inspection frequency were smaller fleets, low average annual vehicle
milage or classification as a private or exempt for-hire carrier. It was also found that roughly
50% of the carriers with known CRs were without a record of an inspection; these tended to be
carriers with small fleets and/or low average annual vehicle milage. The data suggests that the
estimated OOS rate becomes more accurate as a carrier experiences more inspections.
A measurable reduction in a carrier's OOS rate occurs in the year after a CR. This result was
most apparent when separating all carriers into three primary groups: (1) authorized for-hire, (2)
exempt for-hire and (3) private carriers, and then further separating each of these groups into
three smaller groups based on the carrier's fleet size (1 vehicle, 2-5 vehicles, or more than 5
vehicles). In eight of these nine subpopulations, the model showed statistically significant results.
The model revealed a positive response from six of these subpopulations: carriers subject to a CR
exhibit lower average annual OOS rates (12 - 37%). However, the model estimated an increase in
the annual OOS rate for owner/operators (73%) and private carriers with 2-5 vehicles (65%).
Exempt for-hire carriers with a single vehicle, did not exhibit a significant response to a CR.
Conclusion
Annual OOS rate appears to be a viable measure of the impact of a compliance review, given that
a carrier's vehicles and drivers are adequately inspected in the year following a CR. It is
important to verify and share these results with all affected regulatory agencies, transportation
research institutions, the motor carrier industry and the public.
A partnership for timely data exchange is recommended between the agencies that conduct CRs
and roadside inspections. Specifically, if performance measurement of this kind is desired, there is
a need to ensure that most carriers receiving CRs are adequately inspected at the roadside in the
ensuing year.

1. INTRODUCTION
This study is concerned with measuring the safety performance of compliance reviews (CRs)
conducted in Minnesota under the Motor Carrier Safety Assistance Program (MCSAP). MCSAP
was established under the Surface Transportation Act of 1982, and is administered by the Federal
Highway Administration (FHWA). MCSAP provides grants to state and eligible territories to
enforce the Federal Motor Carrier Safety and Hazardous Materials Regulations (FMCSR and
HMR), or comparable state regulations regarding commercial motor vehicle safety.
Earlier research indicates that CRs are a cost-effective means of reducing accident rates [1].
However, using accidents as a performance-based measurement of CRs is problematic, since
accident data can be sparse, often lacks enough information regarding accident causation, and is
reactive rather than proactive in assessing safety outcomes.
This study takes a different approach, one utilizing the common legal backbone behind CRs and
roadside inspections: the FMCSR. The assumption is made that roadside inspections exist to
enforce, on a daily basis, the FMCSR with regard to the vehicles and drivers of the interstate
motor carrier industry. Hence, the general hypothesis is that roadside inspections offer timely,
reproducible, independently-gathered and tractable data concerning a carrier's actual safety
practice on the roadway. Further, an attempt is made to gauge the industry's response to a CR
using the occurrance of severe violations from roadside inspections, namely, the frequency of
"out-of-service" violations or, out-of-service rate. However, unlike previous examinations of
out-of-service rate, the focus is not on an individual carrier's response, but on the response of
specific segments of motor carrier industry. This study analyzes a substantial sample of the
historical data and investigates a method to measure the educational element of CRs toward
improving safety in Minnesota's motor carrier industry.
1.1 Background
CRs are audits conducted on motor carriers to determine their compliance with federal safety
regulations, including; 1) insurance, 2) driver qualifications, 3) vehicle maintenance and inspection
reports, 4) freight bills and accounts, 5) driver hours of service records (logbooks), and 6) vehicle
accident records. Until recently, a CR resulted in a carrier receiving a safety rating (Satisfactory,
Conditional or Unsatisfactory). However, in March of 1997, a federal court ruling caused the
FHWA to place the carrier rating scheme on hold.
CRs were preceded in the MCSAP by a non-enforcement audit called a Safety Review (SR),
which was intended to be completely educational. While the SR's replacement, the CR, is still
intended to be educational, carriers may also face stiff fines for willful noncompliance with the
regulations. Nonetheless, it is the "educational" element of a CR that is of most interest in this
study. Therefore, to be able to use as much of the available historical data as possible, we use
CRs and SRs synonymously.
The majority of funds received by the states through MCSAP are used for roadside inspections of
commerical vehicles. For example, in FY 1994, the MCSAP resulted in 1,961,800 vehicle
inspections and 10,785 compliance reviews nationwide. By comparison, Minnesota conducted
511 CRs on carriers domiciled in the state. However, interstate carriers from Minnesota may be
subjected to roadside inspections in any state in which they travel. All roadside inspection and CR
data for carriers is maintained by FHWA in the SafetyNet database. The premise of this study is
to examine carriers who have experienced a CR, and determine whether their compliance during
roadside inspections has statistically improved.
In Minnesota, two agencies share the MCSAP grant. The Minnesota Department of Public Safety
(MDPS), Commerical Vehicle Section is the lead agency and uses MCSAP funds to conduct
roadside inspections, traffic enforcement, accident reconstruction, inspector training and public
awareness campaigns such as "Share the Road." The Minnesota Department of Transportation,
Office of Motor Carrier Services (OMCS), conducts CRs, inspection repair audits, hazardous
materials shipper reviews, hazardous materials dock audits, adminstrates SafetyNet databases, and
provides training on commercial vehicle and hazardous materials regulations.
While each state or territory is responsible for the activities performed under the MCASP, these
safety activities generally fall into several main categories: 1) roadside enforcement, i.e.,
2

commercial vehicle inspections 2) traffic enforcement, 3) CRs and other audits, and 4)
education/outreach. It is fair to say, that in most, if not all states, the majority of MCSAP
resources are directed toward roadside inspection activities. Nationally, FHWA has declared that
for MCSAP to become a performance-based program it must focus on accident reduction, and
"with this approach, inspections become part of a performance based plan for the state" [2].
However, the utilization of accidents as the sole measure of successful performance, particularly
regarding the CR element of the MCSAP, is confronted with several problems:
1. Accident data has historically been inconsistently reported, collected and interpreted [3].
2. In 1995, reports to the National Highway Traffic Safety. Administration indicate that 72%
of fatal accidents involving trucks were the fault of the other driver [4].
3. Many other factors such as weather, geometric design and traffic laws have significant
influence on accidents.
While accident or crash reduction may be a fair measure of roadside enforcement programs, it is
difficult, at best, to directly link crashes to other elements of the MCSAP program, such as CRs
and education/outreach. To reiterate, the purpose of this study is to develop a performance based
measure for the CR element of the MCSAP.

2.0 PROJECT GOALS
The outcome of a roadside inspection known as an "out of service violation" is used in this study
as an indication of an unsafe commercial vehicle operated by a specific motor carrier. Out of
service (OOS) violations are severe violations of the Federal Motor Carrier Safety Regulations
(FMCSR) relating to the vehicle or the driver. If a roadside inspection results in one or more
OOS violations, the vehicle and/or the driver is immediately prohibited from further travel or,
using the terminology of the regulations, placed "out of service." The carrier may also receive
citations for the OOS infractions and, until compliance with the regulations is reached, the vehicle
and/or driver would not be allowed to continue.
Whether associated with a vehicle or a driver, OOS violations identify imminent dangers to
highway safety and imply a higher risk of a traffic accident involving that particular vehicle or
driver. Further, since the FHWA SafetyNet database identifies the carrier for which the vehicle
and driver are operating, it possible to estimate a specific carrier's annual OOS rate (average
number of OOS violations per roadside inspection for a particular calendar year). Consequently,
the goal of this study is to determine the usefulness of a carrier's OOS rate as the focus of
comparative measurement in understanding the safety benefit of performing CRs.
2.1 Issue of Similarity
To generate meaningful results, only similar carriers should be compared when examining the
safety impact of a CR. For this study, similarity is defined using a number of physical
characteristics (carrier type, fleet size, annual mileage, etc.). In other words, the aggregate
sample of carriers is separated into several smaller groups, where each of these smaller
subpopulations of carriers share a set of physical characteristics. Consequently, for each of these
smaller groups of similar carriers, a comparative analysis can be applied between carriers that have
participated in a CR and those that have had little or no exposure to this regulatory process. The
result of restricting the analysis to similar carriers is a more refined understanding of the possible
impact that may be learned from the available data.
2.2 Datasets Used
The FHWA supplied three raw data samples from the SafetyNet database. The datasets derived
for this study are explained below.
1. Roadside inspections for vehicles associated with MN interstate freight carriers, during
the period 1/1/92 to 12/31/95 (-75,000 inspections).
2. MN interstate freight carriers receiving a CR during the period 1/1/92 to 12/31/94 that
also experienced at least one roadside inspection during the period 1/1/93 to 12/31/95
(-1200 reviews).
3. Uniform physical data on MN interstate freight carriers from the Census database (5968
carriers).
2.3 Definition of Out-of-Service (OOS) Rate
For this study the OOS rate of a carrier is defined as the fraction of inspections conducted in a
calendar year that result in one or more OOS violations.
OS re No. of inspections with OOS violationsOSNo. of inspectionsNo. of inspections
3.0 METHODS
3.1 Hypothesis
If there is a safety benefit to conducting motor carrier CRs, and if one way this benefit is naturally
(if not directly) expressed is in a change in a carrier's OOS rate, we expect that OOS rates would
be comparatively lower for at least a short time after a conducting a CR. Here, the comparison is
against similar carriers that have never or, not recently, received a CR. Formally, we hypothisize
that
H: Carriers receiving a CR respond with lower OOS rates in the year following the CR
3.2 Finding Groups of Similar Carriers
Two different procedures are used to separate carriers into initial categorical groups.
Categorical Separation Procedure 1
The first procedure separates the aggregate sample into carriers of four types, refering to whether
or not a carrier has been registered for transportation of hazardous materials (Hazmat) and
whether or not they are incorporated. This is diagramed in Figure 3.1
1) Hazmat, incorporated carriers
2) nonHazmat, incorporated carriers
3) Hazmat, unincorporated carriers
4) nonHazmat, incorporated carriers
Categorical Separation Procedure 2
The second procedure separates the the aggregate sample of carriers into three carrier types. This
is diagramed in Figure 3.2.
1) authorized For-hire carriers
2) Private carriers
3) Exempt for-hire carriers
7

Figure 3.1 Categorical Separation Procedure 1
The population of carriers
within each of the categorical Aggregate Sample
groups created by either
separation method will still For-hire Private ExempFor-hire Private Exempt
vary according to extent of
service. Therefore, for tighter Figure 3.2 Categorical Separation Procedure 2
focus on carrier populations,
we further break down categorical groups by focusing on one of three parameters that are
developed and calculated for each carrier in the aggregate sample of carriers:
(1) size of fleet { Size parameter}
(2) average annual vehicle miles {AVM parameter}
(3) average haul distance {Haul_distance parameter}
For example, using categorical separation procedure 2, For-hire carriers are further described by
characterizing them as short-haul, medium-haul or long-haul carriers based on the calculated
Haul_distance parameter. The same is done for the Private and Exempt categories of carriers.
Appendix A presents the algorithms used to calculate these parameters and results of the three
grouping strategies in both procedures.
8
Aggregate Sample
Hazmat Non-Hazmat
Hazmat Hazmat Non-Hazmat Non-HazmatCorporations Non-Corporations Corporations Non-Corporations

3.3 Data Analysis
There are two main tasks for this study:
(1) analyze the data integrity from CRs and roadside inspections
(2) construct a model to test the hypothesis.
3.3.1 Preliminary Data Analysis
Roadside Inspections: Descriptive statistics were used to gain insight about roadside
inspections and answer these questions:
a) Is the frequency of inspection influenced by a carrier's type and size?
b) What are the most common types of out of service violations?
c) Is the "probability of an inspection" dependent on an inspection site, on the
carrier itself, or both?
Appendixes B, C and D contain the approaches and tabulations of the results of
these analyses.
CRs: Six component factors contribute to a carrier's safety rating resulting from a CR.
Each component factor identifies a specific area of safety practice (driver qualifications,
vehicle maintenance, operational practice, etc.), and each is rated separately with respect
to compliance with the FMCSR [5]. The objective of this analysis is to identify
component factors most frequently rated 'unsatisfactory' or 'conditional.' The component
factors identified in this way are the most likely to contribute to an overall 'unsatisfactory'
or 'conditional' safety rating. The results of this analysis is contained in Appendix E.
3.3.2 Model Construction and Hypothesis Testing
Within each subpopulation of similar carriers, we examine the OOS rates of two groups. The
treatment group consists of carriers exposed to a CR, while the control group consists of carriers
9

that did not receive a CR in the years 1991, 1992, 1993 and 1994. The OOS rates for each group
of a subpopulation were estimated for the year following a CR.
Control group: carriers who did not experience a CR
Treatment group: carriers who received a CR during 1992, 1993, 1994
To test the hypothesis, the mean OOS rates for treatment group and control group are estimated
separately, and then a standard nonparametric statistical test is applied to measure the significance
of the difference in these mean OOS rates. Only if there is a statistically significant difference in
these two estimated OOS rates is it fair to conclude that conducting a CR has a measurable effect
on a subpopulation of carriers. Further, if the mean OOS rate of the treatment group is lower
than the mean OOS rate of the control group, then we can conclude that conducting a CR on a
typical carrier of the subpopulation has a positive effect on (lowering) its OOS rate. Conversely,
if the mean OOS rate of the control group is lower than the mean OOS rate of the treatment
group, then we can conclude that conducting a CR on a typical carrier of the subpopulation has a
negative effect on its OOS rate.
The model employed is a version of the Two-sample Location Problem [6, 7], a classic statistics
problem that compares two sample means. The Two-sample Location Problem, as we have
applied it to a group of similar carriers, consists of estimating the difference in the mean values of
the OOS rates of the control and treatment groups. Such a test statistic is obtained from
Wilcoxon's 'distribution-free rank sum test' [8].
To garner an understanding of the significance of the test results, a 'confidence level' is attached
to this estimated difference (the target confidence level is 90% for each test). Additionally, we
calculate an associated confidence interval within which the estimated difference is allowed to
vary. Finally, in order to justify a significant difference in the estimated mean OOS rates of the
control and treatment groups, the confidence interval cannot include the number zero. The
estimator used to measure the difference in the sample means is the so-called Walsh average [9]
and the confidence interval employed is due to Moses [10].
10

4.0 RESULTS
4.1 Preliminary Data Analysis
4.1.1 Statistics for Roadside Inspections
For a given type of carrier (Hazmat/Incorporated, Non-Hazmat/Unincorporated, For-hire,
Private, Exempt), vehicle-populations are inspected fairly uniformly with respect to
average annual vehicle mileage. This means low-mileage carriers are inspected
commensurately with high-mileage carriers of the same type, highlighting a carrier's
'annual vehicle mileage' as an exposure variable in the roadside inspection process.
* Carrier fleet size contributes to the carrier's exposure to roadside inspections; i.e., larger
fleets tend to be inspected more frequently at the roadside.
* When normalized by average vehicle mileage, single-vehicle For-hire carriers (assumed to
be owner/operators) are inspected at virtually the same rate (20 inspections per million
miles annually) as single-vehicle Private carriers (22 inspections per million miles
annually). Single-vehicle Exempt carriers are inspected about half as often (13 inspections
per million miles annually).
* Normalized by average vehicle mileage, For-hire carriers with fleets of 2 - 5 vehicles are
inspected 1.4 times as often (52 inspections per million miles annually) as similar Private
carriers (37 inspections per million miles annually).
* Normalized by average vehicle mileage, For-hire carriers with fleets of more than 5
vehicles are inspected 3 times as often (375 inspections per million miles annually) as
similar Private carriers (120 inspections per million miles annually) and 6 times as often as
all carriers classified as both Private and For-hire (67 inspections per million miles
annually).
11

* Normalized by average vehicle mileage, inspection frequencies for incorporated carriers
are 2 - 3 times those organized as individual or partnership businesses.
* When normalized by average vehicle mileage, inspection frequencies for registered
Hazmat carriers are 2 to 4 times that of non-Hazmat carriers. In part, this maybe
explained by the fact that many large general commodity less-than-truckload carriers in
Minnesota are also registered Hazmat carriers. Supporting this is the previous finding that
inspection frequencies for large For-hire carriers are 3 times greater than similar large
Private carriers. However, since Hazmat registered carriers comprise approximately 10%
of the population of interstate freight carriers in Minnesota, and these carriers received
approximately 40% of all inspections performed during the period from 1992 to 1995,
there may be a bias at inspection sites toward selecting vehicles that display Hazmat
placards. Since the datasets received from FHWA did not contain placarding information,
the analysis was unable to correlate this higher inspection frequency with Hazmat vehicle
placarding requirements.
* Vehicle-related OOS violations occur approximately 3 - 4 times more frequently than
driver-related OOS violations.
* Nearly 90% of all driver-related OOS violations are related to problems with the driver's
required 'record of duty' (hours-of-service and missing documents)
* The most common vehicle OOS violations in the dataset are brake-related (53%). The
second and third most common are related to 'steering/suspension/wheels/rims' (18%) and
'lighting devices' (15%).
* Among Hazmat-registered carriers, Hazmat-related OOS violations occur infrequently
(3%), while the frequency of vehicle and driver related OOS violations are similar to that
of non-Hazmat carriers. For carriers without Hazmat registration, Hazmat-related OOS
violations are rare.
12

* The most common Hazmat OOS violations are related to 'placarding and proper markings
on Hazmat containers and tanks' (43%), while the second most common involve 'cargo
tank/loading & securement, and radioactivity' (40%).
* In general, the OOS rate at fixed inspection sites appears as carrier-dependent and site-
independent. The result, obtained by analyzing well-inspected carriers, suggests that the
most accurate estimate of a carrier's OOS rate is obtained when its vehicles/drivers are
inspected with regularity.
* A comparison of the OOS rates at the Minnesota-administered 'St Croix' scale and the
Wisconsin-administered 'Hudson' scale demonstrates that the OOS rates of the same
carriers at both sites are similar, indicating that OOS inspection criteria and inspection
procedures are similar as well.
4.1.2 Statistics for CRs
* Driver factors, operational factors and vehicle factors are the most common individual
factors negatively affecting overall ratings in CRs.
* 52% of all CRs in the dataset showed the driver factor rated as conditional.
* The general regulations factor was rarely rated unsatisfactory, and when rated conditional,
this factor always ranked behind the driver, operational and vehicle factors.
* The Hazmat factor did not affect the review of any carrier that did carry Hazmat
registration, but this factor rarely appeared as conditional or unsatisfactory even among
Hazmat-registered carriers.
13

* The accident rate factor is commonly rated conditional among Hazmat-registered carriers
that received conditional or unsatisfactory overall ratings.
* The accident rate factor rarely affected the overall rating of carriers without Hazmat
registration.
4.2 Modeling the Effectiveness of CRs
Results from the CR model and significance tests are shown in tables for each carrier group.
* Overall, carriers that received a CR have an average OOS rate 9% lower than the average
for carriers without CRs.
* Among For-hire carriers (Table 4.1), carriers having a CR had significantly lower OOS
rates when compared to carriers without a CR. Fleets of 2 - 5 vehicles showed a 24%
decrease in mean OOS rate, while fleets greater than 5 vehicles showed a 12% decrease in
mean OOS rate. The exception among the For-hire classification is for single-vehicle
carriers where OOS rates actually rose significantly (73%) after receiving a CR.
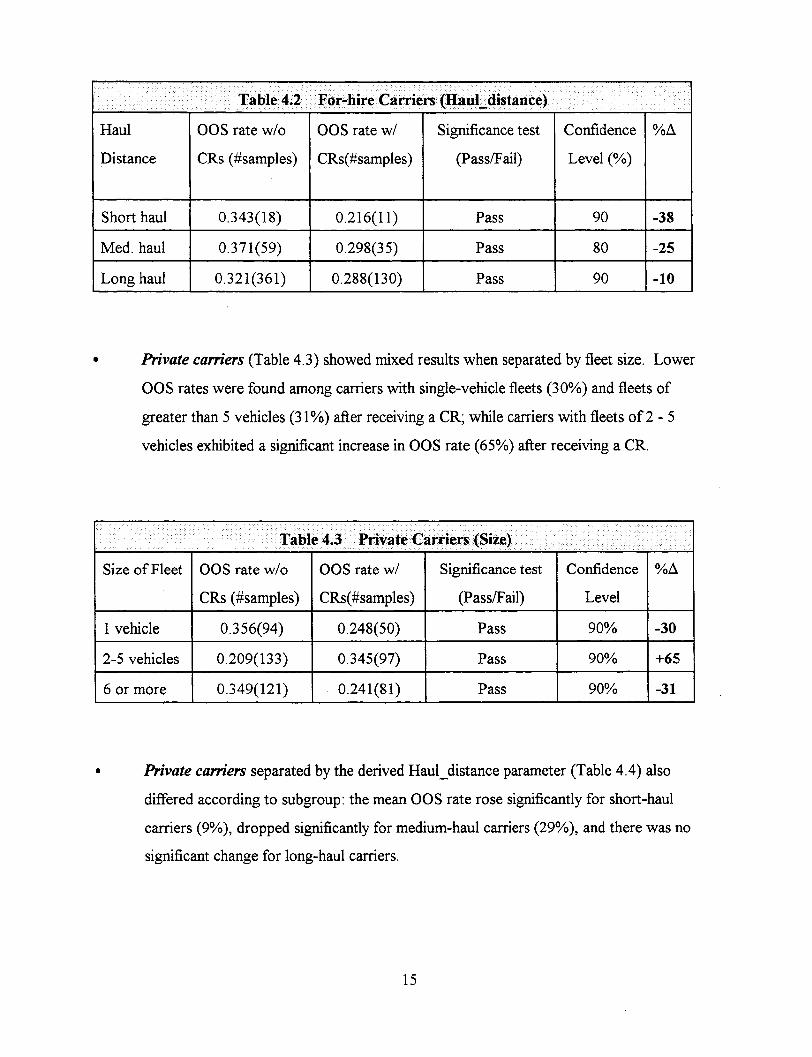
For-hire carriers separated by the derived Haul_distance parameter (Table 4.2) showed
significant decreases in mean OOS rates after receiving a CR: short-haul (38% lower),
medium-haul (25% lower), and long-haul (10% lower).
14
Table 4.1 For-nhire Carriers (Size)FO ___
Size of Fleet OOS rate w/o OOS rate w/ Significance test Confidence %A
CRs (#samples) CRs(#samples) (Pass/Fail) Level (%)
1 vehicle 0.186(67) 0.322(33) Pass 90 +73
2-5 vehicles 0.371(77) 0.281(54) Pass 90 -24
6 or more 0.321(294) 0.281(89) Pass 90 -12
.. :: ::i . : Table 4.2 or-hire Carriers (Haul distance) : : ::::
Haul OOS rate w/o OOS rate w/ Significance test Confidence %A
Distance CRs (#samples) CRs(#samples) (Pass/Fail) Level (%)
Short haul 0.343(18) 0.216(11) Pass 90 -38
Med. haul 0.371(59) 0.298(35) Pass 80 -25
Long haul 0.321(361) 0.288(130) Pass 90 -10
Private carriers (Table 4.3) showed mixed results when separated by fleet size. Lower
OOS rates were found among carriers with single-vehicle fleets (30%) and fleets of
greater than 5 vehicles (31%) after receiving a CR; while carriers with fleets of 2 - 5
vehicles exhibited a significant increase in OOS rate (65%) after receiving a CR.
Table 4.3 Private Carriers (Size): _i__
Size of Fleet OOS rate w/o OOS rate w/ Significance test Confidence %A
CRs (#samples) CRs(#samples) (Pass/Fail) Level
1 vehicle 0.356(94) 0.248(50) Pass 90% -30
2-5 vehicles 0.209(133) 0.345(97) Pass 90% +65
6 or more 0.349(121) 0.241(81) Pass 90% -31
Private carriers separated by the derived Haul_distance parameter (Table 4.4) also
differed according to subgroup: the mean OOS rate rose significantly for short-haul
carriers (9%), dropped significantly for medium-haul carriers (29%), and there was no
significant change for long-haul carriers.
15

Exempt carriers (Table 4.5) showed a significant decrease in mean OOS rates among
fleets of more than one vehicle (37%) after a CR. There was no significant difference in
the mean OOS rate for single-vehicle carriers after a CR. When separated by the
Haul_distance parameter (Table 4.6), only long-haul Exempt carriers exhibited a
significant decrease (22%) in mean OOS rate after a CR.
16
I I: :ab :i!:: ble 4.4 Private Carriers (Haul distance) _i::: _: :
Haul OOS rate w/o OOS rate w/ Significance test Confidence %A
distance CRs (#samples) CRs(#samples) (Pass/Fail) Level
Short haul 0.278(119) 0.303(65) Pass 90% +9
Med. haul 0.405(178) 0.287(131) Pass 90% -29
Long haul 0.226(51) 0.260(32) Fail 90%
T: ale 4.5 xempt: Carriers (Size) _
Size of Fleet OOS rate w/o OOS rate w/ Significance test Confidence %A
CRs (#samples) CRs(#samples) (Pass/Fail) Level
1 vehicle 0.105(48) 0.177(38) Fail 80%
2 or more 0.295(80) 0.185(60) Pass 90% -37
S::Table 4.6: Exempt Ct: :.ardr.iers : (Haul dist ance) :: :
Haul OOS rate w/o OOS rate w/ Significance test Confidence %A
distance CRs (#samples) CRs(#samples) (Pass/Fail) Level
Short haul -- ----------------- not enough data for testing --
Med. haul 0.175(59) 0.167(37) Fail 80%
Long haul 0.248(58) 0.194(51) Pass 90% -22

Carriers classified as both For-hire and Private (Table 4.7) showed a significant drop in
the mean OOS rate after a CR (24%).
* In four of the six groups that described carriers as Non-Hazmat carriers (Tables 4.8 and
4.9), those that had a CR exhibit OOS rates that are significantly lower than the OOS rates
of similar carriers without a CR.
* Depending on the non-Hazmat group identified, the reduction in OOS rate is between
12% and 39%.
17
Table 4.7 For-hire/Priate Carriers
Size of Fleet OOS rate w/o OOS rate w/ Significance test Confidence %A
CRs (#samples) CRs(#samples) (Pass/Fail) Level
all fleets 0.406(26) 0.310(13) Pass 90% -24
:::Table 4.8 Non-Hazmatunincorporated Carriers Haul distance)
Haul OOS rate w/o OOS rate w/ Significance test Confidence %A
distance CRs (#samples) CRs(#samples) (Pass/Fail) Level
Short haul 0.382(113) 0.232(62) Pass 90% -39
Med. haul 0.296(70) 0.356(46) Fail 90%
Long haul 0.329(131) 0.227(76) Pass 90% -31
Table 4.9 Non-Hazmat/incorporated Carriers (Hauldistance)
Haul OOS rate w/o OOS rate w/ Significance test Confidence %A
distance CRs (#samples) CRs(#samples) (Pass/Fail) Level
Short haul 0.303(223) 0.244(116) Pass 90% -19
Med. haul 0.312(94) 0.377(46) Fail 90%
Long haul 0.320(189) 0.281(97) Pass 90% -12

* Carriers registered as hazardous material haulers (Table 4.10 and Table 4.11), it was
found that in some cases not enough data was present for a significance test. For all of the
Hazmat/unincorporated carrier groups, there was insufficient data to apply the model.
However, for the three Hazmat/incorporated carrier groups, we found no significant
difference in the mean OOS rate of carriers that had a CR as compared with similar
carriers without a CR. From preliminary analyses, it was found that incorporated Hazmat-
registered carriers (believed to be large, general commodity carriers) are very well
inspected at the roadside. It is possible that this higher exposure to roadside inspections
creates a dominant effect on these carriers' OOS rates, and makes it difficult to measure
significant changes in OOS rates after CRs are applied.
.Table 4!.0 Hazmatincorporated Carriers (Hauldistance)
Haul OOS rate w/o OOS rate w/ Significance test Confidence %A
distance CRs (#samples) CRs(#samples) (Pass/Fail) Level
Short haul 0.266(46) 0.249(32) Fail 90%
Med. haul 0.364(20) 0.396(12) Fail 90%
Long haul 0.290(49) 0.339(17) Fail 90%
Table 4.11 Hazmat/unincorporate CarriersHaul distance)
Haul OOS rate w/o OOS rate w/ Significance test Confidence %A
distance CRs (#samples) CRs(#samples) (Pass/Fail) Level
Short haul --- -------- -------- not enough data for testing --- ---
Med. haul --------------- --------- not enough data for testing --
Long haul -------------- -------- not enough data for testing -----
18
5.0 CONCLUSIONS AND RECOMMENDATIONS
The effectiveness of a CR toward improved safety practice
The event of a CR appears to have a measurable effect on lowering a carrier's OOS rate in the
year following the review as compared with the OOS rates of carriers never reviewed or without
recent exposure to the CRs. This makes sense when considering that, from the preliminary data
analysis, the most problematic review factors are driver, operational and vehicle factors.
Specifically, the infractions discovered within these areas during a review relate directly to those
that would be discovered in a roadside inspection.
Using an interstate freight carrier's For-hire, Private, or Exempt classification, together with its
known fleet size, appears to be the most reasonable way to establish subpopulations of carriers for
measuring change in OOS rate. In particular, it was found that only three out of the nine carrier
groups did not exhibit significantly lower mean OOS rates than those of similar groups without
CRs. For one of these three groups, single-vehicle Exempt carriers, the mean OOS rate was not
significantly different. The other two groups, For-hire owner/operators and Private carriers with
fleets of 2-5 vehicle fleets, exhibited significantly higher OOS rates.
In the remaining six sub-populations, carriers receiving CRs exhibited significantly lower OOS
rates in the year following these reviews as compared to OOS rates, in the same year, of similar
carriers without CRs. The model revealed a significant positive response among large (fleets of
greater than 5 vehicles) For-hire and Private carriers, where the reduction in OOS rates were 12%
and 31% respectively, and for all Exempt carriers with more than one vehicle (OOS rates down
37%). Also of significance were lower OOS rates among For-hire carriers with fleets of 2-5
vehicles (24%), single-vehicle Private carriers (30%), and all carriers described as both For-hire
and Private (24%).
Data requirements
As with any statistical approach to data analysis, results will be impacted by the quality of the
data. In this model for the effectiveness of CR activities, we have encountered two areas of
19
concern in the quality of the SafteyNet datasets. One centers on the completeness of information
available in FHWA's Census database regarding physical characteristics (size of vehicle fleets,annual mileage, number of drivers) for Minnesota-based carriers. Many of the records in the
extracted set of Minnesota-based carriers did not contain this required information (25%) and the
associated carriers could not be included in our modeling analysis even though many of them had
received a CR and/or were inspected at the roadside. An effort to increase the number of
complete records extracted from the Census database would increase the size of the sample
available for analysis.
The second area concerning data is with regard to obtaining an adequate estimate of a carrier's
OOS rate, particularly for carriers recently receiving CRs. If a carrier's vehicles are not inspected
in a given year, then the OOS rate for that year cannot be established. Also, from a practical point
of view, the estimate of a carrier's annual OOS rate becomes more accurate as the number of its
roadside inspections increases. Further, within this proposed model for evaluating the educational
value of Minnesota's CR activities, there is a need to ensure that carriers receiving CRs are
adequately inspected at the roadside in the ensuing year. Should this model be implemented, it is
recommended that information identifying those carriers that recently received CRs be shared with
inspectors at inspection sites in order to improve and maintain the accuracy of carriers' estimated
OOS rates. A recommended rule-of-thumb is that two inspections per year should be a minimum
for all but the largest carriers, where somewhere between five to ten inspections per year should
be a minimum. When modeling a CR performance measure from OOS violation data, developing
and maintaining timely information-sharing methods and technologies at roadside inspection sites
will be of key importance.
20

REFERENCES
1. Moses, L.N. and I. Savage (1994), "A Cost-Benefit Analysis of United States Motor Carrier
Safety Programs," University of Michigan, Ann Arbor: Great Lakes Center for Truck and Transit
Research.
2. "Vison for the Future," Remarks prepared by George L. Reagle, OMC Associate
Administrator, Presented at the National Motor Carrier Assistance Program 1997 Grants
Workshop, St. Louis, MO. March 3, 1997.
3. Craft, Robert and Eric N. Dobson (1991); Truck and Bus Accidents: Getting the Facts,
National Governors' Association, Washington D.C.
4. Transport Topics, "News Digest," American Trucking Associations Inc., Alexandria, VA,
Vol. 26, pp. 173-79.
5. U.S. Department of Transportation Federal Highway Administration (1995), Federal Motor
Carrier Safety Regulations Pocketbook, publisher J.J. Keller and Associates, Inc.
6. Hollander, Myles and Wolfe, I. (1973), "The Two-Sample Location Problem," Nonparametric
Statistical Methods, pp. 67-81.
7. Dowdy, Shirley and Weardon, Stanley (1991), "Nonparametric Statistics: Matched-pair and
Two Sample Rank Tests," Statistics for Research, Second Edition, pp. 218-23.
8. Wilcoxin, F. (1964), Some Rapid Approximate Statistical Procedures, 2nd Ed. American
Cyanamid Co., Lederle Laboratories, Pearle River, N.Y.
9. Walsh, J. E. (1965), Handbook of Nonparametric Statistics, II, Van Nostrand, Princeton, N.J.
21

10. Moses, L. E. (1965), "Query: Confidence limits from rank tests," Technometrics 7,
pp. 257-60
11. Moses, L.N. and I. Savage (1994), "The Effect of Firm Characteristics on Truck Accidents,"
Accident Analysis and Prevention, Vol. 26, pp. 173-79.
12. Moses, L.N. and I. Savage (1995), "A Strategy for Identifying Dangerous Trucking Firms,"
University of Michigan, Ann Arbor: Great Lakes Center for Truck and Transit Research.
22

Appendix A
Algorithms for Grouping Similar Carriers

The population of carriers within each of the categorical groups created by either categorical
separation procedure will still vary according to extent of service. Therefore, for tighter focus on
carrier populations, we further break down categorical groups by focusing on one of three
parameters that are developed and calculated for each carrier in the aggregate sample of carriers:
(1) Size parameter, (2) Average Vehicle Mileage (AVM) parameter, and (3) Haul_distance
parameter. The definitions/derivations of these parameters are given below along with their
defined categorical values (CValue).
1. Size parameter:
Algorithm: Size = (total # of drivers) + (total # of power units) {Procedure 1}
Size = (total # of power units) {Procedure 2}
C_Value (Size) = [ small, medium, or large]
2. Average Vehicle Mileage (A VM) parameter:
Algorithm: AVM = (total annual mileage) / (total # of power units) {both procedures}
C_Value (AVM) = [ low, medium, or high miles ]
To obtain the C_value of a parameter for any particular carrier, each of the categorical groups
(Figure 1) are separated into three approximately equal-sized subsets using the values of the Size
or AVM parameters. Thus, we have two different views of the aggregate sample of carriers.
View 1 12 groups (9 in procedure 2) that separate the master recordset (Census database)
according to ORG/HAZMAT type and the C_Values of the Size parameter.
View 2 12 groups (9 in procedure 2) that separate the master recordset (Census database)
according to ORG/HAZMAT type and the C_Values of the AVM parameter.
3. Haul_distance parameter:
A third parameter was developed in an attempt to assess an 'average haul distance per vehicle.'
The goal is to find groups that represent 'short haul', 'medium haul' and 'long haul' types of
A-i

carriers, however, the needed 'number of road trips made per year' is a statistic that is unavailable
in the database. Thus, an alternative approach is adopted and should correlate well with 'average
haul distance per vehicle'. Motivation for the development of the Haul_distance parameter stems
from the understanding that 'average haul distance' has been viewed as an explanatory variable in
other research [11, 12]. The grouping that results from use of this parameter was used only in the
modeling approach for evaluation of CR activities and not in any of the preliminary data analyses.
The Haul_distance parameter is explained next.
Algorithm: For every carrier having complete characteristic data, two variables are formed
from data:
Variable (1): Average # of miles per driver = (total annual mileage) / (total # of drivers)
Variable (2): Ratio of vehicles to drivers = (total # of power units) / (total # of drivers)
Variable (1) is used to form a preliminary grouping of the typed carrier groups. This results in 12
preliminary groups (9 in Procedure 2) where each of the categorical groups are separated into
three approximately equal-sized subgroups representing 'Low miles', 'Medium miles', and 'High
miles' carriers. This procedure is similar to AVM parameter except with respect to the carrier's
total drivers instead of total power units.
Variable (2), the vehicle-to-driver ratio, is then used to remap the carriers in these preliminary
groups to groups which will represent 'Short haul', 'Medium haul' and 'Long haul' types. Here
the idea is that carriers with low vehicle-to-driver ratios tend to employ drivers on several shifts
using the same vehicles and are more likely to be 'local' haulers by nature. Conversely, carriers
with high vehicle-to-driver ratios (approx 2.0 or higher) a more likely to dispatch trucks on longer
routes. With these ideas in mind, carriers with vehicle-to-driver ratios smaller than 0.9 are shifted
from their current group to the neighboring group of lower mileage (if the carrier's current
subgroup is 'Short miles', its new group does not change). Carriers with vehicle-to-driver ratios
larger than 2.0 are shifted from their current group to the neighboring group of higher mileage (if
the carrier's current group is 'Long miles', its new group does not change). When variable (2)
A-2

has been used to remap all of the carriers, then what were low, med., and high miles groups, now
become the new groups 'Short haul', 'Medium haul' and 'Long haul':
C_value (Haul_distance) = [ Short, Medium, or Long haul ]
Using the Haul_distance in conjunction with the carrier type (i.e. ORG/Hazmat), yields the third
view of the aggregate sample of Minnesota-based carriers.
View 3 12 groups (9 in method 2) that separate the master recordset (Census database)
according to ORG/Hazmat type and the C_Values of the Haul_distance
parameter.
The resulting three views for each categorical separation procedure of the master recordset are
given on the following pages.
A-3

Categorical Separation Procedure 1:
1. Focus on Size parameter:
Non-Hazmat/Non-corporations
Group ID C
1001 s1
1002 m
1003 la
Hazmat/Corp variables
Value
mall
edium
rge
# of carriers
1084
294
1006
range of 'Size'
<3
3-4
>4
Non-Hazmat/Corporations
Group ID
2001
2002
2003
Hazmat/Non-corporations
Group ID
1101
1102
1103
Hazmat/Corporations
Group ID
2101
2102
2103
C_Value
small
medium
large
C Value
small
medium
large
C Value
small
medium
large
# of carriers
1147
738
997
# of carriers
37
25
33
# of carriers
221
180
207
range of 'Size'
<5
5-10
> 10
range of 'Size'
<4
4-8
>8
range of 'Size'
<9
9 - 26
>26
2. Focus on A VMparameter:
Non-Hazmat/Non-corporations
C Value
Low-miles
Medium-miles
High-miles
# of carriers
800
781
803
range of 'AVM'
< 18 000
18 000- 55 000
> 55 000
A-4
Group ID
1001
1002
1003
Non-Hazmat/Corporations
Group ID
20012002
2003
Hazmat/Non-corporations
Group ID
1101
1102
1103
Hazmat/Corporations
Group ID
2101
2102
2103
C_Value
Low-miles
Medium-miles
High-miles
C Value
Low-miles
Medium-miles
High-miles
C Value
Low-miles
Medium-miles
High-miles
# of carriers
961
939
982
# of carriers
32
30
33
# of carriers
203
201
204
range of 'AVM'
< 12 400
12 400 - 35 000
> 35 000
range of 'AVM'
< 19 000
19 000 - 38 750
> 38 750
range of 'AVM'
< 16 850
16 850 - 46 667
> 46 667
3. Focus on Haul distance parameter:
Non-Hazmat/Non-corporations
C_Value
short-haul
medium-haul
long-haul
# of carriers
917
618
849
Non-Hazmat/Corporations
Group ID
2001
2002
2003
C Value
short-haul
medium-haul
long-haul
# of carriers
1124
620
921
A-5
Group ID
1001
1002
1003

Hazmat/Non-corporations
Group ID
1101
1102
1103
Hazmat/Corporations
Group ID
2101
2102
2103
C Value
short-haul
medium-haul
long-haul
C_Value
short-haul
medium-haul
long-haul
# of carriers
36
26
33
# of carriers
209
173
226
Categorical Separation Procedure 2:
4. Focus on Size parameter:
For-hire
For-hire/Private/Exempt classification
Group ID
1001
1002
1003
C_Value
small
medium
large
Private
Group ID
2001
2002
2003
Exempt
Group ID
1101
1102
C Value
small
medium
large
C Value
small
medium
# of carriers
365
377
464
# of carriers
1171
1233
749
# of carriers
514
401
range of 'Size'
1
2-5
>5
range of 'Size'
1
2-5
>5
range of 'Size'
1
>1
A-6

For-hire and Private
Group ID
2100
C_Value
All carriers
# of carriers
81
range of 'Size'----------5. Focus on A VMparameter:
For-hire
Group ID
1001
1002
1003
Private
Group ID
2001
2002
2003
Exempt
Group ID
1101
1102
1103
C Value
Low-miles
Medium-miles
High-miles
C_Value
Low-miles
Medium-miles
High-miles
C Value
Low-miles
Medium-miles
High-miles
# of carriers
286
440
480
# of carriers
2567
486
100
# of carriers
293
365
915
range of 'AVM'
< 35 000
35 000 - 80 000
> 80 000
range of 'AVM'
< 35 000
35 000 - 80 000
> 80 000
range of 'AVM'
< 35 000
35 000 - 80 000
> 80 000
6. Focus on Haul_distance parameter:
For-hire
Group ID
1001
1002
1003
C Value
short-haul.
medium-haul
long-haul
# of carriers
122
338
746
A-7
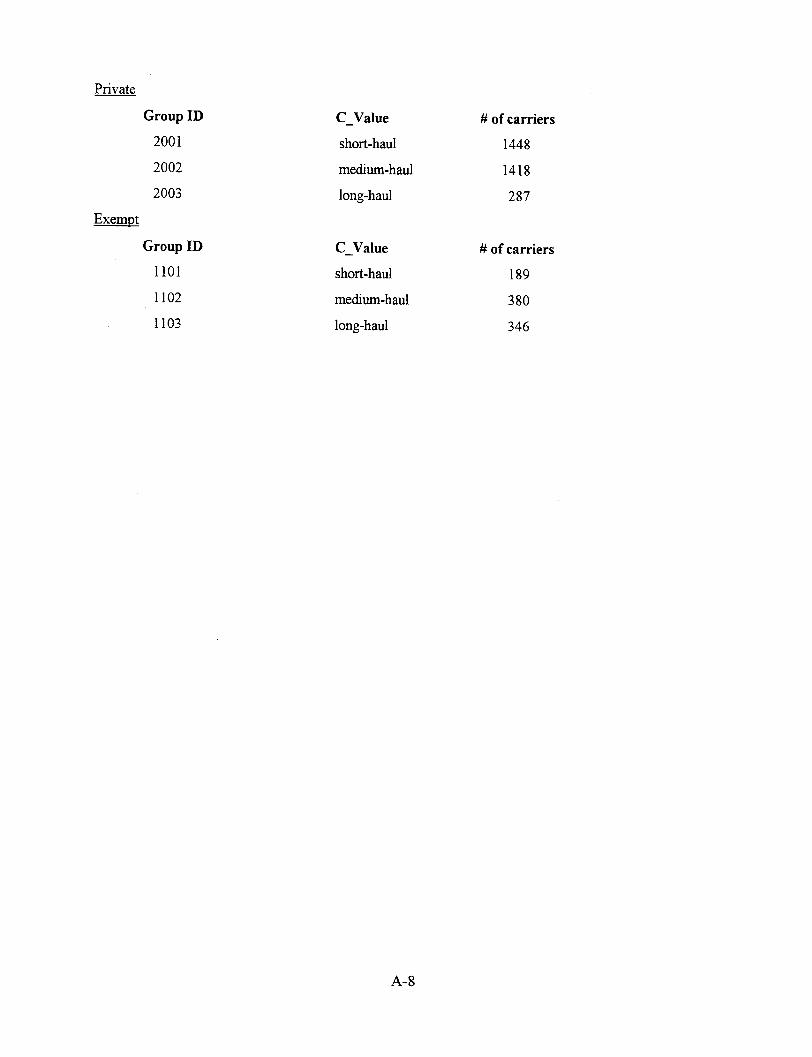
Private
Group ID
2001
2002
2003
Exempt
Group ID
1101
1102
1103
C Value
short-haul
medium-haul
long-haul
C Value
short-haul
medium-haul
long-haul
# of carriers
1448
1418
287
# of carriers
189
380
346
A-8

Appendix B
Inspection Frequency by Group (Size and AVM)


We examine the inspection frequency of carriers in the dataset that were subject to inspections
throughout the years 1992 - 1995. There were 74740 total inspections performed on 3668
carriers. Both methods of categorically separating these carriers into smaller carrier groups were
used (i.e., Hazmat/Corp variables vs. For-hire/Private/Exempt variables).
Approach
A small carrier identified using the 'Size' parameter is not necessarily low-AVM. In correlating
the 'Size' parameter to the 'AVM' parameter, a fairly low correlation coefficient of 0.343 is
found, which supports analyzing both of these characteristics. Average yearly inspection
frequencies were estimated using the 12 'Size' groups and the 12 'AVM' groups under the
Hazmat/Corp categorical separation method; and again using the 9 'Size' groups and 9 'AVM'
groups using the For-hire/Private/Exempt categorical separation method. The frequency
estimates for these different data breakouts are shown in Appendix B. Average yearly inspection
frequencies are calculated for each group, along with a version of this statistic that is normalized
by the average vehicle mileage (in millions of miles) of the group. Other statistics included are the
sample size and the total number of inspections in the group for a typical year.
Another statistic calculated for each group was the ratio of fixed site inspections to roving site (a
mobile inspection unit) inspections. This parameter, called the F/R index, gives a rough indication
of the mix of site types, fixed or roving, involved in inspections for groups of carriers in this
analysis. For example, an F/R index = 1 indicates that fixed sites and roving sites are equally
represented in the calculation of a given inspection frequency. An F/R index under 1 indicates an
inspection frequency due more to roving site inspections; an F/R index over 1 indicates an
inspection frequency due more to fixed site inspections.
The following pages show a tabulation of the results.
B-1

Method 1: Hazmat/Corp variables
1. Grouping by AVM parameter:
Group
Non-Corp/Non-HM
Low-miles(1001)
Med.-miles(1002)
High-miles(1003)
Corp/Non-HM
Low-miles(2001)
Med.-miles(2002)
High-miles(2003)
Non-Corp/HM
Low-miles(l101)
Med.-miles(1102)
High-miles(1103)
Corp/HM
Low-miles(2101)
Med.-miles(2102)
High-miles(2103)
# of carriers
312
456
606
541
619
777
Total # of Avg. # insp.s Avg. # insp. 's per yrly.
insp.s / year per year million veh. miles F/Rindex
222
765
1757
528
1114
6270
9
8
20
91
101
128
36
13
24
523
470
6640
0.71
1.68
2.90
1.16
1.80
8.07
3.97
1.56
12.20
5.75
4.67
51.87
65.2
43.8
31.5
0.88
1.32
1.46
128.8
71.2
101.0
0.91
1.10
1.58
238.1
54.8
173.2
1.95
1.27
1.68
512.0
133.8
226.0
0.83
1.20
1.77
B-2
----------------------------------------------------------------------------------------------------------------
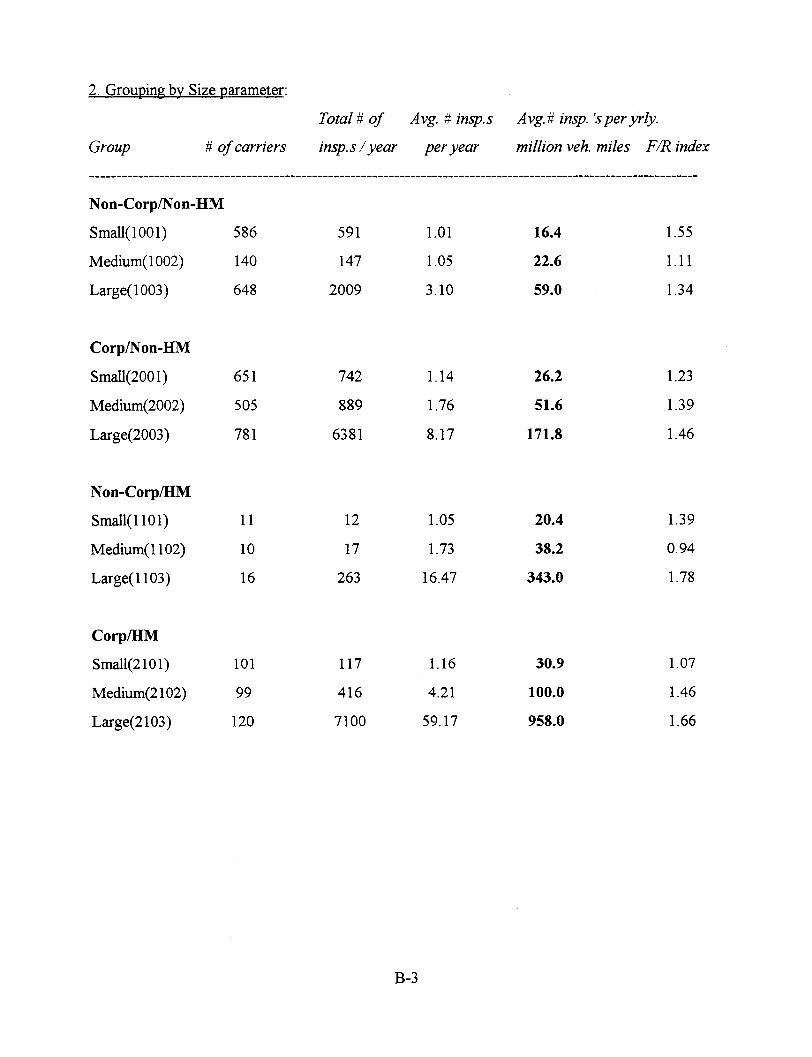
2. Grouping by Size parameter:
# of carriers
Total # of
insp.s /year
Avg. # insp.s
per year
Avg. # insp. 's per yrly.
million veh. miles F/R index
Non-Corp/Non-HM
Small(1001)
Medium(1002)
Large(1003)
Corp/Non-HM
Small(2001)
Medium(2002)
Large(2003)
Non-Corp/HM
Small(l101)
Medium(1102)
Large(1103)
Corp/HM
Small(2101)
Medium(2102)
Large(2103)
Group
586
140
648
591
147
2009
16.4
22.6
59.0
1.55
1.11
1.34
26.2
51.6
171.8
1.23
1.39
1.46
1.01
1.05
3.10
1.14
1.76
8.17
1.05
1.73
16.47
1.16
4.21
59.17
651
505
781
11
10
16
101
99
120
742
889
6381
12
17
263
117
416
7100
20.4
38.2
343.0
1.39
0.94
1.78
30.9
100.0
958.0
1.07
1.46
1.66
B-3
--- -- -- --- -- -- --- -- -- -- --- -- -- --- -- -- -- --- -- -- --- -- -- -- --- -- -- --- -- -- --

Method 2: classification For-hire/Private/Exempt
3. Grouping by AVM parameter:
# of carriers
Total # of Avg. # insp.s Avg. # insp. 's per yrly.
insp.s /year per year million veh. miles F/Rindex
For-hire
Low-miles(1001)
Med.-miles(1002)
High-miles(1003)
Private
Low-miles(2001)
Med.-miles(2002)
High-miles(2003)
Exempt
Low-miles(1l101)
Med.-miles(1102)
High-miles(1103)
Group
154.3
172.5
185.0
1.41
1.65
1.79
226
369
421
1471
365
74
168
233
204
719
3615
8880
2151
740
372
291
495
493
3.18
9.80
21.09
1.46
2.03
5.03
1.74
2.12
2.42
99.1
39.5
23.0
0.87
1.07
1.16
86.5
37.2
22.0
1.95
1.27
1.68
B-4
--- ---------------- --- -------- -------- -- ------------- -----------------------

2. Grouping by Size parameter:
# of carriers
Total # of
insp.s /year
Avg. # insp.s
per year
Avg. # insp. 's per yrly.
million veh. miles F/R index
For-hire
Small(1001)
Medium(1002)
Large(1003)
Private
Small(2001)
Medium(2002)
Large(2003)
Exempt
Small(l101)
Medium(1102)
For-hire/Private
All(2100)
Group
19.6
51.6
375.5
1.64
1.57
1.74
275
318
423
535
761
614
316
289
450
996
11768
424
769
2071
287
993
22.4
37.3
120.6
1.64
3.13
27.82
0.80
1.01
3.37
0.91
3.44
3.68
1.16
1.11
0.84
13.0
57.9
63
1.45
1.24
233 66.7 1.50
B-5
------------------- -- ------------- ---- ----------------- -- ----------------- --


Appendix C
OOS violations by category among AVM groups


Grouping the OOS violations found in the roadside inspection dataset into 14 subsets across three
general categories (Driver, Vehicle, and Hazmat), the most common OOS violatios were
identified in each category. The OOS violation subsets are shown below.
Driver OOSs
1. Licensing Problems
2. Physical Ailments and General Operation (392.2) Problems
3. Drugs and Alcohol
4. Record of Duty Problems
Vehicle OOSs
1. Brake-related
2. Coupling Devices
3. Exhaust/Fuel Systems
4. Lighting Devices
5. Steering/Suspension/Wheels/Rims
6. Safe Loading
7. Tires (and Miscellaneous)
Hazmat OOSs
1. Truck and Shipping Papers
2. Placarding & Markings on containers and tanks
3. Cargo Tanks/Loading and Securement/Radioactive levels
Approach 1 This approach has the viewpoint that a single inspection may have several OOS
violations as an outcome. In other words we are counting OOS violations.
Approach 2 This approach views each inspection as having only one possible OOS outcome,
where each OOS violation cited in the inspection report is given fractional credit for cause. This
credit is distributed among the three major categories: Driver, Vehicle and Hazmat.
C-1

Observations ofApproach
The results of taking either Approach 1 or Approach 2 are extremely similar, suggesting very few
inspections result in OOS violations in two or more categories (i.e., both driver and vehicle OOS
violations that lead to the OOS event). There are no significant differences in the calculated
percentage of OOS's that are Driver, Vehicle or Hazmat and the Vehicle-to-Driver OOS ratio
(V/D ratio):
Driver Vehicle Hazmat V/D ratio
Approach 1: 22% 78% 0.8% 3.6
Approach 2: 27% 72% 0.8% 2.6
The following pages show a tabulation of the results.
C-2

1. Using Hazmat/Corp category groups
NonHazmat/NonCorp/Low Miles(1001) ........... 251 OOS violations ..... 4.7 V/D ratio
Categories 1 2 3 4 5 6 7 #smpls
Driver (%): 20 14 0 66 44
Vehicle(%): 45 1 1 14 26 3 9 207
Hazmat(%): 0 0 0 0
NonHazmat/NonCorp/Med. Miles(1002) ........... 1001 OOS violations ..... 5.8 V/D ratio
Categories 1 2 3 4 5 6 7 #smpls
Driver (%): 6 11 2 81 147
Vehicle(%): 54 2 2 11 18 4 9 854
Hazmat(%): 0 0 0 0
NonHazmat/NonCorp/High Miles(1003) ............ 2039 OOS violations ..... 3.8 V/D ratio
Categories 1 2 3 4 5 6 7 #smpls
Driver (%): 3 8 1 89 424
Vehicle(%): 57 1 2 12 19 3 6 1615
Hazmat(%): 0 0 0 0
NonHazmat/Corp/Low Miles(2001) ...................... 620 OOS violations ..... 6.2 V/D ratio
Categories 1 2 3 4 5 6 7 #smpls
Driver (%): 17 8 3 71 86
Vehicle(%): 46 1 2 19 16 11 5 531
Hazmat(%): 1 0 0 3
NonHazmat/Corp/Med. Miles(2002) ................... 1176 OOS violations ..... 4.9 V/D ratio
Categories 1 2 3 4 5 6 7 #smpls
Driver (%): 9 7 5 80 198
Vehicle(%): 52 1 3 16 14 4 9 970
Hazmat(%): 38 50 12 8
C-3

NonHazmat/Corp/High Miles(2003) ................. 8360 OOS violations ..... 3.6 V/D ratio
Categories 1 2 3 4 5 6 7 #smpls
Driver (%): 2 7 2 90 1800
Vehicle(%): 53 1 2 14 18 6 6 6553
Hazmat(%): 29 71 0 7
---------------------------------- ------------- M------
Hazmat/NonCorp/Low Miles(ll01) ................. 65 OOS viol. samples ..... 6.2 V/D ratio
Categories 1 2 3 4 5 6 7 #smpls
Driver (%): 0 0 0 100 9
Vehicle(%): 59 0 2 2 34 0 4 56
Hazmat(%): 0 0 0 0
---- ------ m--------m------- -- M----------- ------- ----------
Hazmat/NonCorp/Med. Miles(1102) .................... 8 OOS viol. samples ..... 7.0 V/D ratio
Categories 1 2 3 4 5 6 7 #smpls
Driver (%): 0 0 0 100 1
Vehicle(%): 29 0 0 14 43 0 14 7
Hazmat(%): 0 0 0 0
----- ---- - ------------ m----------------------- --------
Hazmat/NonCorp/High Miles(1103) .............. 280 OOS viol. samples ..... 2.9 V/D ratio
Categories 1 2 3 4 5 6 7 #smpls
Driver (%): 6 10 3 87 71
Vehicle(%): 48 1 3 10 31 1 6 208
Hazmat(%): 0 100 0 1
---- m----- m---m--m------- ---- ---- ---------------------------
Hazmat/Corp/Low Miles(2101)...................... 402 OOS viol. samples ..... 3.4 V/D ratio
Categories 1 2 3 4 5 6 7 #smpls
Driver (%): 19 10 3 67 88
Vehicle(%): 40 1 3 24 17 7 9 295
Hazmat(%): 32 37 32 19
C-4
--- --- --- --- --- --- --- --- --- --- -- --- --- ---m wm m--- --- --- -m --

Hazmat/Corp/Med.Miles(2102) ............... 645 OOS viol. samples ..... 7.7 V/D ratio
Categories 1 2 3 4 5 6 7 #smpls
Driver (%): 8 8 1 82 72
Vehicle(%): 52 1 1 16 19 3 7 557
Hazmat(%): 44 19 38 16
Hazmat/Corp/HighMiles(2103) .................... 8968 OOS viol. samples ..... 3.4 V/D ratio
Categories 1 2 3 4 5 6 7 #smpls
Driver (%): 2 4 2 92 2204
Vehicle(%): 53 1 2 16 18 2 7 6646
Hazmat(%): 7 47 47 118
2. Using For-hire/Private/Exempt classifications
For-hire/Low Miles(1001) ................................... 115 OOS violations ..... 2.3 V/D ratio
Categories 1 2 3 4 5 6 7 #smpls
Driver (%): 11 11 0 77 35
Vehicle(%): 49 0 0 16 23 3 10 80
Hazmat(%): 0 0 0 0
For-hire/Med. Miles(1002) ................................ 969 OOS violations ..... 4.2V/D ratio
Categories 1 2 3 4 5 6 7 #smpls
Driver (%): 6 11 2 81 187
Vehicle(%): 50 1 1 16 19 6 8 779
Hazmat(%): 33 67 0 3
For-hire/High Miles(1003) ........................... 17118 OOS violations ..... 3.12 V/D ratio
Categories 1 2 3 4 5 6 7 #smpls
Driver (%): 2 5 2 91 4130
Vehicle(%): 53 1 2 15 19 4 7 12890
Hazmat(%): 6 56 38 98
C-5
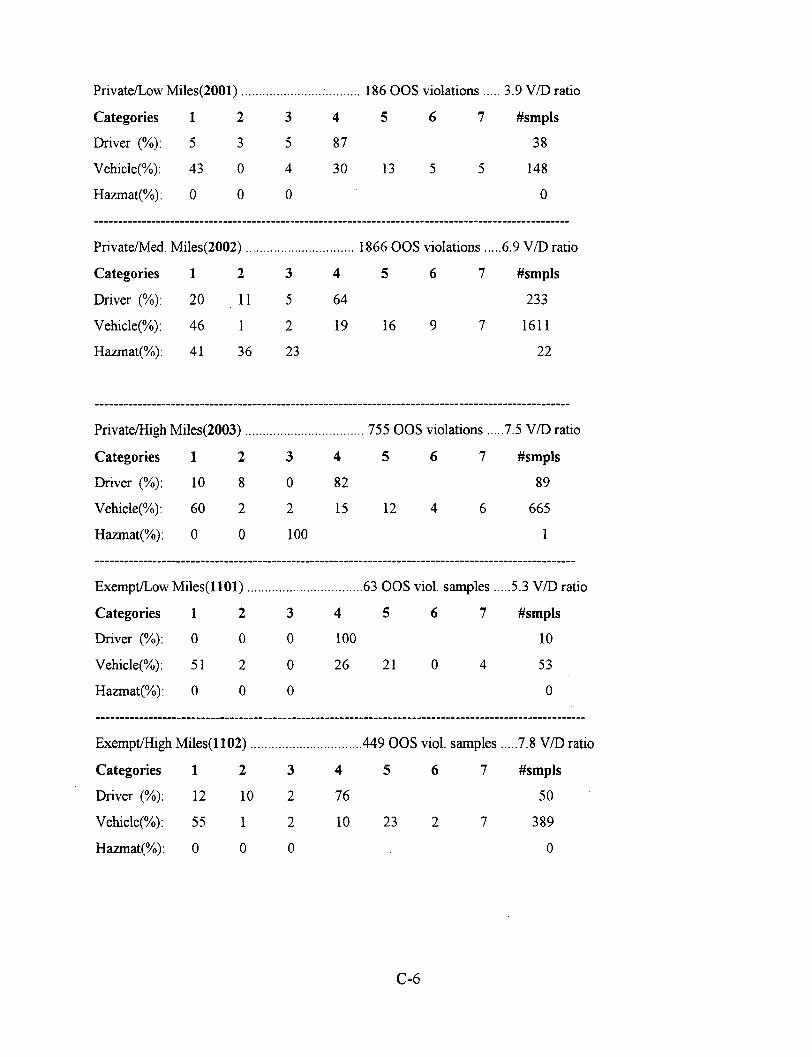
Private/Low Miles(2001) .................................. 186 OOS violations ..... 3.9 V/D ratio
Categories 1 2 3 4 5 6 7 #smpls
Driver (%): 5 3 5 87 38
Vehicle(%): 43 0 4 30 13 5 5 148
Hazmat(%): 0 0 0 0
Private/Med. Miles(2002) ............................... 1866 OOS violations ..... 6.9 V/D ratio
Categories 1 2 3 4 5 6 7 #smpls
Driver (%): 20 11 5 64 233
Vehicle(%): 46 1 2 19 16 9 7 1611
Hazmat(%): 41 36 23 22
Private/High Miles(2003) ................................ 755 OOS violations ..... 7.5 V/D ratio
Categories 1 2 3 4 5 6 7 #smpls
Driver (%): 10 8 0 82 89
Vehicle(%): 60 2 2 15 12 4 6 665
Hazmat(%): 0 0 100 1
Exempt/Low Miles(ll01) ............................... 63 OOS viol. samples ..... 5.3 V/D ratio
Categories 1 2 3 4 5 6 7 #smpls
Driver (%): 0 0 0 100 10
Vehicle(%): 51 2 0 26 21 0 4 53
Hazmat(%): 0 0 0 0
Exempt/High Miles(1102) ................................ 449 OOS viol. samples ..... 7.8 V/D ratio
Categories 1 2 3 4 5 6 7 #smpls
Driver (%): 12 10 2 76 50
Vehicle(%): 55 1 2 10 23 2 7 389
Hazmat(%): 0 0 0 0
C-6
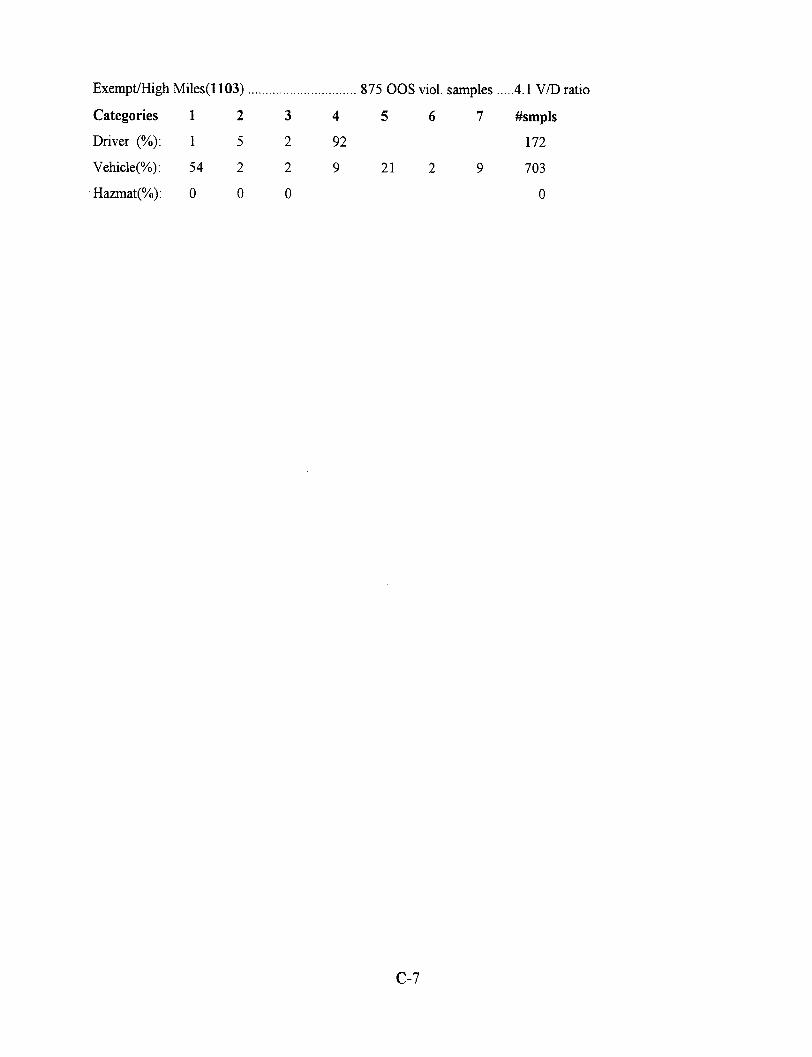
Exempt/High Miles(l103) ............................... 875 OOS viol. samples ..... 4.1 V/D ratio
Categories 1 2 3 4 5 6 7 #smpls
Driver (%): 1 5 2 92 172
Vehicle(%): 54 2 2 9 21 2 9 703
Hazmat(%): 0 0 0 0
C-7


Appendix D
Site-based Analysis of Roadside Inspection Data


Approach
We would like to know if the OOS rate at a fixed site for a given carrier is site-independent or
site-dependent. In other words, we seek an answer to the question: Does a carrier's OOS rate
vary much across different inspection sites? The answer 'yes' to this question would indicate a
lack of uniformity in the vehicle selection process at fixed inspection sites and/or individual
interpretation of the OOS criteria. A 'no' answer indicates uniform biases in the vehicle selection
process and uniform adherence to OOS criteria. The chosen statistical framework for a particular
'fixed' site, expressed in terms of probabilities, is as follows:
Prob [OOS viol.] = Prob [inspection] * Prob [vehicle in poor cond]
or A = B * C
We measure A from RI data at a selected site and is essentially the OOS rate. B and C are
unknown to us, however, we do have some information about these two quantities. From
common sense deductions, we can say that C is both site-independent and carrier-dependent.
Also, we have indications from preliminary analyses on RI data that B is carrier-dependent
(higher inspection rates for larger carriers), but we do not know whether B is site-dependent or
not. The OOS rates from the two most commonly encountered fixed sites have been produced
for five different carriers from RI data (Figure 3.2). The OOS rate for the same carrier is
compared at these two sites and, if similar, then B (above) can be considered site-independent.
Results
The statistics gathered from the five carriers in question are shown in Figure 3.2. The OOS rate
calculated from all movable sites is also included for comparison. Since the OOS rates do not
vary widely from site to site for a given carrier, we suggest that, in general, B (above) is site-
independent, and therefore we can assume that uniform biases exist in the vehicle selection
process from site to site and from state to state. Another way to say this is that the probability of
a particular carrier's vehicles being selected for inspection is constant from one inspection site to
the next. This determination appears plausible at least for carriers we've attempted to identify as
having predominantly large long-haul types of operations, since they are least likely to avoid the
D-1

major weigh stations accommodating fixed sites. Finally, these results were obtained by analyzing
well-inspected carriers and suggest that the most accurate estimate of a carrier's OOS rate is
obtained when its vehicles/drivers are inspected with regularity.
CARRIER #212726 (member of Hazmat/Corp/Long haul --2103)
site 676 (MNHRBRG)site 772 (MNSTCRX)all 'movable' sites
# of Samples5377
512
CARRIER #204273 (member of NonHazmat/Corp/Long haul --2003)
site 676 (MNHRBRG)site 772 (MNSTCRX)all 'movable' sites
# of Samples307357
CARRIER #139992 (member of NonHazmat/Corp/Short haul --2001)
site 653 (MNERSKN)site 755 (MNSGNAW)all 'movable' sites
# of Samples2062
128
CARRIER #467890 (member of NonHazmat/NonCorp/Medium haul --1002)
site 653 (MNERSKN)site 755 (MNSGNAW)all 'movable' sites
# of Samples466737
CARRIER #381882 (member of NonHazmat/Corp/Short haul --2001)
site 653 (MNERSKN)site 755 (MNSGNAW)all 'movable' sites
# of Samples43138
Figure D-1 Site-based Inspection Data (Haul_distance groups)
Below, in Table D-l, a comparison of the OOS rates at the Minnesota-administered 'St Croix'
scale and the Wisconsin-administered 'Hudson' scale shows that the OOS rates of the same
D-2
OOS rate0.450.520.22
OOS rate0.370.410.25
OOS rate0.150.260.28
OOS rate0.170.291.00
OOS rate0.000.070.00
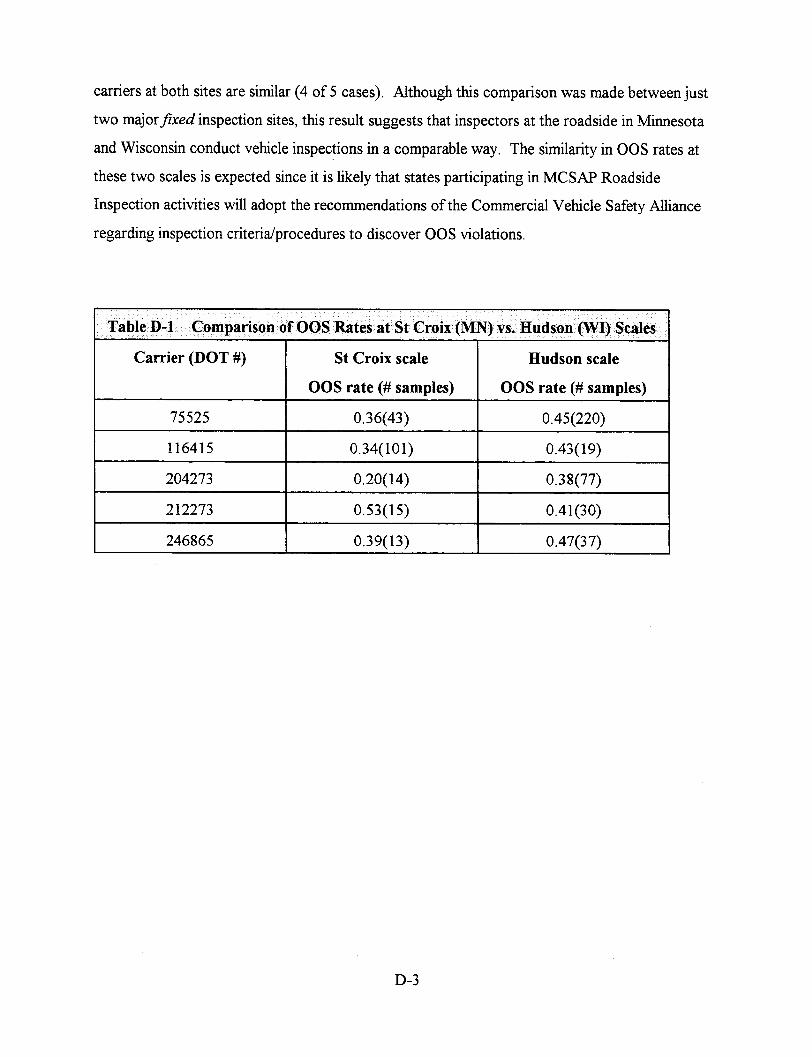
carriers at both sites are similar (4 of 5 cases). Although this comparison was made between just
two majorfixed inspection sites, this result suggests that inspectors at the roadside in Minnesota
and Wisconsin conduct vehicle inspections in a comparable way. The similarity in OOS rates at
these two scales is expected since it is likely that states participating in MCSAP Roadside
Inspection activities will adopt the recommendations of the Commercial Vehicle Safety Alliance
regarding inspection criteria/procedures to discover OOS violations.
D-3
Table D-1 Comparison of OS : Rates at St Croix (MN)vs Hudson (W Scales
Carrier (DOT #) St Croix scale Hudson scale
OOS rate (# samples) OOS rate (# samples)
75525 0.36(43) 0.45(220)
116415 0.34(101) 0.43(19)
204273 0.20(14) 0.38(77)
212273 0.53(15) 0.41(30)
246865 0.39(13) 0.47(37)


Appendix E
Factor Score Analysis of CR Data

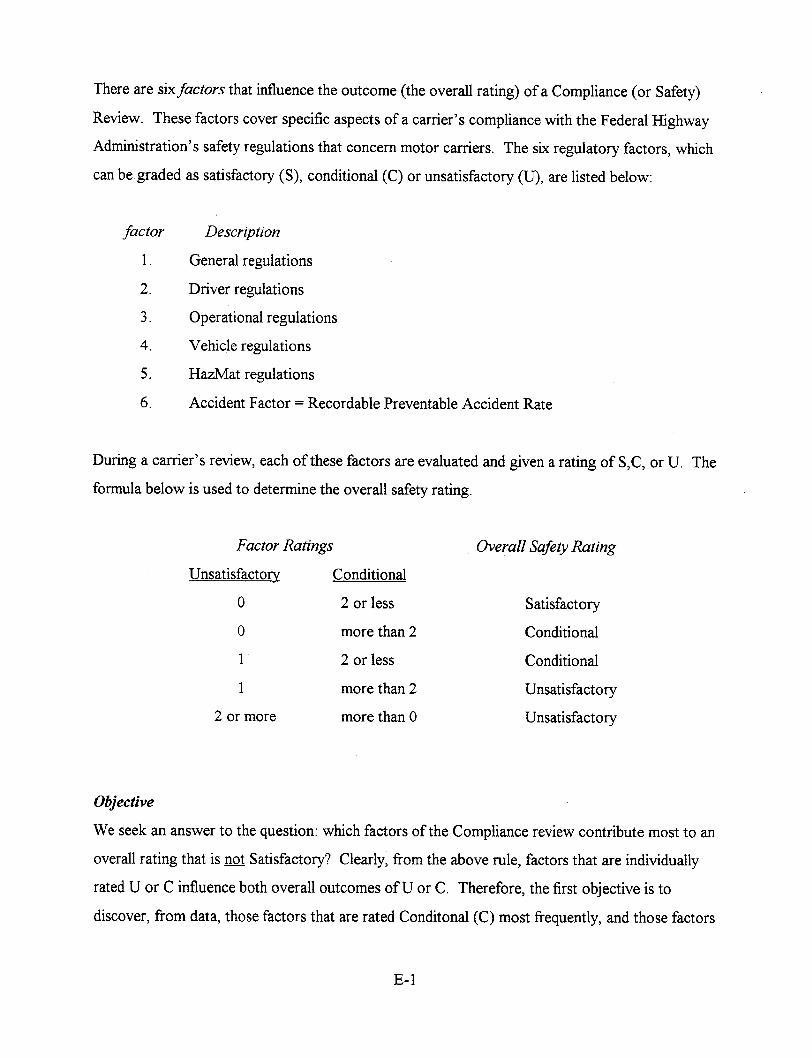
There are six factors that influence the outcome (the overall rating) of a Compliance (or Safety)
Review. These factors cover specific aspects of a carrier's compliance with the Federal Highway
Administration's safety regulations that concern motor carriers. The six regulatory factors, which
can be graded as satisfactory (S), conditional (C) or unsatisfactory (U), are listed below:
factor Description
1. General regulations
2. Driver regulations
3. Operational regulations
4. Vehicle regulations
5. HazMat regulations
6. Accident Factor = Recordable Preventable Accident Rate
During a carrier's review, each of these factors are evaluated and given a rating of S,C, or U. The
formula below is used to determine the overall safety rating.
Factor Ratings Overall Safety Rating
Unsatisfactory Conditional
0 2 or less Satisfactory
0 more than 2 Conditional
1 2 or less Conditional
1 more than 2 Unsatisfactory
2 or more more than 0 Unsatisfactory
Objective
We seek an answer to the question: which factors of the Compliance review contribute most to an
overall rating that is not Satisfactory? Clearly, from the above rule, factors that are individually
rated U or C influence both overall outcomes ofU or C. Therefore, the first objective is to
discover, from data, those factors that are rated Conditonal (C) most frequently, and those factors
E-1

that are rated Unsatisfactory (U) most frequently. A second objective is to determine how these
frequencies differ among carriers with different characteristics.
Approach
In the delivered form of the CR dataset, there were a total of 2473 carriers that received reviews
during the years 1992 - 1995. Of these carrier's, 1766 carriers received an overall satisfactory
rating, 550 received an overall conditional rating, and only 157 carrier's received an overall
unsatisfactory rating.
This analysis has utilized the grouping strategy that focuses on the Hazmat/Corp variables
together with 'AVM' characterization of carriers. Further, because of so much similarity in the
results, the 12 original groups were combined into these four supersets:
1. Non-Hazmat/Low-miles
2. Non-Hazmat/Med. -miles
3. Non-Hazmat/High-miles
4. All Hazmat
Results
Results of this analysis are found on the following pages in tabular form. Only CRs (or SRs) with
outcomes of unsatisfactory or conditional are considered in each of the four supersets above (722
carriers from 1992-1995). In a specific superset, each factor is ranked according to its frequency
of being rated unsatisfactory among those factors rated unsatisfactory, and according to its
frequency of being rated conditional among those factors rated conditional. The numerical weight
listed under each ranked factor is that factor's relative frequency of occurance among all factors
rated the same within that superset, i.e. these weights should not be considered as an overall
occurance rate in the dataset. Factors having weights below 0.06 were neglected.
E-2
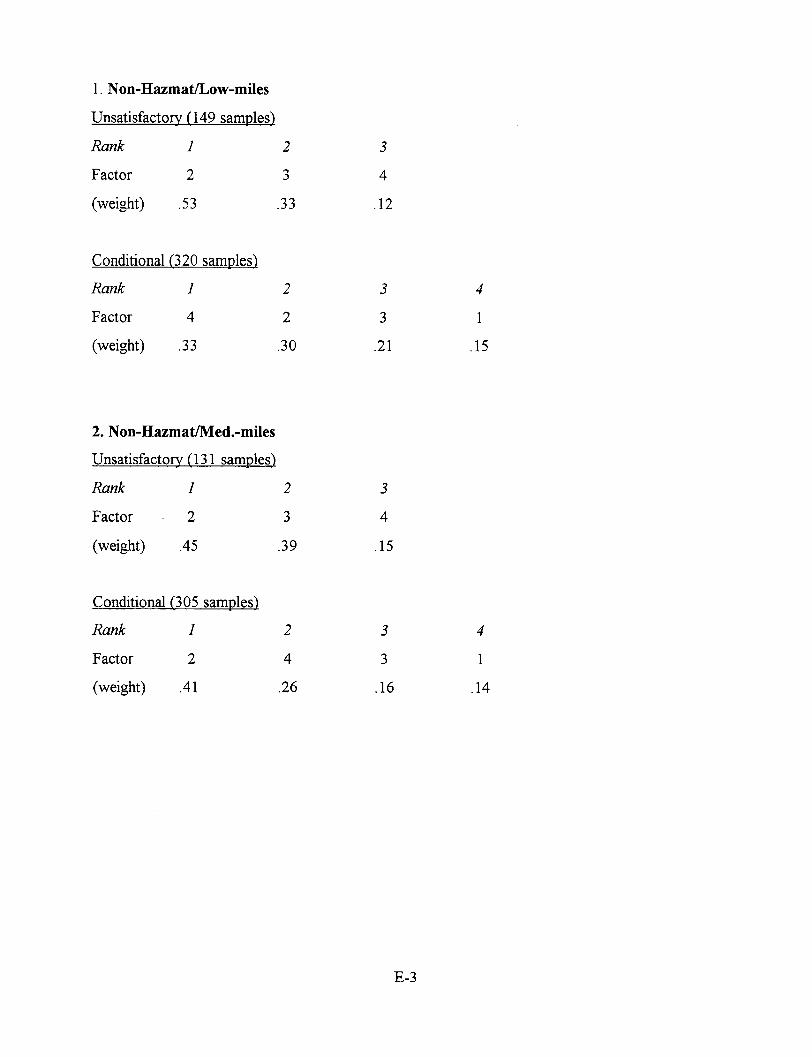
1. Non-Hazmat/Low-miles
Unsatisfactory (149 samples)
Rank 1 2
Factor 2 3
(weight) .53 .33
Conditional
Rank
Factor
(weight)
(320 samples)
1
4
.33
2. Non-Hazmat/Med.-miles
Unsatisfactory (131 samples)
Rank
Factor
(weight)
1
2
.45
Conditional (305 samples)
Rank
Factor
(weight)
1
2
.41
3
4
.12
2
2
.30
3
3
.21
4
1
.15
2
3
.39
3
4
.15
2
4
.26
3
3
.16
4
1
.14
E-3
I

3. Non-Hazmat/High-miles
Unsatisfactor (159 sam l s)
Rank 1
Factor 3
(weight) .54
Conditional (360 samples)
Rank 1
Factor 2
(weight) .44
4. All Hazmat carriers
Unsatisfactory (15 samples)
Rank 1
Factor 3
(weight) .53
Conditional (47 samples)
Rank
Factor
(weight)
1
6
.28
2
2
.32
3
4
.13
2
4
.25
3
3
.10
6
.10 .10
3
6
.06
2
2
.40
2
2
.25
3
4
.23
4
1
.15
E-4
I