Embed Size (px)
Citation preview
OPM vs. UML—Experimenting withComprehension and Construction of WebApplication Models
IRIS REINHARTZ-BERGER [email protected]
University of Haifa, Carmel Mountain, Haifa 31905, Israel
DOV DORI [email protected]
Technion, Israel Institute of Technology, Technion City, Haifa 32000, Israel
Editor: Stuart H. Zweben
Abstract. Object-Process Methodology (OPM), which is a holistic approach to modeling and evolving
systems, views objects and processes as two equally important entities that describe the system’s structure and
behavior in a single model. Unified Modeling Language (UML), which is the standard object-oriented
modeling language for software systems, separates the system model into various aspects, each of which is
represented in a different view (diagram type).
The exponential growth of the Web and the progress of Internet-based architectures have set the stage for the
proliferation of a variety of Web applications, which are classified as hybrids between hypermedia and
information systems. Such applications require a modeling approach that is capable of clearly specifying
aspects of their architecture, communication, and distributive nature. Since UML and OPM are two candidates
for this task, this study has been designed to establish the level of comprehension and the quality of the
constructed Web application models using each one of these two approaches.
In the experiment we carried out, third year undergraduate information systems engineering students were
asked to respond to comprehension and construction questions about two representative Web application
models. The comprehension questions related to the system’s structure, dynamics, and distribution aspects. The
results suggest that OPM is better than UML in modeling the dynamics aspect of the Web applications. In
specifying structure and distribution aspects, there were no significant differences. The results further suggest
that the quality of the OPM models students built in the construction part were superior to that of the
corresponding UML models.
Keywords: Object-Process Methodology, Unified Modeling Language, Web applications, software develop-
ment, IS development methodologies, object-oriented design, functional design.
1. Introduction
Modeling languages and methods for system specification, analysis, and design that have
been proposed over the years can be classified into three categories: structure- or object-
oriented, behavior- or process-oriented, and hybrids of the two. The object-oriented (OO)
approach focuses on the system’s objects, while its behavior is encapsulated as
operations within these objects. The large number of OO modeling languages that had
emerged and proliferated from the mid 1980’s to the mid 1990’s set the stage for the
adoption of the Unified Modeling Language (UML) (OMG, 2002) as the standard object-
oriented notation for modeling software systems. Process-oriented approaches, which
Empirical Software Engineering, 10, 57–79, 2005.# 2005 Springer Science + Business Media, Inc. Manufactured in The Netherlands.
predate the OO ones, emphasize the system’s behavior. Many of them, including
Structured System Analysis (SSA) (DeMarco, 1978) and Structured System Design
(SSD) (Yourdon and Constantine, 1979), are based on Data Flow Diagrams (DFD), while
others, such as Statecharts (Harel, 1987) and Petri nets (Peterson, 1981), are elaborations
of state machines.
Proponents of both the object- and the process-oriented approaches have reached the
conclusion that focusing on just one aspect of a system while neglecting the other is
counterproductive. To remedy this shortcoming, each approach adopted some technique
used by its counterpart. DFD-based techniques, for example, rely on Entity-Relationship
(ER) or class diagrams for modeling the static data scheme. UML incorporates several
process-oriented diagrams, including interaction diagrams, which describe the system
dynamics through message passing among objects, and state diagrams (or Statecharts),
each of which specifies the behavior of a single object over time in terms of the states it
traverses.
The need for adequate representation of both the static and dynamic aspects of a
system while keeping the model as simple as possible was a prime motivation for the
development of Object-Process Methodology (OPM) (Dori, 2002a). OPM is an
integrated modeling and system evolution approach that uses objects, processes, and
links to represent the system’s structure and behavior in a single model that uses the
same diagram type along with equivalent natural language specification. This way, OPM
attempts to solve two of the main deficiencies of the object-oriented approach in general
and UML in particular: the unbalanced structure-behavior representation and the model
multiplicity problem (Peleg and Dori, 2000; Dori, 2002b).
The prevalent use of the Internet and the World Wide Web as platforms for distributed
information systems has raised questions regarding the ability of OPM to satisfy
requirements introduced by the domain of Web application (Reinhartz-Berger et al.,
2002a).
In this paper we present our empirical findings about the comprehension of given
OPM and UML models and the quality of constructed OPM and UML models in the
domain of Web applications. The structure of the rest of the paper is as follows. Section 2
reviews related works that compare modeling languages and methods either theoretically
or empirically. Section 3 briefly presents the main principles of OPM and UML. Section
4 describes the experiment hypothesis, setting, and design, while Sections 5 and 6
respectively present and discuss the experiment results. Based on our empirical findings,
in Section 7 we summarize the benefits and shortcomings of OPM and suggest ways to
improve the methodology and OPCAT, its supporting CASE tool.
2. Related Studies
The emergence of the large number of software and system modeling approaches and
notations over the years has underlined the need to evaluate them either theoretically or
empirically. Theoretical approaches use metamodeling techniques or define objective
criteria for comparing modeling languages in terms of expressiveness, complexity, and
58 REINHARTZ-BERGER AND DORI

accuracy. In one theoretical study, Hillegersberg et al. (1998) applied metamodeling to
examine the fitness of the Booch method (Booch, 1991), an object-oriented analysis and
design method, to the object-oriented programming languages Smalltalk, Eiffel, and
C++. Halpin and Bloesch (1998) studied the relative strengths and weaknesses of Object
Role Model (ORM) and UML for data modeling according to criteria of expressiveness,
clarity, semantic stability, semantic relevance, validation mechanisms, abstraction
mechanisms, and formal foundation. Siau and Cao (2001) compared the complexity
metric values of UML with other object-oriented techniques. Their comparison related to
seventeen complexity metrics, including independent metrics (such as the number of
object types per technique) and aggregate metrics (e.g., the division of work in a specific
technique). They found that UML is at least twice as complex as other object-oriented,
single view notations.
Modeling languages can also be compared empirically. Empirical studies are based on
experiments, in which the results are examined quantitatively according to certain
criteria, and the subjects may be untrained people, students, or professional system
analysis and design experts. Kim and March (1995) compared Extended ER (EER) and
NIAM (Nijssen Information Analysis Method) (Verheijen and Van Bekkum, 1982) for
user comprehension, which was measured by counting the number of correct answers to
questions about the various modeling constructs. Shoval and Shiran (1997) compared
EER and object-oriented data models from a design quality viewpoint. They measured
quality in terms of correctness of the achieved model, time to complete the design task,
and designer’s model preferences. Otero and Dolado (2002) compared the semantic
comprehension of three different notations for representing behavior in UML: sequence
diagrams, collaboration diagrams, and state diagrams. The comparison was in terms of
the total time to complete the tasks and their scores. They found that the comprehension
of dynamic models in object-oriented designs depends on the complexity of the system.
Peleg and Dori (2000) compared OPM/T, an extension of OPM to real-time systems,
with a variation of Object Modeling Technique (OMT) (Rumbaugh et al., 1991) to the
same domain (T/OMT). They examined the specification quality and comprehension of
both system’s structural and behavioral aspects. The subjects were asked to fill in a
questionnaire consisting of statements on a system modeled in one of the techniques and
to specify another system using the second technique. The conclusion was that the single
view of OPM/T is more effective than the multiple-view of T/OMT in generating a better
system specification. Most of the errors in the T/OMT models resulted from (1) lack of
integration among the technique’s different views and (2) the need to maintain
consistency among the three view types (object diagrams, DFD, and Statecharts) and
to gather information that is scattered across these views. The comprehension part of the
experiment revealed a significant difference in favor of T/OPM in three issues: (1)
identifying triggering events of processes, (2) identifying processes that are triggered by
a given event, and (3) identifying objects that participate in a process. T/OMT, on the
other hand, was found to be better in two other issues: (1) identifying events that affect
objects by changing their state, and (2) determining the order of process execution.
Following that experiment, the research described in this paper compares the abilities of
OPM and UML, the successor of OMT, to model systems in the domain of Web
applications.
OPM VS. UML 59
3. OPM and UML Essentials
Before going into the details of the experiment and its outcomes, we briefly describe the
basic principles of the two modeling approaches that were compared in this study.
3.1. Object-Process Methodology (OPM)
Object-Process Methodology (OPM) (Dori, 1995; Peleg and Dori, 1999; Dori, 2002a) is
an integrated modeling approach to the modeling, study and lifecycle support of systems
in general and information systems in particular. Recognizing the existence of processes
as stand-alone entities, which is a major departure from the encapsulation principle of the
object-oriented approach, OPM enables modeling the system’s structure and behavior in
a single unified framework. OPM allows processes to complement objects as entities at
the same level. This way, structure and behavior, which are the two major aspects that all
systems exhibit, co-exist in the same OPM model without highlighting one at the cost of
suppressing the other. This unique structure-behavior integration in a single view makes
OPM most useful for modeling complex reactive systems, in which these two prime
aspects are highly intertwined and hard to separate.
The elements of the OPM ontology are entities (things and states) and links. A thing is
a generalization of a (stateful) object and a process—the two basic building blocks of any
OPM-based system model. Objects exist, while processes transform them. Transforma-
tion can be generation of new objects, consumption of existing objects, or changing
objects’ states. At any point in time, each object is at some state, and object states are
changed through occurrences of processes. Links can be structural or procedural. A
structural link expresses a static relation between two objects. Aggregation, generaliza-
tion, characterization, and instantiation are the four fundamental structural relations.
General tagged relations enable the definition of the semantics of any other structural
link. Procedural links describe the behavior of a system, i.e., how processes transform
(generate, consume, or update) objects, how objects enable processes (without being
transformed), and how internal or external events trigger processes. The resulting model
is expressed bimodally, both in graphics (through a set of Object-Process Diagrams,
abbreviated as OPDs) and in a subset of English (through a corresponding set of Object-
Process Language paragraphs).
OPM enables specifying system structure and dynamics to any desired level of detail
without losing legibility and comprehension of the resulting specification. This is done
through three refinement/abstraction mechanisms: unfolding/folding, which refines/
abstracts the structural parts of a thing (mainly an object), in-zooming/out-zooming,
which exposes/hides the inner details of a thing (mainly a process) within its enclosing
frame, and state expressing/suppressing, which exposes/hides the states of an object.
Introducing OPM to the Web application domain has required a few extensions
(Reinhartz-Berger et al., 2002a). These extensions, which do not add elements to OPM
ontology or symbols to its notation, provide for open reuse of component designs through
bindings among model modules (Reinhartz-Berger et al., 2002b) and support code
mobility and migration specifications (Reinhartz-Berger et al., 2003).
60 REINHARTZ-BERGER AND DORI

3.2. Unified Modeling Language (UML)
Unified Modeling Language (UML) (OMG, 2002) is an object-oriented language for
specifying, visualizing, constructing, and documenting the artifacts of software systems,
as well as for business modeling and other non-software systems. UML defines ten types
of diagrams, which are divided into three categories. Four diagram types represent
structure and include the class, object, component, and deployment diagrams. Five
diagram types, which represent different aspects of dynamic behavior, include use case,
sequence, activity, collaboration, and state diagrams (Statecharts). Finally, package
diagrams represent ways to organize and manage application modules. A system
modeled by UML consists of several different, but related, diagrams of various types.
UML also provides several extension mechanisms that allow modelers to define domain-
specific extensions without having to modify the modeling language. One such
mechanism is stereotype—a new kind of a model element that extends the semantics
of an existing kind of element. User-defined icons can be associated with stereotypes in
order to help distinguish them from other model elements.
Several UML extensions have been proposed for the domain of Web applications. One
of them, Conallen’s extension (Conallen, 1999), is based on a set of 18 domain-specific
stereotypes, which are commonly used with Web applications. These stereotypes include
such implementation-dependent concepts as RMI, IIOP, and Java Script, along with a set
of well-formedness rules for using them.
In this study we compared OPM to Conallen’s extension to UML because of its
adoption by the UML standard user community (UML 0.91 and up). In order to make the
comparison between OPM and UML as fair as possible, the UML models in our
experiment used only extensions that were adapted in the core UML, namely, the
stereotypes ‘‘entity object,’’ ‘‘control object,’’ ‘‘boundary object,’’ and ‘‘server page.’’
4. Experiment Goal, Hypotheses, and Design
Following the empirical approach to evaluating modeling languages and techniques, the
goal of the experiment was to compare OPM to UML with respect to two aspects: (1)
comprehension, namely the level of comprehending a given model expressed in each
language, and (2) construction, i.e., the quality and ease of modeling a given system in
each language.
4.1. Experiment Hypotheses
Our conjecture (hypothesis) regarding comprehension was that questions which can be
answered by inspecting a single UML view would be more correctly answered when
UML rather than OPM is used. More specifically, since UML is object-oriented and since
a UML system model is comprised of multiple views (diagram types), the UML class
diagram would better serve subjects who are looking for answers to questions related to
structural parts of a given system. Examples of questions of this type are ‘‘What is the
OPM VS. UML 61

database structure of the given application?’’ and ‘‘What are the structure and links of the
pages within the application?’’ Conversely, OPM will be more adequate than UML for
understanding the dynamic aspects of a system and the complex relations among various
(structural and dynamic) system modules. The reason for this is that answering such
questions requires searching multiple UML diagram types, while the OPM model uses the
only one diagram type it has, the OPD, albeit at various granularity levels.
With respect to construction, OPM was expected to be more correctly and more easily
applied than UML for modeling complex, dynamic applications. The reasons for this
conjecture were that OPM uses a single view with three scaling (abstraction-refinement)
mechanisms, and that the OPM alphabet consists of a compact set of graphic symbols, as
opposed to the large number of view-dependent UML symbols.
4.2. Population Background and Training
The subjects of the experiment were third year students in a four-year engineering B.Sc.
program at the Technion, Israel Institute of Technology, who took the course
‘‘Specification and Analysis of Information Systems’’ at the spring semester of the
2002 academic year. Most of them were students of the Information Systems
Engineering program, which is managed jointly by the Faculty of Industrial Engineering
and Management and the Faculty of Computer Science. They had no previous knowledge
or experience in system modeling and specification.
During the 13-week course, the syllabus of which is summarized in Table 1, the
students studied three representative modeling notations: DFD for two weeks, UML for
Table 1. The syllabus of the ‘‘specification and analysis of information systems’’ course.
Week no. Lecture (3 hours per week) Recitation (2 hours per week) Assignment
1 Introduction—system
development lifecycle
Relational databases
2 DFD Relational databases
3 DFD and OO approach DFD
4 UML Use Case and Class
Diagrams
DFD Modeling in DFD
5 UML structural model —
6 UML structural model UML Use Case and Class
Diagrams
7 UML Interaction Diagrams UML structural model
8 UML Statecharts UML Interaction Diagrams Modeling in UML
9 OPM UML Statecharts Modeling in Statecharts
10 OPM OPM
11 Modeling Web applications with
UML (Conallen’s extension)
OPM Modeling in OPM
12 Modeling Web applications
with OPM
Modeling Web applications
with UML and OPM
13 Discussion about analysis
approaches
Rehearsal tutorial
62 REINHARTZ-BERGER AND DORI

five weeks, and OPM for two weeks. They then also studied how to model Web
applications in UML and OPM for one additional week each. The students were required
to submit four modeling assignments in order to practice the use of DFD, UML (Use
Case, Class, and Sequence Diagrams), Statecharts, and OPM.
The course staff included one adjunct lecturer and two graduate student teaching
assistants, none of whom is an author of this paper. They were all familiar with UML and
OPM prior to teaching them, but had no particular preference for, or significantly
different knowledge of, any one specific language. The students studied in a single
lecture group and four recitation groups, two for each teaching assistant. Knowing that
the final exam in the course would serve as a basis for an experiment, the course staff
taught the course uniformly from a common detailed lesson plan. The lecturer also
informed the students about their participation in the experiment in the first course
session.
4.3. Experiment Design
The experiment took place during the final three-hour examination of the course. The
examination contained three tasks. The two main tasks, which related to distributed Web
applications and accounted for 80% of the examination’s grade, constituted the
experiment. The third task, which related to DFD, appeared last in the examination, so
its effect on the experiment results, if there was any, was uniform.
The two experimental tasks referred to two case studies: a project management system
and a book ordering application. The project management system, presented in Appendix
A, is a distributed, data-intensive system that handles projects, their tasks, and their
intermediate products. The book ordering application, presented in Appendix B, is a
Web-based system that enables searching for books and ordering them electronically.
Each appendix presents the models of the respective system in both UML and OPM.
Each model consists of five diagrams followed by eight comprehension questions and
one modeling problem, which called for extending the system model. The questions on
both models for the same case study, which are listed along with their expected answers
in Appendices A and B (Figures 3 and 6, respectively), were identical. The answers to
these questions were also identical and independent of the modeling language. The
comprehension questions relate to three major aspects of Web applications: structure,
dynamics, and distribution.
The two case studies were designed to be identical in their scope, or size. The size was
measured in terms of the number of diagrams, objects, features, and relations. The test
included two form types, A and B. Since our research question referred to the
comprehension and construction quality of OPM in comparison to UML irrespective of
the case study, each test form type contained the same case studies in the same order.
The only difference was the modeling language in which each case study was expressed.
The relatively small number of subjects (81) prevented us from dividing the students into
four groups (of about 20 students) in which not only the modeling languages order but
also the order of the case studies would be counterbalanced. The test tasks of each group
and their weights are summarized in Table 2.
OPM VS. UML 63
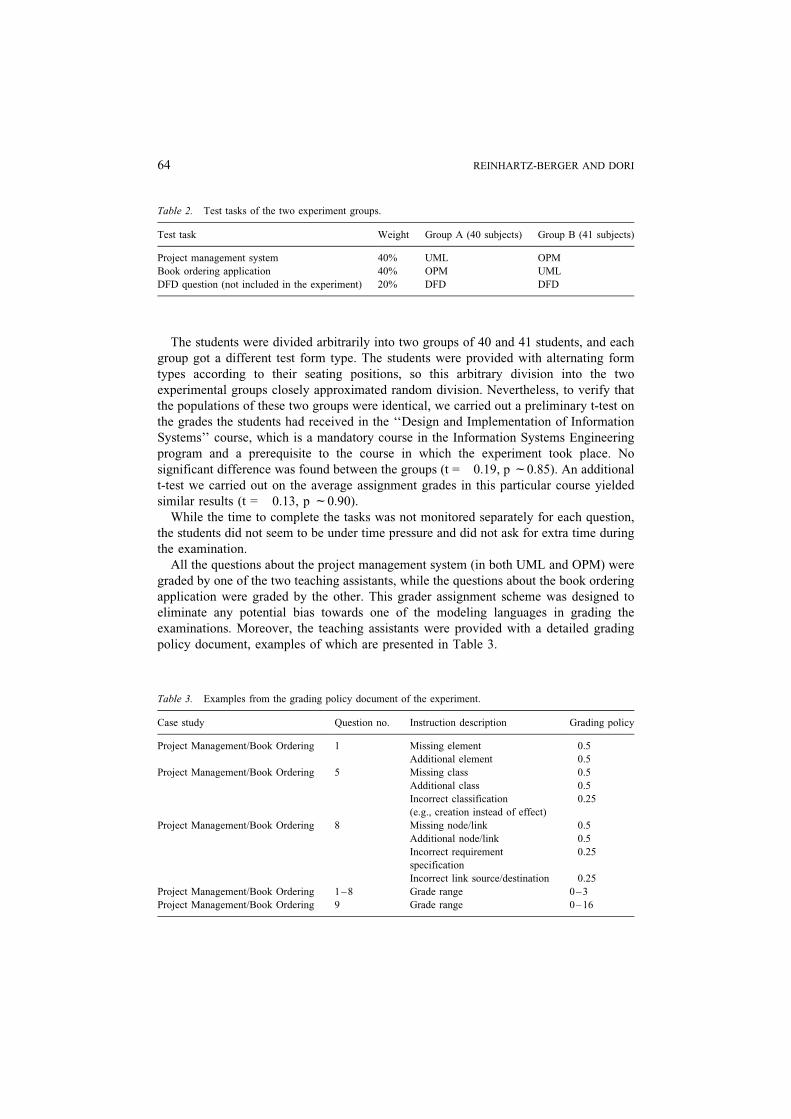
The students were divided arbitrarily into two groups of 40 and 41 students, and each
group got a different test form type. The students were provided with alternating form
types according to their seating positions, so this arbitrary division into the two
experimental groups closely approximated random division. Nevertheless, to verify that
the populations of these two groups were identical, we carried out a preliminary t-test on
the grades the students had received in the ‘‘Design and Implementation of Information
Systems’’ course, which is a mandatory course in the Information Systems Engineering
program and a prerequisite to the course in which the experiment took place. No
significant difference was found between the groups (t = �0.19, p f0.85). An additional
t-test we carried out on the average assignment grades in this particular course yielded
similar results (t = �0.13, p f0.90).
While the time to complete the tasks was not monitored separately for each question,
the students did not seem to be under time pressure and did not ask for extra time during
the examination.
All the questions about the project management system (in both UML and OPM) were
graded by one of the two teaching assistants, while the questions about the book ordering
application were graded by the other. This grader assignment scheme was designed to
eliminate any potential bias towards one of the modeling languages in grading the
examinations. Moreover, the teaching assistants were provided with a detailed grading
policy document, examples of which are presented in Table 3.
Table 2. Test tasks of the two experiment groups.
Test task Weight Group A (40 subjects) Group B (41 subjects)
Project management system 40% UML OPM
Book ordering application 40% OPM UML
DFD question (not included in the experiment) 20% DFD DFD
Table 3. Examples from the grading policy document of the experiment.
Case study Question no. Instruction description Grading policy
Project Management/Book Ordering 1 Missing element �0.5
Additional element �0.5
Project Management/Book Ordering 5 Missing class �0.5
Additional class �0.5
Incorrect classification
(e.g., creation instead of effect)
�0.25
Project Management/Book Ordering 8 Missing node/link �0.5
Additional node/link �0.5
Incorrect requirement
specification
�0.25
Incorrect link source/destination �0.25
Project Management/Book Ordering 1 –8 Grade range 0– 3
Project Management/Book Ordering 9 Grade range 0– 16
64 REINHARTZ-BERGER AND DORI
5. Results
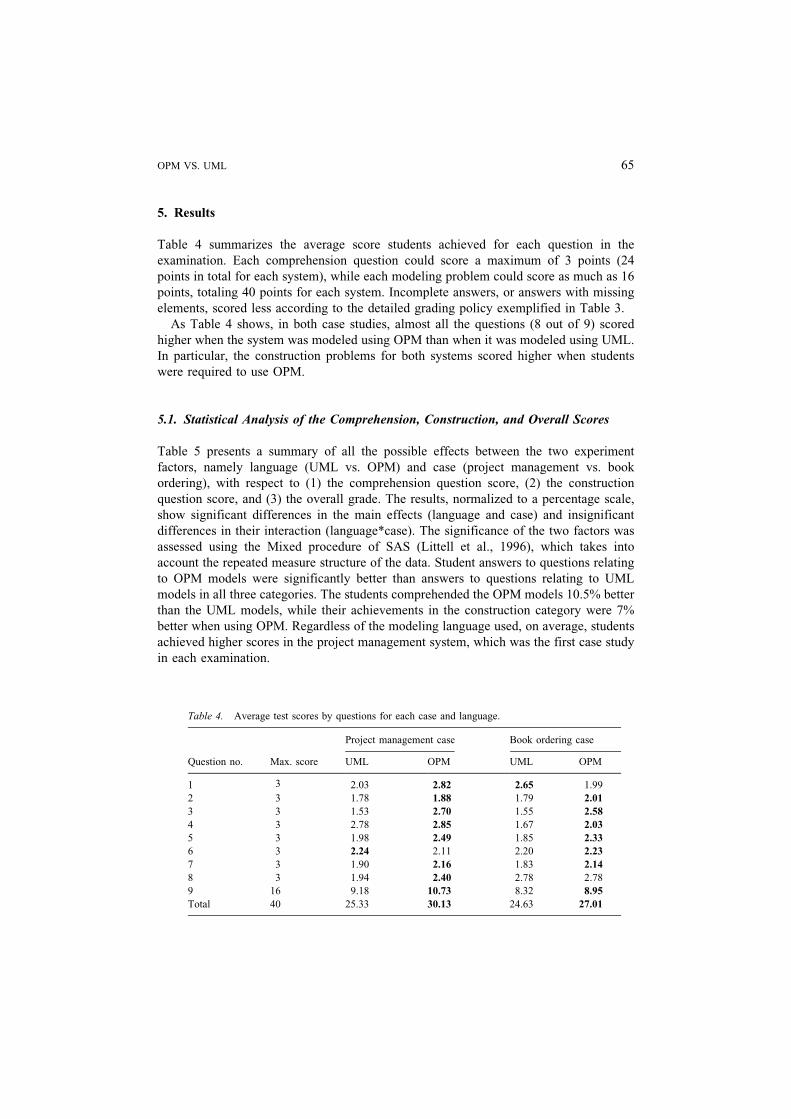
Table 4 summarizes the average score students achieved for each question in the
examination. Each comprehension question could score a maximum of 3 points (24
points in total for each system), while each modeling problem could score as much as 16
points, totaling 40 points for each system. Incomplete answers, or answers with missing
elements, scored less according to the detailed grading policy exemplified in Table 3.
As Table 4 shows, in both case studies, almost all the questions (8 out of 9) scored
higher when the system was modeled using OPM than when it was modeled using UML.
In particular, the construction problems for both systems scored higher when students
were required to use OPM.
5.1. Statistical Analysis of the Comprehension, Construction, and Overall Scores
Table 5 presents a summary of all the possible effects between the two experiment
factors, namely language (UML vs. OPM) and case (project management vs. book
ordering), with respect to (1) the comprehension question score, (2) the construction
question score, and (3) the overall grade. The results, normalized to a percentage scale,
show significant differences in the main effects (language and case) and insignificant
differences in their interaction (language*case). The significance of the two factors was
assessed using the Mixed procedure of SAS (Littell et al., 1996), which takes into
account the repeated measure structure of the data. Student answers to questions relating
to OPM models were significantly better than answers to questions relating to UML
models in all three categories. The students comprehended the OPM models 10.5% better
than the UML models, while their achievements in the construction category were 7%
better when using OPM. Regardless of the modeling language used, on average, students
achieved higher scores in the project management system, which was the first case study
in each examination.
Table 4. Average test scores by questions for each case and language.
Project management case Book ordering case
Question no. Max. score UML OPM UML OPM
1 3 2.03 2.82 2.65 1.99
2 3 1.78 1.88 1.79 2.01
3 3 1.53 2.70 1.55 2.58
4 3 2.78 2.85 1.67 2.03
5 3 1.98 2.49 1.85 2.33
6 3 2.24 2.11 2.20 2.23
7 3 1.90 2.16 1.83 2.14
8 3 1.94 2.40 2.78 2.78
9 16 9.18 10.73 8.32 8.95
Total 40 25.33 30.13 24.63 27.01
OPM VS. UML 65

5.2. Statistical Analysis of the Comprehension Questions Subdivision
To gain more insight into the comprehension questions, we divided them into three
categories:
1. Structure: questions 1–2 in both case studies, which related to the structure of the
system;
2. Dynamics: questions 3–5 in both case studies and question 8 in the book ordering
system, which related to the system behavior; and
3. Distribution: questions 6–7 in both case studies and question 8 in the project
management system, which related to aspects of the system’s distributed nature.
Table 6 presents the analysis of the students’ achievements in the comprehension
category according to three factors: language, case, and comprehension (structure,
dynamics, and distribution). The results, normalized to a percentage scale, show
significant differences in the language (p < 0.0001) and comprehension (p < 0.001)
factors. The fact that the 3-way interaction between these factors was significant required
further elaboration in which each case study was analyzed for the interaction between the
modeling language and the comprehension category.
Table 7 shows the average scores of the comprehension categories in each one of the
case studies. The average scores of the dynamics comprehension category questions on
models done with OPM were significantly higher than the respective questions on
models done with UML in both case studies (about 20% higher in the project
management system and more than 15% higher in the book ordering application).
Table 5. Results of the overall, comprehension, and construction grades—the mixed ANOVA model.
Examined modeling
aspect
Factor name Values of factor Mean
grade (%)
F p-level
Model comprehension Language UML 67.6 75.8 <0.0001
score OPM 78.1
Case Project management 74.2 4.18 <0.05
Book ordering 71.6
Language*Case 1.66 n.s.
Model construction Language UML 54.5 7.41 <0.01
score OPM 61.6
Case Project management 62.3 10.8 <0.002
Book ordering 54.0
Language*Case 0.46 n.s.
Overall score Language UML 62.4 54.2 <0.0001
OPM 71.5
Case Project management 69.4 15.2 <0.0005
Book ordering 64.5
Language*Case 1.17 n.s.
66 REINHARTZ-BERGER AND DORI
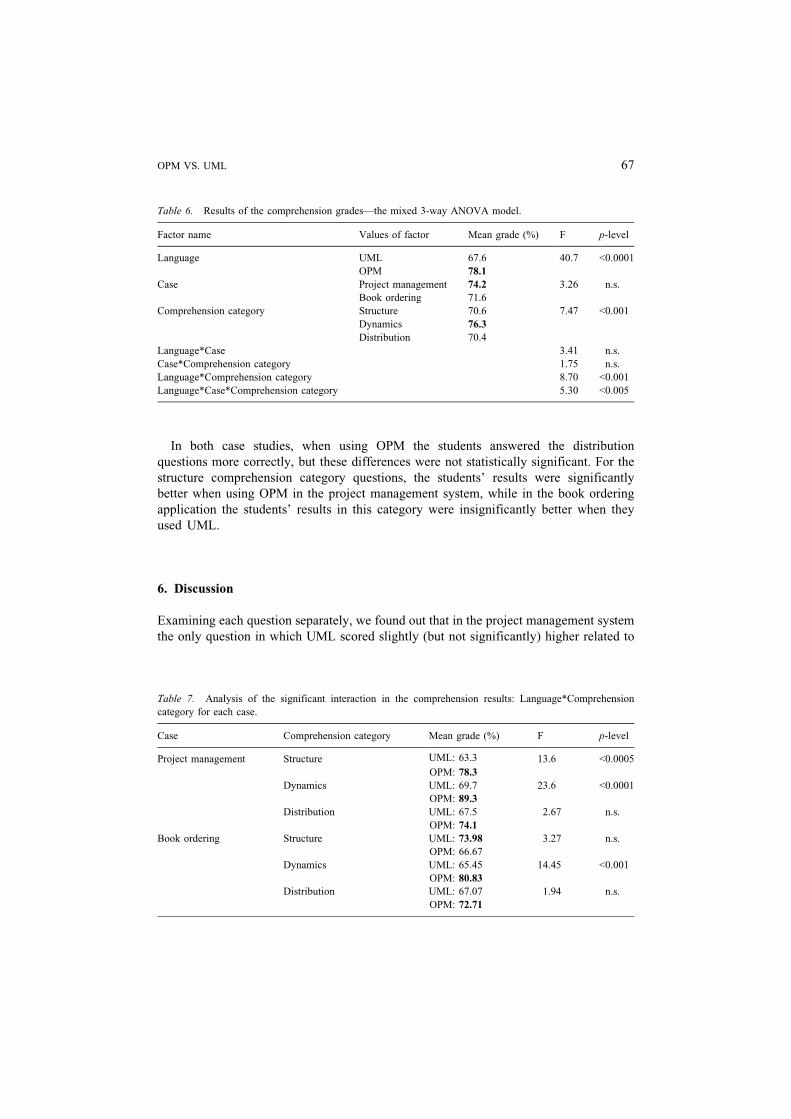
In both case studies, when using OPM the students answered the distribution
questions more correctly, but these differences were not statistically significant. For the
structure comprehension category questions, the students’ results were significantly
better when using OPM in the project management system, while in the book ordering
application the students’ results in this category were insignificantly better when they
used UML.
6. Discussion
Examining each question separately, we found out that in the project management system
the only question in which UML scored slightly (but not significantly) higher related to
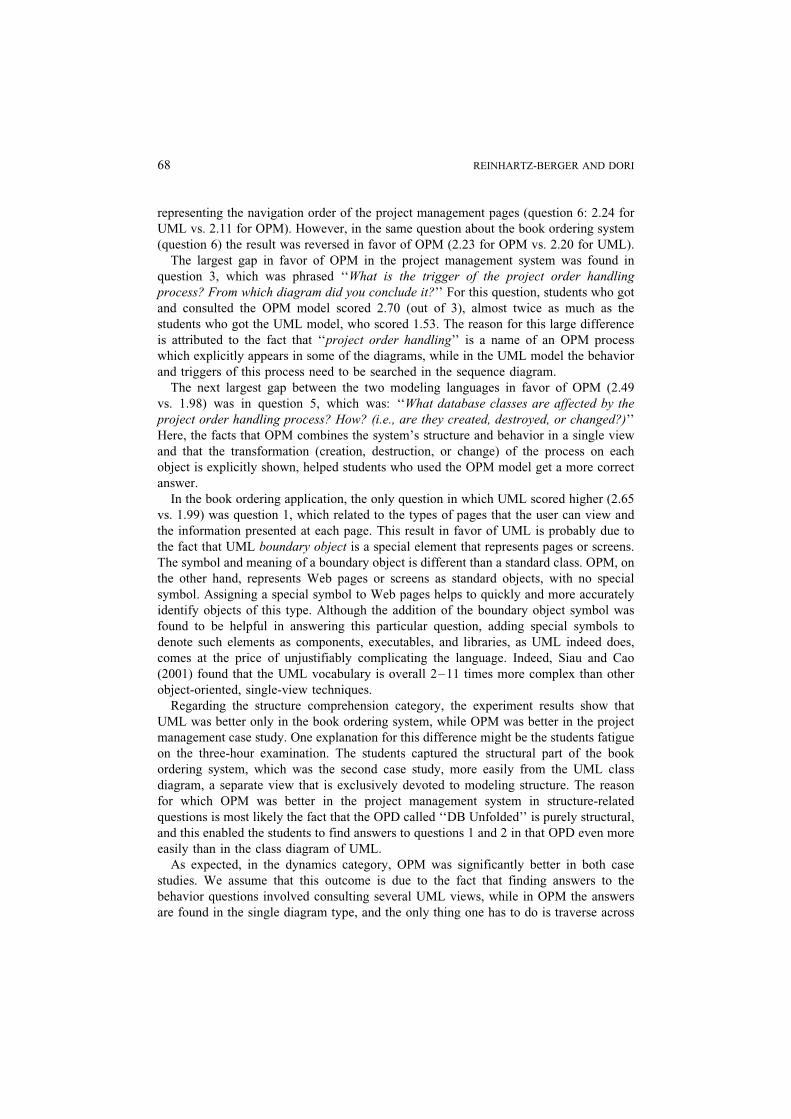
Table 7. Analysis of the significant interaction in the comprehension results: Language*Comprehension
category for each case.
Case Comprehension category Mean grade (%) F p-level
Project management Structure UML: 63.3 13.6 <0.0005
OPM: 78.3
Dynamics UML: 69.7 23.6 <0.0001
OPM: 89.3
Distribution UML: 67.5 2.67 n.s.
OPM: 74.1
Book ordering Structure UML: 73.98 3.27 n.s.
OPM: 66.67
Dynamics UML: 65.45 14.45 <0.001
OPM: 80.83
Distribution UML: 67.07 1.94 n.s.
OPM: 72.71
Table 6. Results of the comprehension grades—the mixed 3-way ANOVA model.
Factor name Values of factor Mean grade (%) F p-level
Language UML 67.6 40.7 <0.0001
OPM 78.1
Case Project management 74.2 3.26 n.s.
Book ordering 71.6
Comprehension category Structure 70.6 7.47 <0.001
Dynamics 76.3
Distribution 70.4
Language*Case 3.41 n.s.
Case*Comprehension category 1.75 n.s.
Language*Comprehension category 8.70 <0.001
Language*Case*Comprehension category 5.30 <0.005
OPM VS. UML 67
representing the navigation order of the project management pages (question 6: 2.24 for
UML vs. 2.11 for OPM). However, in the same question about the book ordering system
(question 6) the result was reversed in favor of OPM (2.23 for OPM vs. 2.20 for UML).
The largest gap in favor of OPM in the project management system was found in
question 3, which was phrased ‘‘What is the trigger of the project order handling
process? From which diagram did you conclude it?’’ For this question, students who got
and consulted the OPM model scored 2.70 (out of 3), almost twice as much as the
students who got the UML model, who scored 1.53. The reason for this large difference
is attributed to the fact that ‘‘project order handling’’ is a name of an OPM process
which explicitly appears in some of the diagrams, while in the UML model the behavior
and triggers of this process need to be searched in the sequence diagram.
The next largest gap between the two modeling languages in favor of OPM (2.49
vs. 1.98) was in question 5, which was: ‘‘What database classes are affected by the
project order handling process? How? (i.e., are they created, destroyed, or changed?)’’
Here, the facts that OPM combines the system’s structure and behavior in a single view
and that the transformation (creation, destruction, or change) of the process on each
object is explicitly shown, helped students who used the OPM model get a more correct
answer.
In the book ordering application, the only question in which UML scored higher (2.65
vs. 1.99) was question 1, which related to the types of pages that the user can view and
the information presented at each page. This result in favor of UML is probably due to
the fact that UML boundary object is a special element that represents pages or screens.
The symbol and meaning of a boundary object is different than a standard class. OPM, on
the other hand, represents Web pages or screens as standard objects, with no special
symbol. Assigning a special symbol to Web pages helps to quickly and more accurately
identify objects of this type. Although the addition of the boundary object symbol was
found to be helpful in answering this particular question, adding special symbols to
denote such elements as components, executables, and libraries, as UML indeed does,
comes at the price of unjustifiably complicating the language. Indeed, Siau and Cao
(2001) found that the UML vocabulary is overall 2–11 times more complex than other
object-oriented, single-view techniques.
Regarding the structure comprehension category, the experiment results show that
UML was better only in the book ordering system, while OPM was better in the project
management case study. One explanation for this difference might be the students fatigue
on the three-hour examination. The students captured the structural part of the book
ordering system, which was the second case study, more easily from the UML class
diagram, a separate view that is exclusively devoted to modeling structure. The reason
for which OPM was better in the project management system in structure-related
questions is most likely the fact that the OPD called ‘‘DB Unfolded’’ is purely structural,
and this enabled the students to find answers to questions 1 and 2 in that OPD even more
easily than in the class diagram of UML.
As expected, in the dynamics category, OPM was significantly better in both case
studies. We assume that this outcome is due to the fact that finding answers to the
behavior questions involved consulting several UML views, while in OPM the answers
are found in the single diagram type, and the only thing one has to do is traverse across
68 REINHARTZ-BERGER AND DORI

Object-Process Diagrams at different granularity levels. This type of navigation is easier
than moving from one type of diagram to another, with each diagram type using its own
set of symbols and distinct semantics. UML diagram traversal involves constantly
switching the symbol vocabulary associated with each diagram type. This unnecessary
complexity puts extra mental burden on the shoulders of system architects, designers, and
the intended audience.
As for the distribution aspect, in both case studies OPM was found to be
insignificantly better than UML. This difference can be explained by the fact that the
questions in this category involved structural and behavioral aspects of the system
distribution that span across different UML views. In other words, to fully answer these
questions with the UML model, the students had to integrate information gathered from
various diagram types, while in OPM the same information could be achieved by moving
from a less detailed diagram to a more detailed (in-zoomed or unfolded) one. Indeed, we
have argued that moving across detail levels of the same diagram type, when all the
symbols are the same and the only change is the level of detail, is cognitively easier than
switching among various diagram types, where each type employs a whole different set
of graphic symbols and syntax. The findings in the distribution category reinforce this
argument.
The construction results of the experiment were significantly better in OPM than in
UML (p < 0.01). The main errors in the UML modeling questions occurred when
students were required to integrate the different views into a whole, consistent model.
The modeling questions required adding a single functionality that affected two UML
diagram types—the class diagram and the site map diagram—and called for adding a
third diagram of yet another type—an interaction diagram. All these changes were
expected to leave the UML model integral and consistent. This task is difficult for trained
UML modelers, let alone untrained students. The UML multiplicity of models (views)
inevitably often requires numerous corrections in other diagram types so as to maintain
overall consistency. Each change potentially triggers changes in the rest of the diagrams,
causing a ripple effect that can be intractable. This shortcoming of the object-oriented
paradigm in general and UML in particular has been pointed out by the aspect-oriented
approach (AOSD, 2003). Mezini and Lieberherr (1998) claim that object-oriented
programs are more difficult to maintain and reuse because their functionality is spread
over several methods, making it difficult to get the ‘‘big picture’’. In OPM, all the
changes are done in one diagram type, OPD, the single diagram type of OPM, which
combines the structure and behavior that together specify the additional system
functionality. The only other update that needs to take place is that of OPDs up the
abstraction tree such that consistency is maintained. This is done by inspecting the OPM
system map, which is the OPD tree, as described explicitly in the OPM metamodel
(Reinhartz-Berger, 2003).
Although the results of our experiment suggest that OPM is significantly better
than UML in understanding system dynamics and in modeling Web applications,
there are three validity threatening factors that might have influenced the experiment
results. First, UML was taught before OPM during the course. Hence, by the time of
the final examination students might have forgotten more about how to effectively
work with UML than with OPM. On the other hand, UML and its Web application
OPM VS. UML 69

extension were taught for six weeks, twice as much as OPM and its Web application
extension (see Table 1). Moreover, since UML was the first modeling language taught,
the teaching order could help the students understand and assimilate UML better than
OPM.
Second, the project management case always appeared first on the examination,
implying that most of the students probably started working on this problem first.
Therefore, there are possible fatigue and order factors that are confounded with the
comparison results of the two cases and interactions that involve the case factor.
Finally, only one scorer assessed each exam question, which might further confound the
results. However, all scorers used a well-defined scoring scheme, which mitigates this
effect.
7. Summary and Future Work
Comparing OPM to UML in terms of Web applications comprehension and modeling
quality, we concluded that the single OPM diagram type, the Object-Process Diagram
(OPD), which supports the various structural and dynamic aspects throughout the system
lifecycle, is easier to understand and apply by untrained users. The ability to model
stand-alone processes in OPM provides for a single mechanism for specifying system
behavior. Such behavior modeling is not in line with the object-oriented encapsulation
principle, as it involves more than one object and therefore cannot be faithfully modeled
as being owned by a single specific object class. These findings are in agreement with the
results described by Peleg and Dori (2000), and are also consistent with findings of
another empirical study of ours (Gilat, 2003), which compared OPM adapted to the
domain of discrete event simulation to ARENA, a prevalent discrete event simulation
software package.
Although we compared OPM to a specific extension of UML for Web applications
(Conallen, 1999), we believe that our findings can be generalized. UML’s segregation of
the system model into multiple views is a major source of difficulty in capturing the
system as a whole, understanding its parts, and being able to coherently follow the
functionality it performs. This is due to the fact that pieces of a UML system model are
scattered across different diagram types, each with its idiosyncratic set of graphic
alphabet symbols and syntax. For example, a process can appear as a use-case in a use-
case diagram, as an operation in a class diagram, as an action in a state transition
diagram, as a message in a sequence diagram, and as an activity in an activity diagram.
To be able to model complex systems, the modeling language itself should be as simple
as possible, because using a complex language to model a complex system almost
guarantees that the resulting model will be intractable. UML is unnecessarily complex in
many ways, and this inherent deficiency hinders coherent modeling and comprehension
of systems. The outcomes of this empirical study reinforce this assertion.
While model multiplicity of UML is in general a deficiency, there are cases in which
the existence of separate views and special symbols can potentially help answering
certain questions about a specific aspect of a system, which is expressed in only one type
70 REINHARTZ-BERGER AND DORI

of diagram, such as its desired database schema or execution of its services. These types
of questions may be more difficult to answer in an OPM model, if the information resides
at separate diagrams with different granularity levels. To overcome this, we have
enhanced OPCAT, Object-Process CASE tool (Dori et al., 2003), with animation
capability. Using this feature while modeling a system, the designer can run an animated
simulation showing the active entities and links at consecutive time points as a visual
design debugging aid. This capability enables the system architect to verify that the
system behaves and executes as it is supposed to at any point in time. To stay current
with the prevailing standard, we have augmented OPCAT with the capability of
generating a set of UML views from the single OPM model, and we plan to also be able
to convert a UML model to OPM. These capabilities will enable the system architect to
use the most suitable approach for each design portion.
Another experiment which was conducted on 20 graduate and advanced
undergraduate students who studied UML and OPM for a year showed similar
results. In that experiment, the students had rehearsal tutorials about the core UML
and OPM. None of them had studied the extensions of the two modeling languages to
the Web application domain. The experiment included two models and nine
comprehension questions only. The two models were a Web Sales system, which
handles sales through the internet, in UML and a GLAP system, which handles a
glossary of terms in a distributed architecture, in OPM. The comprehension questions
which refer to system dynamics and distribution were better answered using OPM
models. The students noted that the single view and the technology-independent
model in OPM helped them understand the system’s purpose, functionality, and
architecture. Future work should validate our findings with analysis and design
experts who are familiar with these languages. This work should use a talk-aloud
procedure to validate our interpretation to the causes of the different results between
the modeling languages.
Further experiments should also be carried out to compare OPM to other leading
modeling languages and methods. More specifically, in our experiment, we
compared two diagramming, visual formalisms, Object-Process Diagrams (OPD)
and UML. An OPM model is expressed not only graphically but also by a textual
modality, Object-Process Language (OPL), which is a subset of English and hence
comprehensible to non-IT professionals. The experiment done in this research
completely ignored this modality. The contribution of the natural language as a
complementary modality to understanding an OPM model should be carefully
examined, especially for users who are not familiar with a visual modeling
language.
Acknowledgments
The authors would like to thank Professor Ayala Cohen for her professional, valuable
advice and insight in designing the statistical analysis and interpreting the results. We
also thank the Technion Statistics Laboratory staff in carrying out the analysis.
OPM VS. UML 71
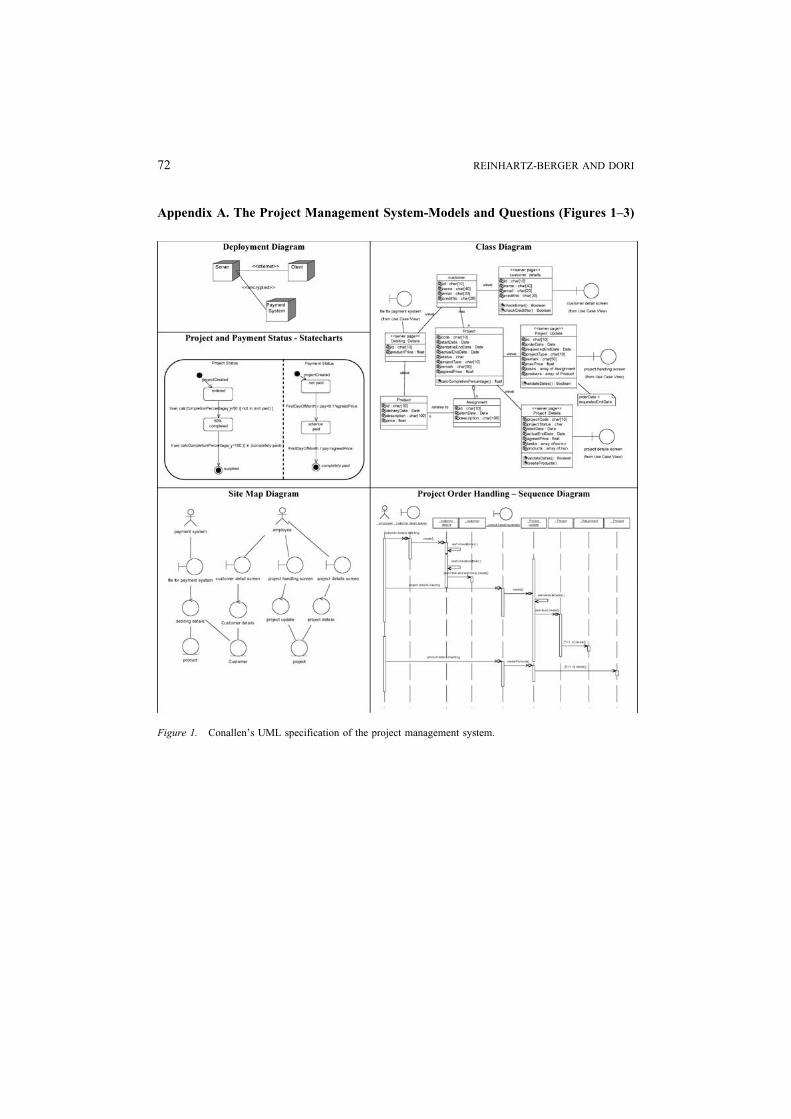
Appendix A. The Project Management System-Models and Questions (Figures 1–3)
Figure 1. Conallen’s UML specification of the project management system.
72 REINHARTZ-BERGER AND DORI

Figure 2. OPM specification of the project management system.
OPM VS. UML 73

Figure 3. Questions related to the project management system and their expected answers.
74 REINHARTZ-BERGER AND DORI

Appendix B. The Book Ordering System—Models and Questions (Figures 4–6)
Figure 4. Conallen’s UML specification of the book ordering system.
OPM VS. UML 75

Figure 5. OPM specification of the book ordering system.
76 REINHARTZ-BERGER AND DORI

Figure 6. Questions related to the book ordering system and their expected answers.
OPM VS. UML 77

References
AOSD. 2003. The Aspect-Oriented Software Development site, http://aosd.net/.
Booch, G. 1991. Object-Oriented Design with Applications. Redwood: Benjamin Cummings.
Conallen, J. 1999. Building Web Applications with UML. Reading: Addison-Wesley.
DeMarco, T. 1978. Structured Analysis and System Specification. New York: Yourdon.
Dori, D. 1995. Object-process analysis: Maintaining the balance between system structure and behavior. J. Log.
Comput. 5(2): 227– 249.
Dori, D. 2002a. Object-Process Methodology—A Holistic Systems Paradigm. Heidelberg: Springer Verlag.
Dori, D. 2002b. Why significant UML change is unlikely. Commun. ACM 45(11): 82– 85.
Dori, D., Reinhartz-Berger, I., and Sturm, A. 2003. OPCAT—A bimodal CASE tool for object-process based
system development. Proc. IEEE/ACM 5th Int. Conf. Enterpr. Inf. Syst. (ICEIS 2003). France, 286– 291.
Download site: http://www.ObjectProcess.org/.
Gilat, D. 2003. A framework for simulation of discrete events systems based on the object-process
methodology. Ph.D. Thesis, Technion-Israel Institute of Technology.
Halpin, T., and Bloesch, A. 1998. A comparison of UML and ORM for data modeling. Proc. 3rd Int. Workshop
Eval. Model. Methods Syst. Anal. and Des. (EMMSAD’98). Italy.
Harel, D. 1987. Statecharts: A visual formalism for complex systems. Sci. Comput. Program. 8: 231– 274.
Hillegersberg, J. V., Kumar, K., and Welke, R. J. 1998. Using metamodeling to analyze the fit of object-
oriented methods to languages. Proc. 31st Hawaii Int. Conf. Syst. Sci. (HICSS’98). Hawaii.
Kim, Y. G., and March, S. T. 1995. Comparing data modeling formalisms for representing and validating
information requirements. Commun. ACM 38(6): 103 –115.
Littell, R. C., Milliken, G. A., Stroup, W. W., and Wolfinger, R. D. 1996. SAS Systems for Mixed Models. SAS
Institute Inc.
Mezini, M., and Lieberherr, K. (1998). Adaptive plug-and-play components for evolutionary software
development. Conf. Object-Oriented Program. Syst. Lang. Appl. (OOPSLA’98). Canada, 97– 116.
OMG. 2002. The Object Management Group site. Unified Modeling Language Specification – Version 1.4.
ftp://ftp.omg.org/pub/docs/formal/01-09-67.pdf.
Otero, M. C., and Dolado, J. J. 2002. An initial experimental assessment of the dynamic modeling in UML.
Empir. Softw. Eng. 7: 27– 47.
Peleg, M., and Dori, D. 1999. Extending the object-process methodology to handle real-time systems. J.
Object-Oriented Program. 11(8): 53– 58.
Peleg, M., and Dori, D. 2000. The model multiplicity problem: Experimenting with real-time specification
methods. IEEE Trans. Softw. Eng. 26(8): 742 – 759.
Peterson, J. L. 1981. Petri Nets Theory and the Modeling of Systems. Englewood Cliffs: Prentice Hall.
Reinhartz-Berger, I. 2003. Developing web applications with object-oriented approaches and object-process
methodology. Ph.D. Thesis, Technion-Israel Institute of Technology. http://mis.hevra.haifa.ac.il/firis/
research/OPMwebThesis.pdf.
Reinhartz-Berger, I., Dori, D., and Katz, S. 2002a. OPM/Web – object-process methodology for developing web
applications. Ann. Softw. Eng.-Spec. Issue Object-Oriented Web-Based Softw. Eng. 13: 141 – 161.
Reinhartz-Berger, I., Dori, D., and Katz, S. 2002b. Open reuse of component designs in OPM/Web. Proc.
Comput. Softw. Appl. Conf. (COMPSAC’2002). England, 19– 26.
Reinhartz-Berger, I., Dori, D., and Katz, S. 2003. Modeling code mobility and migration: An OPM/Web
approach. Accepted to Int. J. Web Eng. Technol. (IJWET).
Rumbaugh, J., Blaha, M., Premerlani, W., Eddy, F., and Lorenson, W. 1991. Object-Oriented Modeling and
Design. Englewood Cliffs: Prentice-Hall.
Shoval, P., and Shiran, S. 1997. Entity-relationship and object-oriented data modeling—An experimental
comparison of design quality. Data Knowl. Eng. 21: 297– 315.
Siau, K., and Cao, Q. 2001. Unified Modeling Language (UML)—A complexity analysis. J. Database Manage.
12(1): 26 –34.
Verheijen, G. M. A., and Van Bekkum, J. 1982. NIAM: An information analysis method. In T. W. Olle, et al.
(eds.), Information Systems Design Methodologies: A Comparative Review. North-Holland, 289 – 318.
Yourdon, Y., and Constantine, L. L. 1979. Structured Design. Englewood Cliffs: Prentice Hall.
78 REINHARTZ-BERGER AND DORI
Iris Reinhartz-Berger received the Ph.D. degree in 2003 from the Faculty of Industrial Engineering and
Management, Information Systems, Technion, Israel Institute of Technology. Both her M.Sc. and Ph.D. were
on improving OPM. During her M.Sc., she formalized conversion rules from Object-Process Language, a
subset of English, to Java. Her Ph.D. dissertation dealt with developing Web applications with object-oriented
Approaches and OPM. Currently, she is a faculty member in the Department of Management Information
Systems, University of Haifa, Israel, working on improving information systems development processes in
various modeling languages (including UML, OPM, XP, etc.).
Prof. Dov Dori is Head of the Information Systems Engineering Area at the Faculty of Industrial Engineering
and Management, Technion, Israel Institute of Technology, and Research Affiliate at MIT, Cambridge, MA.
Between 1999 – 2001 he was Visiting Faculty at MIT’s Engineering Systems Division and Sloan School of
Management. Dov Dori received his B.Sc. in Industrial Engineering and Management from the Technion in
1975, M.Sc. in Operations Research from Tel Aviv University in 1981, and Ph.D. in Computer Science from
Weizmann Institute of Science, Rehovot, Israel, in 1988. Dov Dori is on the Editorial Board of the International
Journal of Web Engineering Technologies (IJWET) and International Journal of Pattern Recognition and
Artificial Intelligence (IJPRAI). He was Associate Editor of IEEE Transaction on Pattern Analysis and
Machine Intelligence (T-PAMI) and International Journal of Document Analysis and Recognition (IJDAR).
Dov Dori is co-editor of three books, author of over 90 journal papers and book chapters, and 70 conference
publications. He is Fellow of the International Association for Pattern Recognition (IAPR), Senior Member of
IEEE, and Member of IEEE Computer Society and ACM.
OPM VS. UML 79