Embed Size (px)
Citation preview
Opportunities and Barriers in Madison, Wisconsin: Understanding Process Energy Use in a Large Municipal Water Utility
Scott Olsen, Madison Gas and Electric Company
Alan Larson, Madison Water Utility
ABSTRACT Madison Water Utility (MWU) is taking the first steps in an on-going energy-
efficiency project in the interest of reducing operating costs and upgrading its pumping facilities.
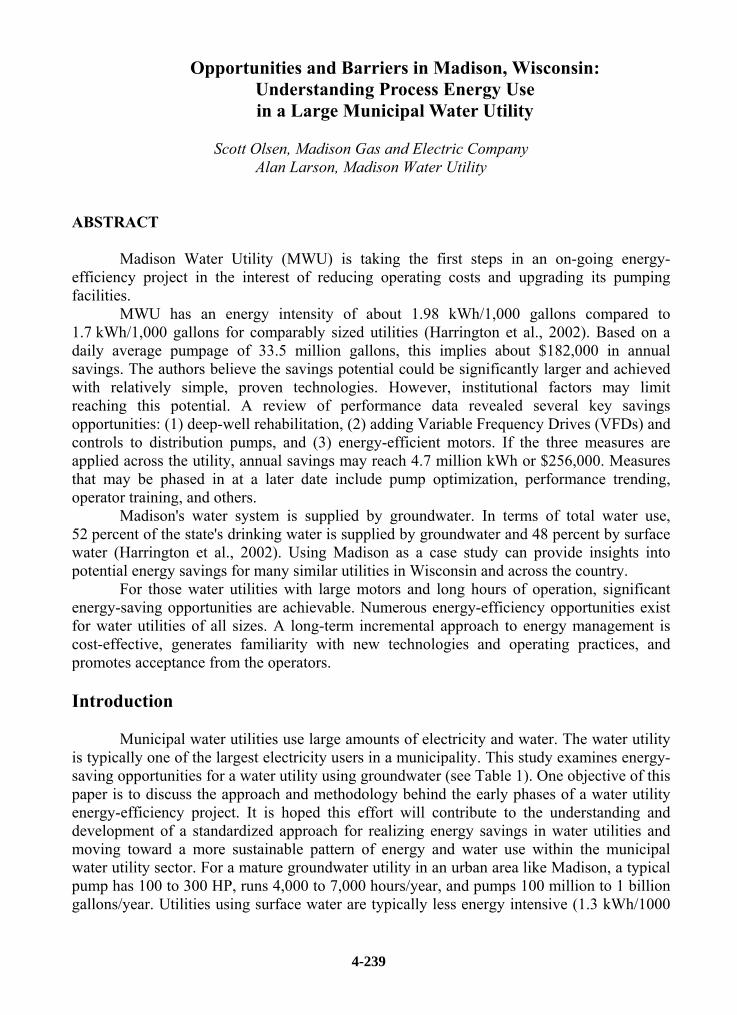
MWU has an energy intensity of about 1.98 kWh/1,000 gallons compared to 1.7 kWh/1,000 gallons for comparably sized utilities (Harrington et al., 2002). Based on a daily average pumpage of 33.5 million gallons, this implies about $182,000 in annual savings. The authors believe the savings potential could be significantly larger and achieved with relatively simple, proven technologies. However, institutional factors may limit reaching this potential. A review of performance data revealed several key savings opportunities: (1) deep-well rehabilitation, (2) adding Variable Frequency Drives (VFDs) and controls to distribution pumps, and (3) energy-efficient motors. If the three measures are applied across the utility, annual savings may reach 4.7 million kWh or $256,000. Measures that may be phased in at a later date include pump optimization, performance trending, operator training, and others.
Madison's water system is supplied by groundwater. In terms of total water use, 52 percent of the state's drinking water is supplied by groundwater and 48 percent by surface water (Harrington et al., 2002). Using Madison as a case study can provide insights into potential energy savings for many similar utilities in Wisconsin and across the country.
For those water utilities with large motors and long hours of operation, significant energy-saving opportunities are achievable. Numerous energy-efficiency opportunities exist for water utilities of all sizes. A long-term incremental approach to energy management is cost-effective, generates familiarity with new technologies and operating practices, and promotes acceptance from the operators.
Introduction
Municipal water utilities use large amounts of electricity and water. The water utility is typically one of the largest electricity users in a municipality. This study examines energy-saving opportunities for a water utility using groundwater (see Table 1). One objective of this paper is to discuss the approach and methodology behind the early phases of a water utility energy-efficiency project. It is hoped this effort will contribute to the understanding and development of a standardized approach for realizing energy savings in water utilities and moving toward a more sustainable pattern of energy and water use within the municipal water utility sector. For a mature groundwater utility in an urban area like Madison, a typical pump has 100 to 300 HP, runs 4,000 to 7,000 hours/year, and pumps 100 million to 1 billion gallons/year. Utilities using surface water are typically less energy intensive (1.3 kWh/1000
4-239
gal vs. 1.7 kWh/1000 gal) than groundwater utilities. For surface water utilities, energy use is shifted from pumping to electrically driven treatment technologies.
MWU uses groundwater, is a Class AB utility, is the largest class in Wisconsin (class AB utilities serve more than 4,000 customers), and pumps 33.5 million gallons/day. For a Class AB utility using groundwater, the normalized median energy intensity is 1.70 kWh/1,000 gallons. MWU has an energy intensity of 1.98 kWh/1,000 gallons. Reaching the median energy intensity would save about $170,000/year. However, this analysis indicates that savings of up to 4.7 million kWh or $250,000/year are possible for MWU. This yields an energy intensity of about 1.6 kWh/1,000 gallons.
Table 1. Tabular Summary
Project Support and Barriers
Two elements were necessary to move the project forward: (1) a good relationship
between the service provider Madison Gas and Electric Company (MGE) and the facility staff and (2) and an internal project champion.
MGE proposed an energy-efficiency project to MWU focusing on process pumping. The first step was to provide examples of the benefits of energy efficiency and to understand the design and operation of the pumping system. Wisconsin�s Focus on Energy's (FOE) Water and Wastewater Program offered incentives for energy savings in this sector. For this project, FOE participated in the technical review meetings, reviewed the analysis, and provided $3,700 (19 percent) of the energy-efficient motor upgrade and is expected to provide at least $8,000 (8 percent) of the VFD project. MWU hired a consulting engineer to design and specify the initial phase of the project, with both MWU and outside contractors performing the installation.
By working with both the principal engineer and organized staff, project resistance and skepticism were minimized. In addition, involving all essential staff groups provided essential understanding of the design and operation of the system. For example, the operators
Tabular Summary Madison Water Utility Energy Economics
Savings Savings Estimated Simple CO2 SO2 NOxNum. Item kWh $ Cost Payback lbs. lbs. lbs.
Energy Efficiency Measure 1 Rehabilitate Wells - Example of Well 18 333,519 $20,345 $95,000 4.7 540,301 3,068 1,7682 VFDs & Controls Booster Pumps 13 & 18 - TBI 275,689 $16,817 $103,220 6.1 446,616 2,536 1,4613 Energy Efficient Motor - Deep Well 20 - TBI 80,916 $4,936 $19,500 4.0 131,084 744 4294 Variable Speed Deep Well Pumping- Typical 150 HP well 54,900 $3,349 $40,000 11.9 88,938 505 2915 Pump Optimization na na na na6 Low Flow Pumping na na na na7 Water Loss Minimization na na na na
Operations & Maintenance Measure1 Off-Peak Pumping Pumps 16&26, 10&12&20, 19&24 347,060 $21,171 $2,000 0.1 562,237 3,193 1,8392 Pump Prioritization - 12 over 20 & 19 over 27 359,462 $21,927 $2,000 0.1 582,328 3,307 1,9053 Data Collection & Trending na na na na4 Training na na na na
TBI = To Be Implemented - in initial phaseEnergy savings based on $0.061/kWh
Environmental Savings
4-240

provided input on which deep-well pumps could be used more based on seasonal requirements, capacity of storage tanks, and well condition.
Installing new equipment at all the wells and rehabilitating all the wells at one time was considered to be a large, difficult-to-manage project. The managers and operators wanted to become familiar with the procurement, installation, and operation of the new technology and to understand any potential problems early in the process. Phasing or staging projects through an incremental approach provided everyone the time to become familiar with the issues.
System Structure
The following describes the structure of the MWU groundwater pumping system.
There are 23 operating unit wells and six independent booster pumping stations operating in a distributed supply system. These wells feed into 11 pressure zones around the city. All pressure zones operate independently, and essentially no water is transferred from zone to zone. A typical unit-well configuration includes a single turbine pump drawing from a deep well into a ground-level reservoir and one or two booster pumps piped in parallel pumping from the reservoir into the distribution system (see Figure 1). The ground-level reservoirs range in volume from 40,000 gallons to 4.2 million gallons with 150,000- to 300,000-gallon tanks being typical. Deep-well pumps can fill the reservoirs in two to 37 hours. The deep-well pumps operate automatically to maintain water levels in the reservoirs. The unit-well booster pumps are manually scheduled by an around-the-clock operator. With the exception of one small VFD, the pumps are at a constant speed.
Figure 1. Typical Unit Well Schematic
4-241

Typical well sensors or control points include water-table level, reservoir level, distribution pump pressure, and distribution pump flow. Field software at each unit well provides input/output operation to the control center. The operators use the status information to schedule pumps. Except for one unit well, there are no Programmable Logic Controllers (PLCs) at the wells and no PLCs at the operators' monitoring stations.
Utility Organizational Structure
In Wisconsin, water rates are reviewed and approved by the Public Service
Commission of Wisconsin. In addition, an independent board of directors governs MWU. The board reports to the City Council and Mayor, but the City has no financial connection to the water utility. In other jurisdictions, the city or county, which may be in need of funds, is the controlling body. To raise funds for capital improvements, the water utility issues bonds. This organizational structure, combined with a history of holding costs down, has given MWU a good bond rating (AA1 as of February 2003) and a low cost of capital to date.
The management of the water utility includes the director and senior staff, including engineers. Nonmanagement staff are organized City employees. Management has recently introduced a more proactive approach to capital improvements and maintenance practices. This promotes sustainability in the sense that operating costs, both economic and environmental, will be lower than they would have been with a system that was not maintained as well.
Key Savings Opportunities
Background
Savings opportunities were identified through a series of meetings with the staff at
MWU and subsequent analysis. This approach was taken to learn the details of the pumping system, explain the benefits of energy efficiency, and obtain staff acceptance of potential changes. Energy-saving opportunities were filtered through several criteria established by the water utility: a simple payback in the five- to eight-year range, savings needed to be substantial and easily measured, and the selected projects needed to demonstrate the merits of individual energy-efficiency technologies and practices (i.e., single technologies were installed at individual wells). Key Opportunities
VFDs and digital controls on distribution pumps. MWU uses booster pumps on the downstream side of the ground-level storage tanks to provide the necessary pressure for the system and to move the water horizontally as the hydraulics of the piping system allow (see Figure 1). For wells with two or three pumps, the smallest pump is used most of the time with the larger pumps being used only during peak demand periods (typically June, July, and August).
The distribution pumps selected for this analysis were based on unit-well efficiency, annual use of the well, and well-specific operating constraints. Unit-well efficiencies (gallons/kWh) were compiled for all unit wells. Because efficiency data is available for an
4-242

entire unit well, unit-well efficiency was used as a proxy for selecting potential booster pumps for VFDs. Booster pumps were ranked by percent of annual use and were considered for analysis if the unit wells ranked in the upper two-thirds in efficiency.
The booster pumps are manually switched on and off to maintain diverse system pressures. Pressure sensors downstream of the booster pumps relay information on system conditions to the operators at MWU�s Operations Center. The local system pressure data is used by the operators to select the best pumps for the day's demand. Pump selection is based on operator experience.
Adding a VFD to the booster pump will allow the pump horsepower to move up and down in response to the system water demand. As demand for water from the area varies, a pressure sensor will reflect an associated change in pressure. The system's pressure is inversely proportional to the demand for water. By adding a VFD with feedback from a pressure sensor and PLC, the energy of the pump will be much more closely matched to what is actually required (Lewis and Candello, 1998). Savings from VFDs can accrue in two ways. First, pressure sensor-based controls will ramp the pump speed up and down to maintain the programmed pressure set point. Second, the booster pump pressure set point can be set lower during noncritical periods through system-wide analysis or through experimentation. Savings are based on reduced head pressure (excluding the three summer months). During the summer months, it is assumed the pumps will operate at full speed.
Savings were calculated for two distribution pumps. Savings are based on a reduction of up to 20 psig in system pressure. One pump shows savings in the range of $5,400 annually, another shows an $8,800 annual savings. Material and installation costs need to be more closely determined but are expected to be in the range of $50,000 per pump station yielding 5.7- to 9.3-year simple paybacks. Installing VFDs at older wells required a review and upgrade of the wiring, breakers, overload protection, starters, and motors. Typical large motors are part-winding or dual-voltage motors. In this case, the windings were tied together, a soft-start motor starter was added for backup control, and the motor was not replaced when coupled to a VFD.
Based on the regular fluctuations of load on the booster pumps, it is quite likely that adding VFDs to the majority of the booster pumps in the system would be beneficial to the overall system's energy use and system stability. However, for this analysis, only the pumps with the greatest energy-saving potential and lowest impact on current operating practices were selected. Well rehabilitation. Deep wells may lose capacity and perform less efficiently (increased drawdown and pump energy use) over a period of years. Well deterioration and pump-efficiency degradation can result from sand infill, organic coatings on the sides of the borehole that reduces flow from the aquifer, and wear on the turbine pump impellers and bowls. Wells are typically rehabilitated on prescribed schedules (every five to ten years) or based on budgetary limits.
The benefit of well rehabilitation was examined by studying water and electric utility records for three wells that were previously rehabilitated. Pre- and post-well water table drawdown, hours of operation, and electric use were compared for these wells.
The geology of the Madison region is a limestone or sandstone stratum that can crumble over time generating loose sand. As sand fills the borehole, well performance decreases. To regain pump capacity and increase well efficiency, wells are periodically
4-243

rehabilitated. Typical treatments encompass removing sand that has fallen into the well during regular operation or from the rehabilitation process itself and adding chemicals or air bursting a well to remove organic coatings on the borehole that improve flow. Improving the flow of water into a well reduces the head or lift the pump needs to overcome and reduces water-table drawdown. The nonlinear relationship between head and power provides a significant economic and environmental incentive for optimally timing well rehabilitation. According to the pump affinity rules, if head is reduced by 25 percent, power is reduced by 35 percent, a 1:1.4 ratio.
Small amounts of sand are often pumped in addition to water. This can cause significant erosion and even holes in the turbine pump impeller and bowls. The wear reduces the amount of water that can be pumped, increases the energy required to lift a given volume of water, and reduces pump efficiency.
For an example of well rehabilitation, consider Well 18. Well 18 was acid treated to remove a film blocking flow into the well. The relatively flat pump curve for this specific well shows the pump had moved off its design point with head increasing by about 70 feet. Based on the pump curve, savings would have been around 25 HP. This converts to about 13,000 kWh or $702/month or $8,400/year. Although the pump curves are relatively flat, significant energy savings are possible due to large motors and long hours of operation.
A review of both electric utility data and water utility data shows actual average monthly energy savings are larger than that predicted by the change of head. Total savings are in the range of 39,000 kWh or $2,100/month. This is about 26,000 kWh or $1,400/month greater than the pump curve predicts. Records show for the same period that total pumping volume remained the same but was done with a reduction of 175 hours/month, on average, in relation to the previous period. For a full year, total savings were 468,000 kWh or $25,000. For a ten-year period, total savings would be $250,000 for a single well.
During well rehabilitation, it is typical to examine and repair turbines and bowls. The remainder of the monthly savings ($1,400) most likely originated from replacing worn turbines and bowls on the pump. Overhauling a turbine pump can be expensive as it entails pulling the 200- to 300-foot shaft out of the well, but savings can be large as well. Water utilities with deep wells have the potential to significantly impact energy use and move toward more sustainable operations by developing a performance-based rehabilitation plan rather than using a time- or budget-based schedule. Energy-efficient motors. The largest and oldest motors in the system serve the deep-well pumps. While energy-efficient motors also make sense for the distribution pumps, it is more likely distribution pumps will eventually receive VFDs for more precise pressure control. From an energy-saving perspective, adding a VFD alone is usually the most cost-efficient improvement option; adding a high-efficiency motor as well will yield only a marginal improvement gain over the VFD alone. Since developing a familiarity with the technologies was one of the goals of this effort, upgrading a deep-well pump with a new premium efficiency motor and distribution pump(s) with a VFD(s) made the most sense.
Motor savings were based on engineering estimates and the "Motor Master" software. Electrical readings were taken at several pumps to understand typical motor loading values and kW demand in relation to design values.
One of the largest motors in the system is the 300-HP, deep-well pump motor at Well 20. This well was constructed in 1973 and is currently being rehabilitated. The existing
4-244

efficiency is estimated at 89.2 percent and the new motor at 95.9 percent. Based on water utility run logs, Motor Master predicts annual energy savings for this motor of 81,000 kWh. The project is expected to be performed in-house and cost $29,500 yielding a payback of four years.
Off-peak pumping. The larger unit wells have existing time-of-use electric rates. These rates have a lower kW and kWh charge during off-peak periods (9 p.m. to 10 a.m., Monday through Friday and all day Saturday and Sunday). By operating the pumps as much as possible during off-peak hours, the water utility can benefit from lower energy rates. While these rates are in place now, they are not taken advantage of. Earth Tech, Inc., analyzed off-peak pumping for MWU in its Water System Master Planning Study (Earth Tech, Inc., 1999). This report examined the capacity of the water system to serve present and future needs and make infrastructure improvement recommendations. In addition, the analysis looks at two energy-saving options: off-peak pumping and the benefits of adding storage reservoirs to enhance off-peak pumping. The benefit of the Master Planning Study is the system hydraulic model coupled with the electric rates of MGE. While the system-wide hydraulic model is valuable for system-wide pumping analysis, many of the key energy-efficiency measures noted in this report did not require this level of evaluation. A system-wide pumping model would be valuable for understanding the interaction of adding numerous VFDs to the system, piping changes, and other system-wide pressure and flow-related analysis. The following discusses the energy-efficiency analysis of the Earth Tech, Inc., report.
The goal of the scenarios in the model was to operate the deep well and distribution pumps as much as possible during off-peak periods without compromising service. One million gallons of a 4-million-gallon reservoir was used during peak periods to help shift pumping to off-peak periods. Estimated savings based on maintaining the pumping strategy during weekdays for six months per year are 174,200 kWh or $8,710 annually. A review of the Earth Tech, Inc., report identifies that unit wells with existing large storage reservoirs have the potential for economic savings from utility rate-defined off-peak pumping. Savings would accrue from both lower kW and kWh charges.
Relative station efficiency and pump prioritization. Data, in terms of kWh/1,000 gallons pumped, shows there may be potential in operating certain wells more and corresponding wells less to take advantage of their higher efficiencies. While some wells appear to have the potential for increased use with a lower cost, site-specific operating and hydraulic constraints within the system need to be closely examined.
Well 20 is used as an example. Well 20 has one of the lowest efficiencies of all the wells in the system, has no distribution pumps (gravity provides the needed head), and has a 4-million-gallon storage tank. Well 20 is one of the deepest wells which contributes to its inefficiency. Well 12 is located a few miles away, has much better unit-well efficiency, and is piped to Well 20. The approach for attaining energy savings is to increase the use of Well 12 to fill the storage tank at Well 20. Data shows that Well 12 has enough capacity during all months to displace pumping at Well 20. The savings for operating Well 12 over Well 20, excluding the summer months, is predicted to be 214,476 kWh/year or $10,724/year.
4-245

Future Options
The following options were reviewed but will be considered for implementation at a later date. Most of these options are expected to be feasible but may require additional research, review, and acceptance by internal groups prior to implementation.
Data collection and performance indicator trending. One of the most cost-effective methods of achieving increased energy efficiency, reduced emissions, and enhanced sustainability is early identification of inefficient processes. This identification can be achieved most effectively with performance data that is as accurate as possible and is monitored over time. Monitoring data over time provides an indication of change from the existing or baseline condition. Current baseline conditions may need to be determined through in-situ testing. The following offers suggestions on defining best practices for data collection for a water utility.
• Form an internal work group to review the performance indicator data collection
process. This step may reveal assumptions behind existing data collection procedures and calculations as well as provide a forum for learning the value of data collection.
• Develop a common electronic format for recording data. Using an electronic format will provide historical data that is easily compared to current data and make data manipulation relatively easy. A spreadsheet may be the best option.
• Automate data collection and digital metering as much as possible. Automating data collection through metering and recording reduces error and inconsistencies due to manual recording and varying data collection intervals. If necessary, adding separate electric meters for large pumps will provide performance data on individual pumps. This is recommended for 75 HP and larger pumps.
Training. To better assess the condition of data collection, trending, and how those indicators are used to address performance, a group with a state- or region-wide focus could use surveys or work with trade associations to assess the need for and develop training options. Some training areas that may require additional research are understanding the extent of automated controls in municipal water utilities, how and if collected performance data is used for tracking performance, and how and if the collected performance data is used for planning maintenance and technology improvements. Operators play a significant role in the efficient operation of a water utility. The more exposure operators have to innovative technologies and operating practices, the more likely new projects will be installed, and project savings are maintained.
VFDs on deep-well pumps. The deep-well turbine pumps raise water from the aquifer to the ground-level reservoirs. Total well depth ranges from 700 to 1,000 feet with the pump typically set 200 to 300 feet below ground level. The fixed turbine depth, fixed speed, and fixed discharge level means the pump works against a fixed head or pressure. When active, the turbine pumps draw down the local water table in a cone shape toward the turbine. Typical drawdown head can be 100 to 200 feet below the natural groundwater table level. Total pump head is the combination of the water table level, drawdown, reservoir discharge
4-246

level, and dynamic head or friction loss in the piping. The majority of the pump head is the static head or feet the water must be lifted.
Engineering fundamentals show moderate support for adding a VFD to a deep-well pump. Another reason for using a VFD is that it may be a better choice over impeller trimming if pump capacity needs to be changed on a seasonal basis or is expected to increase in a only few years. In addition, if the deep wells tend to fill in with sand on a regular basis, a VFD will allow the speed of the pump to be altered to match the changing head of the well. For this first project, MWU operators wanted to get more experience with VFDs before installing them on deep wells.
Additional analysis may need to be performed before adding a VFD to a vertical turbine pump. A natural frequency vibration analysis should be performed on the system. If damaging harmonics are discovered, one option is to program the VFD not to operate at those speeds.
Pump optimization. Many pumps in municipal wells are designed larger than needed to allow for future growth. Sometimes that growth never materializes or is 20 years away. Pump optimization entails taking field measurements of the flow, head, and kW of a specific pump and comparing the measured variables to the required or design flow, head, and kW. If the actual or measured variables are significantly larger than what is required, altering the pump to match the required flow can save significant amounts of money and energy and also minimize associated air emissions.
In water utilities using groundwater, the pumps with the most potential for saving energy are the deep-well pumps. Deep-well pumps are generally larger and operate longer than the distribution pumps.
A typical option for energy savings in pumps is impeller trimming. For multistage turbine pumps, stages can be removed, turbines can be trimmed, or a combination of both can be done. Turbine pump performance optimization is more involved than for typical centrifugal pumps and needs to be carefully planned and priced to verify effectiveness.
Low-flow pumping. Low-flow pumping entails pumping a given volume of water over a longer period than is currently done. This approach can lower pipe friction (head) thereby reducing pumping costs. While total hours of operation increase, energy savings can be attained due to lower power use. Methods to achieve low-flow pumping include reducing motor size and adding VFDs.
Water leaks. In Wisconsin, typical water utility water loss is in the five percent to 10 percent range. If a utility is losing 15 percent or more, the state regulating body looks into the situation. The �loss� may be due to leaks in the distribution system or could be inaccurate metering. Identifying and controlling leakage saves energy and reduces demand on the water source. New technologies are being developed to assist in leak detection and elimination.
Interzone water transfer. Adding booster pumps and/or increasing pipe size within a zone may allow greater use of the high-efficiency wells. The goal of this option would be to use a relatively small pump to move water horizontally rather than a large deep-well pump. In general, it is much cheaper to move water horizontally than to pump it up from deep underground.
4-247
The existing distribution piping system has some areas where flow may be restricted due to relatively small piping. The distributed supply system of unit wells is based on the concept that each well will serve the area around the well. This type of distribution system works well, but transferring water from well to well is not provided for in the pipe design. Back-of-the-envelope calculations show replacing existing pipe with larger pipe to save energy is not cost effective for the distances (miles) involved.
Adding storage for off-peak pumping. The Earth Tech, Inc., study indicates that adding storage in the main zone for the sole purpose of allowing off-peak pumping is not feasible. The analysis examined adding storage from 3 million to 6 million gallons in 1-million-gallon increments and found savings of $3,000 to $12,000/year with six months/year of operation. These savings do not justify the cost of the relatively large storage reservoirs.
Data Collection and Performance Indicators
Spreadsheet Template
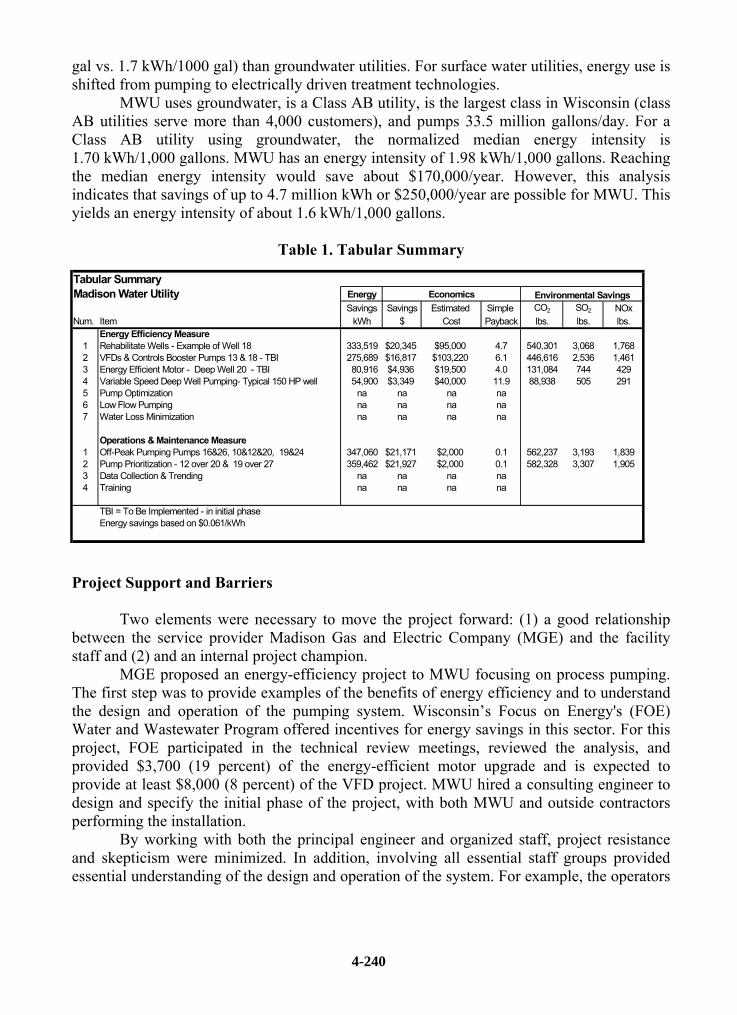
A spreadsheet with sample data is shown in Table 2 that illustrates how deep-well data might be recorded, calculated, and trended. The spreadsheet assumes individual electric meters on each pump. There are three sections on the sheet for each type of pump. This first section is design data, the second section is field-recorded data, and the third section is calculated data or performance indicators. The following describes column headings for the monthly data:
Table 2. Well Data and Trending
Well Data & Trendingsample data
Deep Well Calculated Datarun spot total spot pump level additional total head
flow head time flow use kW total flow draw down well head head differential Motor Performance Spec Cap Spotgpm feet hours gpm kWh kW gallons feet feet feet feet HP Gal/kWh gpm/ft WtW Eff
Jan 1800 175 542 1700 85,000 93 42,000,000 130 60 190 15 125 494.1 13.1 65%Feb 1800 175 498 1700 84,800 93 42,000,000 130 60 190 15 125 495.3 13.1 65%Mar 1800 175 472 1700 84,600 94 42,000,000 133 60 193 18 126 496.5 12.8 66%Apr 1800 175 462 1700 84,500 93 42,000,000 130 60 190 15 125 497.0 13.1 65%May 1800 175 524 1700 84,900 98 41,500,000 135 60 195 20 131 488.8 12.6 64%Jun 1800 175 623 1700 87,400 99 43,000,000 138 60 198 23 133 492.0 12.3 64%Jul 1800 175 658 1700 87,600 102 43,200,000 145 60 205 30 137 493.2 11.7 64%Aug 1800 175 616 1700 87,300 104 42,000,000 146 60 206 31 139 481.1 11.6 63%Sep 1800 175 547 1678 85,200 105 39,800,000 144 60 204 29 141 467.1 11.7 61%Oct 1800 175 569 1688 85,600 106 38,500,000 146 60 206 31 142 449.8 11.6 62%Nov 1800 175 485 1699 85,300 108 38,200,000 147 60 207 32 145 447.8 11.6 61%Dec 1800 175 462 1654 84,200 109 37,000,000 149 60 209 34 146 439.4 11.1 60%
Total 6458 1026400 491,200,000
Well Design Data Deep Well Field Collected Data
Deep Well Indicators
410.0420.0430.0440.0450.0460.0470.0480.0490.0500.0510.0
Jan Feb Mar Apr May Jun Jul Aug Sep Oct Nov Dec
Gal
/kW
h
56%57%58%59%60%61%62%63%64%65%66%67%
Pum
p Ef
ficie
ncy
Gal/kWh
WtW Eff
4-248

1. Design Data - Determine and record the design conditions for each pump at each unit well. This should include flow in gpm and head in feet. Additional data will be compared to this baseline data. Verify this is the optimum operating condition for the specific pump. Possible data sources include pump curves and one-time field measurements.
2. Field-Collected Data - Flow in gpm and power in kW are spot or instantaneous values. While instantaneous values are required, they need to represent typical conditions for the well. Drawdown and additional head are also spot data that represent typical conditions. The data collected for operating hours, kWh, and total gallons need to be the totals for the period, in this case a month. It is recommended that each pump (75 HP and greater) have individual electric meters. Current transducers are relatively inexpensive, easy to install, and should be considered for each pump. If no individual electric meters are installed on each pump motor, either record electric use from utility electric meters or record the data provided from the monthly electric utility bill. Measure and record pump head for all pumps. Track run hours of the pumps as well.
3. Performance Indicators - Use the field-collected data to calculate performance indicators including well drawdown, pump HP, gallons/kWh, gpm/feet, and pump efficiency. Consider plotting the performance indicators on a graph every month to visually identify any changes from the baseline.
Conclusion
There are so many energy-saving opportunities in a large freshwater facility that a
long-term incremental efficiency management effort is necessary and will more than pay for itself. Significant cost-effective energy savings in municipal water utilities are available in those utilities with large motors and long run hours. Nevertheless, water utilities of all sizes have the potential for numerous savings opportunities. Matching pump output to water demand with a VFD and controls is one of the most promising technologies. Consider a multiphased approach with straightforward technology upgrades in the first phase and system-wide performance enhancements in a later phase. Developing reliable performance data is also necessary to determine energy savings and to identify inefficient processes.
New technologies need to be embraced by the operators to generate and maintain the savings. A long-term incremental approach to energy management will generate familiarity with the various technologies and operating practices as well as promote acceptance from the operators.
References
Harrington, G.W., T. Elliott, B. Zeier, and I. Xagoraraki. 2002. �Energy Use at Wisconsin�s
Drinking Water Utilities,� University of Wisconsin-Madison, p. 24. Ibid, p. 15. Earth Tech, Inc., 1999, Madison Water Utility, Water System Master Planning Study,
pp. 8.1-8.4.
4-249

Lewis, B. W., and M. R. Candello. 1998, �Variable Frequency Drive (VFD) Technology is Here and It Works: A Comparison of Prevailing Control Technologies,� The Journal of New England Water and Wastewater Association, September 1998, p. 227.
4-250